Article

Integrated Assessment of the Runoff and Heat Mitigation Effects of Vegetation in an Urban Residential Area

by
Xi Wu
1,2,
Qing Chang
1,2,3,*,
So Kazama
3,
Yoshiya Touge
4 and
Shunsuke Aita
3
1
School of Urban Construction, Wuhan University of Science and Technology, Wuhan 430065, China
2
Hubei Provincial Engineering Research Center of Urban Regeneration, Wuhan University of Science and Technology, Wuhan 430065, China
3
Department of Civil and Environmental Engineering, Tohoku University, Sendai 980-8579, Japan
4
Disaster Prevention Research Institute, Kyoto University, Gokasho, Uji 611-0011, Japan
*
Author to whom correspondence should be addressed.
Sustainability 2024, 16(12), 5201; https://doi.org/10.3390/su16125201
Submission received: 29 May 2024 / Revised: 7 June 2024 / Accepted: 14 June 2024 / Published: 19 June 2024
(This article belongs to the Section Sustainable Urban and Rural Development)

Abstract

:
Urban vegetation has an essential role in maintaining the hydrological and energy balance. These processes in urban areas have been long overlooked due to the fragmentation and uneven feature of land use and vegetation distribution. Recent advances in remote sensing and the ease of data acquisition have allowed a more precise mapping of vegetation and land cover, making it possible to simulate the above processes at micro scales. This research selects a small typical residential catchment in Japan as the study area and the purpose of this research is to investigate the impact of urban vegetation on mitigating urban runoff and the heat island effect. The remote-sensed Normalized Difference Vegetation Index (NDVI) data were used to represent vegetation spatial distribution and seasonal variation. A single layer canopy model and the Storm Water Management Model were coupled to simulate interception, evapotranspiration, and runoff generation processes. The effects of vegetation amount and landscape patterns on the above processes were also considered. The results showed that the coupled model had a satisfactory performance in the modeling of these processes. When the vegetation amount was set to 1.4 times its original value, the summer total runoff had a 10.7% reduction and the average surface temperature had a 2.5 °C reduction. While the vegetation amount was 0.8 times its original value, the total runoff increased by 6%, and the average surface temperature in summer increased by 1.5 °C. The combination of green roof and dense street trees showed the best mitigation performance among the different landscape patterns. The results of this study could be used as a reference for future green infrastructure development in areas with similar climate and vegetation characteristics.

1. Introduction

Worldwide, urbanization is an ongoing, irresistible, and irreversible process, and 55% of the world’s population now live in urban areas; this number will reach 68% by 2050 [1]. Urbanization has also caused environmental drawbacks or problems on meteorological, hydrological, ecological, or other aspects. The original geomorphology of an area is greatly altered during urban development. A common situation is that large proportions of previously permeable surfaces become impervious [2]. The natural water systems either disappear or are replaced by artificial water drainage systems. These changes reduce runoff infiltration, increase the amount of runoff, and shorten the general catchment response time to rainfall, which may cause severe flood events or non-point source pollution in urban areas.
The urban heat island (UHI) effect, defined as the temperature in urban areas being higher than that in the surrounding suburbs, is another urban issue caused by urbanization [3,4,5]. The climate of the surrounding areas can also be affected by the heat island effect, and air movement caused by a temperature gradient can enhance the extent of air pollution. There are several causes of UHIs, as follows: dark surfaces absorbing significantly more solar radiation than lighter-colored surfaces [6]; evapotranspiration being lower (for example, through the lack of vegetation) in urban areas than elsewhere [7]; geometric changes in urban areas, such as the construction of tall buildings within many urban areas, providing multiple surfaces for the reflection and absorption of sunlight; and waste heat from automobiles, air conditioning, industry, etc., also contribute to the UHI effect [8].
Urban vegetation is one possible method to mitigate the drawbacks caused by urbanization. In the hydrological field, several concepts have been put forward in recent decades to mitigate urban runoff and environmental issues, including low impact development (LID) sponge cities, or green infrastructure (GI). Although they differ in their details, these concepts all emphasize vegetation or greening in urban areas, because urban vegetation can usually increase interception, infiltration, or storage, and thus reduce runoff. Regarding UHI mitigations, urban vegetation also plays an important role. Previous studies have proven that urban vegetation can strengthen interception and evapotranspiration, and thus, the latent heat (LE) will increase and the sensible heat (H) will decrease, finally reducing the heat island effect [9,10]. Shashua-Bar et al. [11] discussed the tree transpiration cooling effect in arid and temperate climates by continuously measuring tree sap flux density and soil water content, and found that latent heat dissipation is 40% less in hot arid climates than in temperate climates.
Many studies have proven the effectiveness of runoff reduction and heat mitigation via urban vegetation. Inkiläinen et al. [12] measured interception in urban forests and found that interception accounted for 9~24% of the gross rainfall in the study area. Zabret et al. [13] discussed the impacts of meteorological variables (rainfall intensity/amount and wind speed and direction) on rainfall interception partitioning for urban trees. The authors found that precipitation is the most influential factor, while wind direction has no significant influence. P. Ramamurthy et al. [14] studied urban evaporation in impervious areas. The results show that evaporation from impervious surfaces is discontinuous and intermittent but overall, it consumes 18% of the total latent heat fluxes during a wet period and thus has a significant impact on urban surface energy balance. Gonzalez-Sosa et al. [15] proposed a methodology to assess the eco-hydrological values of isolated trees located along streets and avenues. The results show that street trees lead to a reduction in overland flow on impervious surfaces by 10–20%, and the peak delay is estimated to be 10–15 min. Gillner et al. [16] investigated the effects of street trees on mitigating heat and drought in highly enclosed urban areas by continuously monitoring different microclimate indices. The results show that the leaf area density and the rate of transpiration are suitable to explain the reductions in air temperature. Different tree species may have very different reduction abilities. However, in urban areas, the spatial distribution of each land use classification is usually sporadic and chaotic. The spreading feature of vegetation is also often irregular and fragmented. This irregularity makes it difficult to properly extrapolate the results of the above measurement-based studies to wider ranges or to other sites. It is also difficult for simulation-based research to accurately quantify the exact vegetation amount.
The advances in remote sensing technology, especially the extensive use of NDVI data, has alleviated the above problems. In recent years, NDVI had been used and has proven to be valuable in many studies on urban vegetation or heat islands. Nourani et al. [17] used NDVI data to identify the land cover type and studied the effect of land use differences on the catchment hydrological performance. Das et al. [18] used NDVI to represent the spatial location of green spaces and to calculate emissivity in an urbanized area. Chen et al. [10] utilized NDVI to calculate ground heat flux and proved NDVI to be one of the most correlative predictors for urban evapotranspiration simulation. In the hydrological field, NDVI is often used as an important indirect parameter to obtain other vegetation parameters such as LAI or maximum interception capacity. It is also usually used to obtain vegetation coverage fraction or vegetation amount parameters in urban areas.
The abovementioned studies have largely improved the understanding of the vegetation interception process and the mitigation mechanisms of UHI effects. Interception, evapotranspiration, and latent heat flux are connected and simultaneous, but few studies have explored the above process at the same time or include the coupled simulation of water balance and energy budget. Studies focusing on hydrological processes usually only discuss the runoff reduction without considering the interception capacity restoration (urban ET). Generally, UHI studies include ET processes, but often do not consider the water balance on ground surface or in the soil, which are both involved in ET processes.
This study has proposed an integrated modeling method by coupling a single layer canopy model [19] and a hydrological model. The interception and evaporation by vegetation and ground surfaces were explicitly simulated. The results of the modeling could evaluate the role of vegetation in runoff and heat mitigation in an urbanized watershed in Japan, or support decision making in urban planning and future construction. The targets include (1) modeling the urban vegetation effect in water and energy balance, and (2) comparing the effectiveness and rationality of possible greening strategies.

2. Materials and Methods

2.1. Study Site Description

Sendai City (38°16′5.6″ N 140°52′9.9″ E) belongs to the Tohoku region of Japan and is the capital of Miyagi Prefecture. Sendai has a subtropical monsoon climate that is cool and humid. The average annual temperature is 12.1 °C and precipitation is 1241.8 mm. The hottest month, August, has an average temperature of 24.1 °C, while the coldest month, January, has an average temperature of 1.5 °C. The terrain is low and flat in the southeast, and hilly in the west and north. Since the Edo period, various forestation policies had been actively promoted. Also, thanks to its suitable geographical environment and climate, the city and surrounding areas have a high percentage of vegetation coverage, so Sendai is also called Forest City (https://www.city.sendai.jp/koryu/foreignlanguage/en/index.html) (accessed on 6 February 2024). The study area is a typical Japanese residential area named Kunimiga-Oka. It is located in the northwest direction from the center part of Sendai city. The catchment area is around 46 ha. Most of the area is occupied by private residential buildings and courtyards, with several urban parks dotted in. There are also some public green spaces in the area, mainly in the west and south sides. Plants and trees that are grown in these green spaces and parks, beside the roads, and in private gardens constitute the majority of the vegetation in this catchment. There is a high density of roads in the area, which divides the land into many urban parcels. Figure 1 shows the location and detailed land use classification of the study area.

2.2. Data Preparation

The DEM data of the study area (5 × 5 m) were obtained from the Ministry of Land, Infrastructure, Transport and Tourism of Japan (MLIT, https://www.mlit.go.jp/) (accessed on 6 February 2024). Land use and cadastral information were obtained from Sendai City Water Works Bureau and Open Street Map. These data were used for watershed delineation, slope determination, and the identification of land type within sub-catchments.
Rainfall data used in this study have two sources. One is from two tipping bucket rain gauges located in the north and south parts of the area, with resolutions of 0.5 and 0.2 mm, respectively. The other is from the Automated Meteorological Data Acquisition System (AMeDAS), an automatic meteorological observation system that covers the whole of Japan. The closest weather station is Sendai Station, which is 3.7 km away from the study area. The rainfall data recorded at this station have a resolution of 0.5 mm, are collected every 10 min, and are used as supplementary data to generate rainfall time series.
At the pipeline outlet, the discharge flow rate was recorded at 5 min intervals. The water level was continuously observed and the velocity was measured during some rainfall events so that the water level–flow rate relationship was obtained. The location of rain gauge and water level monitor can be referred from precedent study [20]. Meteorological data were obtained from the same metrological station mentioned before. The data include air temperature, wind speed, air pressure, solar irradiation, humidity, vapor pressure, insolation duration, and dew-point temperature, with a temporal resolution of 10 min or 1 h. In the previous study, the land use type of the catchment was identified at a very fine resolution and the hydrological model (SWMM 5.1) was built. Several key parameters (including roughness and depression storage on different land types) of the models were calibrated and verified, and the model showed a satisfactory performance [20].
The Normalized Vegetation Index (NDVI) is very useful for the accurate assessment and description of vegetation conditions and has been proven in many other studies [3,10]. The index is usually calculated as a ratio between red (R) and near-infrared (NIR) values [21], as follows:
NDVI = (NIR − RED)/(NIR + RED)
Such earth observation data of certain spectral band can be obtained from satellite products like Landsat or Sentinel. In this study, the Landsat 8 OLS data were used because for the research time interval, the product was relatively up-to-date. The images of collection 2 level-2 (data processing level L2SP) from 2017 to 2018 were downloaded from the USGS (United States Geological Survey) website (https://espa.cr.usgs.gov/ordering/) (accessed on 6 February 2024). The data are in a mosaic pixel format and have a spatial resolution of 30 m. The images with cloud cover were removed; after that, if several images had too close a time interval, only one image was retained, finally resulting in 17 images (Figure 2). The data used in this study are generalized in Table 1.
The entire catchment was divided into 143 small sub-catchments based on urban cadaster blocks, which were surrounded by roads. The urban hydrological element (UHE) was a concept first discussed by Berthier et al. [22], which refers to the cross-section of an urban cadastral parcel. Subsequently, UHEs became a widely used minimum simulation cell in urban hydrological modeling [23,24,25]. In this study, the previously mentioned 143 sub-catchments acted as UHEs in hydrologic and energy simulations. The interception, ET, infiltration, and surface runoff were calculated in each UHE, and the runoff in the pipe was calculated based on the SWMM algorithm, as before. Since the NDVI data were in the format of spatially distributed pixels, which could not be directly used by the irregular-shaped UHEs, an area-weighted average method was used to calculate the NDVI value of each UHE, as follows:
N D V I U H E i = N D V I j , k     A r e a j , k A r e a j , k
where NDVIUHE-i means the NDVI value of the ith UHE. NDVIj,k and Areaj,k indicate the NDVI value and area overlapped within the UHE of the jth line and kth row of the NDVI data pixels.

2.3. The Single Layer Canopy Model

Rainfall interception, as well as evapotranspiration, modeling was simulated using a single layer canopy model. The model was first discussed by Kazama et al. [19] and was then incorporated in a distributed hydrothermal model with a spatial resolution of 250 m of a small river basin. The robustness of the theory was validated using a series of follow-up studies [26]. The governing equations were as follows:
( 1 r e f ) S + L = σ T e 4 + l E + H
E = ρ β C H U [ q S A T ( T e ) q ]
H = c p ρ C H U [ T e T ]
where ref is albedo; S↓, L↓, lE, and H are solar irradiance, long wave irradiance, latent heat, and sensible heat; σ is the Boltzmann constant; cp is the specific heat of air (=1004 J/kg K); ρ is the density of air (=1.2 kg/m3); CH is the bulk coefficient; U is the wind velocity (m/s); T is the air temperature (°C); Te is the surface temperature (°C); q is the air-specific humidity (kg/kg); qsat is the surface-specific humidity (kg/kg); and l is the latent heat of evaporation (=2.45 × 10⁶ J/kg). The bulk coefficient value is determined to be 0.005, following the previous report [19,26].
For each UHE, Equations (4) and (5) can be substituted into Equation (3), using a successive approximation method (fifth-order Newton–Raphson solver) to obtain the surface temperature, Te. Then, the obtained Te can be substituted into Equation (5) to obtain the evapotranspiration at the current time step. The detailed computation procedure can be seen in previous studies [19,26]. The interception capability of each UHE was derived from its NDVI value using the equations below [19,27]:
L A I = e x p ( N D V I 100 0.1335 0.31 )
S m a x = 0.935 + 0.498 × L A I L A I 2

3. Results

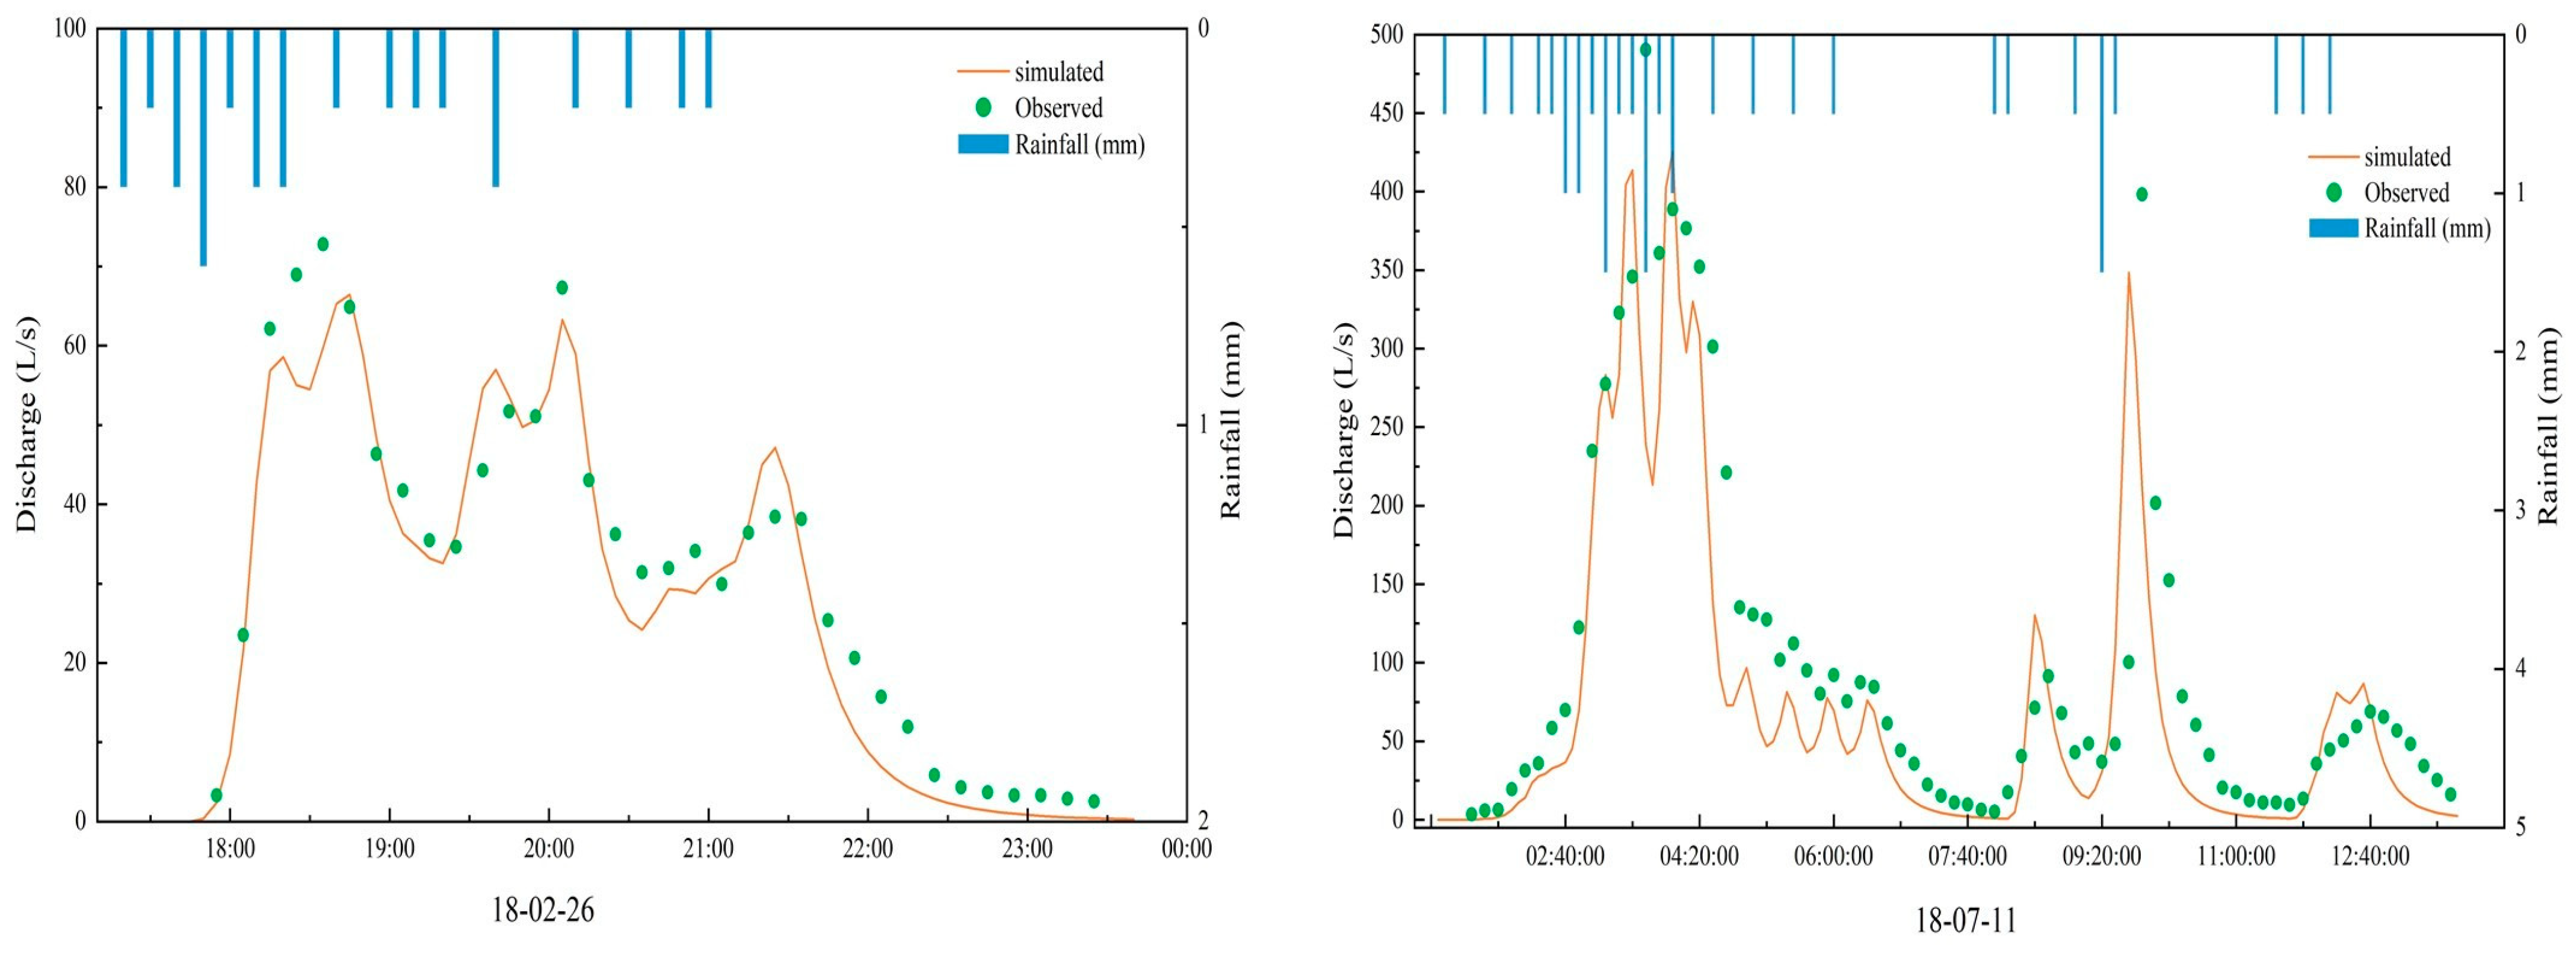
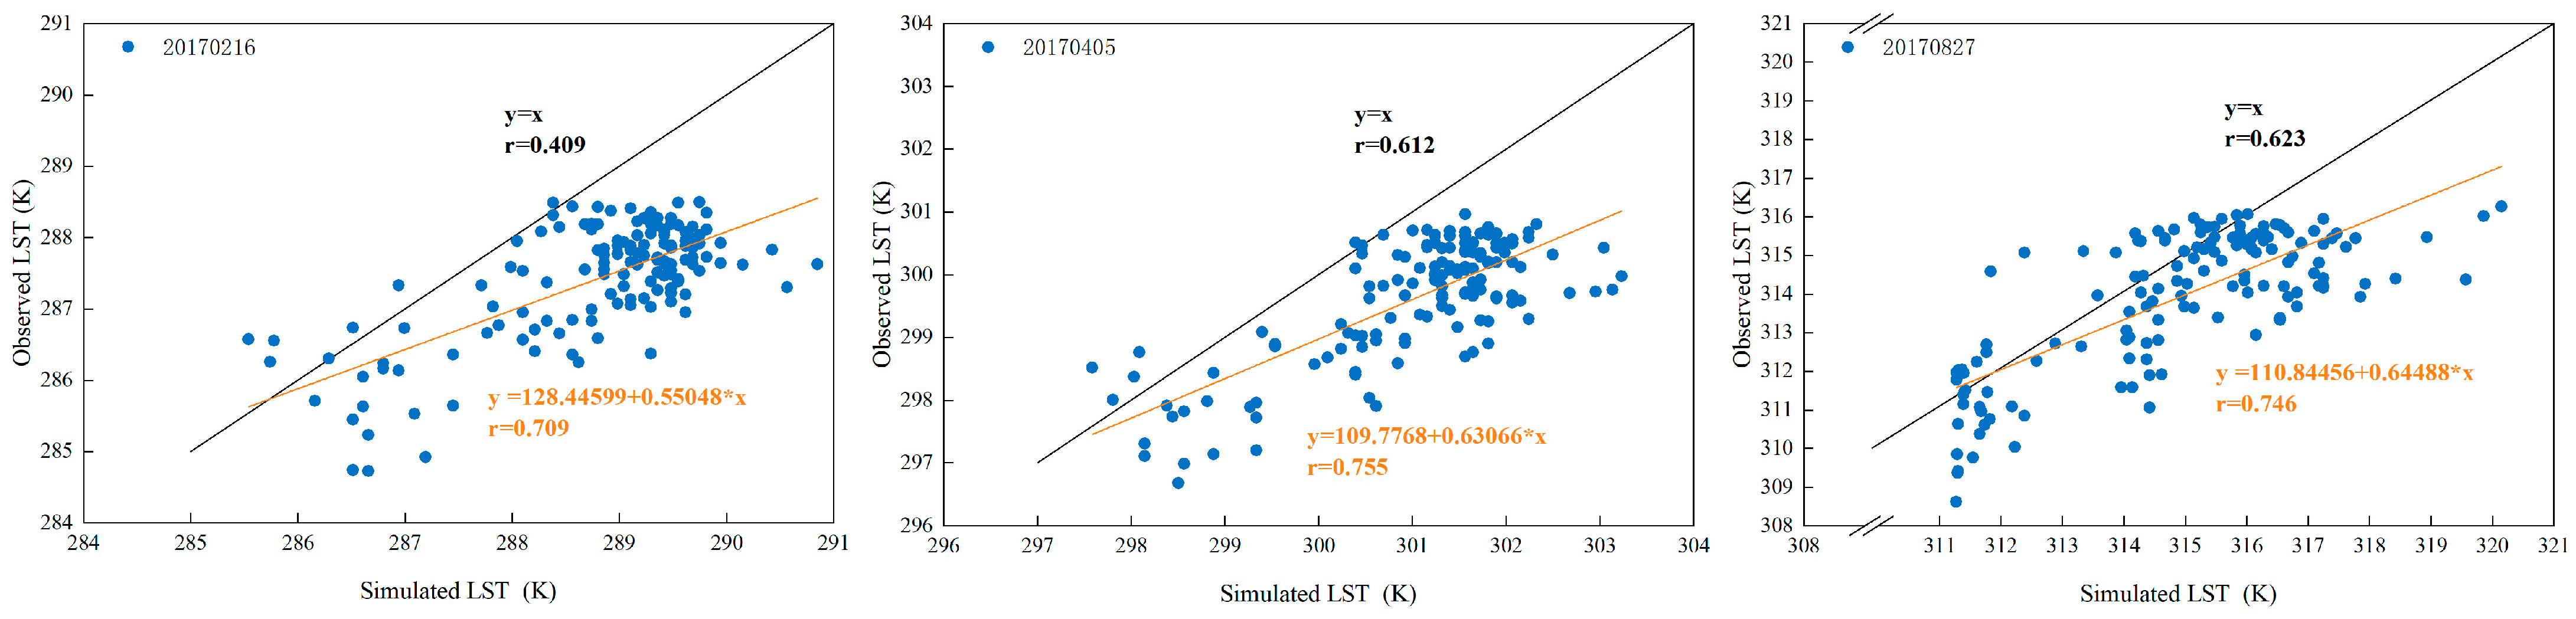
3.1. Validation of the Used Model

In addition to the climate data, the evapotranspiration time series calculated from the hydrological model are also important inputs of the energy balance model. The performance of the hydrological model and energy model should be validated before extrapolating their results.
The performance of the hydrological model was validated based on the comparison of simulated and observed discharge at the sewer system outlets. Several main model parameters were calibrated and validated in a previous study. Their values were used in this study, except for the interception parameters. The current study replaced the fixed depression storage value in the previous model to an NDVI-based seasonal-changing interception capacity. The model showed a satisfactory performance. Figure 3 shows the hydrograph of two typical rainfall events in the winter and summer seasons of 2018. The February event had a total of 15 mm rainfall, while the July event had a total of 19 mm. The NSE value of these two events were 0.78 and 0.82, indicating that the simulation had a reasonable reproduction of the discharge situation at the outlets. The discharge curves did not show large deviations between observed values at the initial stage, implying that the modeling results for the interception process were reasonable and within the watershed.
The performance of the energy balance model was validated by comparing the simulated and satellite-obtained surface temperature of each UHE. The LST data were in the same spatial format as the NDVI data (30 m pixel). The surface temperature of each UHE was calculated using the area-weighted average method, as with the NDVI data (in Section 2.3). Figure 4 shows the comparison of the simulated and observed surface temperatures in the winter, spring, and summer of 2017. The energy balance model presented an imperfect but acceptable reproduction of the observed values. The Pearson r value of the three dates were 0.409, 0.612, and 0.623, while the r values of the minimum error linear fitting (orange line) were 0.709, 0.755, and 0.746. The model exhibited a better performance in the summer season. The deviation of the optimal linear fitting line and the y equals x line were not significant, which indicated that the modeled results were reasonable.

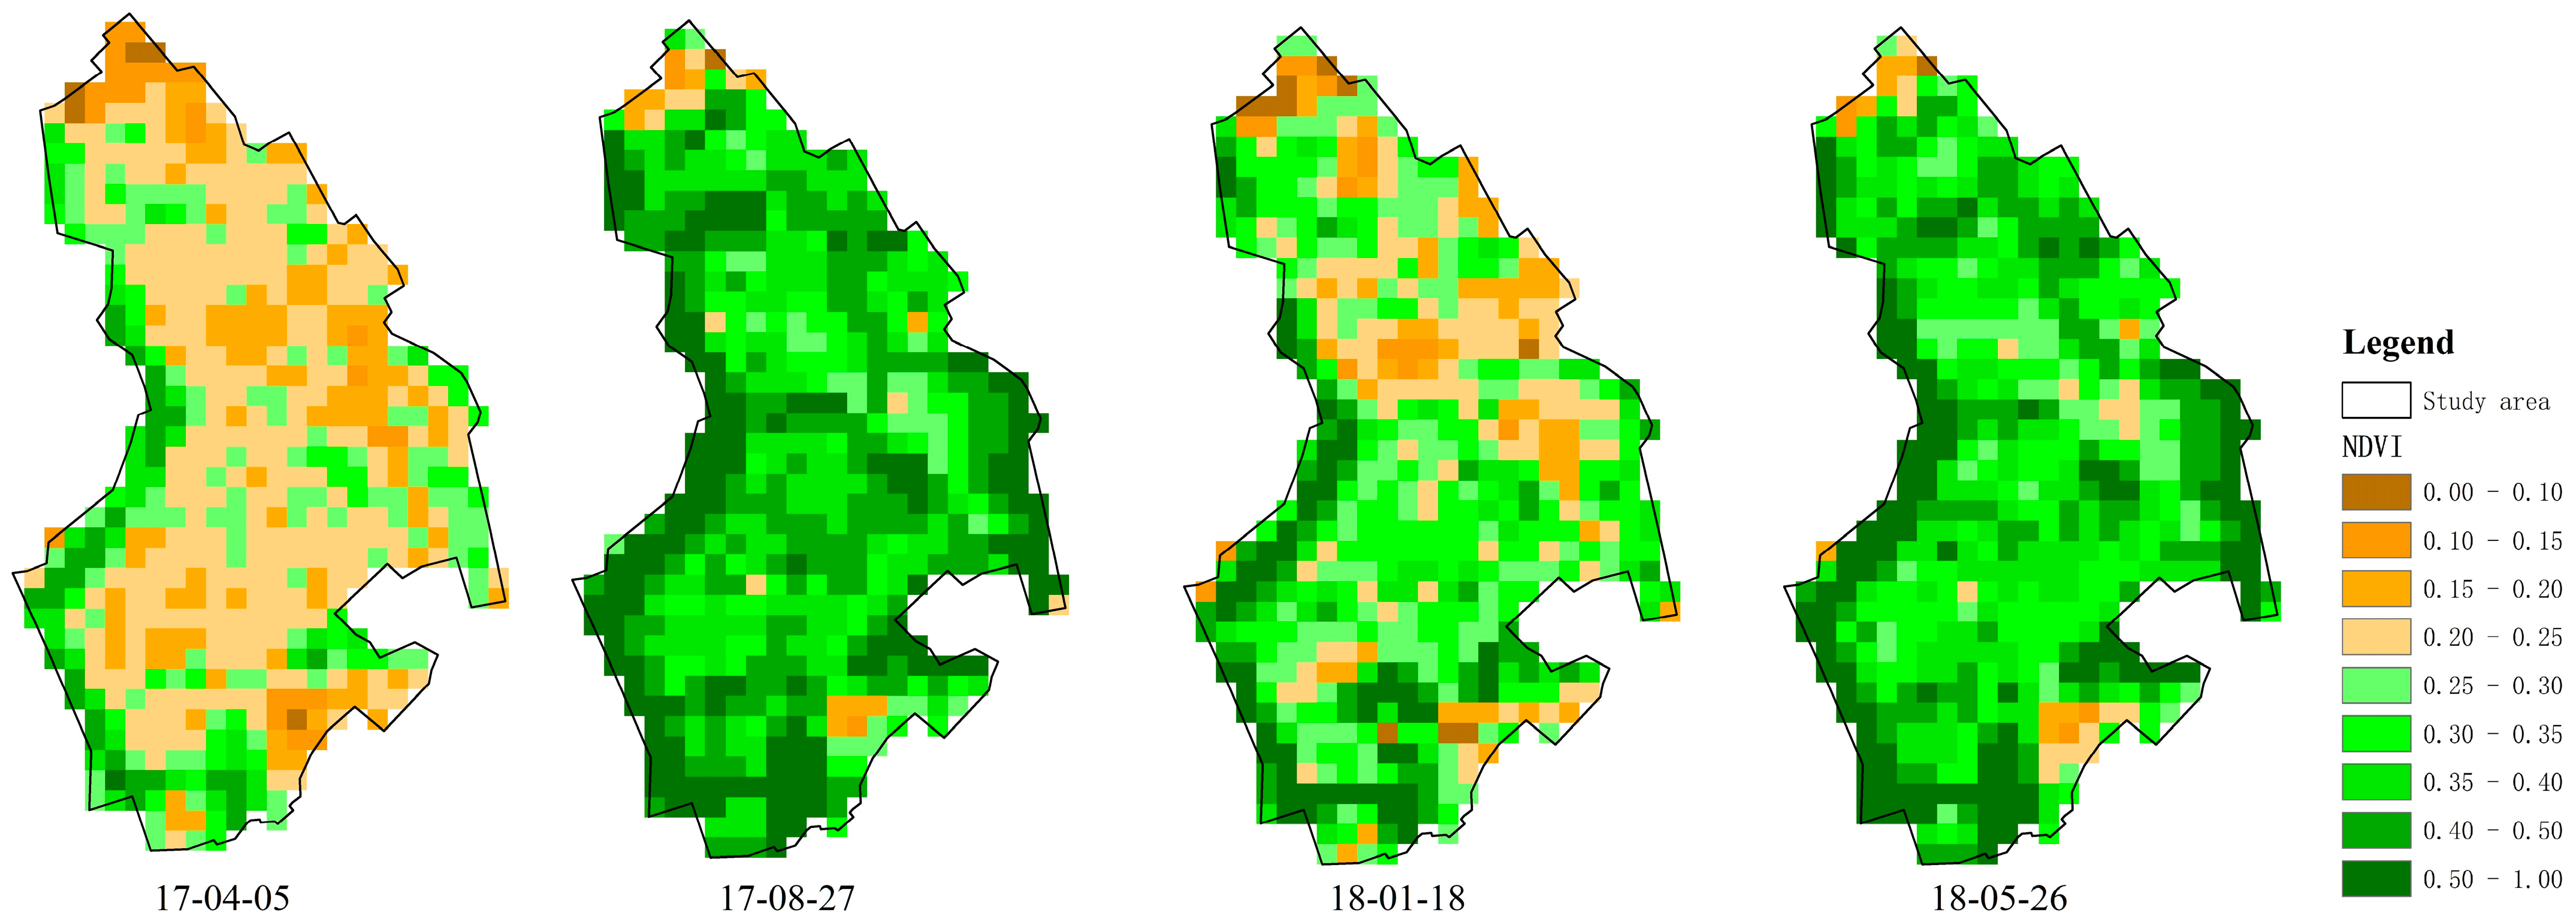
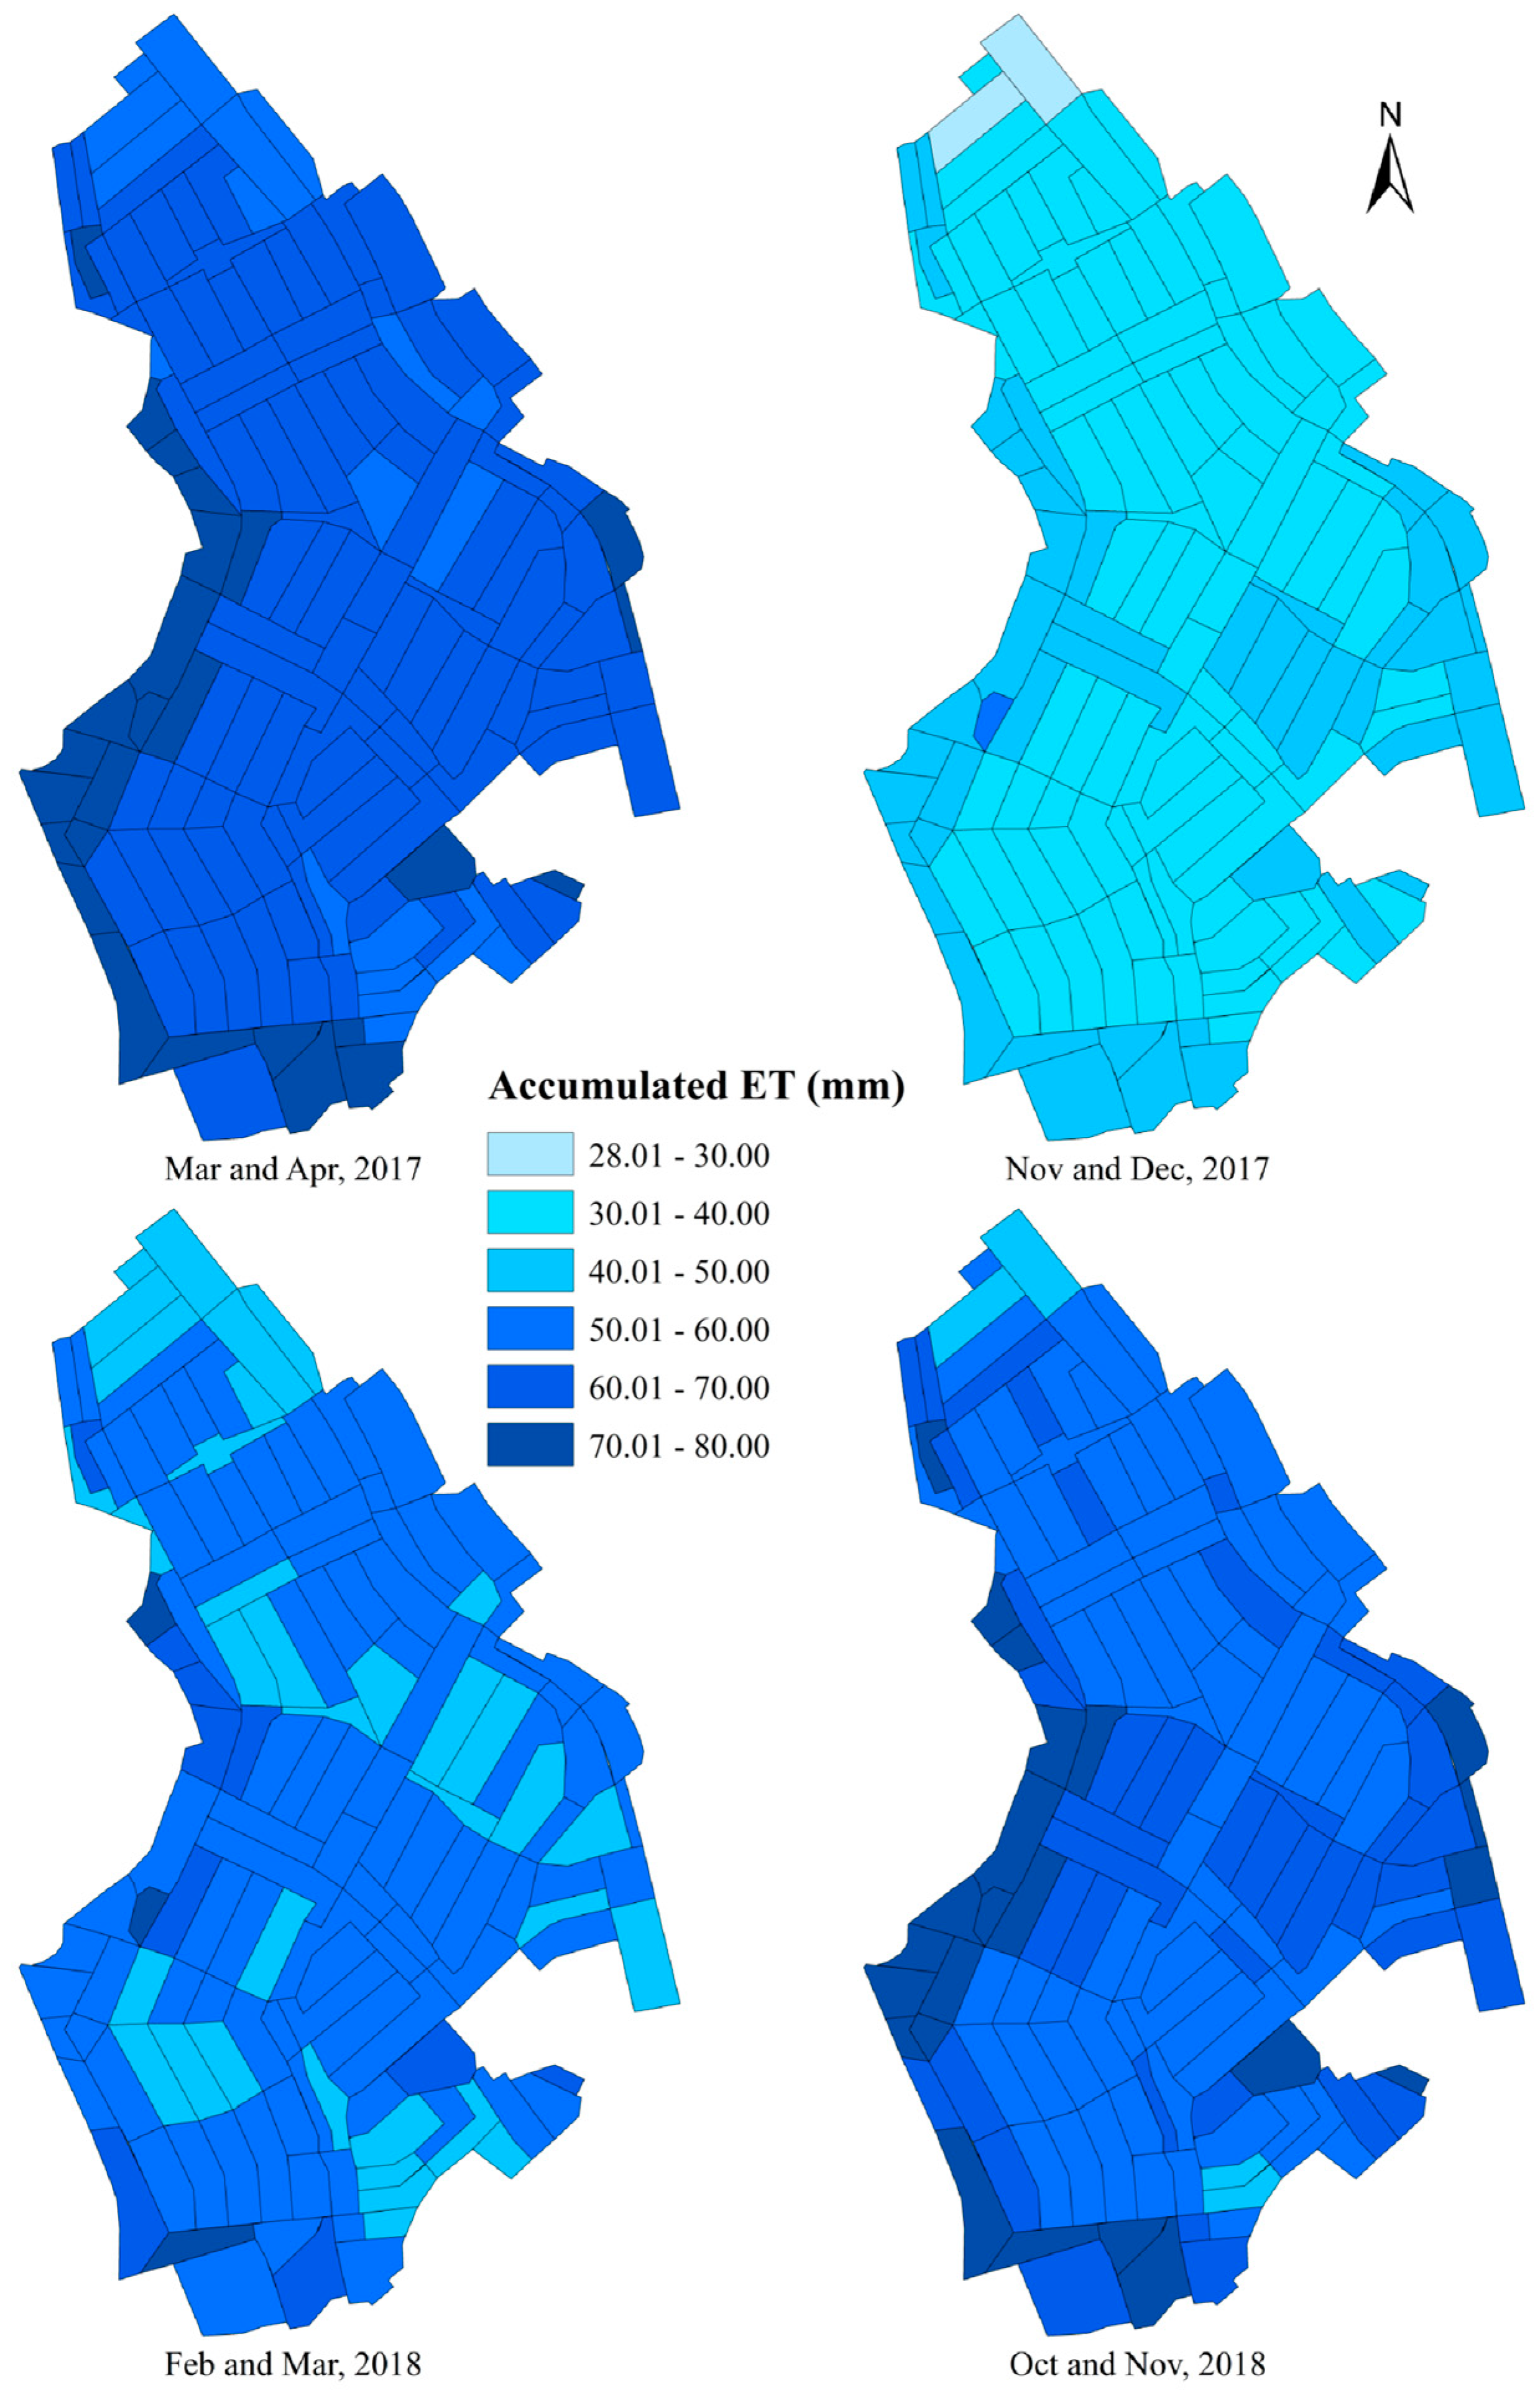
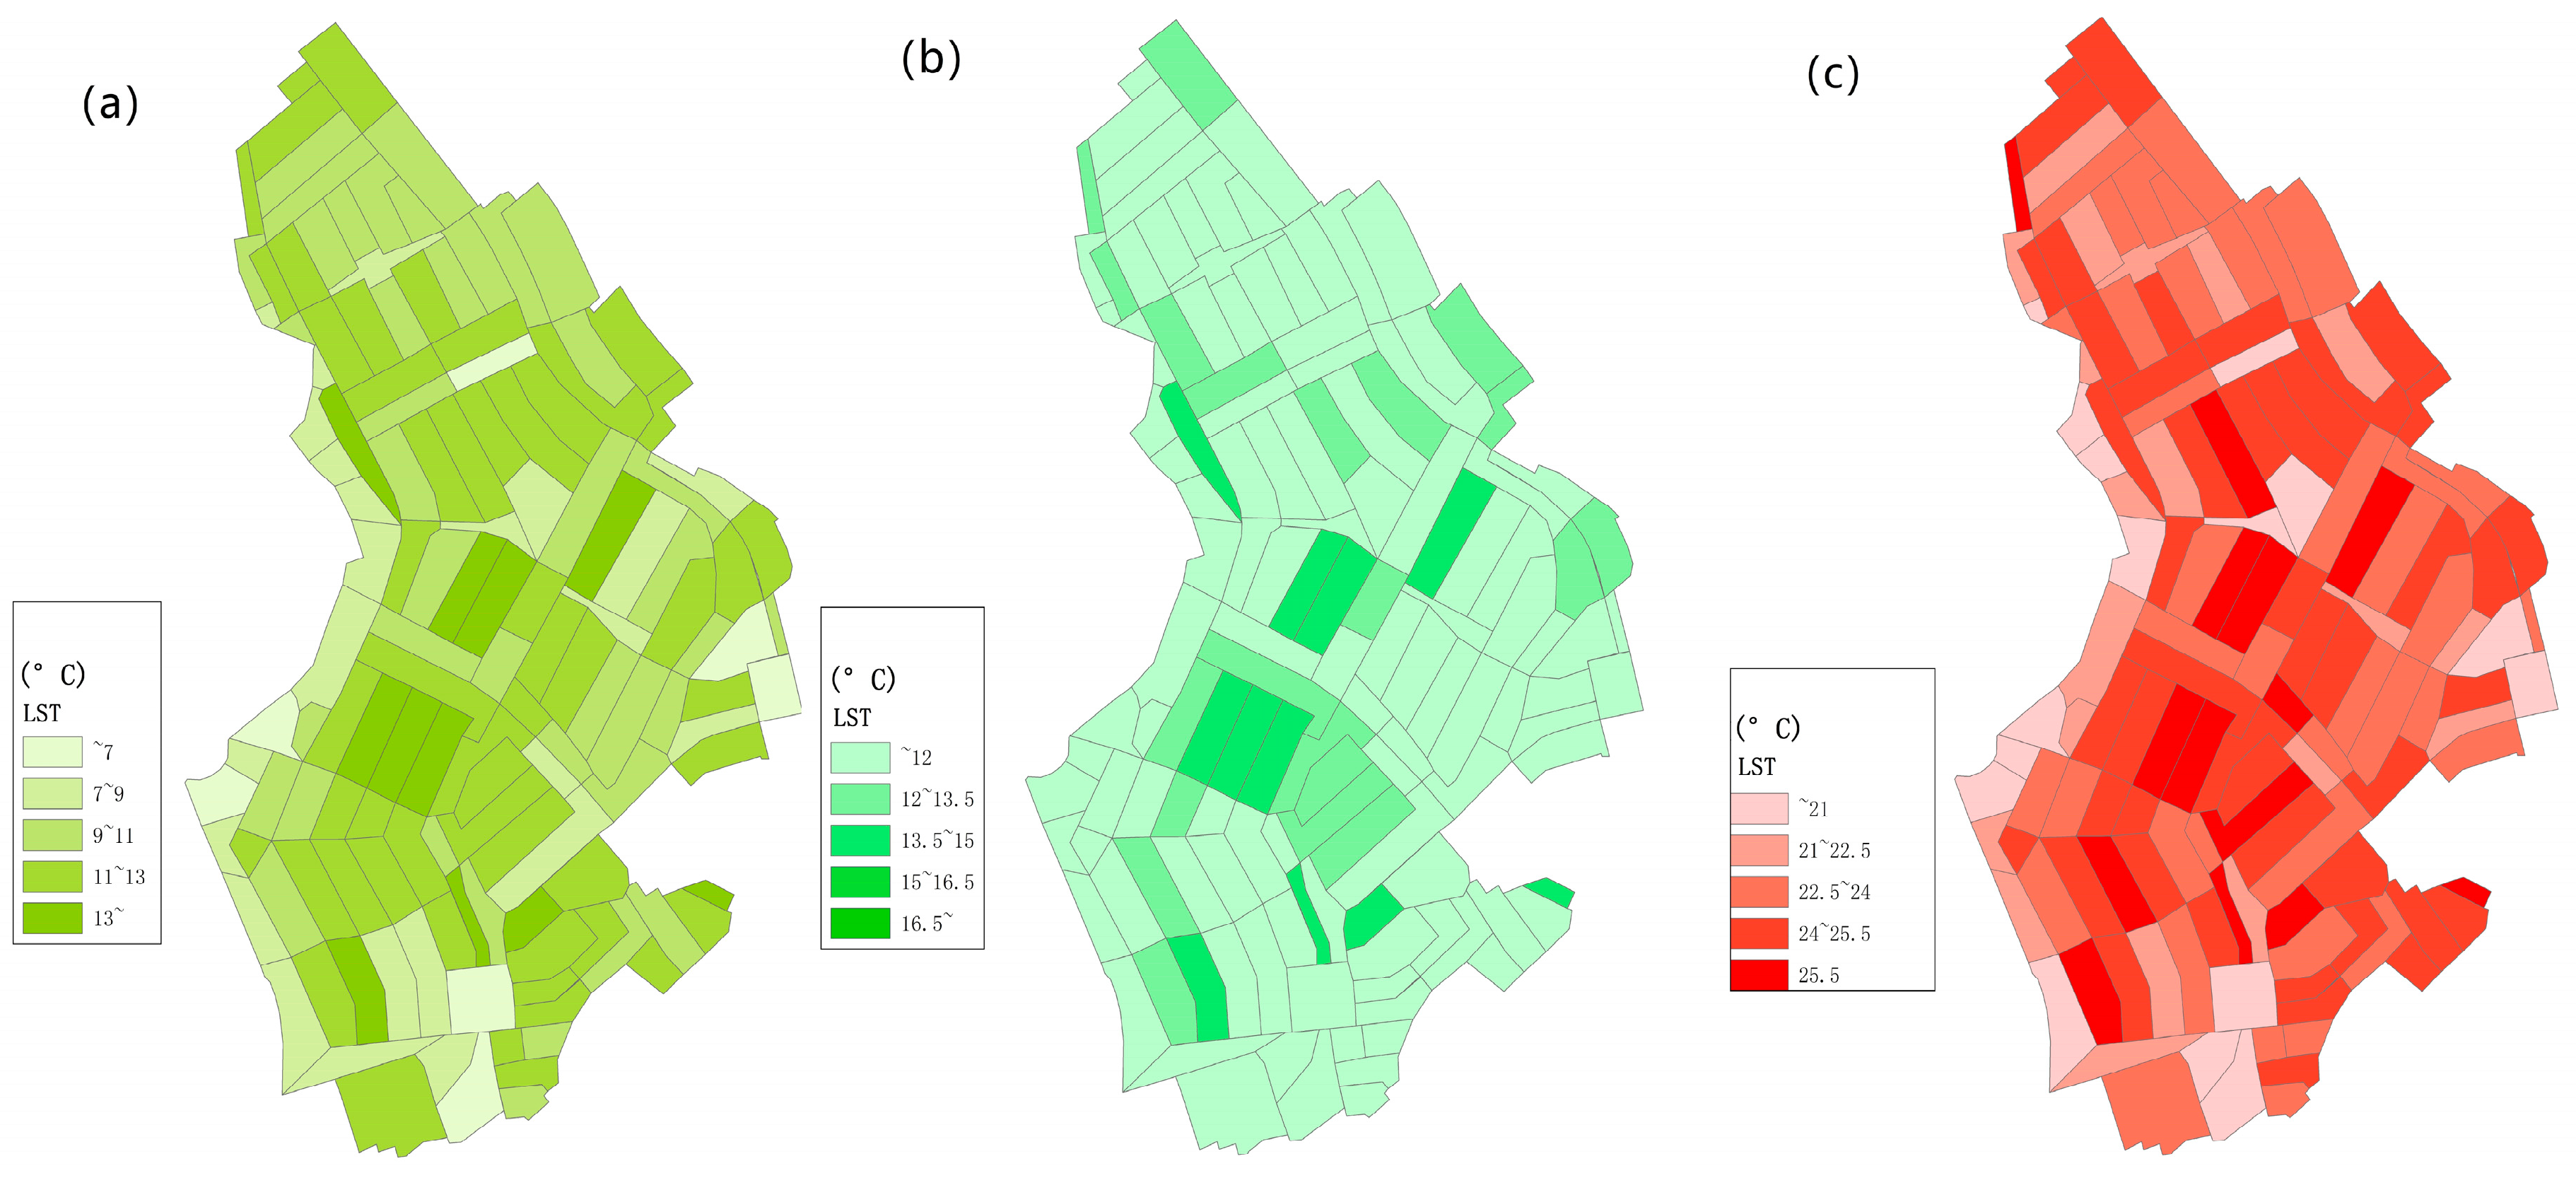
3.2. Seasonality of ET and LST

Evapotranspiration plays an essential part in water and energy balance (latent heat) and is closely related to the surface temperature calculation. The calculation scales maintained consistency with the previous ones, whereby each urban block/urban parcel was considered as an UHE. Figure 5 shows the spatial distribution of the calculated ET of each UHE in different seasons and years. The seasonality effect of ET was obvious—summer or rainy months had larger ET values, while the value in the winter months was distinctly smaller. October was usually the transition point of vegetation. The defoliation of vegetation not only reduced the interception capacity, but also made it less capable of transpiration. The distinct difference between November–December of 2017 and October–November of 2018 proved this. For different UHEs, the ET also showed a clear difference. Comparing the NDVI and ET distributions, it could be found that, generally, the ET was correlated with the vegetation amount. Greening or urban park UHEs usually had larger ET values than residential areas.
Figure 6 shows the spatial distribution results of the calculated surface temperature of the energy balance model in different seasons under the current actual vegetation conditions. The difference in values between small areas is shown by the color shade. The darker the colors, the higher the values are. Figure 7 shows the daily average LST of a typical residential UHE 4c-20 (with address 4-Chome, No. 20) in Feb to Mar and June to July 2018. Despite the seasonality, the LST fluctuated largely at the daily scale. The value was highly influenced by short-term weather conditions. As can be seen in Figure 7, for example, rainfall events tended to induce a significant drop in LST, due to the decrease in solar irradiance caused by cloud cover during rainfall, and thus a decrease in surface evapotranspiration.

3.3. Effects of Vegetation Amount and Patterns

LAI is an important vegetation indicator that can represent the amount of vegetation. In this study, LAI is an intermediate variable between NDVI and Smax. In order to indicate the effect of the vegetation amount on the simulated runoff and surface temperatures, the existing values of LAI distribution were adjusted by multiples. Figure 8 shows the average surface temperature distribution in the summer of 2018 for different amounts of vegetation. The LAI was set to 80%, 120%, and 140% of the original values. In general, as the vegetation amount increased, the surface temperature in the study area exhibited a corresponding decreasing trend.
Figure 9 summarizes the variations in surface temperature and total runoff with the change in vegetation amount (LAI). As can be seen from the figure, both average surface temperature and total runoff showed a decreasing trend as the amount of vegetation increased. It proved the mitigation effect of urban vegetation on surface runoff, as well as of heat islands.
Taking August 2018 as an example, Figure 10 shows the variation of the daily average and daily maximum surface temperatures under different LAI scenarios for different land types. Overall, the variation trends of the daily average and daily maximum temperatures were similar. Rainfall had an obvious effect on surface temperature. Rainfall was usually accompanied by a decrease in surface temperature. On the one hand, the solar irradiance was usually largely reduced during rainfall events. On the other hand, part of the rainwater was trapped on the vegetation or on the ground surface, and the subsequent evaporation process absorbed a significant amount of heat, resulting in an increase in the latent heat ratio and thus a decrease in the surface temperature. The rainfall and heat mitigation effect with LAI variation are shown in Table 2.
The amount of vegetation has pronounced effects on runoff and heat balance. At the same time, the vegetation structure and the way in which the different vegetation types were combined can also have impacts on the environment [23,24]. Thus, a number of UHEs with typical vegetation structures were extracted from the study area, and their locations are labeled in Figure 1b. The main vegetation types and other information of these typical vegetation structures are listed in Table 3. Among them, UHE 3GrS-4 was regularly mowed and trimmed so that it had only a small amount of grass on the ground level, while the ground level of 3GrS-1 was covered with shrubs and grass, except for internal trails. UHE 4C-4 has a vegetation cover and imperviousness ratio that were close to the average values of all residential areas. Figure 11 exhibits the water balance of these typical UHEs. The components varied considerably between vegetation structures. The interception ratio was evidently influenced by vegetation amount and showed a positive correlation. UHEs 3GrS-4 and 3GrS-1 had quite similar top vegetation (trees), but the former had less interception than the latter, due to the absence of ground level vegetation. The interception in the residential area amounted to 13.6%, while in the commercial area, it was 5.8%. The impervious ratio is not a vegetation index, but is usually closely related to vegetation and has a significant impact on the water balance. In this case, 2C-1e had a large impervious surfaces percentage and a significantly low infiltration. This, in turn, led to a significantly higher runoff ratio, which was about four times than that of 3GrS-1 (91.8% and 23.3%). In contrast, 3 GrS-4 and 3 GrS-1 had very similar infiltration ratios (55.1% and 55.7%) and runoff ratios (23.3% and 25.6%) for their approximate imperviousness.
Different vegetation structures may lead to large differences in water balance. The runoff and heat island reduction difference caused by the vegetation structures at the urban catchment scale also need to be analyzed. Here, four landscape patterns/GI implementation strategies were designed (Table 4). A vegetation variation time series of typical vegetation structure was extracted and assigned to corresponding areas to create new landscape patterns. For example, 3c-23 was a grove of evergreen trees. The annual NDVI series of 3c-23 was assigned to all street areas within the study area, to constitute a simulation scenario in which all street trees were replaced with evergreen trees. The rest of the scenarios were generated through a similar process, as shown in Table 4.
Figure 12 illustrates a comparison of the effectiveness of the four landscape patterns and three of their combinations in reducing the runoff and heat island effects in the summer of 2018. For single type strategies, GR had a better performance; while for the combination strategies, the combination of GR+DPS had the best effect. Despite the different combinations of vegetation structures, the reduction in the runoff and heat island effects were generally positively correlated with vegetation amount, i.e., strategies with larger LAI values generally have better reduction effects. One exception was the DPS scenario, which had slightly larger LAI values than the DPC (1.16 and 1.14), but smaller runoff reductions than the DPC (96.2% and 95.2%), and approximate temperature reductions of 23.31 °C and 23.24 °C. This was due to the fact that the street occupied a relatively small area in the residential UHE, and the dense street tree strategy resulted in a relatively concentrated distribution of vegetation, which diminished the interception effect on the whole UHE scale. In addition, the DPS+DPC scenario had a slightly better runoff and temperature reduction (86.2% and 21.61 °C) than the GR scenario (89.9% and 21.99 °C), even though the vegetation LAI value was slightly lower than that of the GR scenario (1.335 and 1.361), which again showed that the amount of vegetation was not the only determining factor, but that the uniformity of vegetation distribution was also an important indicator of the results.

4. Discussion

4.1. Runoff and Heat Mitigation Effect Analysis

The results of this study showed that vegetation has non-negligible reduction effects of runoff and heat. Under the current conditions, the interception accounted for 13% of the total rainfall, which is not dominant, but is indispensable in water balance. With the change of the total amount of vegetation, the reduction in runoff and surface temperature by vegetation also changes and varies approximately linearly with the vegetation amount. Since the absolute storage capacity of vegetation is not large, the reduction effect on the peak flow is weaker, as well as on heavy rainfall. When the vegetation amount increased by 1.4 times, there was an interception increase, and this resulted in a reduction in the total runoff and the average LST (89.3% and 2.5 °C). In addition, when the vegetation amount varied from 0.8 to 1.4 times, the reduction in the total runoff was 16.8% and the mean surface temperature was 3.9 °C. From 0.8 to 1.4 times, a large increase in the vegetation amount is observed, which suggests that there are marginal effects for vegetation-based runoff/heat reduction. This implies that although vegetation can provide effective flood and heat island mitigation, increasing the amount of vegetation cannot radically reverse the hydro-climatic characteristics of urban catchments. Seasonal variations are also significant in this study. In terms of the interception capacity of the UHEs, the annual difference could be up to 2 mm for greening areas, while the average annual difference in residential areas was close to 1 mm. The impacts on evaporation and runoff are not negligible on seasonal scales. Traditionally, urban hydrological models considered interception as a fixed value [25]. So, it is advocated that interception parameters with seasonal variations should be used in future studies. Another important factor is the vegetation type or structure. This study compared a total of seven scenarios of landscape structures and their combinations, showing that although the reduction effect is generally positively correlated with the amount of vegetation, the role of landscape patterns cannot be overlooked. Overly dense or irrational patterns may result in a larger vegetation amount having smaller reduction effects. Therefore, landscape structures/patterns are also important considerations for vegetation/GI construction and planning. Comparing the results of several other studies, the results of the present study are within the reasonable range. Liu and Chui [28] reported that urban green roofs have a runoff reduction ranging from 12 to 30%. And green roofs can have a UHI mitigation effect of 2 °C in metropolitan areas [29]. Wang et al. [30] reported that urban vegetation can significantly change the surface albedo value and reduce the local surface temperature by up to 8 degrees if bare concrete ground is converted to vegetation. Also, previous studies have reported annual runoff reduction rates of 12–25% for green roofs and average summer temperature reductions ranging from 0.9 to 3.1 °C [4,9,31,32].
The methodology used in this study, which calculates the surface temperature (representative equilibrium temperature) and the actual evapotranspiration amount within UHEs, was originally intended for larger watershed scale applications [19]. This study demonstrates that it can be applicable for a smaller urban watershed. The LST and evapotranspiration calculation are based on averaging over a certain area, therefore, the scale of the minimum simulation unit UHE should not be smaller than the physical scale of the actual processes. And with reference to other studies [22,25], for the use of this methodology, we propose that the scale of the UHE should not be smaller than the urban parcels. The results of the present study could be generalized to areas with similar climate and land use types.

4.2. Policy Implications

With regard to the development of GI, the local policy of Sendai can be summarized as (i) keeping and protecting the current greening and (ii) increasing the greening of the city in a mild and steady way. The incremental part of vegetation could come from three main sources, as follows: street trees besides main avenues and community roads, vegetation in public parks, and the greening of the riverine zone. The content of this study is closely related to the greening development policy of Sendai city. The results could have implications or become a useful reference for Sendai’s greening policy. Firstly, the benefits of existing urban vegetation in terms of hydrological and energy cycles are effectively evaluated. And the environmental changes brought about by the potential growth or reduction in vegetation (LAI changing) are also addressed. In particular, the scenario of LAI values increasing is in accordance with the previously described future greening increase schemes, which have generated useful references of future scenario projections. The results for different landscape patterns are also relevant. The study area does not contain any streams, so street trees and park vegetation are the primary vegetation contributors. The study area has a large percentage of roof and courtyard area, and the GR and DPC scenario could achieve certain reduction effects. However, these scenarios also have limitations. For the DPC scenario, the practical difficulty lies in the issue of courtyard management rights, which are private property rights, making it difficult to achieve unified planning. For the DPC scenario, there is a saturation effect, while the vegetation amount becomes larger on fixed street areas. When vegetation is too concentrated, there could be a relative decrease in the reduction effect. Green roofs, on the other hand, have a good reduction effect, but their construction and maintenance costs are quite high. According to Chui et al.’s [33] calculations, on a hypothetical 30-year time scale, the unit cost of green roofs exceeds USD 50/m2/year, and green roof facilities face greater risks of aging [34]. Compared with green roofs, urban trees and shrubs have much lower construction and maintenance costs. All these trade-offs should be considered during the urban planning process.
Tree species are another issue of great concern. For the selection of tree species for GI, all deciduous trees or the majority of deciduous tree species are the main choices in most regions [35]. This is because the leaf area of deciduous tree species is usually large, and can trap more rain and block more sunlight during the summer season. The respiration and transpiration from deciduous tree leaves is relatively obvious. Evergreen trees usually have a lower amount of biomass than that of deciduous trees, grow more slowly than deciduous trees, and need longer growth times to have the same amount of biomass as deciduous trees. Older evergreen trees have more stable amounts of biomass throughout the year, but the amount is usually lower than that of a deciduous forest in the summer. These features of deciduous trees are beneficial for reducing runoff and surface temperature. This study also demonstrates that the evergreen tree scenario, ES, is the least effective of all the scenarios for summer season reduction. This conclusion is consistent with the analysis of vegetation characteristics described above. In the winter seasons, there is less rainfall and lower temperatures; considering the hydrological and climatic features of the study area, the need to reduce runoff or temperature is not strong [30,36]. In this study area, the trees are mainly deciduous. The proportion of evergreen trees is small. According to the policy and specifications of Sendai city, the proportion of evergreen trees should be approximately 20%.
The growth of trees could increase the total amount of vegetation. This increase, in part, will have potential benefits for future flood prevention or urban temperature regulations. Although the trees do not grow linearly forever and the growth slows down after a certain period of time, the benefits brought about by the age of the trees should also be a factor that is considered in urban GI planning. From a stormwater management perspective, no flooding events have been reported in the study area in the last 15 years, groundwater levels were normal, and summer temperatures were generally within acceptable ranges. The existing GI has been able to meet the needs of the study area. The mitigation effects may be higher in the future if vegetation growth is accounted for. Considering the future adaptations to climate change, it is suggested that improvements in vegetation planning should include more evenly distributed vegetation schemes and consider the potential for more diverse GI.

4.3. Limitations and Future Directions

The energy balance model in this study follows the spatial division of the hydrologic model, which may lead to structural errors in the model. The difference in results from grid-based or UHE-based simulation approaches may need to be discussed in the future. In addition, this study assumes that the air temperature is uniform within the study area and does not consider the lateral heat transfer effect in the air. The street canyon effect in the city is not considered because of the average low residential heights in the study area. Future studies may need to consider the effects of the above factors on the results.

5. Conclusions

In this study, a hydrological model and an energy model were coupled. A residential area in Sendai, Japan was used as the study site to simulate the hydrological and energy balance in the area. The model used remotely sensed data to help determine parameters. Using this model, the mitigation effects of urban vegetation on urban runoff and UHIs were evaluated. The following conclusions were obtained:
  • All parts of the model have a fairly acceptable performance. The NSE performance of the hydrological part of the model was above 0.8, and the annual interception rate is 13%. The modeling results of LST generally reproduced the LST distribution obtained from satellites. Compared with other studies, it is in a reasonable range.
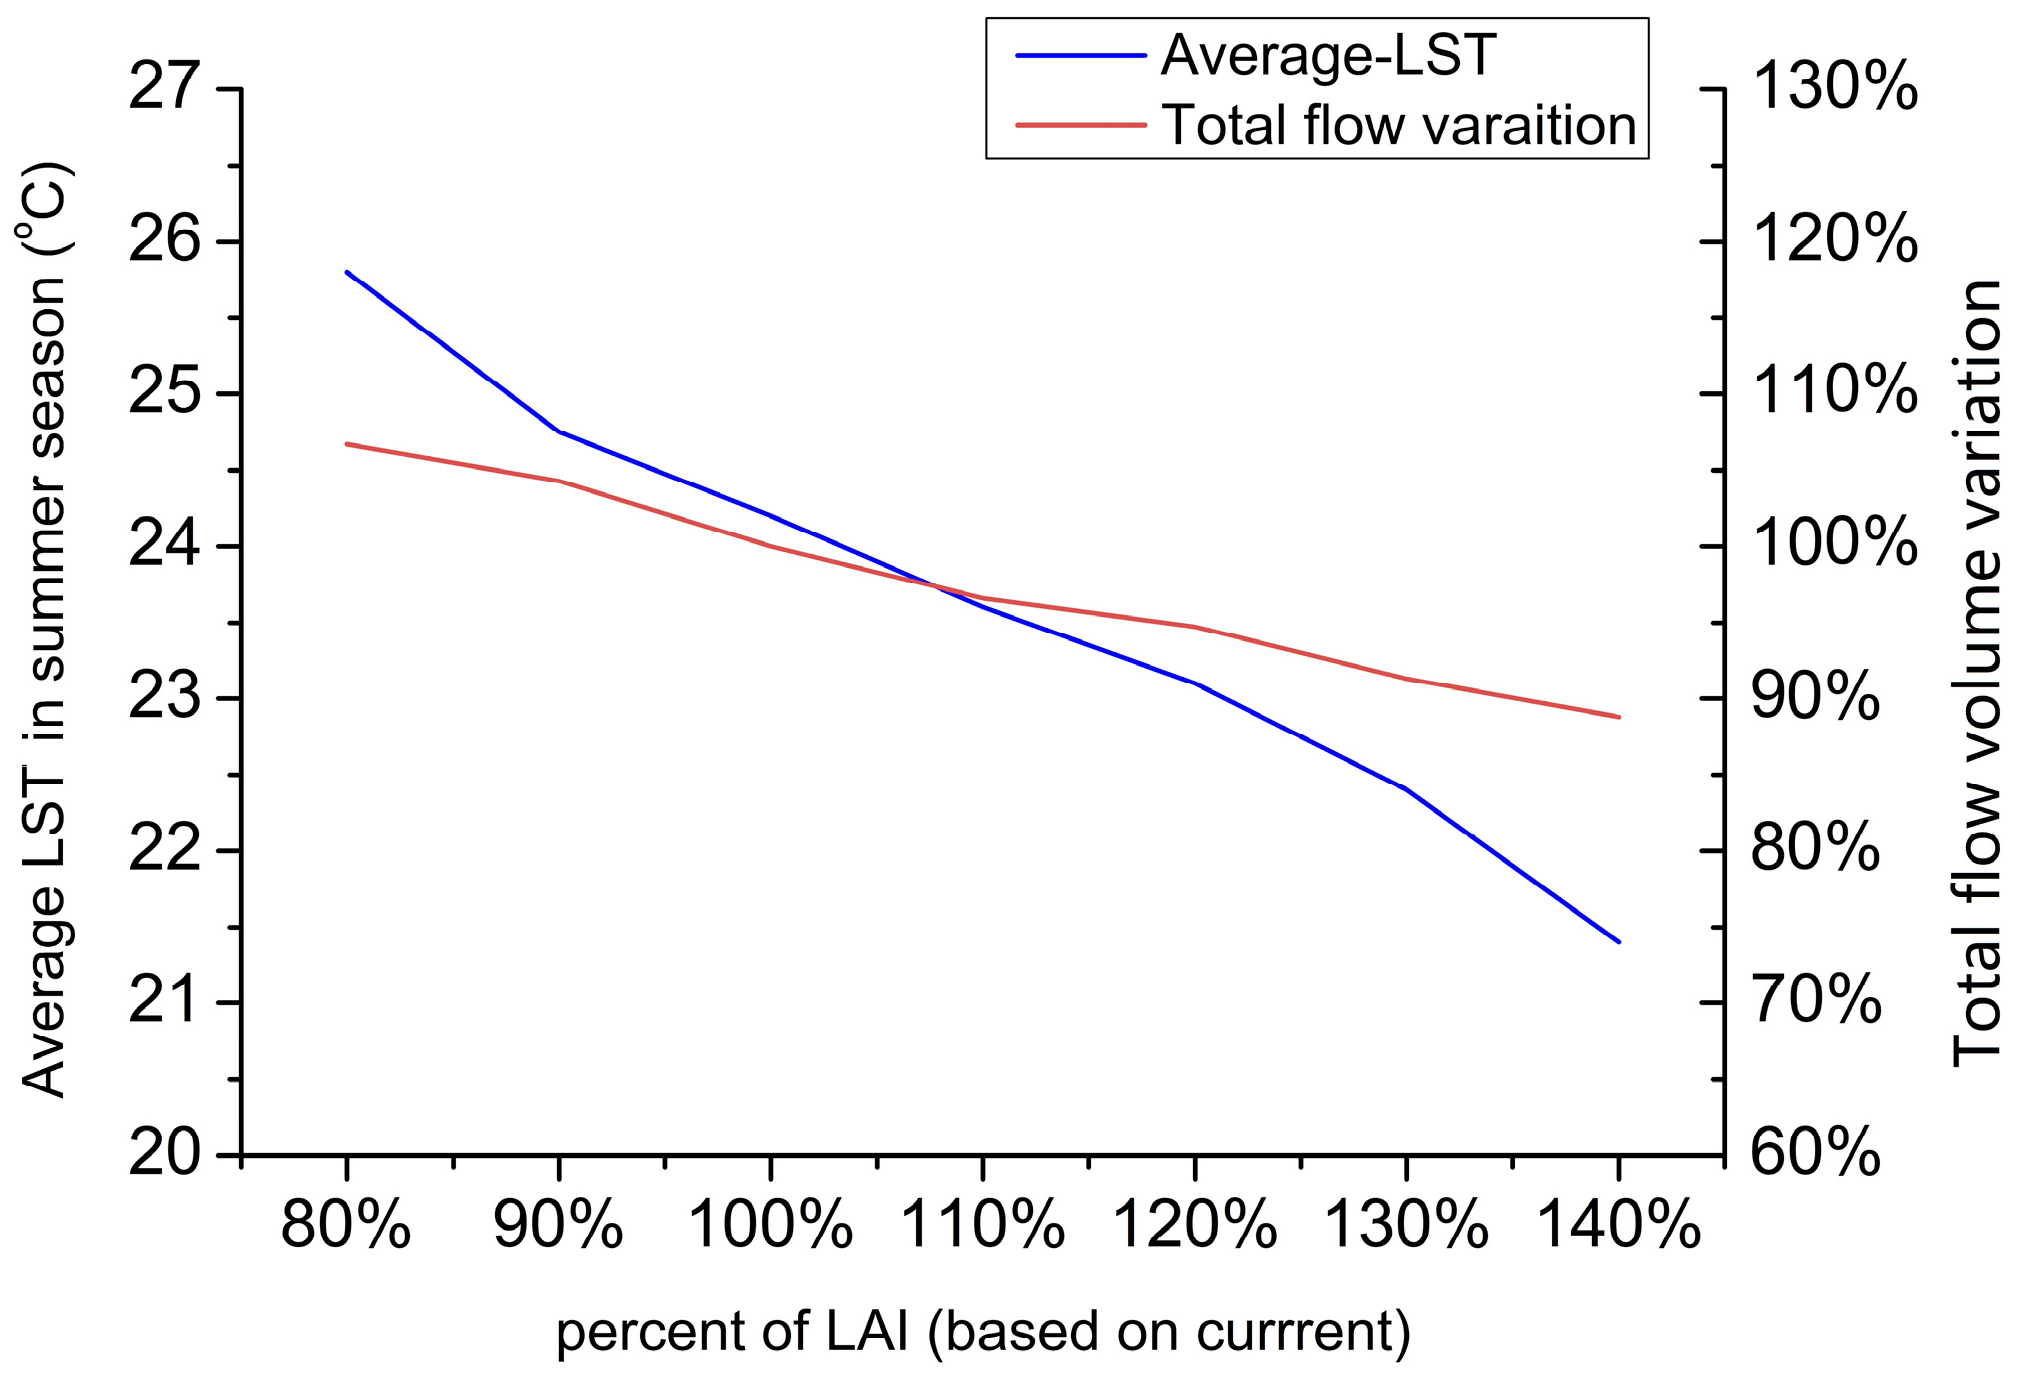
  • When LAI was used as an indicator for representing vegetation amount, the changes in its value had caused corresponding changes in runoff volume and surface temperature. Total runoff volume and average surface temperature in the summer months had decreased by 10.7% and 2.5 °C when LAI was set as 1.4 times its original value. While LAI values became 80% of original values, the total runoff volume and average surface temperature increased by 6% and 1.5 °C. Seven landscape patterns were also compared. Green roofs performed best in single structures, and green roofs with street trees had the best reduction effect in structure combinations. Overall, the vegetation mitigation effect was still related to vegetation amount, but there were exceptions. The importance of vegetation structure as well as its spatial distribution was proved. These results could provide references for green infrastructure development in the future for areas with similar vegetation and climate characteristics.
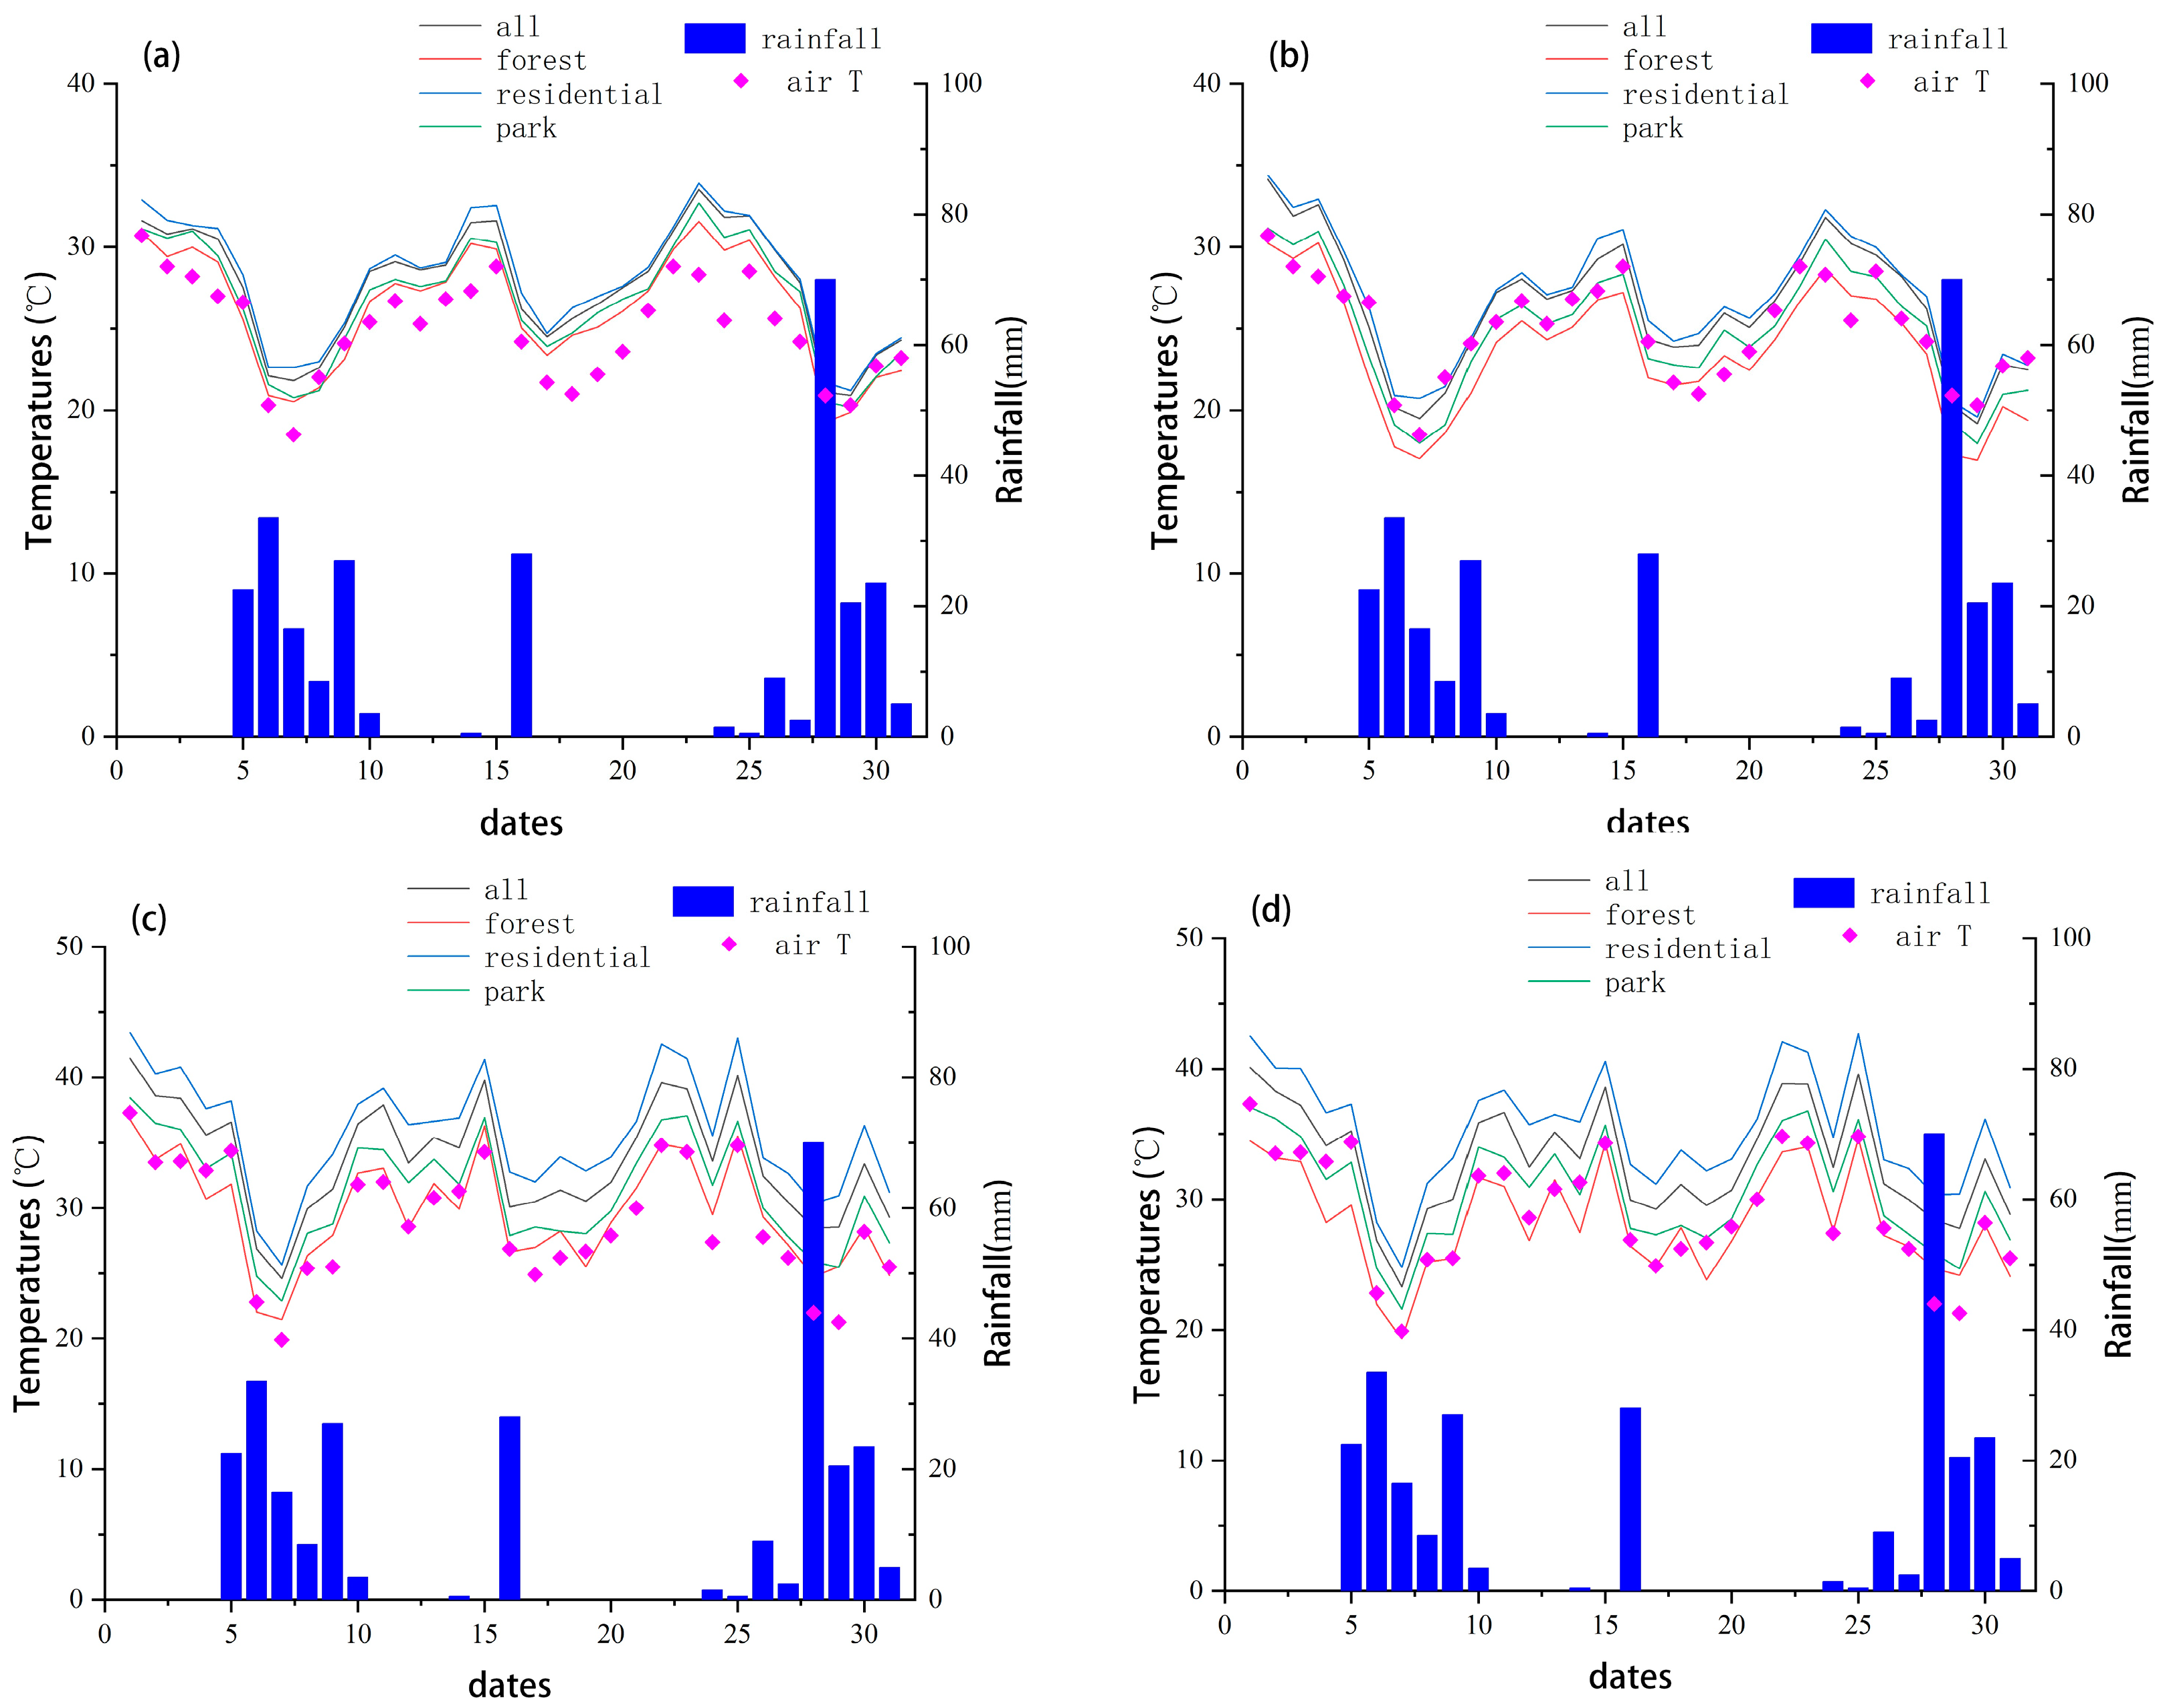
  • There were mitigation effects on peak flow volume and daily maximum surface temperatures, although these effects were less obvious than those on runoff volume and average surface temperatures. For August 2018, when LAI increased to 1.4 times its original value, the daily maximum surface temperature decreased by 1.9 degrees, and the peak runoff decreased by 8%. For different land use types, the temperature types had a similar pattern, while the mitigation effects were different. This emphasized the importance of increasing vegetation in highly impervious areas and could provide useful insights for urban greening planning.
  • Urban tree type and water resource management should be considered during urban planning and GI construction. Tree growth may provide more benefits in runoff and heat mitigation. One of the advantages of urban trees and naturally grown or maintenance-free vegetation is their relatively lower cost. Other types of GI could also be considered, such as green roofs, but cost-effectiveness analyses should be conducted to make reasonable comparisons between different GI.

Author Contributions

Conceptualization, S.K. and Q.C.; Methodology, Q.C. and S.K.; Software, Q.C. and X.W.; Investigation, Q.C., Y.T. and S.A.; Data curation, S.K., Y.T. and S.A.; Writing—original draft, X.W.; Writing—review & editing, Q.C.; Visualization, X.W. All authors have read and agreed to the published version of the manuscript.

Funding

This research was partially supported by the Hubei Provincial Department of Education scientific research program guidance project (B2022009), and the Ministry of Education, Science, Sports and Culture, Grant-in-Aid for Scientific Research (A), 2016–2019 (16H02363, So Kazama).

Institutional Review Board Statement

Not applicable.

Informed Consent Statement

Not applicable.

Data Availability Statement

Data are contained within the article.

Acknowledgments

The authors thank the Sendai Water Resources Bureau for providing the drainage network data and permission for monitoring the discharge at the outlet.

Conflicts of Interest

The authors declare no conflicts of interest.

References

  1. A United Nations, Department of Economic and Social Affairs, Population Division. World Urbanization Prospects: The 2018 Revision; (ST/ESA/SER.A/420); United Nations: New York, NY, USA, 2019.
  2. Zhang, W.; Villarini, G.; Vecchi, G.A.; Smith, J.A. Urbanization exacerbated the rainfall and flooding caused by hurricane Harvey in Houston. Nature 2018, 563, 384–388. [Google Scholar] [CrossRef]
  3. Vulova, S.; Meier, F.; Rocha, A.; Quanz, J.; Nouri, H.; Kleinschmit, B. Modeling urban evapotranspiration using remote sensing, flux footprints, and artificial intelligence. Sci. Total Environ. 2021, 786, 0048–9697. [Google Scholar] [CrossRef]
  4. Solecki, W.D.; Rosenzweig, C.; Parshall, L.; Pope, G.; Clark, M.; Cox, J.; Wiencke, M. Mitigation of the heat island effect in urban New Jersey. Global Environ. Change B Environ. Hazards. 2005, 6, 39–49. [Google Scholar] [CrossRef]
  5. Peng, J.; Liu, Q.; Xu, Z.; Lyu, D.; Wu, J. How to effectively mitigate urban heat island effect? a perspective of waterbody patch size threshold. Landsc. Urban Plan. 2020, 202, 103873. [Google Scholar] [CrossRef]
  6. Oke, T.R. The energetic basis of the urban heat island. Q. J. R. Meteorol. Soc. 1982, 108, 1–24. [Google Scholar] [CrossRef]
  7. Kumar, R.; Mishra, V.; Buzan, J.; Kumar, R.; Shindell, D.; Huber, M. Dominant control of agriculture and irrigation on urban heat island in India. Sci. Rep. 2017, 7, 14054. [Google Scholar] [CrossRef]
  8. Li, Y.; Zhao, X. An empirical study of the impact of human activity on long-term temperature change in China: A perspective from energy consumption. J. Geophys. Res. 2012, 117, D17117. [Google Scholar] [CrossRef]
  9. Zinzi, M.; Agnoli, S. Cool and green roofs. An energy and comfort comparison between passive cooling and mitigation urban heat island techniques for residential buildings in the Mediterranean region. Energy Build. 2012, 55, 66–76. [Google Scholar] [CrossRef]
  10. Chen, H.; Huang, J.J.; Liang, H.; Wang, W.; Li, H.; Wei, Y.; Jiang, A.Z.; Zhang, P. Integration of flux footprint and physical mechanism into convolutional neural network model for enhanced simulation of urban evapotranspiration. J. Hydrol. 2023, 619, 129016. [Google Scholar] [CrossRef]
  11. Shashua-Bar, L.; Rahman, M.A.; Moser-Reischl, A.; Peeters, A.; Franceschi, E.; Pretzsch, H.; Rötzer, T.; Pauleit, S.; Winters, G.; Groner, E.; et al. Do urban tree hydraulics limit their transpirational cooling? A comparison between temperate and hot arid climates. Urban Clim. 2023, 49, 101554. [Google Scholar] [CrossRef]
  12. Inkiläinen, E.N.; McHale, M.R.; Blank, G.B.; James, A.L.; Nikinmaa, E. The role of the residential urban forest in regulating throughfall: A case study in Raleigh, North Carolina, USA. Landsc. Urban Plan. 2013, 119, 91–103. [Google Scholar] [CrossRef]
  13. Zabret, K.; Rakovec, J.; Šraj, M. Influence of meteorological variables on rainfall partitioning for deciduous and coniferous tree species in urban area. J. Hydrol. 2018, 558, 29–41. [Google Scholar] [CrossRef]
  14. Ramamurthy, P.; Bou-Zeid, E. Contribution of impervious surfaces to urban evaporation. Water Resour. Res. 2014, 50, 2889–2902. [Google Scholar] [CrossRef]
  15. Gonzalez-Sosa, E.; Braud, I.; Piña, R.B.; Loza CA, M.; Salinas NM, R.; Chavez, C.V. A methodology to quantify ecohydrological services of street trees. Ecohydrol. Hydrobiol. 2017, 17, 190–206. [Google Scholar] [CrossRef]
  16. Gillner, S.; Vogt, J.; Tharang, A.; Dettmann, S.; Roloff, A. Role of street trees in mitigating effects of heat and drought at highly sealed urban sites. Landsc. Urban Plan. 2015, 143, 33–42. [Google Scholar] [CrossRef]
  17. Nourani, V.; Fard, A.F.; Niazi, F.; Gupta, H.V.; Goodrich, D.C.; Kamran, K.V. Implication of remotely sensed data to incorporate land cover effect into a linear reservoir-based rainfall–runoff model. J. Hydrol. 2015, 529, 94–105. [Google Scholar] [CrossRef]
  18. Das, A.; Saha, P.; Dasgupta, R.; Inacio, M.; Das, M.; Pereira, P. How Do the Dynamics of Urbanization Affect the Thermal Environment? A Case from an Urban Agglomeration in Lower Gangetic Plain (India). Sustainability 2024, 16, 1147. [Google Scholar] [CrossRef]
  19. Kazama, S.; Sawamoto, M.; Watanabe, H. Applicability and Disucussion on the NDVI-Evapotranspiration Linear Relationship. Annu. J. Hydraul. Eng. JSCE 2005, 796, 796_1, (In Japanese with English Abstract). [Google Scholar] [CrossRef]
  20. Chang, Q.; Kazama, S.; Touge, Y.; Aita, S. The effects of spatial discretization on performances and parameters of urban hydrological model. Water Sci. Technol. 2019, 80, 517–528. [Google Scholar] [CrossRef]
  21. Rouse, J.W.; Haas, R.H.; Schell, J.A.; Deering, D.W. Monitoring vegetation systems in the Great Plains with ERTS. NASA Spec. Publ. 1974, 351, 309. [Google Scholar]
  22. Berthier, E.; Dupont, S.; Mestayer, P.G.; Andrieu, H. Comparison of two evapotranspiration schemes on a sub-urban site. J. Hydrol. 2006, 328, 635–646. [Google Scholar] [CrossRef]
  23. Shen, W.; Liu, Q.; Ji, M.; He, J.; He, T.; Huang, C. Impacts of urban forests and landscape characteristics on land surface temperature in two urban agglomeration areas of China. Sustain. Cities Soc. 2023, 99, 104909. [Google Scholar] [CrossRef]
  24. Kousis, I.; Pisello, A.L. Evaluating the performance of cool pavements for urban heat island mitigation under realistic conditions: A systematic review and meta-analysis. Urban Clim. 2023, 49, 101470. [Google Scholar] [CrossRef]
  25. Salvadore, E.; Bronders, J.; Batelaan, O. Hydrological modelling of urbanized catchments: A review and future directions. J. Hydrol. 2015, 529, 62–81. [Google Scholar] [CrossRef]
  26. Nukazawa, K.; Arai, R.; Kazama, S.; Takemon, Y. Projection of invertebrate populations in the headwater streams of a temperate catchment under a changing climate. Sci. Total Environ. 2018, 642, 610–618. [Google Scholar] [CrossRef]
  27. Galdos, F.V.; Álvarez, C.; García, A.; Revilla, J.A. Estimated distributed rainfall interception using a simple conceptual model and Moderate Resolution Imaging Spectroradiometer (MODIS). J. Hydrol. 2012, 468–469, 213–228. [Google Scholar] [CrossRef]
  28. Liu, X.; Chui, T.F.M. Evaluation of Green Roof Performance in Mitigating the Impact of Extreme Storms. Water 2019, 11, 815. [Google Scholar] [CrossRef]
  29. Yang, J.; Bou-Zeid, E. Scale dependence of the benefits and efficiency of green and cool roofs. Landsc. Urban Plan. 2019, 185, 127–140. [Google Scholar] [CrossRef]
  30. Wang, Z.; Bou-Zeid, E.; Smith, J.A. A coupled energy transport and hydrological model for urban canopies evaluated using a wireless sensor network. Q. J. R. Meteorol. Soc. 2013, 139, 1643–1657. [Google Scholar] [CrossRef]
  31. Sailor, D.J. A review of methods for estimating anthropogenic heat and moisture emissions in the urban environment. Int. J. Climatol. 2011, 31, 189–199. [Google Scholar] [CrossRef]
  32. Huang, J.; Kong, F.; Yin, H.; Middel, A.; Liu, H.; Meadows, M.E. Green roof effects on urban building surface processes and energy budgets. Energ. Convers. Manag. 2023, 287, 117100. [Google Scholar] [CrossRef]
  33. Chui, T.F.M.; Liu, X.; Zhan, W. Assessing cost-effectiveness of specific LID practice designs in response to large storm events. J. Hydrol. 2016, 533, 353–364. [Google Scholar] [CrossRef]
  34. Bouzouidja, R.; Séré, G.; Claverie, R.; Ouvrard, S.; Nuttens, L.; Lacroix, D. Green roof aging: Quantifying the impact of substrate evolution on hydraulic performances at the lab-scale. J. Hydrol. 2018, 564, 416–423. [Google Scholar] [CrossRef]
  35. Grimmond, C.S.B.; Blackett, M.; Best, M.J.; Barlow, J.; Baik, J.-J.; Belcher, S.E.; Bohnenstengel, S.I.; Calmet, I.; Chen, F.; Dandou, A.; et al. The international urban energy balance models comparison project: First results from phase 1. J. Appl. Meteorol. Climatol. 2010, 49, 1268–1292. [Google Scholar] [CrossRef]
  36. Grimmond, C.S.B.; Blackett, M.; Best, M.J.; Baik, J.; Belcher, S.E.; Beringer, J.; Bohnenstengel, S.I.; Calmet, I.; Chen, F.; Coutts, A.; et al. Initial results from Phase 2 of the international urban energy balance model comparison. Int. J. Climatol. 2011, 31, 244–272. [Google Scholar] [CrossRef]
Figure 1. (a) Location of the study area. (b) Land use classification of the study area.
Sustainability 16 05201 g001
Figure 2. NDVI class map of the study area on different dates.
Sustainability 16 05201 g002
Figure 3. Hydrographs of simulated and observed discharge, for rainfall events on 26 February 2018 (left) and 11 July 2018 (right).
Sustainability 16 05201 g003
Figure 4. The validation of the calculated and measured surface temperature with Landsat 8 (16 February 2017, 10 a.m.; 5 April 2017, 10 a.m.; 27 August 2017, 10 a.m.).
Sustainability 16 05201 g004
Figure 5. Spatial distribution of the accumulated evapotranspiration (ET) (mm) in each UHE of March and April 2017, November and December 2017, February and March 2018, and October and November 2018.
Sustainability 16 05201 g005
Figure 6. Spatial distribution of the simulated average surface temperature (LST) (°C) in each UHE area in (a) March and April 2018, (b) October and November 2018, and (c) June and July 2018 in the study area.
Sustainability 16 05201 g006
Figure 7. Time series of the simulated LST (daily average value) of UHE 4c-20 in the period of February to March 2018 (left), and June to July 2018 (right).
Sustainability 16 05201 g007
Figure 8. Spatial distribution of the simulated average surface temperature (LST) with (a) 80% of the current LAI, (b) 120% of the current LAI, and (c) 140% of the current LAI (°C in each UHE) in June and July 2018 (summer season) of the study area.
Sustainability 16 05201 g008
Figure 9. Variations of averaged LSTs (°C) and the total runoff volume (percentage) with changed LAI values in June and July 2018 (summer season).
Sustainability 16 05201 g009
Figure 10. Daily surface temperature values in August 2018 for different categories—entire catchment (all), forest catchment (forest), residential catchment (residential), and park catchment (park). (a) Average daily surface temperature values when LAI = current value; (b) maximum daily surface temperature values when LAI = current value; (c) average daily surface temperature values when LAI = 1.4 × current value; and (d) maximum daily surface temperature values when LAI = current value × 1.4.
Sustainability 16 05201 g010
Figure 11. Water balance components of UHEs with typical vegetation structure.
Sustainability 16 05201 g011
Figure 12. Effectiveness of different landscape patterns and their combinations for summer total runoff and average LST reduction.
Sustainability 16 05201 g012
Table 1. List of the data used in this study.
DataResolutionObtained from
Digital Elevation5 mMinistry of Land, Infrastructure, Transport and Tourism
Drainage pipe line data Sendai City Waterworks Bureau
Land use and cadastral map Sendai City Waterworks Bureau
Discharge of outlet5 min, 10 minIn situ measurement
Rainfall data0.2 mm, 0.5 mmIn situ measurement and Amedas
NDVI and surface temperature30 mLandsat 8 from USGS
LAI in certain site In situ measurement
Table 2. Reduction in runoff and surface temperature of summer 2018 by vegetation amount increasing.
LAITotal RunoffPeak RunoffAverage LST ReductionMaximum LST Reduction
Current × 0.8106.10%105.30%−1.4 °C−0.8 °C
Current × 1.0100.00%100.00%0 °C0 °C
Current × 1.294.6%95.4%1.2 °C0.9 °C
Current × 1.489.3%92.2%2.5 °C1.9 °C
Table 3. Typical vegetation structures in the study area.
Typical Landscape StructureRepresentative UHEMajor Plant TypeImpervious RatioAverage LAI
Urban park A2C-54Low shrubs (Ericaceae) and grassaround 39%1.798
Typical residential4c-4Street trees (Zelkova) and garden plantsaround 62%1.37
Natural greening3GrS-1Tall trees (deciduous), shrubs, and grass<10%3.026
Maintained greening3GrS-4Tall trees (deciduous) and a little grass<10%2.575
Commercial2C-1eAlmost no vegetation and several street trees>90%0.745
Table 4. Landscape patterns/GI strategies implemented on a whole-study-area scale.
Enhanced Greening Scenarios and AbbreviationsScenario DescriptionVegetation Changes Applied toNDVI Variation Series Prototype
Evergreen street trees (ES)All street trees were denser evergreen treesStreet area in all UHEsUHE: 3C-23
Denser planting of courtyard vegetation (DPC)Vegetation in garden was increased, major plant types were low shrubs and grassCourtyard area in all UHEsUrban park A: 2C-54
Denser planting of street trees (DPS)Street trees density was increased, major plant type was tree.Street area in all UHEsMaintained greening: 3GrS-4
Green Roof added (GR)Conversion of the original bare roofs to green roofs, major plant types were low shrubs and grassRoof area in all UHEsUrban park A: 2C-54
Disclaimer/Publisher’s Note: The statements, opinions and data contained in all publications are solely those of the individual author(s) and contributor(s) and not of MDPI and/or the editor(s). MDPI and/or the editor(s) disclaim responsibility for any injury to people or property resulting from any ideas, methods, instructions or products referred to in the content.

