Article

An Experimental Study Focusing on the Filling Process and Consolidation Characteristics of Geotextile Tubes Filled with Fine-Grained Tungsten Tailings

School of Infrastructure Engineering, Nanchang University, Nanchang 330000, China
*
Author to whom correspondence should be addressed.
Sustainability 2024, 16(12), 5270; https://doi.org/10.3390/su16125270
Submission received: 25 April 2024 / Revised: 17 June 2024 / Accepted: 18 June 2024 / Published: 20 June 2024
(This article belongs to the Section Soil Conservation and Sustainability)

Abstract

:
With advancements in mineral processing technology, the disposal of fine-grained tailings has increasingly become a significant challenge. The geotextile tube method, characterized by its use of a permeable fabric and its cost-effectiveness, has gradually been applied in dam construction and other engineering projects involving tailings. This method offers a novel approach to addressing the storage issues of fine-grained tailings and promotes sustainable utilization. In this paper, the fine tailings that remained after the cyclone classification of Ganzhou tungsten ore were taken as the research object. Specifically, this research endeavored to evaluate the effects of various filling heights and concentrations on the geotextile tube-filling and consolidation process. The results revealed that the filling concentration had a significant impact on the filling benefit of the geotextile tubes, while the filling height had a minimal effect. During the consolidation drainage stage, the dry density, internal friction angle, cohesion, and compression modulus of the tailings in the bags increased with an increasing consolidation time and filling concentration. However, the physical and mechanical properties of the tailings in the geotextile tubes decreased with an increased filling height. Ultimately, this research developed a hyperbolic equation that makes it possible to forecast the ultimate settlement value at various filling heights and concentrations, better representing how the settlement of geotextile tubes changes over the consolidation time.

1. Introduction

In recent years, with the improved utilization of mineral resources and level of mineral-processing technology, especially relating to the large-scale development of lean ore and complex refractory ore, it has become necessary to extract as many valuable elements in minerals as possible, resulting in the extraction of ore in the mineral-processing stage [1,2,3]. Grinding technology can achieve finer and finer results, and the particle size of tailings entering the tailings pond has become correspondingly finer [4,5,6]. In subsequent decades, the storage problem relating to fine-grained tailings gradually became the focus of engineering and technical personnel; however, the solutions remain limited [2,7,8]. Therefore, in the context of significant issues relating to tailings storage, geotextile tube technology has been improved and introduced into fine-grained tailings damming [9,10]. That is, a series of problems, such as poor permeability, a high infiltration line, and the low strength of tailings reservoirs, have been solved by filling tailings with geotextile tubes for damming [11,12]. The interaction between the geotextile tubes and the fine-grained tailings forms a whole that has the common characteristics of the two: a high tensile and compressive strength, and also being permeable to water and impermeable to slurry, etc. [13,14,15]. Years of engineering practice have shown that the tailing-filling geotextile tube method is an ideal method that provides significant societal, economic, and ecological benefits [16,17,18,19].
The initial use of geotextile tubes began in 1959 in Japan, when nylon geotechnical bags were filled with mortar during the repair of the Ise Bay cofferdam, introducing the domestic and international application of geotextile tubes [20]. The dam test of the Shanghai Yangtze River estuary ash bank, completed in 1985, featured the first application of the geotextile tube method in the construction of tailing ponds and dams, which subsequently migrated to other fields [10,21]. To control beach erosion along the northern coast of the state of Yucatan, Mexico, geotextile tubes were used as low-crested structures along 4 km of beach in the region [22]. Subsequently, geotextile tube technology was also applied in the construction of the Hong Kong–Zhuhai–Macao Bridge (HK-ZMB) [23]. Clay slurry-filled geotextile mats were used to construct dykes for land reclamation at Tianjin Port, China [24].
Although geotextile tubes are an effective method for resolving the difficulties of damming fine-grained tailings reservoirs, the long dewatering and consolidation times required for fine-grained tailing-filled geotextile tubes increase construction costs [25]. Furthermore, in terms of geotextile tube construction technology, the consolidation settlement of the tubes is directly linked to the stability and safety of the structure [11]. Therefore, numerous scholars have conducted extensive research experiments involving the filling of geotextile tubes with fine-grained tailings. Liu et al. [26] investigated the shape, height, tension, bottom pressure, and drainage velocity of geotube bags by conducting indoor-model filling tests. Koerner and Koerner [27] conducted field filling tests to compare the overall performance of geotextiles manufactured with different fillers and different geotextile tubes. Cui et al. [28,29] carried out experimental studies on the characteristics of geotextile tubes with fine-grained tailings and verified that geotextile tubes composed of geotextiles and fine-grained tailings could obtain a higher bearing capacity. From this, in order to study the consolidation characteristics of geotextile tubes after filling, many scholars combined theoretical research based on experiments [30,31,32]. Leshchinsky et al. [33] presented a computational procedure for analyzing stresses and geometric changes in geotextile tubes based on filling tests and discovered that the pumping pressure during filling is a critical factor in ensuring the proper construction of geotextile tubes. Muthukumaran Ilamparuthi [34] proposed an equation for the determination of critical water content and criteria for the retention of solids by studying the individual effects of factors like water content, the gradation of solids, and the size of the opening of the geotextile on the overall efficiency of the dewatering system. Yee and Lawson [35] developed an analytical model that accounts for dewatering behavior over multiple dewatering cycles, in order to achieve the desired final volume reduction and solid concentration increase in relation to geotextile tubes. Zhang et al. [36,37,38] proposed a two-dimensional plain–strain consolidation model for sludge consolidation in a geotextile tube under the conditions of a combined fill and vacuum preloading.
In the aforementioned research and existing engineering practices, the filling materials used in geotextile tubes predominantly consist of silt, sandy soils, and coarse-grained tailings that dewater and consolidate quickly. However, there are limited engineering cases and research findings concerning the use of fine-grained tailings with poor permeability for dam construction using the geotextile tube method. Most studies focus on performing a stress analysis when filling the geotextile tubes, with less attention given to settlement deformation, moisture content, and the strength of the tailings during the consolidation process after filling. Furthermore, there is a scarcity of comprehensive studies on the overall consolidation and settlement behavior of dams constructed with geotextile tubes using fine-grained tailings. Therefore, this paper focuses on fine-grained tailings from the Shilei Tungsten Mine in Dayu, Ganzhou, which have been classified through the use of hydrocyclones. Laboratory experiments were conducted to investigate the effects of different filling concentrations and filling heights on the filling and consolidation performance of geotextile tubes. The findings provide technical support relating to overall stability and consolidation settlement studies on the subsequent construction of a tailings dam using geotextile tubes at this tungsten mine. This research holds significant engineering implications for the sustainable use and promotion of fine-grained tailings in geotextile tube dam construction.

2. Materials and Methods

2.1. Test Materials

The fine-grained tailings used in this study were sourced from the Shilei Tungsten Mine in Dayu, Ganzhou, Jiangxi Province, China. These tailings were obtained as disturbed bulk samples after hydrocyclone classification and dewatering. The gradation of the classified fine-grained tailings was determined using the sieving method and hydrometer analysis. Figure 1 shows the particle-size distribution curve of the classified tailings. The uniformity coefficient Cu of the classified tailings is 3.8, the coefficient of curvature Cc is 1.1, and the particle content at <0.075 mm is 69.04%. The particle-size range with the highest content is 0.03 mm to 0.1 mm, accounting for approximately 60% of the total content. According to the test results, the tailings in this test are fine-grained tailings [39].
The selection of the woven-polymer-material geotextile used in the tubes and its main parameters and indicators are shown in Table 1.

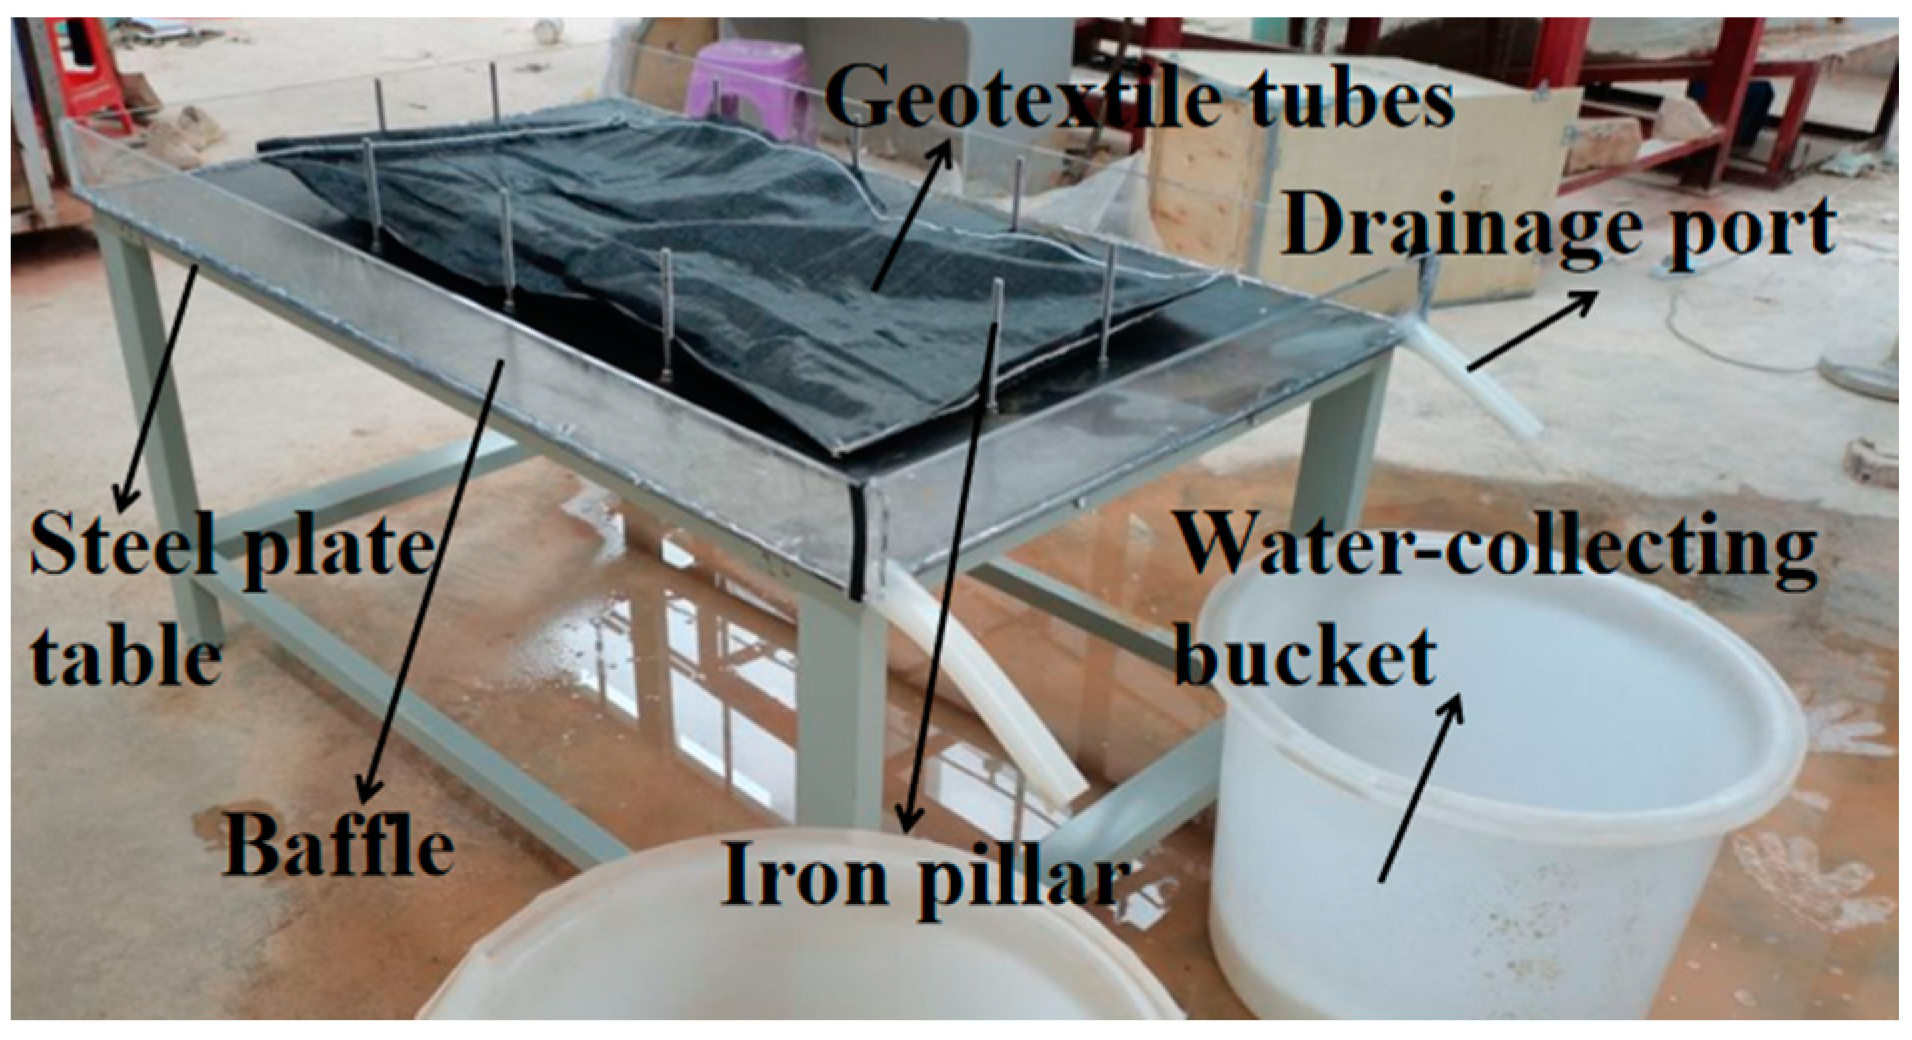
2.2. Testing Instruments

The test was carried out using a custom-made stainless steel-plate table, as shown in Figure 2. The size of the plate table is 1 m × 1.6 m. The steel plate table contains 10 iron 20 cm-long pillars, which are used to fix the position of the geotextile tubes. A Plexiglas border is used, and drainage ports are present on both sides to enable the displacement of the filling geotextile tubes to be recorded. The length of the geotextile tubes used in the tailing damming project approaches 50 m, while their width ranges between 6 and 8 m, and the aspect ratio of the geotextile tubes on site is large enough. In this study, the tested geotextile tubes were scaled down; their width was 0.6 m width, and their length was 1.2 m.

2.3. Experimental Design
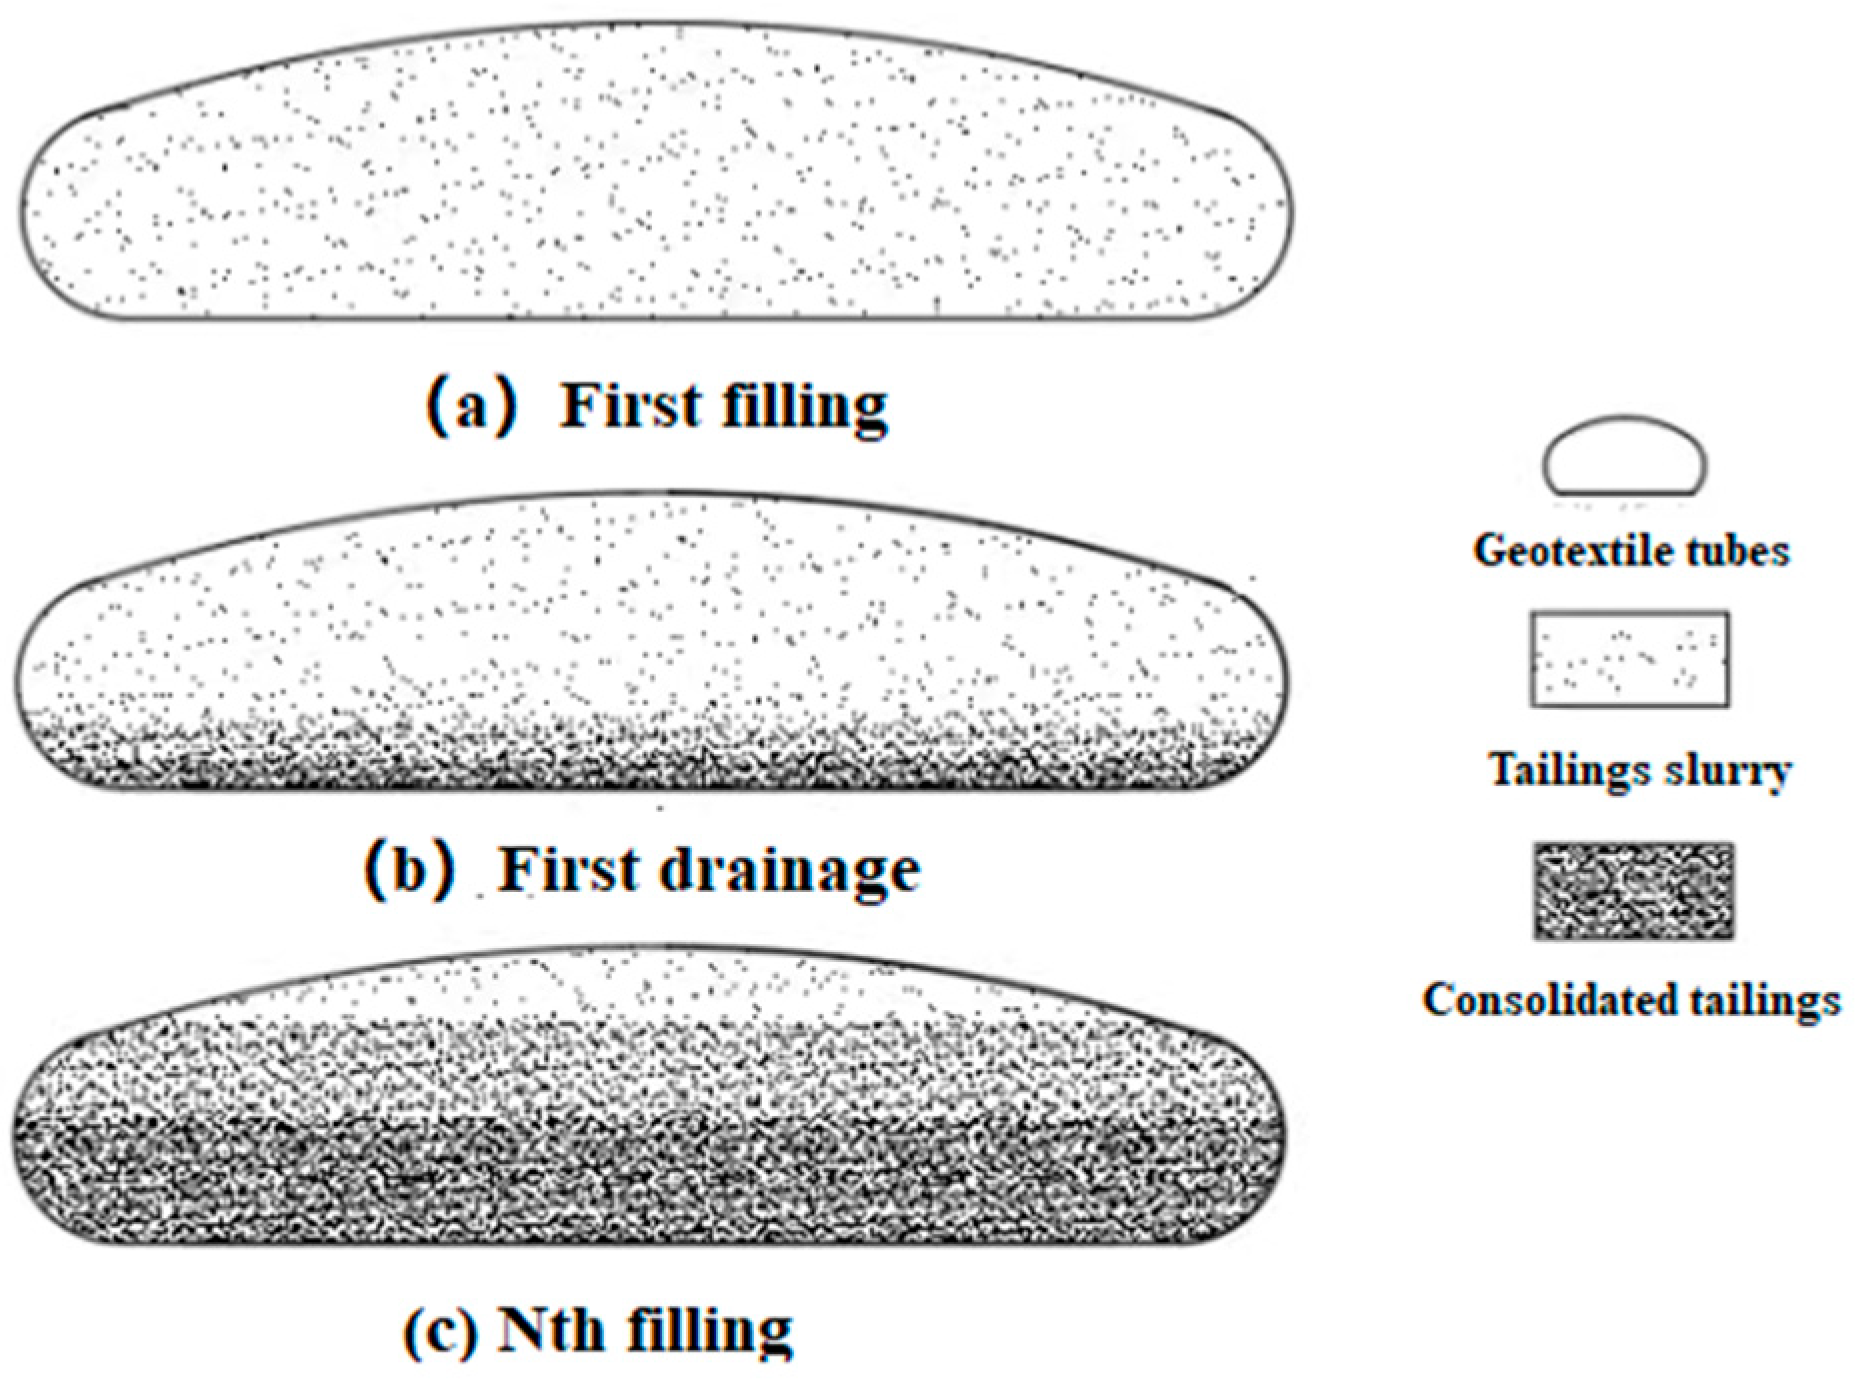
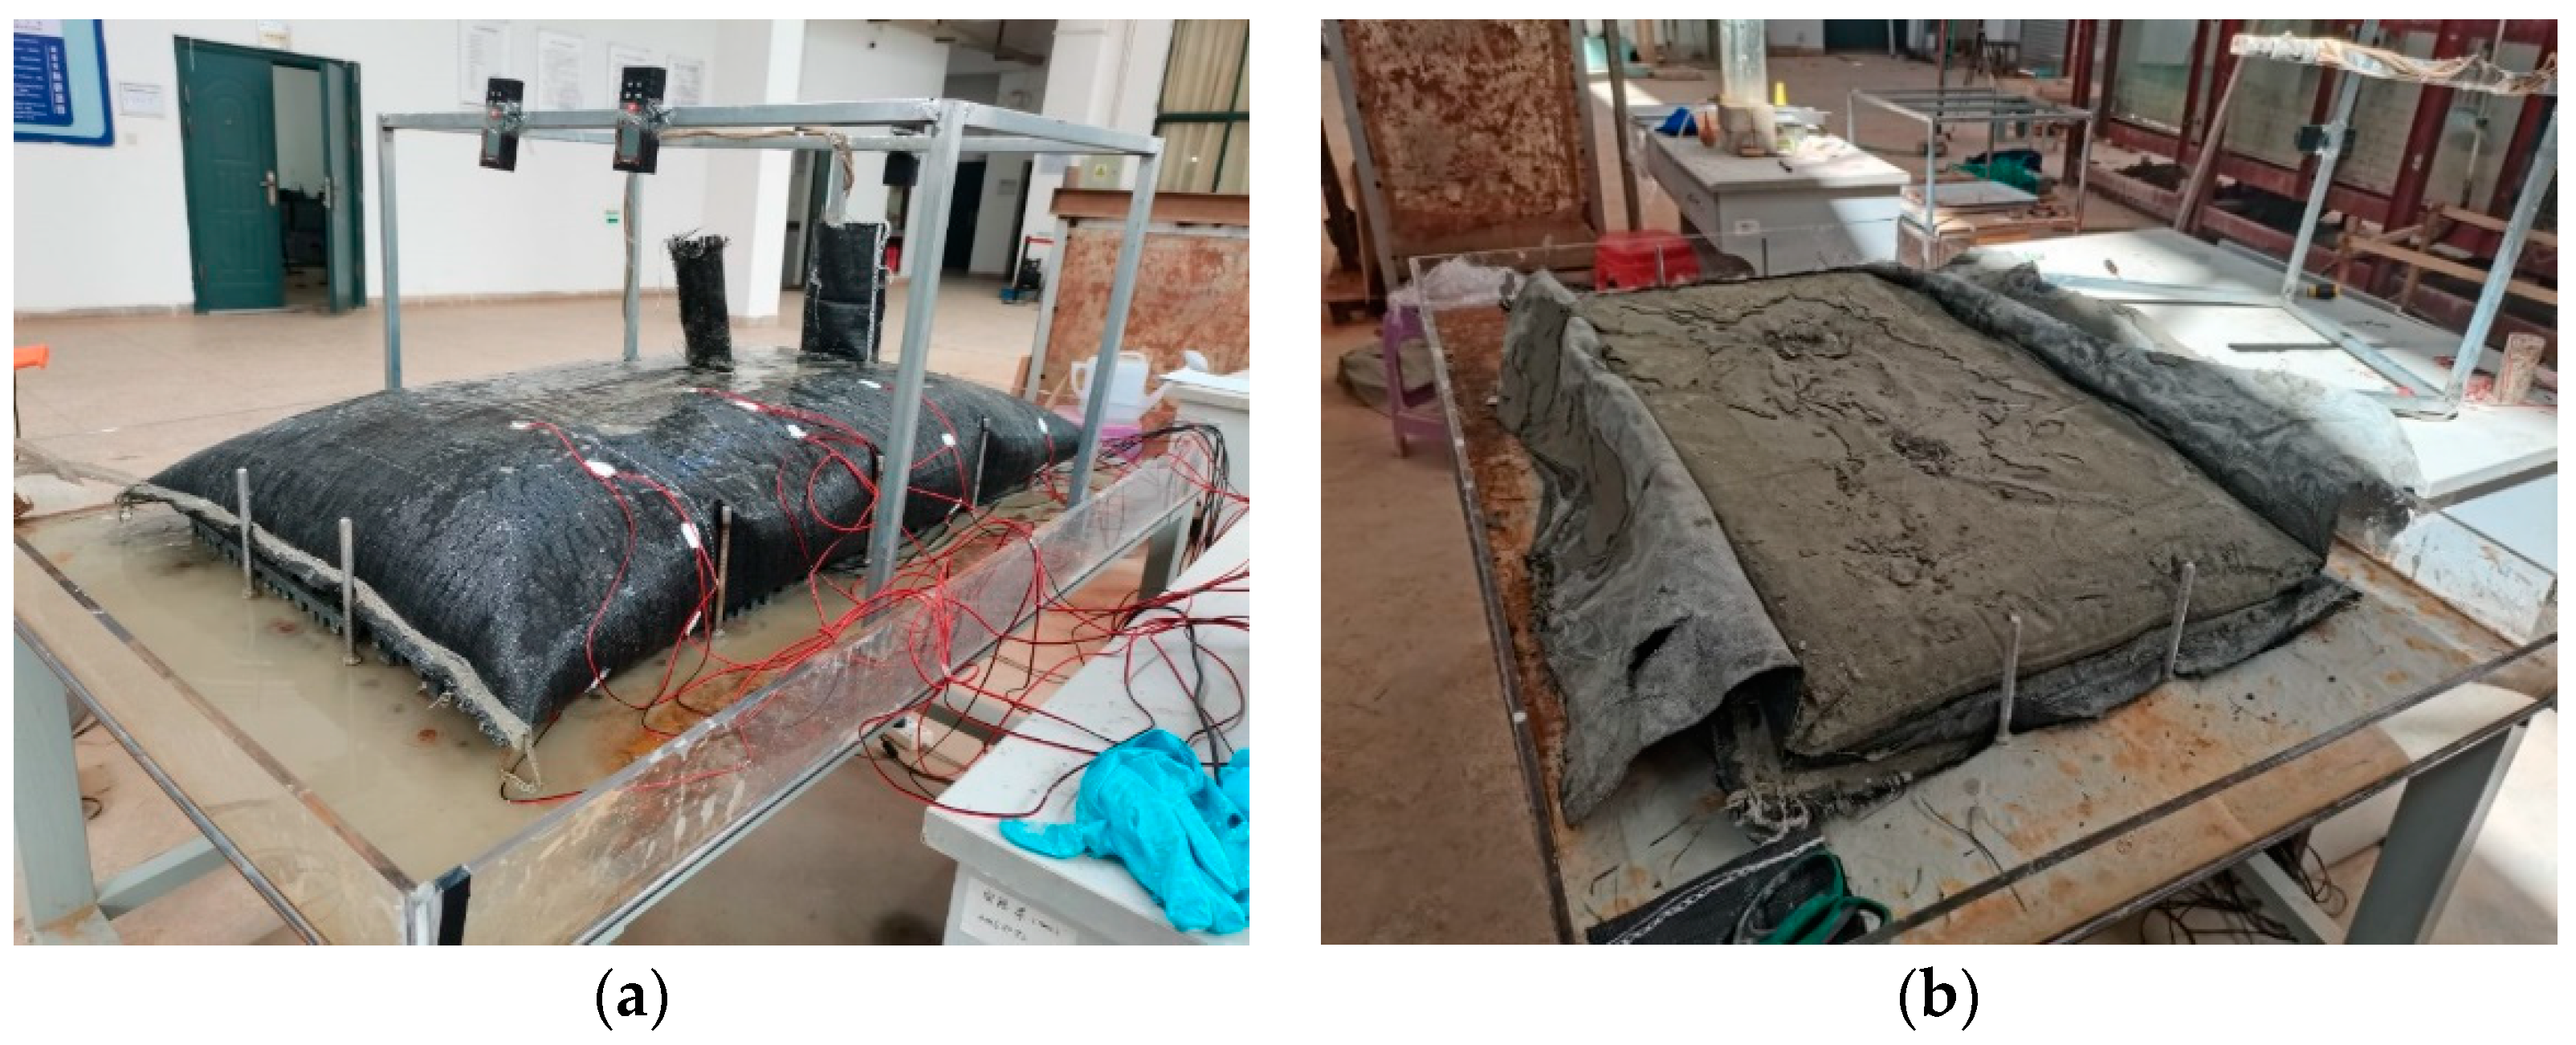
The experimental design consists of two main stages: filling the geotextile tubes and studying the consolidation characteristics post-filling. Initially, we referenced the full-particle-gradation tailings-filling experiment by Fu et al. [40]. Their findings indicated that the reinforcement effect was optimal when the tailings volume occupied 75% to 85% of the bag volume. Therefore, to fully utilize the encapsulation and constraint effects of the geotextile tube material, the filling standard was set to 85%. This means the height of the consolidated tailings inside the bag should reach 85% of the maximum filling height of the tube when drainage is complete.
This study primarily investigated the influence of three factors on the consolidation effects: filling concentration, filling height, and consolidation time. The filling concentration is defined as the ratio of the dry tailings mass to the mass of the mixed tailings slurry. Based on practical experience with geotextile tube dam construction, the filling concentrations were set to 25%, 40%, and 60%. To ensure the filling degree reached 85%, the dimensions of the geotextile tubes were pre-calculated before sewing to achieve the target filling height under specified conditions. Considering cross-sectional size effects and equipment limitations, the target filling heights were set to 7 cm, 10 cm, and 13 cm. As a single filling could not reach the predetermined height, a cyclic filling and drainage method was employed, with each cycle recorded to study the filling efficiency under different height and concentration conditions.
To study the changes in the strength of fine tailings inside the geotextile tube over time under different filling concentrations and heights after the filling stage, samples were taken from the geotextile tubes after 5, 10, and 15 days of consolidation. Indoor tests were conducted to measure the moisture content, dry density, shear strength indicators, and compression modulus of the tailings inside the tube. To avoid multiple samplings from the same tube, which could affect subsequent consolidation, three parallel tests were set up to study the changes in the physical and mechanical properties of the tailings over different consolidation times. Finally, the effect of different filling concentrations and different filling heights on the filling efficiency and physico-mechanical properties of the geotextile tubes, and the self-weight consolidation law of the geotextile tube over time, were deduced from the test. A total of 5 groups were set up in the experiment; the specific scheme is shown in Table 2.

2.4. Test Methods

A geotechnical fabric was used for the geotextile tubes presented in this study. The material selected to sew the geotextile tubes together was a textile thread with a high strength and low fineness, and a grouting port was reserved in the middle position of the geotextile tubes, so that the grouting machine could fill the tail mortar into the geotextile tubes. Prior to the test, the fine-grained tailings were placed in a ventilated area, and large pieces of tailing were sufficiently crushed to allow them to dry naturally. Firstly, the tailings with the configured concentration were fully mixed in a bull barrel, and the sewn geotextile tubes were laid flat on the test bench of the glass water tank. The geotextile tube-filling test involves multiple filling and draining steps, as shown in Figure 3.
The tailings slurry was mixed to form a uniform grout, and the grouting start time of t0 was recorded; when the degree of geotextile tube filling reached 100%, filling was stopped, and the time t11 was recorded. After the geotextile tubes entered the drainage stage, the suspension in the geotextile tubes outflowed via the aperture, and at the end of the drainage stage, the time t12 was recorded, along with the height of the body of the geotextile tube, H12, which was recorded as the end of the one-time filling. At the same time, the second grouting was started, and when the filling degree of the geotextile tubes again reached 100%, filling was stopped, and time t21 was recorded; subsequently, the complete drainage of the geotextile tubes was recorded as time t22 and their height as H22, which was recorded as the end of the second filling. This procedure was repeated to record the time and height as follows: t31, t32, H32; ……; tn1, tn2, Hn2. The filling process was repeated every 10–20 min to record the time, height, and drainage until reaching the final height of the geotextile tube after drainage, Hn2, and filling was stopped after reaching the target height.
After the tailings slurry filled the geotextile tubes, free water was discharged through the pores of the geotextile tubes, and the tailings particles were retained in the geotextile tubes. With the gradual deposition of tailing particles, the permeable pore area at the bottom of the geotextile tubes decreased, the permeability of the bottom of the geotextile tubes gradually deteriorated, and most of the free water was discharged from the sides and the top of the geotextile tubes due to hydrostatic pressure; the drainage and consolidation of the geotextile tubes are shown in Figure 4.

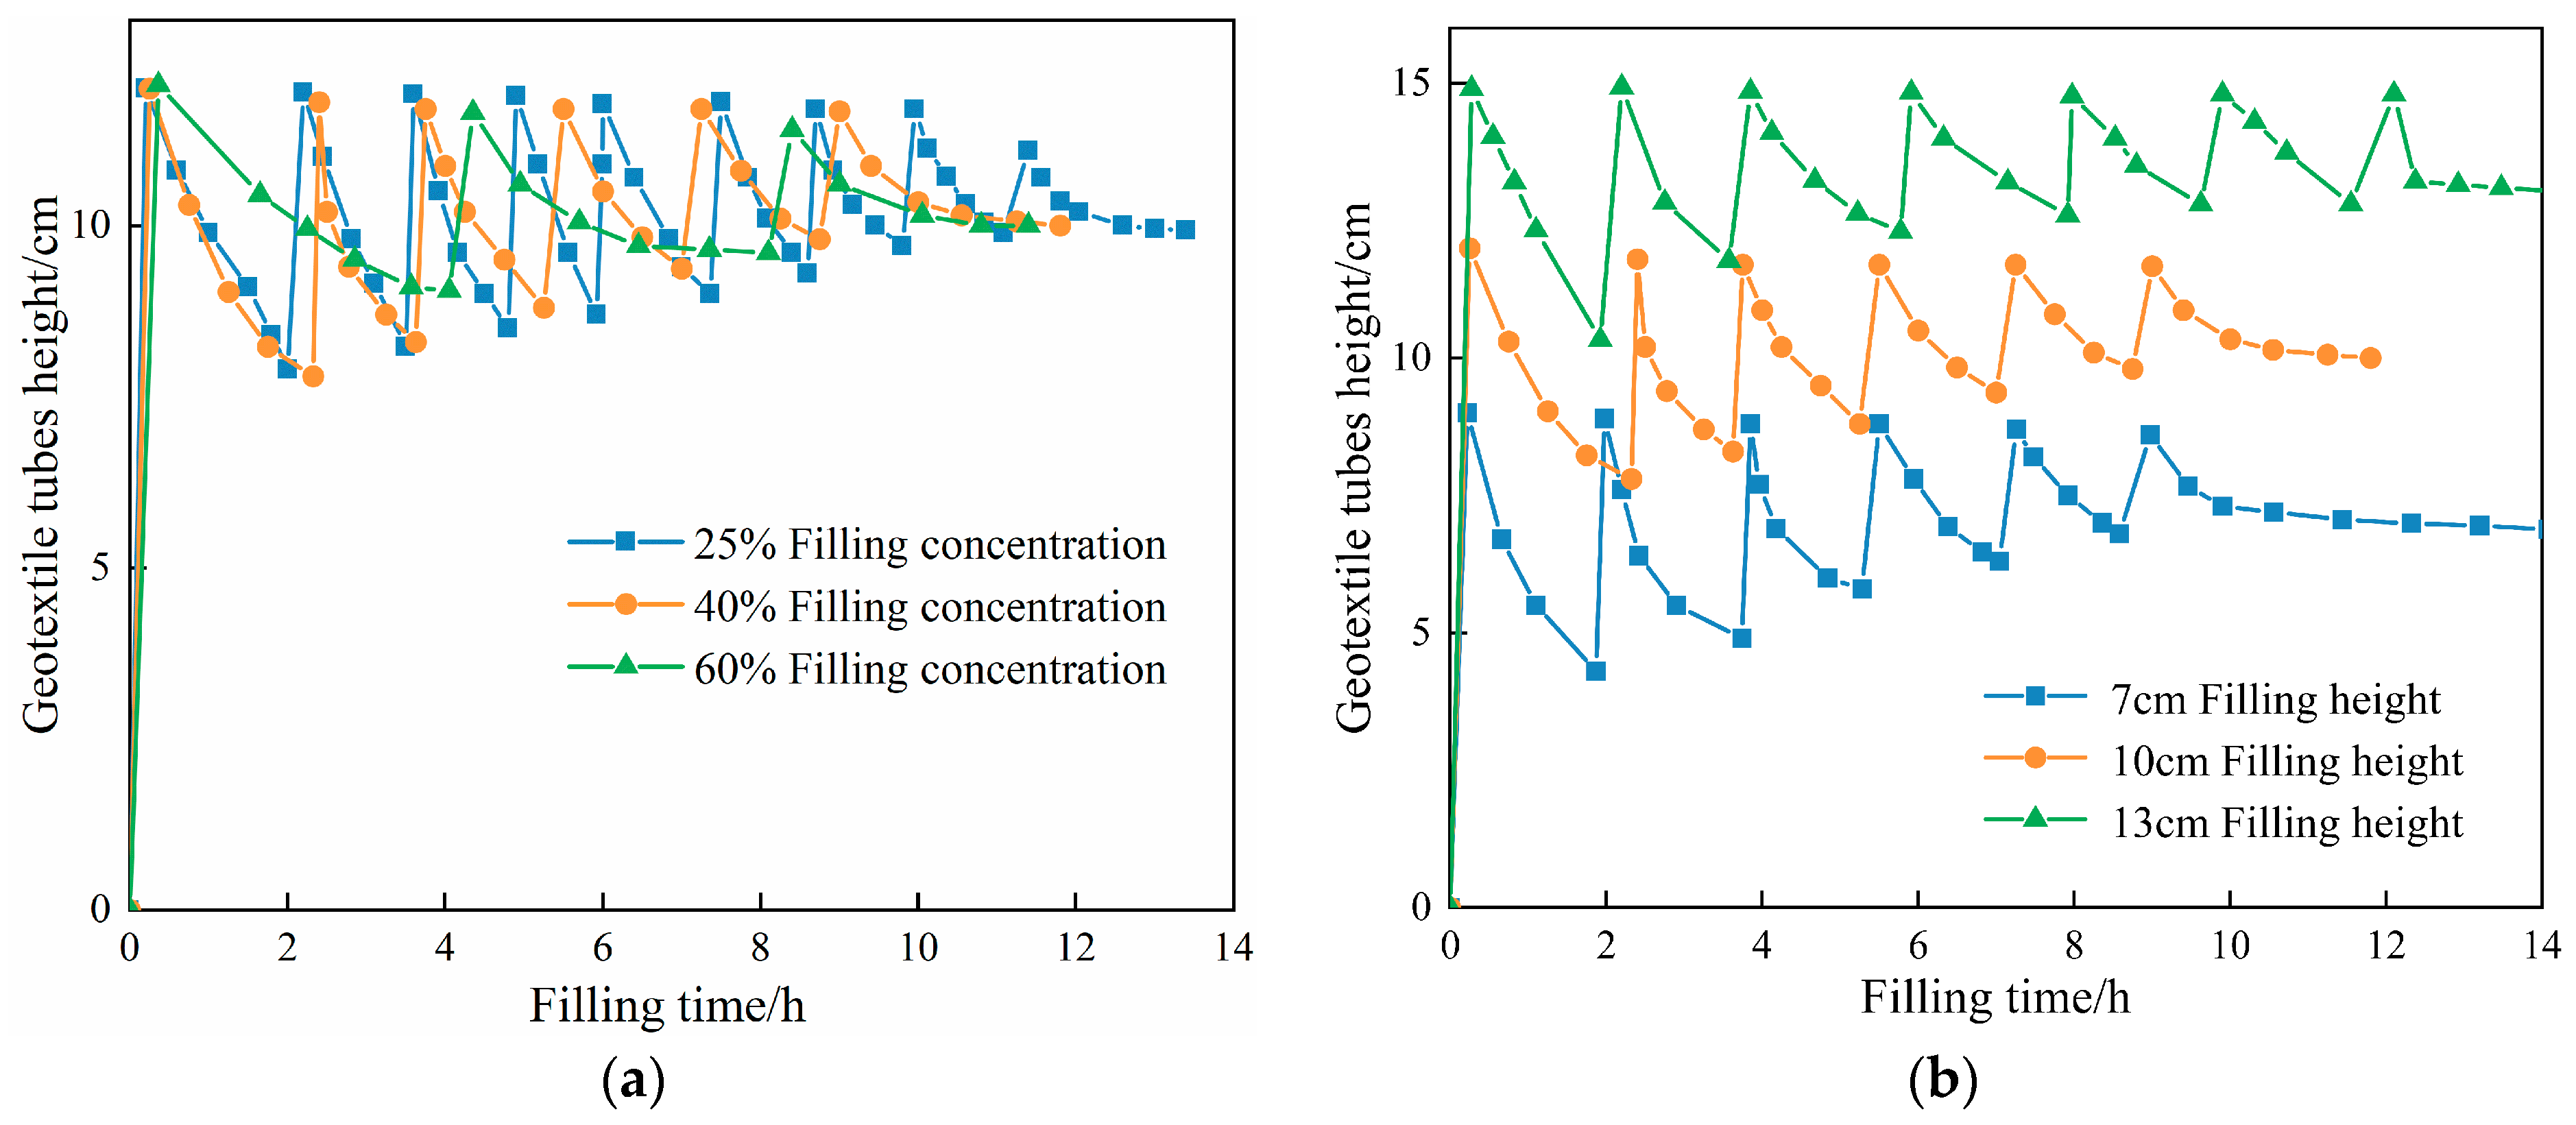
3. Analysis of the Results of the Geotextile Tube-Filling Stage

Based on the experimental plan, filling tests were performed, and laser rangefinder data and the level of water discharge were periodically recorded. The data were organized to derive and analyze the variation patterns relating to drainage rate and volume with time at different filling concentrations and heights.
Figure 5a shows the change relating to the height of the geotextile tubes under different filling concentrations, from which it can be seen that different filling concentrations have obvious effects on the number of tailing-filling steps. With a filling concentration from 25% to 60%, the number of filling times was reduced from nine times to six times and six times to three times. The first time intervals used for the geotextile tubes were 2.0 h, 2.3 h, and 4.1 h, respectively, and it can be seen that the higher the filling concentration, the longer the interval between drainage times. However, due to the number of filling times, the time required for the geotextile tube-filling process showed a decreasing trend with an increasing filling concentration, from 14.0 h for a 25% filling concentration to 11.0 h for a 60% filling concentration.
Figure 5b shows the changes in geotextile tube height in the case of different filling heights; different filling heights do not have a significant effect on the number of times that a geotextile tube was filled. With a filling height from 7 cm to 13 cm, the number of fillings is still six times. The time required to fill the geotextile tubes with an increasing height shows a larger trend, from 11.4 h required for a filling height of 7 cm to 13.5 h required for a filling height of 13 cm. This is a result of the geotextile tube body filling process, which involves numerous filling and draining cycles. The quantity of tailing mortar filling the bag is directly proportional to the increased target filling height, necessitating longer filling times.
The total drainage volume of different filling concentrations during the filling stage is shown in Figure 6. The drainage volume increased gradually with the filling, and when the filling finished, the total drainage volumes of the 25%, 40%, and 60% filling concentrations were 109.12 L, 46.98 L, and 22.76 L, respectively, showing that the total drainage volume is inversely correlated with the filling concentration. Figure 7 shows the changes in drainage volume in the case of different heights; the drainage volume gradually increased with an increased filling height, and at the end of the filling stage, the total drainage volume of the 7 cm, 10 cm, and 13 cm filling heights was 33.55 L, 46.98 L, and 63.87 L, respectively. The total drainage volume positively correlated with filling height.
Concerning the geotextile tube-filling stage, it was observed that both the number of filling cycles and the drainage volume decrease as the filling concentration increases. Higher filling concentrations result in longer intervals between drainage cycles; however, due to the reduced number of filling cycles, the total time required for the filling process decreases with higher concentrations. In terms of filling efficiency, a 25% concentration requires more filling cycles and longer drainage times, resulting in lower efficiency, whereas a 60% concentration requires fewer filling cycles and shorter drainage times, yielding the highest efficiency. Combined with Zhou’s [41] experiments with graded and ungraded tailings, this effect is mainly thought to be due to the characteristics of fine-grained tungsten tailings, which have a low effective specific gravity, a large specific surface area, and a slow settling velocity. At lower filling concentrations, the relative content of fine tailings per unit volume is lower, leading to less deposition in a short period and more fine tailings remaining in suspension and being carried out with the water, increasing tailing overflow outside the tube. Conversely, at higher filling concentrations, the relative content of fine tailings per unit volume is higher, resulting in greater interactions between the tailings, slowing down drainage through the pores of the geotextile and lengthening the deposition time. As the filling height increases, the interval between single drainage events becomes longer, increasing the overall time required for the filling process. However, the total drainage volume and the maximum drainage rate also increase, and the number of filling cycles remains unchanged. Thus, filling height has minimal impact on the filling efficiency of the geotextile tubes. The increase in the interval between single drainage events is mainly due to the higher filling height, meaning that more tailing slurry accumulates inside the tube, increasing the water content and extending the drainage path, resulting in longer single drainage times.

4. Analysis of the Results of the Geotextile Tubes Consolidation Phase

4.1. Analysis of Geotextile Tubes Consolidation Settlement

Upon completion of the filling process, the consolidation and settlement phases ensued. The height variations of the geotextile tubes correlating with consolidation time were carefully monitored over a consecutive 15-day period. The collected data were then plotted graphically to facilitate a comprehensive analysis of the consolidation and settlement trends.
Figure 8 illustrates the changes in the height of the geotextile tubes over time at different concentrations. As depicted in the figure, the height of the geotextile tubes decreased with the increase in consolidation time. At the end of 15 days of consolidation, the height of the geotextile tubes reduced to 6.35 cm, 7.23 cm, and 7.66 cm for 25%, 40%, and 60% filling concentrations, respectively. The amount of geotextile tube settlement significantly decreased as the filling concentration increased. It is noteworthy that higher filling concentrations resulted in the faster consolidation and greater stability of the bag. Geotextile tubes with high filling concentrations contain more tailing particles, leading to significantly enhanced particle contact and interaction. This enhancement results in a denser particle structure, effectively reducing potential settlement during consolidation. Furthermore, the densely packed voids facilitate more efficient water expulsion, accelerating the consolidation process and significantly enhancing the overall stability of the geotextile tube.
Figure 9 presents the variations in the height of the geotextile tubes under different filling heights. It can be observed that the height change in the geotextile tubes differs with different filling heights. After 15 days of consolidation, the heights of the geotextile tubes for filling heights of 7 cm, 10 cm, and 13 cm are 4.50 cm, 7.23 cm, and 9.91 cm, respectively. The corresponding settlements are 2.50 cm, 2.77 cm, and 3.09 cm. Furthermore, it can be observed that the consolidation settlement time for geotextile tubes under different filling heights tends to stabilize at approximately 12 days. Based on the reinforcement mechanism of the geotextile tube [42], higher filling heights result in greater loads and increased hydrostatic pressure at the bottom of the tube. The increased load and hydrostatic pressure exert a greater counterforce on the tailings, leading to greater settlement.

4.2. Hyperbolic Analysis of Geotextile Tubes Consolidation Settlement

A hyperbolic form is mostly used in foundation settlement calculations to fit the calculation of consolidation settlement, and at the same time, the consolidation of fine-grained tailings has a similar nature to that of foundation consolidation [43]. Therefore, in order to explore the relationship between the settlement of geotextile tubes and time and predict the final settlement of the geotextile tubes, a hyperbolic form was used to fit the relationship between foundation settlement and time [44], and the hyperbolic formula is as follows:
s t = s t α + t
where α represents a constant to be determined to reflect the consolidation properties of the geotextile tubes; st represents the degree of geotextile tube settlement at a certain time; s represents the final settlement of the geotextile tubes; and t represents the time corresponding to the settlement.
Equation (1) is organized as a relation between t/st and t:
t s t = 1 s t + α s
The values of t/st were calculated, and the relationship curves between t/st and t were plotted, respectively, using the settlement data provided in Figure 10. It shows the relationship curve between t and t/st under different filling concentrations, demonstrating that the fitting coefficients R2 of different filling concentrations are all above 0.997, indicating that the hyperbolic method can better reflect the change law of geotextile tube settlement. Therefore, we can obtain the results of the 25%, 40%, and 60% concentrations of the final settlement, which were 4.33 cm, 3.04 cm, and 2.51 cm.
The solidification degree of a certain time period can be obtained via the ratio of the settling amount and the final settling amount obtained from the calculation. Figure 11 shows the relationship between the solidification degree and time under different filling concentrations, and it can be seen from the figure that the solidification degree of the geotextile tubes increases with an increased filling concentration in the same time period; when the solidification is 15 d, the solidification degrees under 25%, 40%, and 60% filling concentrations are 84.2%, 91.1%, 93.2%, 93.2%, and 93.2%, respectively.
The settlement of the geotextile tubes under different filling heights was calculated and analyzed. Figure 12 shows the relationship between t and t/st under different filling heights, and it can be obtained that the final settlements under 7 cm, 10 cm, and 13 cm filling heights are 2.747 cm, 3.040 cm, and 3.386 cm, respectively.
Figure 13 illustrates the relationship between consolidation degree and time for different filling heights. As shown in the figure, within the first 12 days of consolidation, the degree of consolidation decreases with an increase in filling height. After 12 days, the degree of consolidation for geotextile tubes with different filling heights stabilizes. It is evident that reducing the filling height shortens the time required to reach the predetermined degree of consolidation. The degrees of consolidation after 15 days are 91.00%, 91.12%, and 91.26%, respectively.

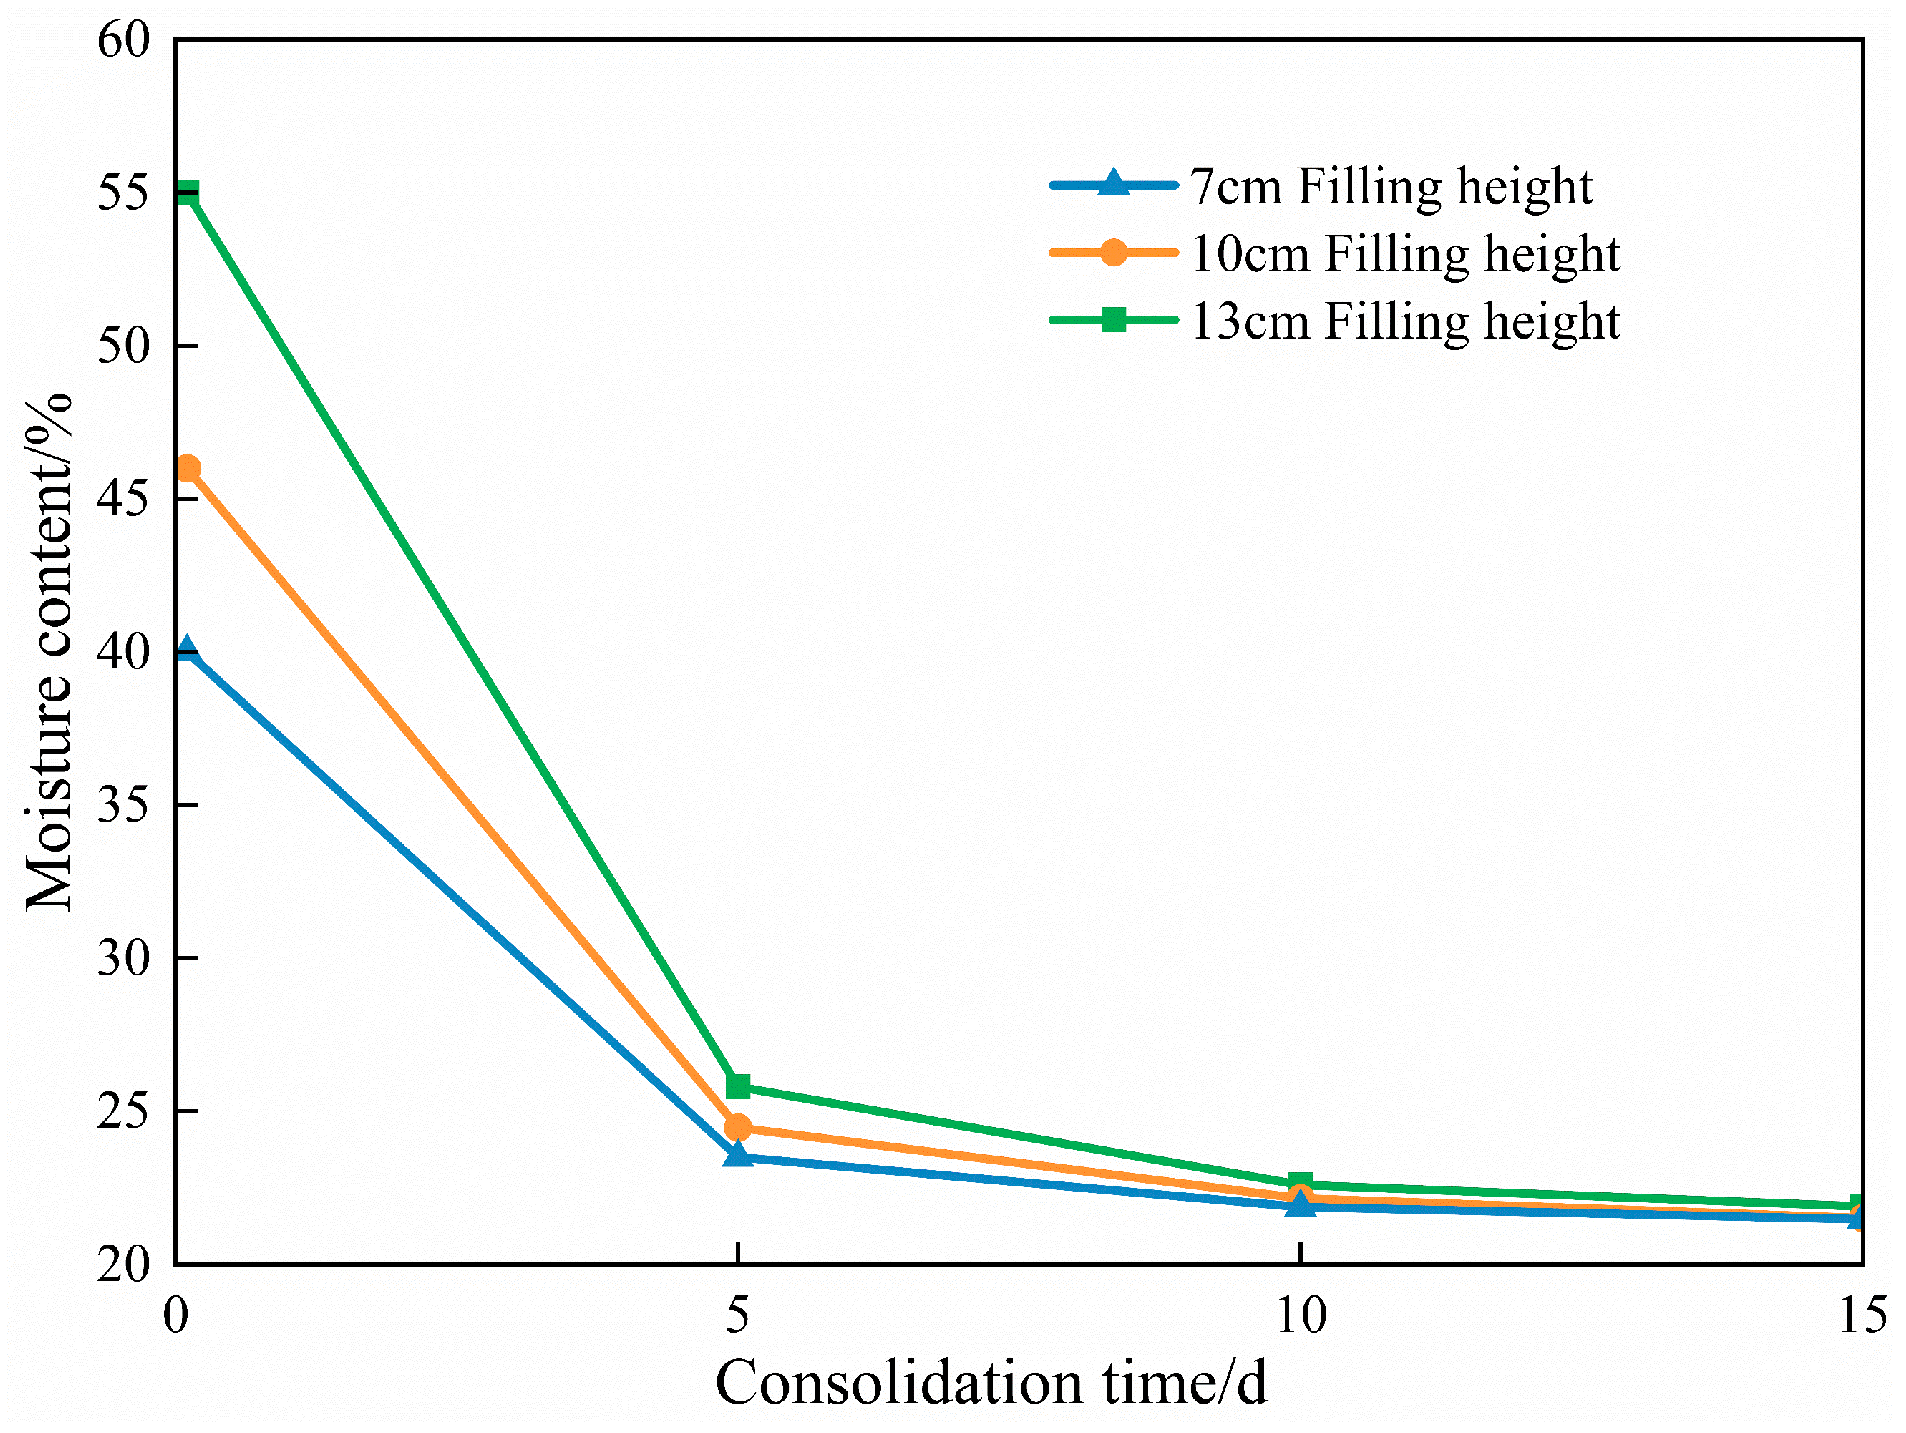
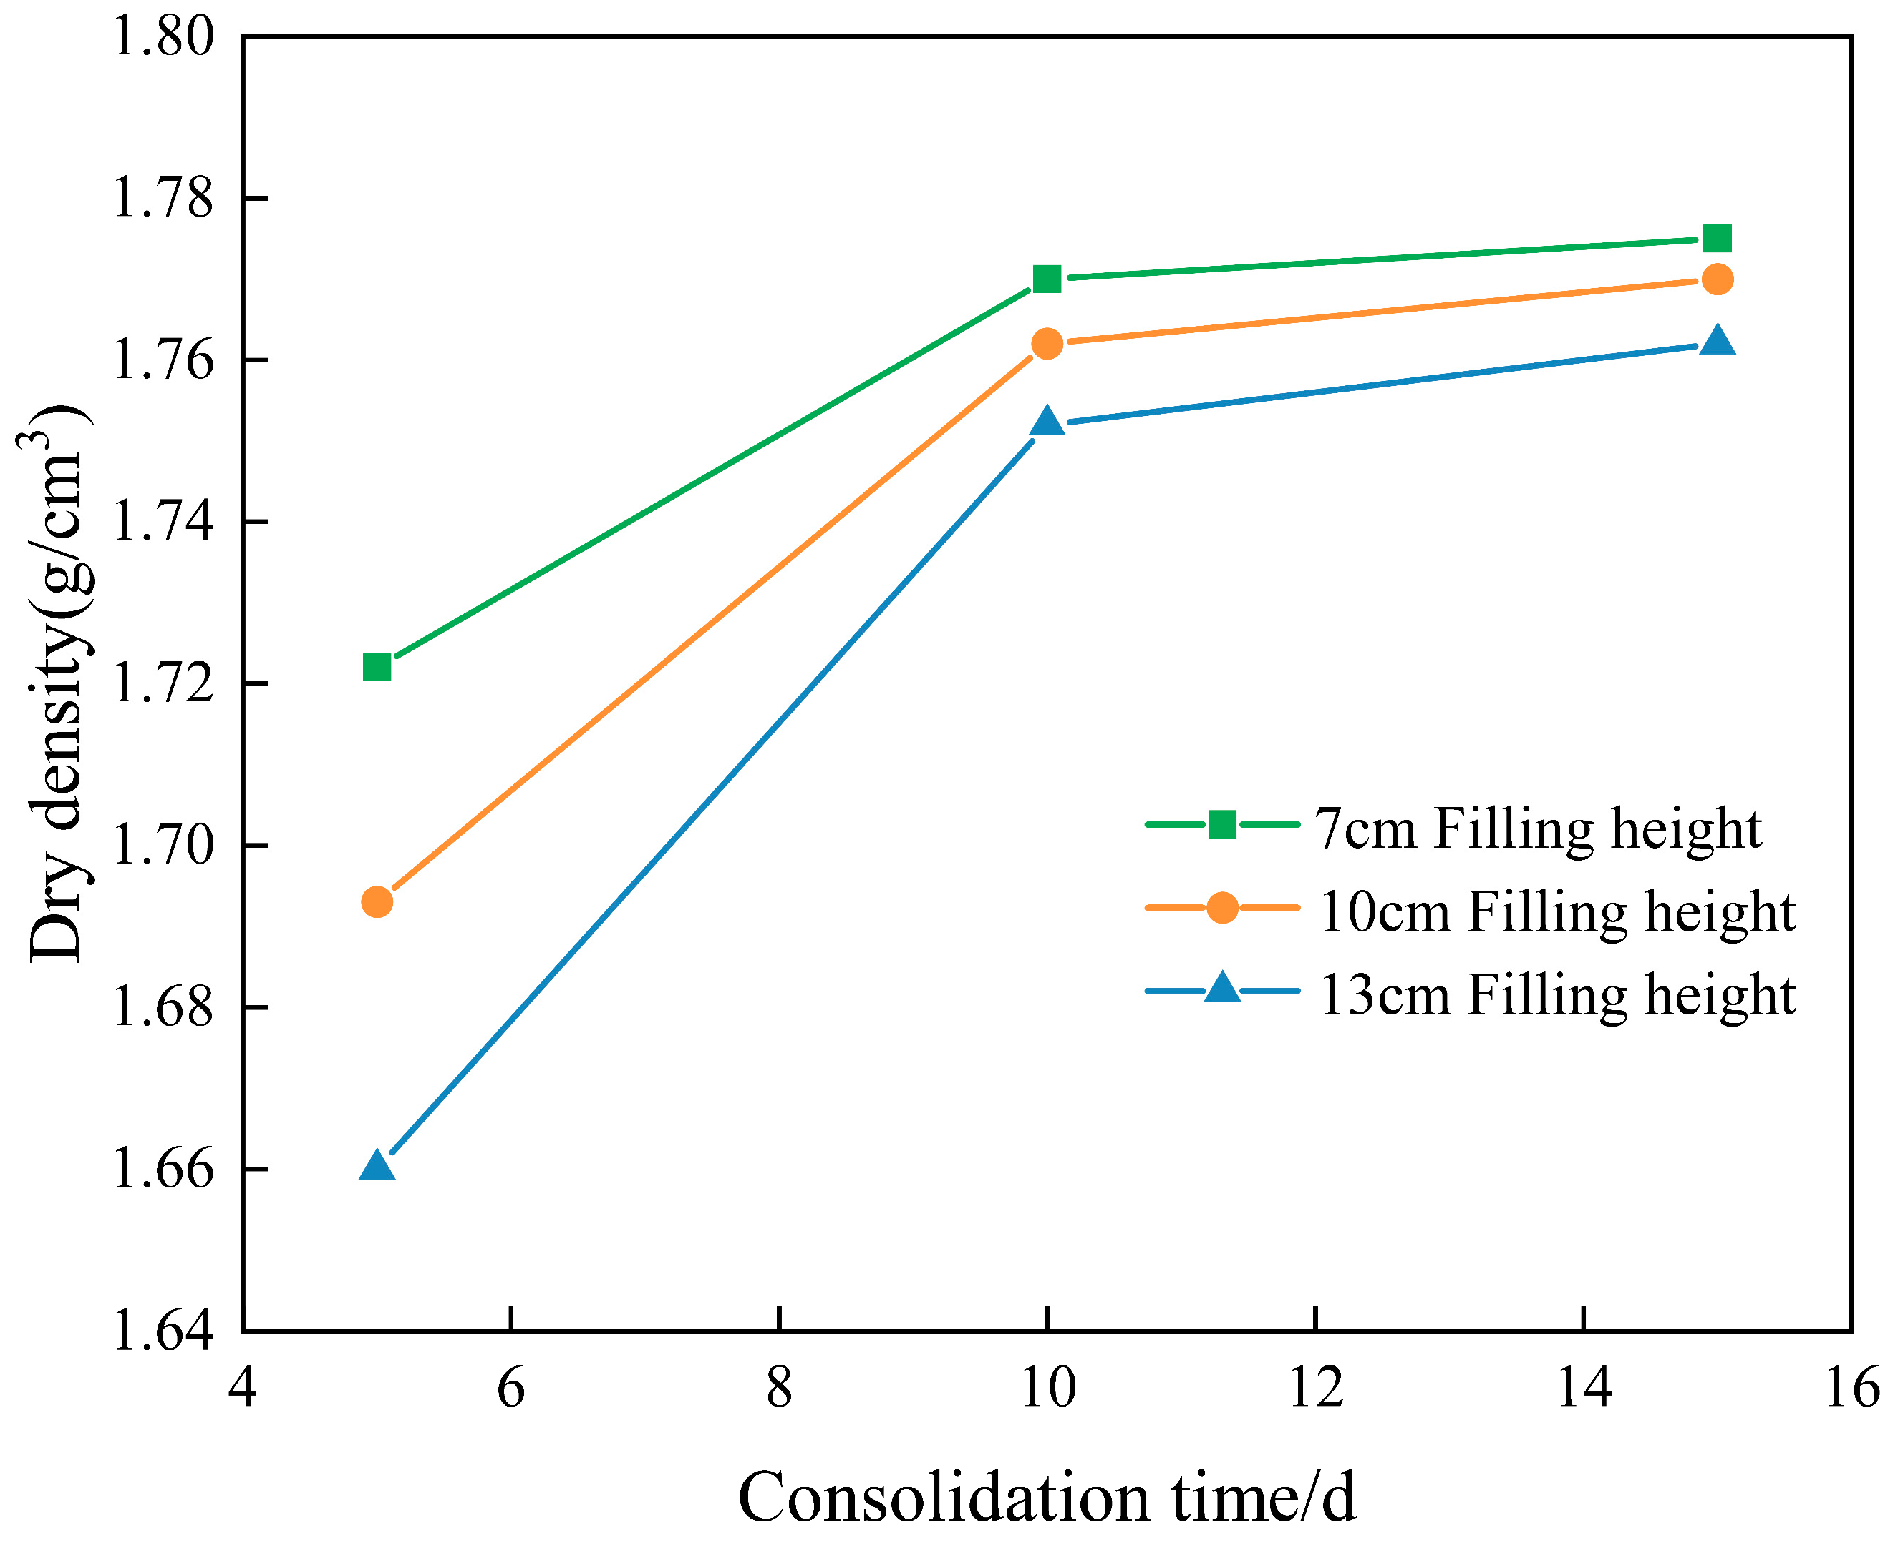
4.3. Analysis of Physical Properties of Geotextile Tube Consolidation

In order to explore the changes in water content with consolidation time during the geotextile tube consolidation process, the tailings in the geotextile tubes were sampled and measured for water content after consolidation for 5 d, 10 d, and 15 d, respectively. Figure 14 shows the change rule relating to the water content of the geotextile tubes with consolidation time under different filling concentrations; it can be seen from the figure that, at the beginning of consolidation within 5 d, the water content decreases sharply, but with increasing time, the rate of water content decrease becomes smaller; in the case of geotextile tube consolidation after 10 d, a water content of 40% with a 60% filling concentration gradually tends towards stability, while the water content of tailings under a 25% filling concentration decreases. When consolidated for 15 d, the water contents at 25%, 40%, and 60% filling concentrations were 22.8%, 21.5%, and 20.8%, respectively. Figure 15 shows the variations in tailing dry density with consolidation time. As consolidation progresses, the dry density increases, but the rate of increase gradually slows down over time. This trend is due to the increasing inhomogeneity of tailing particles with higher filling concentrations, leading to a tighter interparticle contact that results in a higher dry density.
Figure 16 shows the water content of the geotextile tubes under different filling heights in relation to the solidification time change rule. With an increased solidification time, the water content of the geotextile tubes decreases, and this decreasing tendency slows down gradually. The water content of geotextile tubes under different filling heights decreases with time to a significantly different degree. The water content found for the case of solidification after 5 days was 25%, while the water content of solidification after 10 days was basically the same. Therefore, the higher the filling of the geotextile tubes, the quicker the decrease in water content. When the geotextile tubes were consolidated for 15 d, the water content at different filling heights was similar. Figure 17 illustrates the variation of tailings dry density and consolidation time under different filling heights. It can be observed that the higher the filling height, the lower the dry density, resulting in poorer consolidation performance. This phenomenon occurs because the increased filling height elevates pore water pressure and drainage difficulty, making it challenging for tailings particles to sufficiently contact and compact. Consequently, the dry density and compaction degree decrease, leading to inferior consolidation effectiveness.

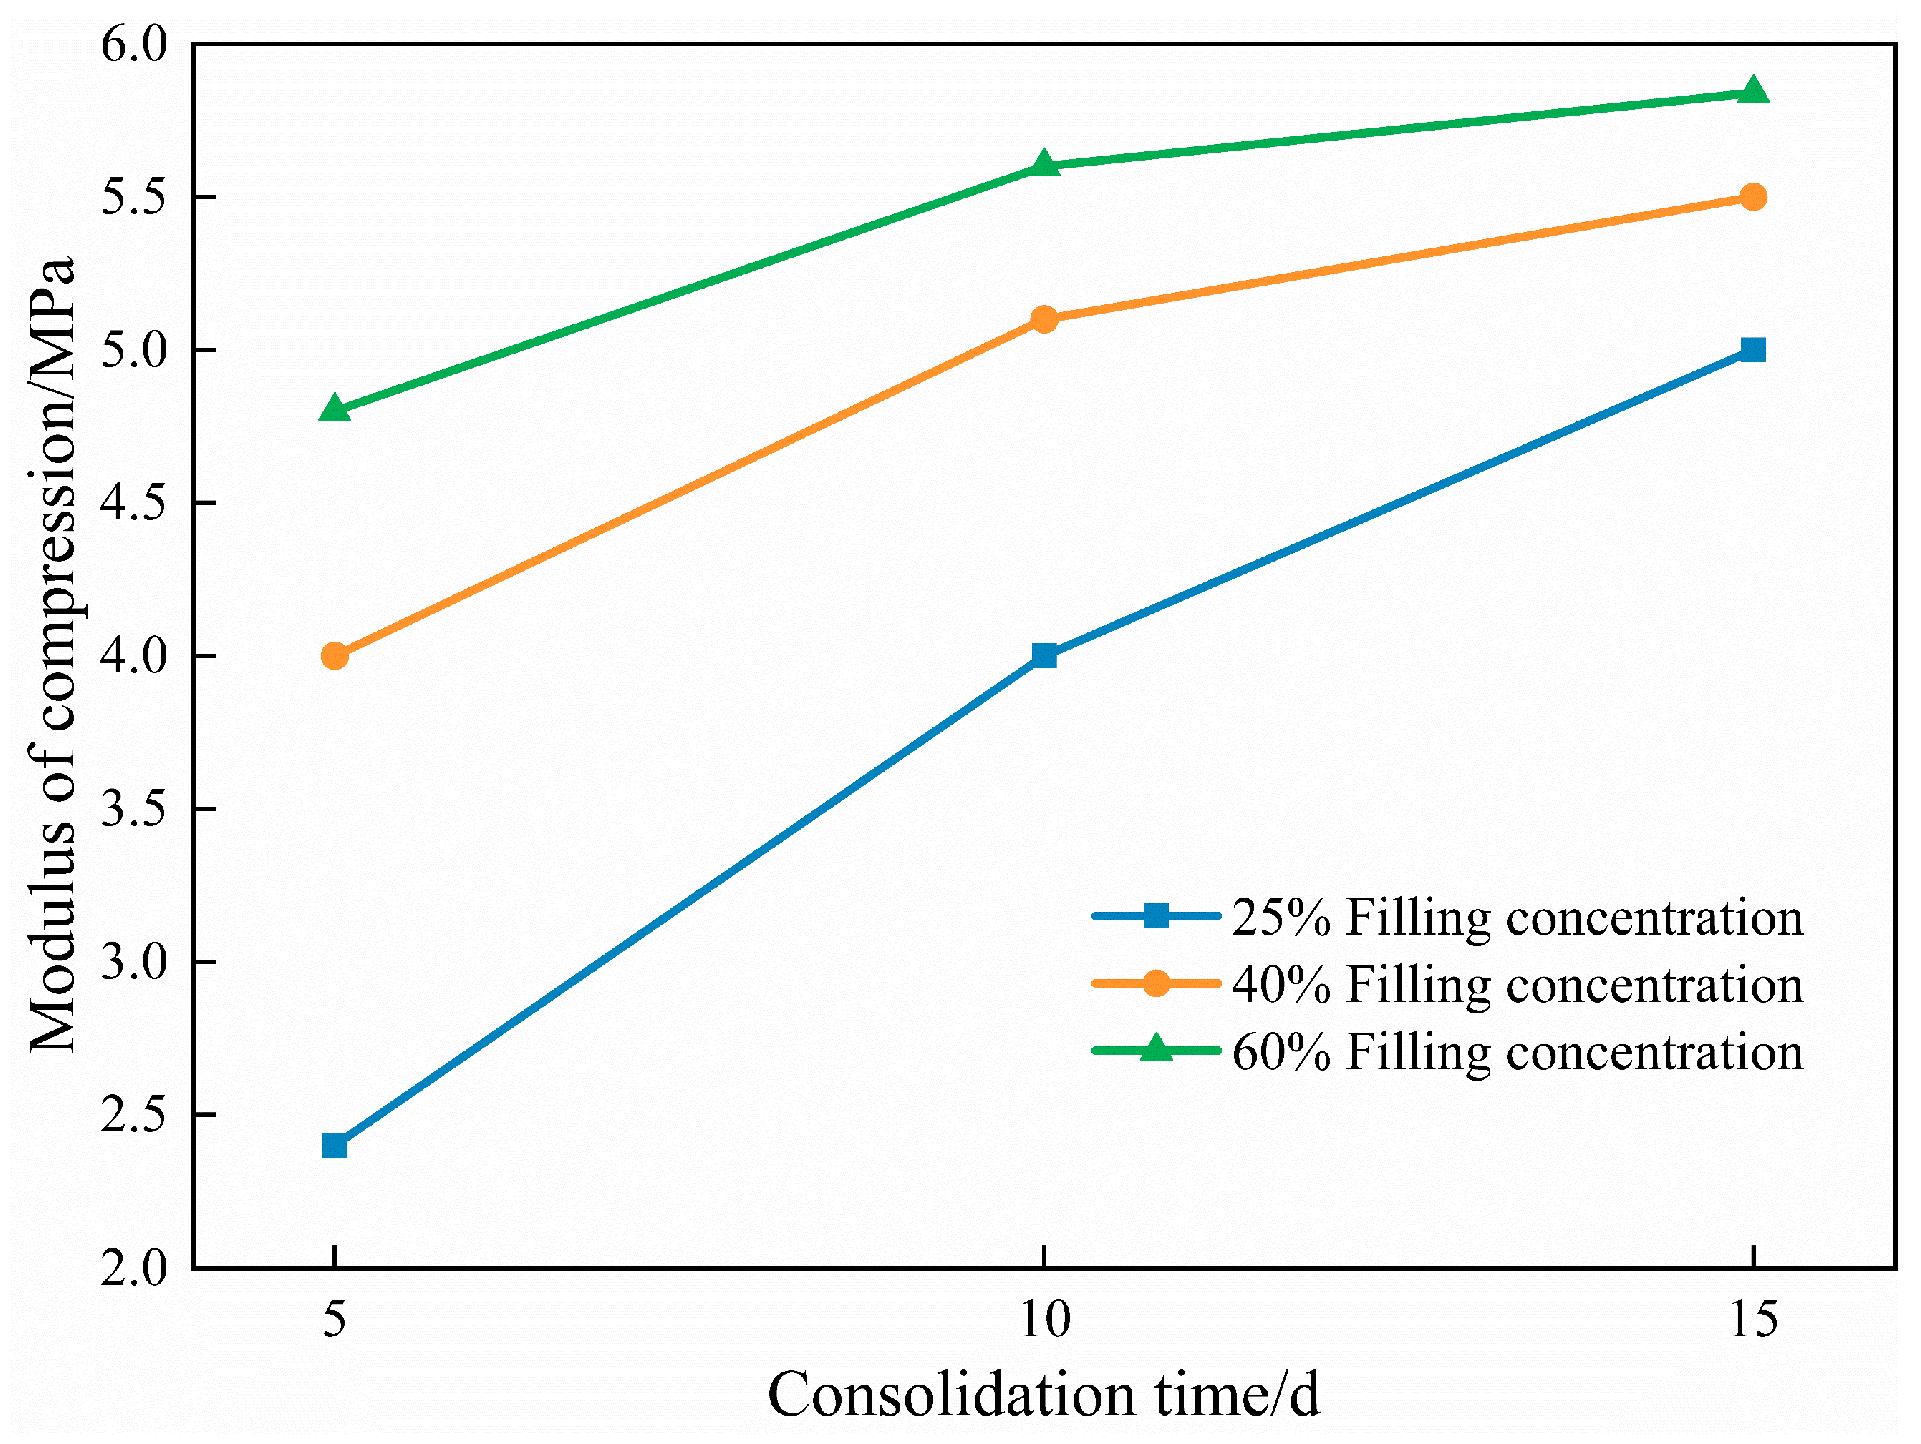
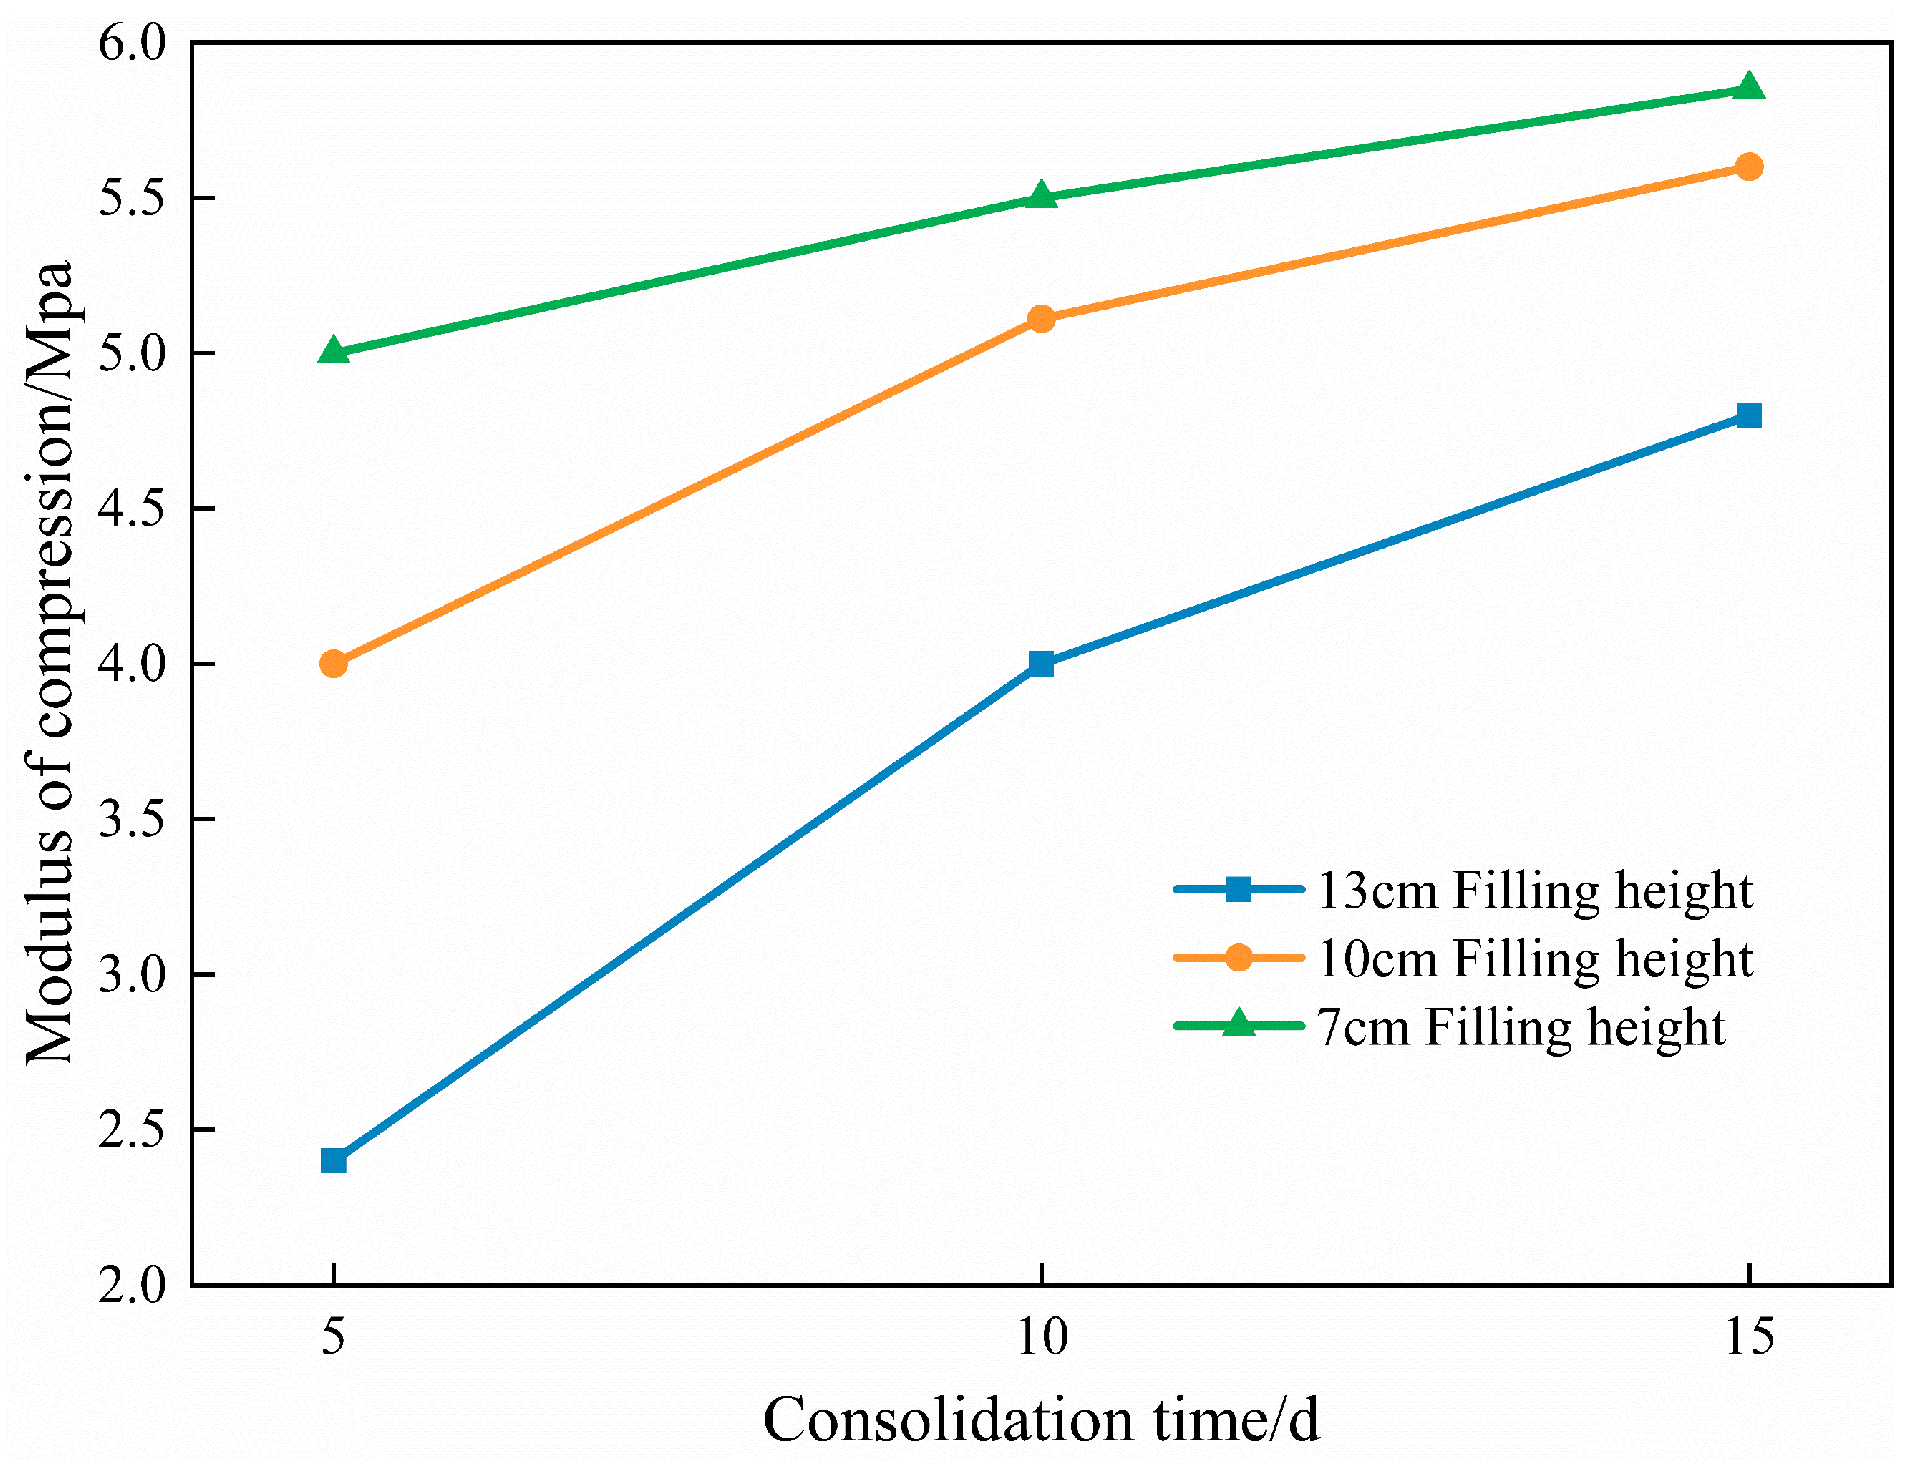
4.4. Analysis of Mechanical Properties of Geotextile Tube Consolidation

To investigate the effect of the filling characteristics and consolidation time on the mechanical properties of the geotextile tubes, a standard consolidation experiment, a vane shear experiment, and a direct shear experiment were performed on tailings samples collected at various stages of consolidation, and the compressive modulus and shear strength were measured. Figure 18 illustrates the influence of consolidation time and filling concentration on the shear strength of tailings inside the geotextile tubes. It shows that, with increasing consolidation time, both the internal friction angle and the cohesion of the tailings inside the tubes increase. Moreover, during the same time interval, the cohesion and internal friction angle also increase with higher filling concentrations. This indicates that as the consolidation time and filling concentration increase, the ability of the tailings inside the tubes to resist shear deformation is enhanced. This enhancement is attributed to the increase in the coefficient of non-uniformity of fine-grained tailings inside the tubes with higher filling concentrations, resulting in an increase in the maximum dry density and a decrease in porosity, thereby forming a denser structure that improves the shear strength.
Figure 19 shows the effect of the filling concentration on the compression modulus of tailings in the bag in the case of different consolidation times. When the bag consolidation increased from 5 d to 10 d, the compression modulus of the 25%, 40%, and 60% filling concentrations increased by 1.63 MPa, 1.11 MPa, and 0.80 MPa, respectively, while the compression modulus only increased by 0.97 MPa, 0.38 MPa, and 0.21 MPa from 10 d to 15 d, which shows the compression modulus increased quickly in the first period of consolidation and slowly in the later period. Additionally, the compression modulus of the tailings increased with an increased filling concentration.
Figure 20 illustrates variations in the shear strength indicators of tailings within the geotextile tubes in the case of different filling heights. The cohesion and internal friction angle of consolidated tailings decrease with an increasing filling height, indicating a reduced resistance to shear deformation within the bags. This is attributed to the increased transmission pathways for vertical and horizontal stresses with an increasing filling height, leading to diminished direct contact and interaction among tailings particles, thereby reducing interparticle cohesion and the internal friction angle.
Figure 21 shows the variation in the compression modulus of the tailings with time in the case of different filling heights. From the changes in the compression modulus shown in the figure, the longer the consolidation time, the greater the compression modulus, but with the same consolidation time and with an increase in filling height, the compression modulus of the tailings in the bag decreases, and the resistance of the consolidated tailings to deformation also weakens.

5. Discussion

Comparing our experiments with those conducted by Han [45] and Liu [26] on geotextile tube filling using full-graded tailings, it can be observed that fine-grained tailings require a longer overall dewatering time during both the filling and consolidation processes. However, when studying the filling characteristics and the impact of different filling concentrations on filling efficiency, similar patterns are evident: higher filling concentrations result in a greater filling efficiency. One of the key innovations of this study lies in its investigation of the effects of filling height on the filling efficiency and subsequent consolidation characteristics of geotextile tubes. By controlling the degree of filling and adjusting the dimensions of the geotextile tubes to achieve the target filling height, it was found that the filling height had a minimal impact on filling efficiency.
Due to the limitations of the experimental site and equipment used, this study could not extensively explore the performance and behavior of geotextile tubes of different sizes, thus reducing the influence of scale effects. Additionally, this research primarily focused on the effects of varying filling concentrations and heights on filling and self-weight consolidation. However, the geotextile material used and the particle grading of fine-grained tailings will also affect the filling efficiency and consolidation outcomes concerning geotextile tubes, which will be explored in future research endeavors.

6. Conclusions

According to the laboratory testing methods for fine-grained tailings, this study divided the geotextile tube process into two stages: filling and consolidation. The filling stage was used to investigate the effects of different filling concentrations and heights on the filling efficiency of geotextile tubes. Following the filling stage, the consolidation phase was used to examine the settlement deformation patterns of the tubes and explore the physical and mechanical properties of the tailings within the tubes after different consolidation times. This research provides a reference for predicting settlement and assessing the stability of tailings dams constructed using the geotextile tube method. The main conclusions are as follows:
(1)
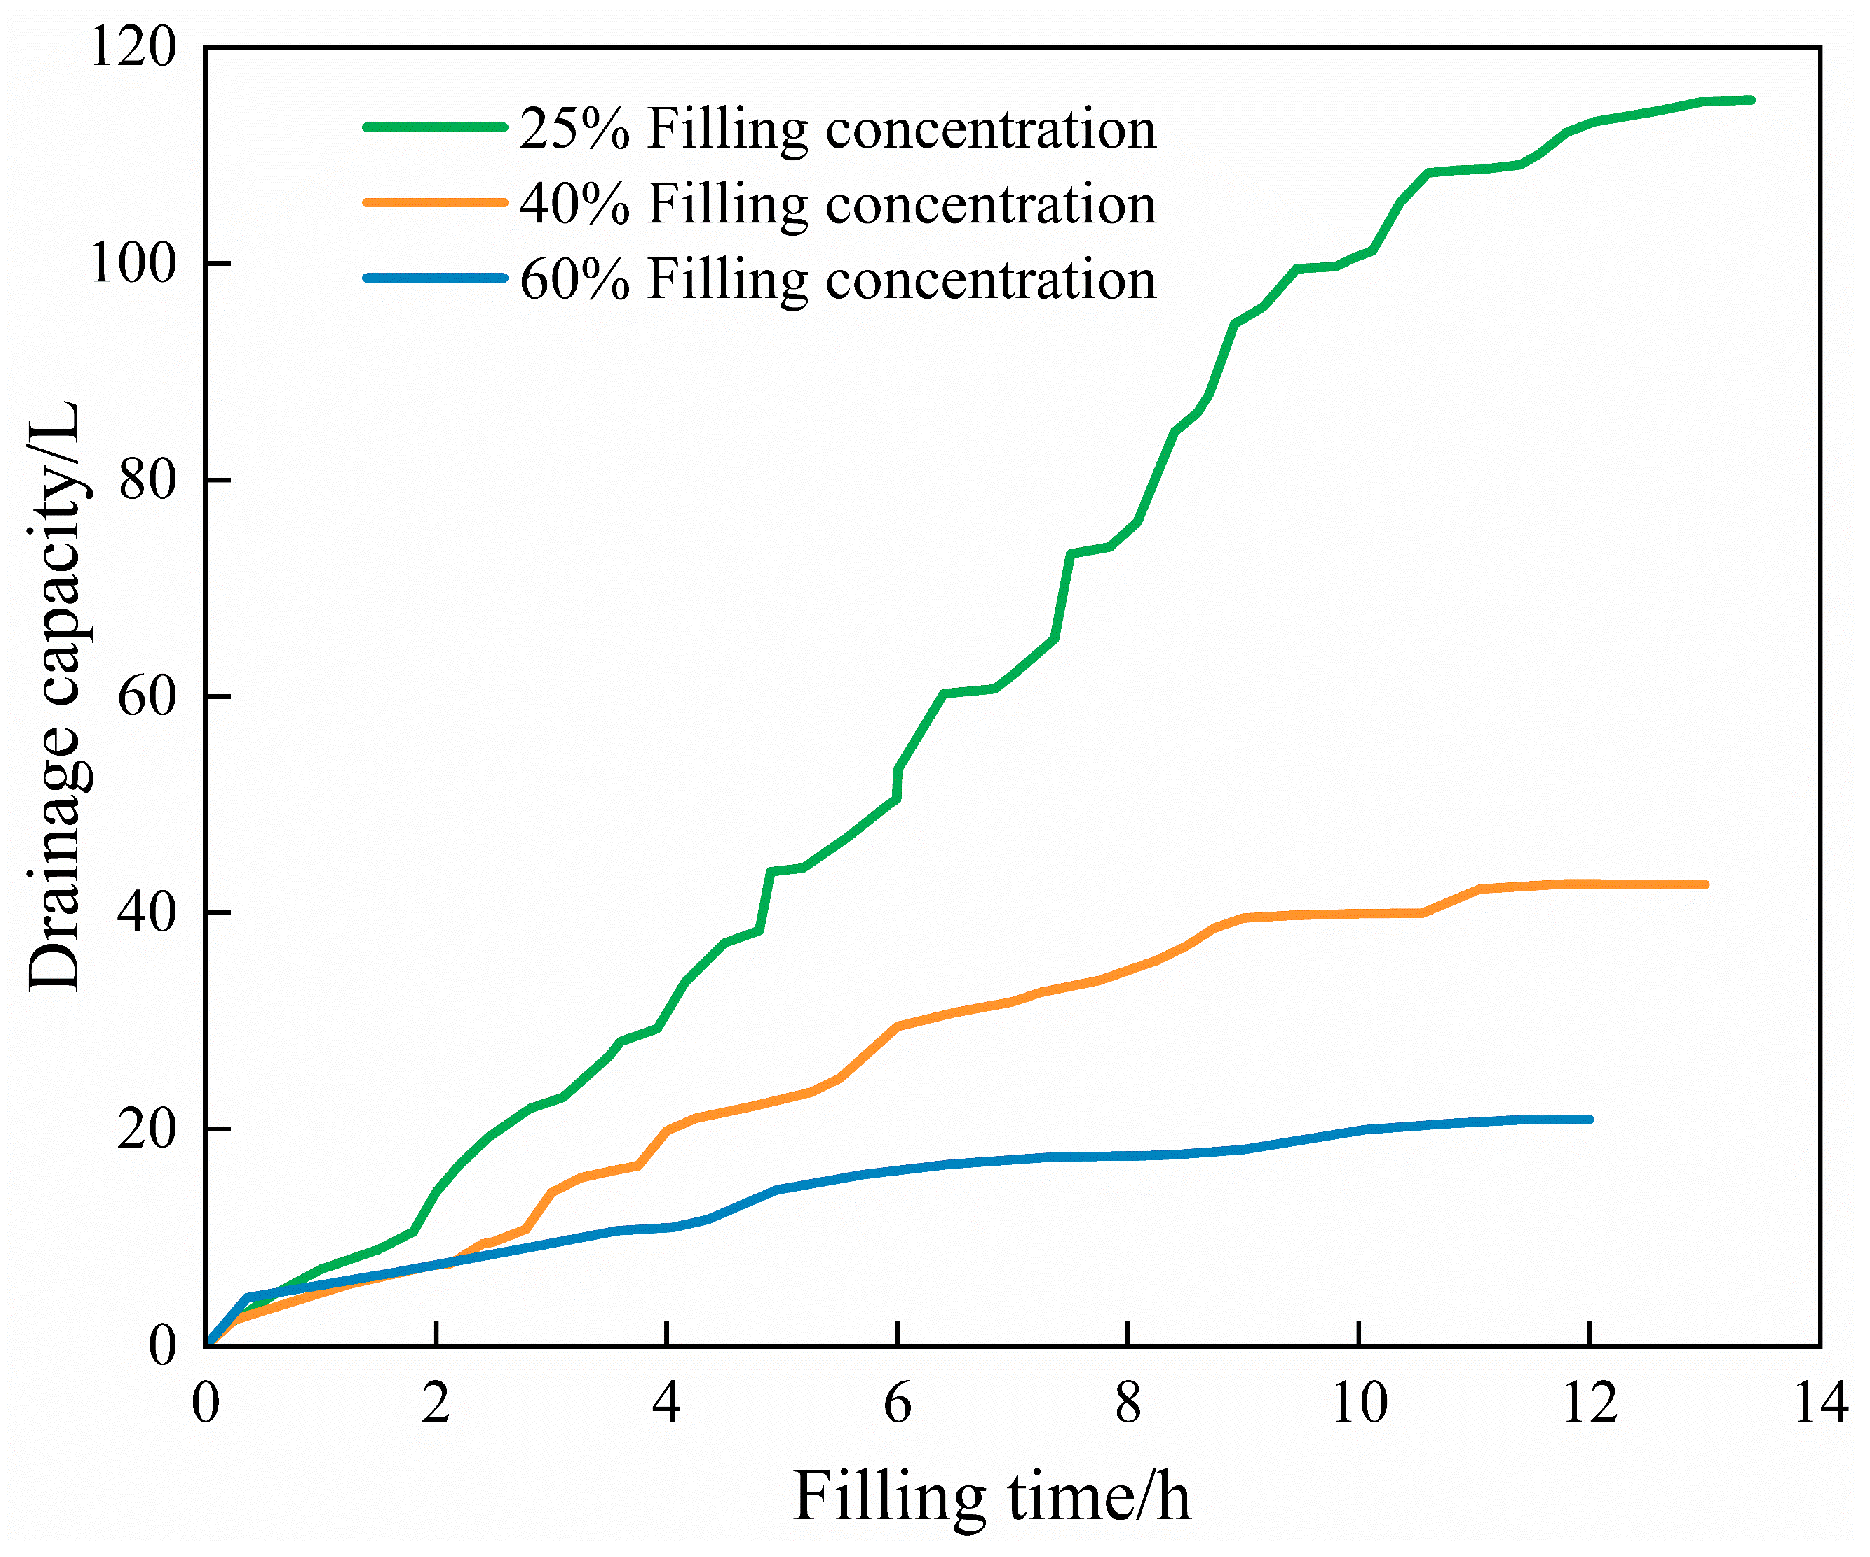
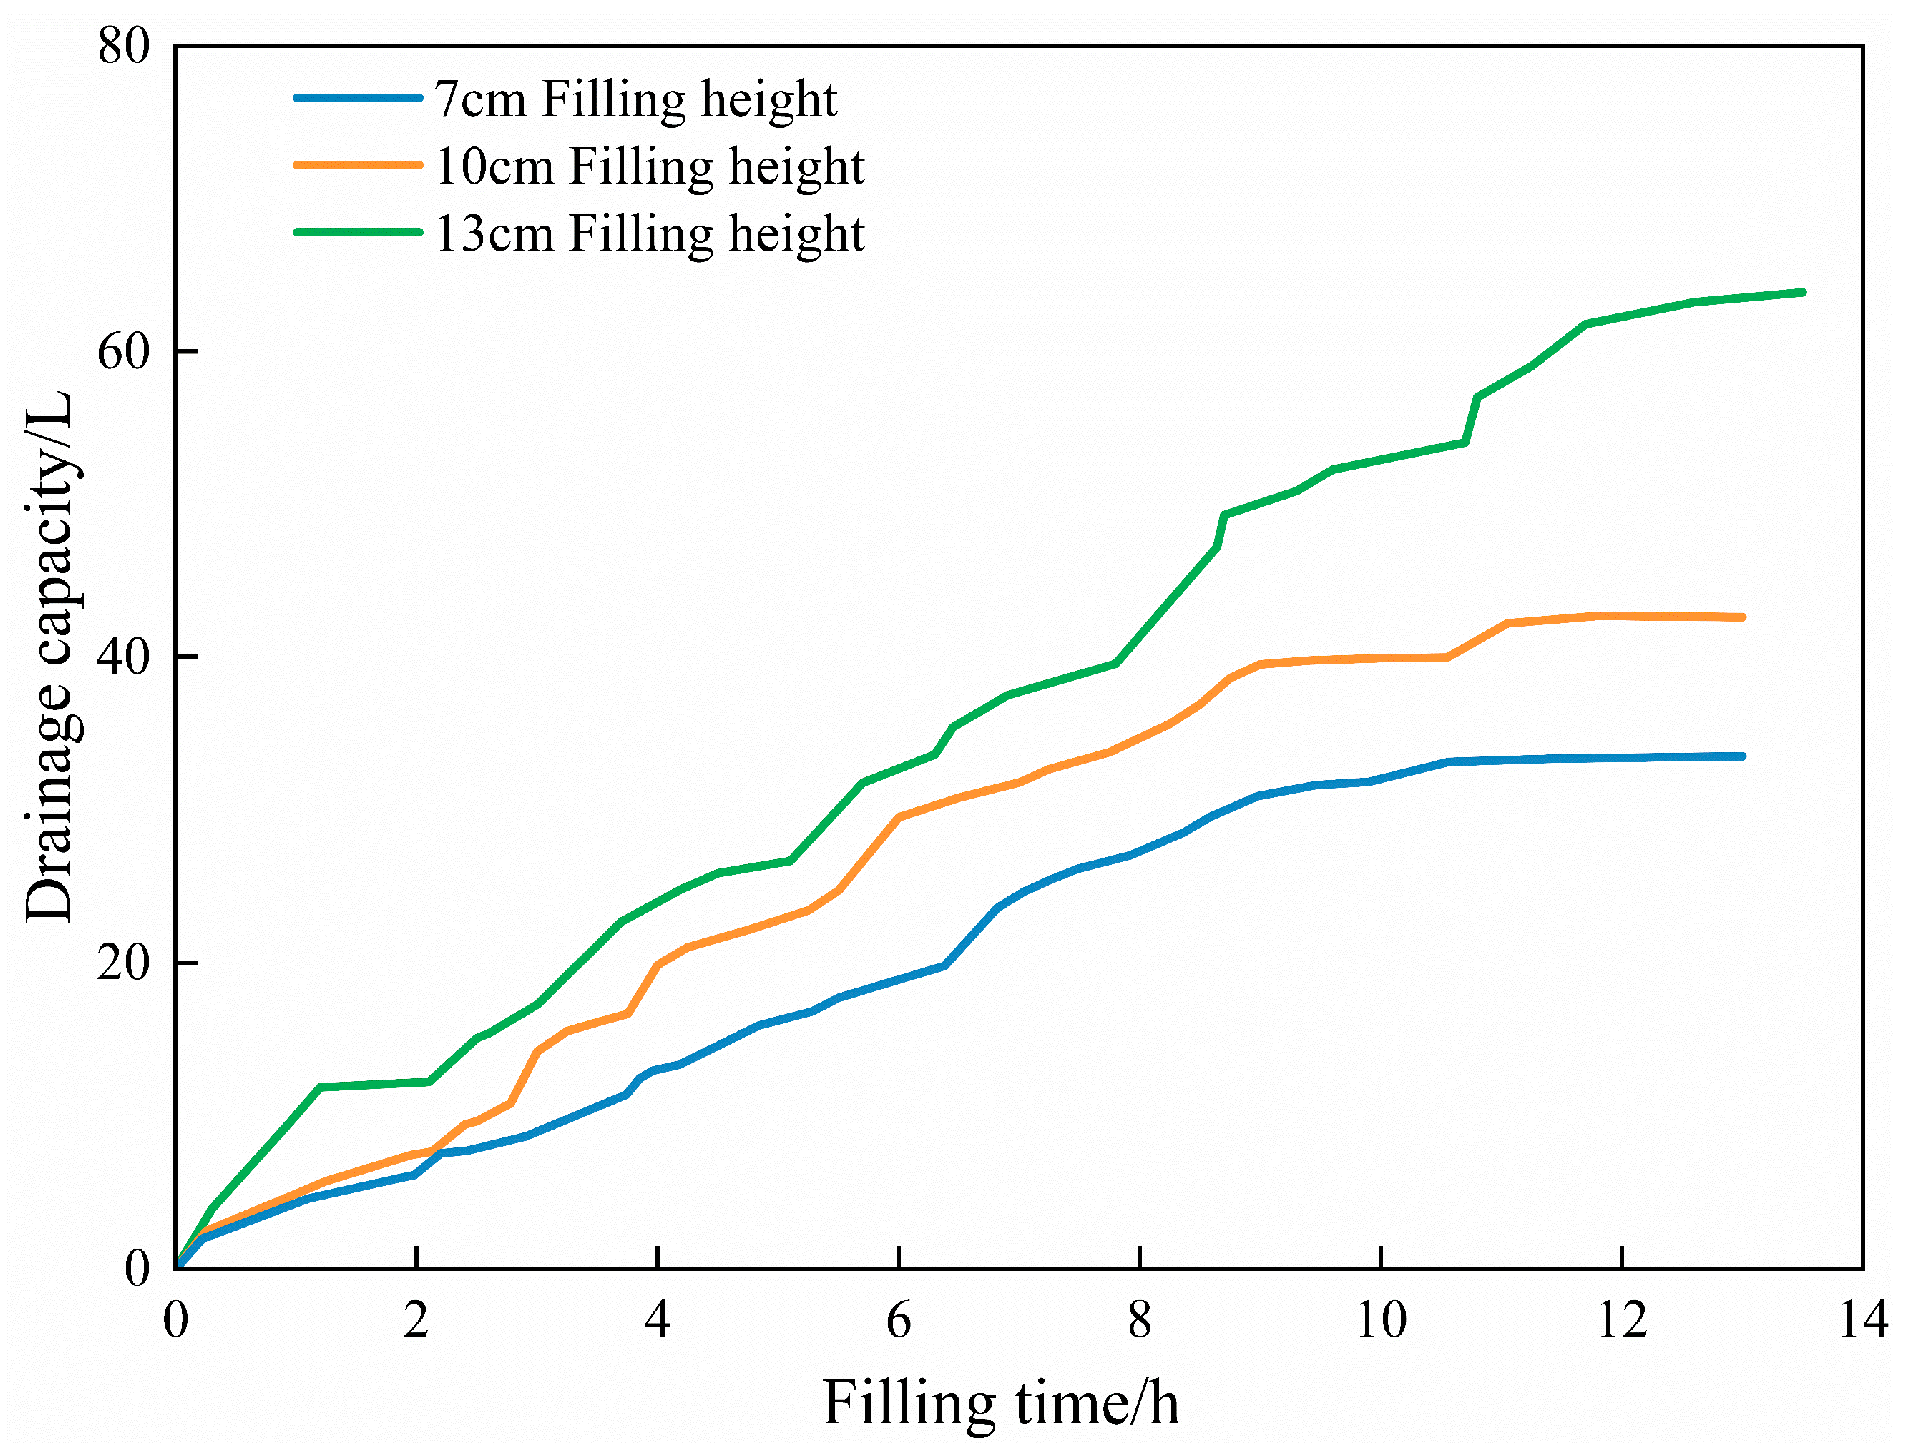
In terms of filling efficiency, the filling efficiency at a 25% concentration is relatively poor, whereas at a 60% concentration, the efficiency is relatively high. The impact of filling height on the filling efficiency of the geotextile tube is minimal.
(2)
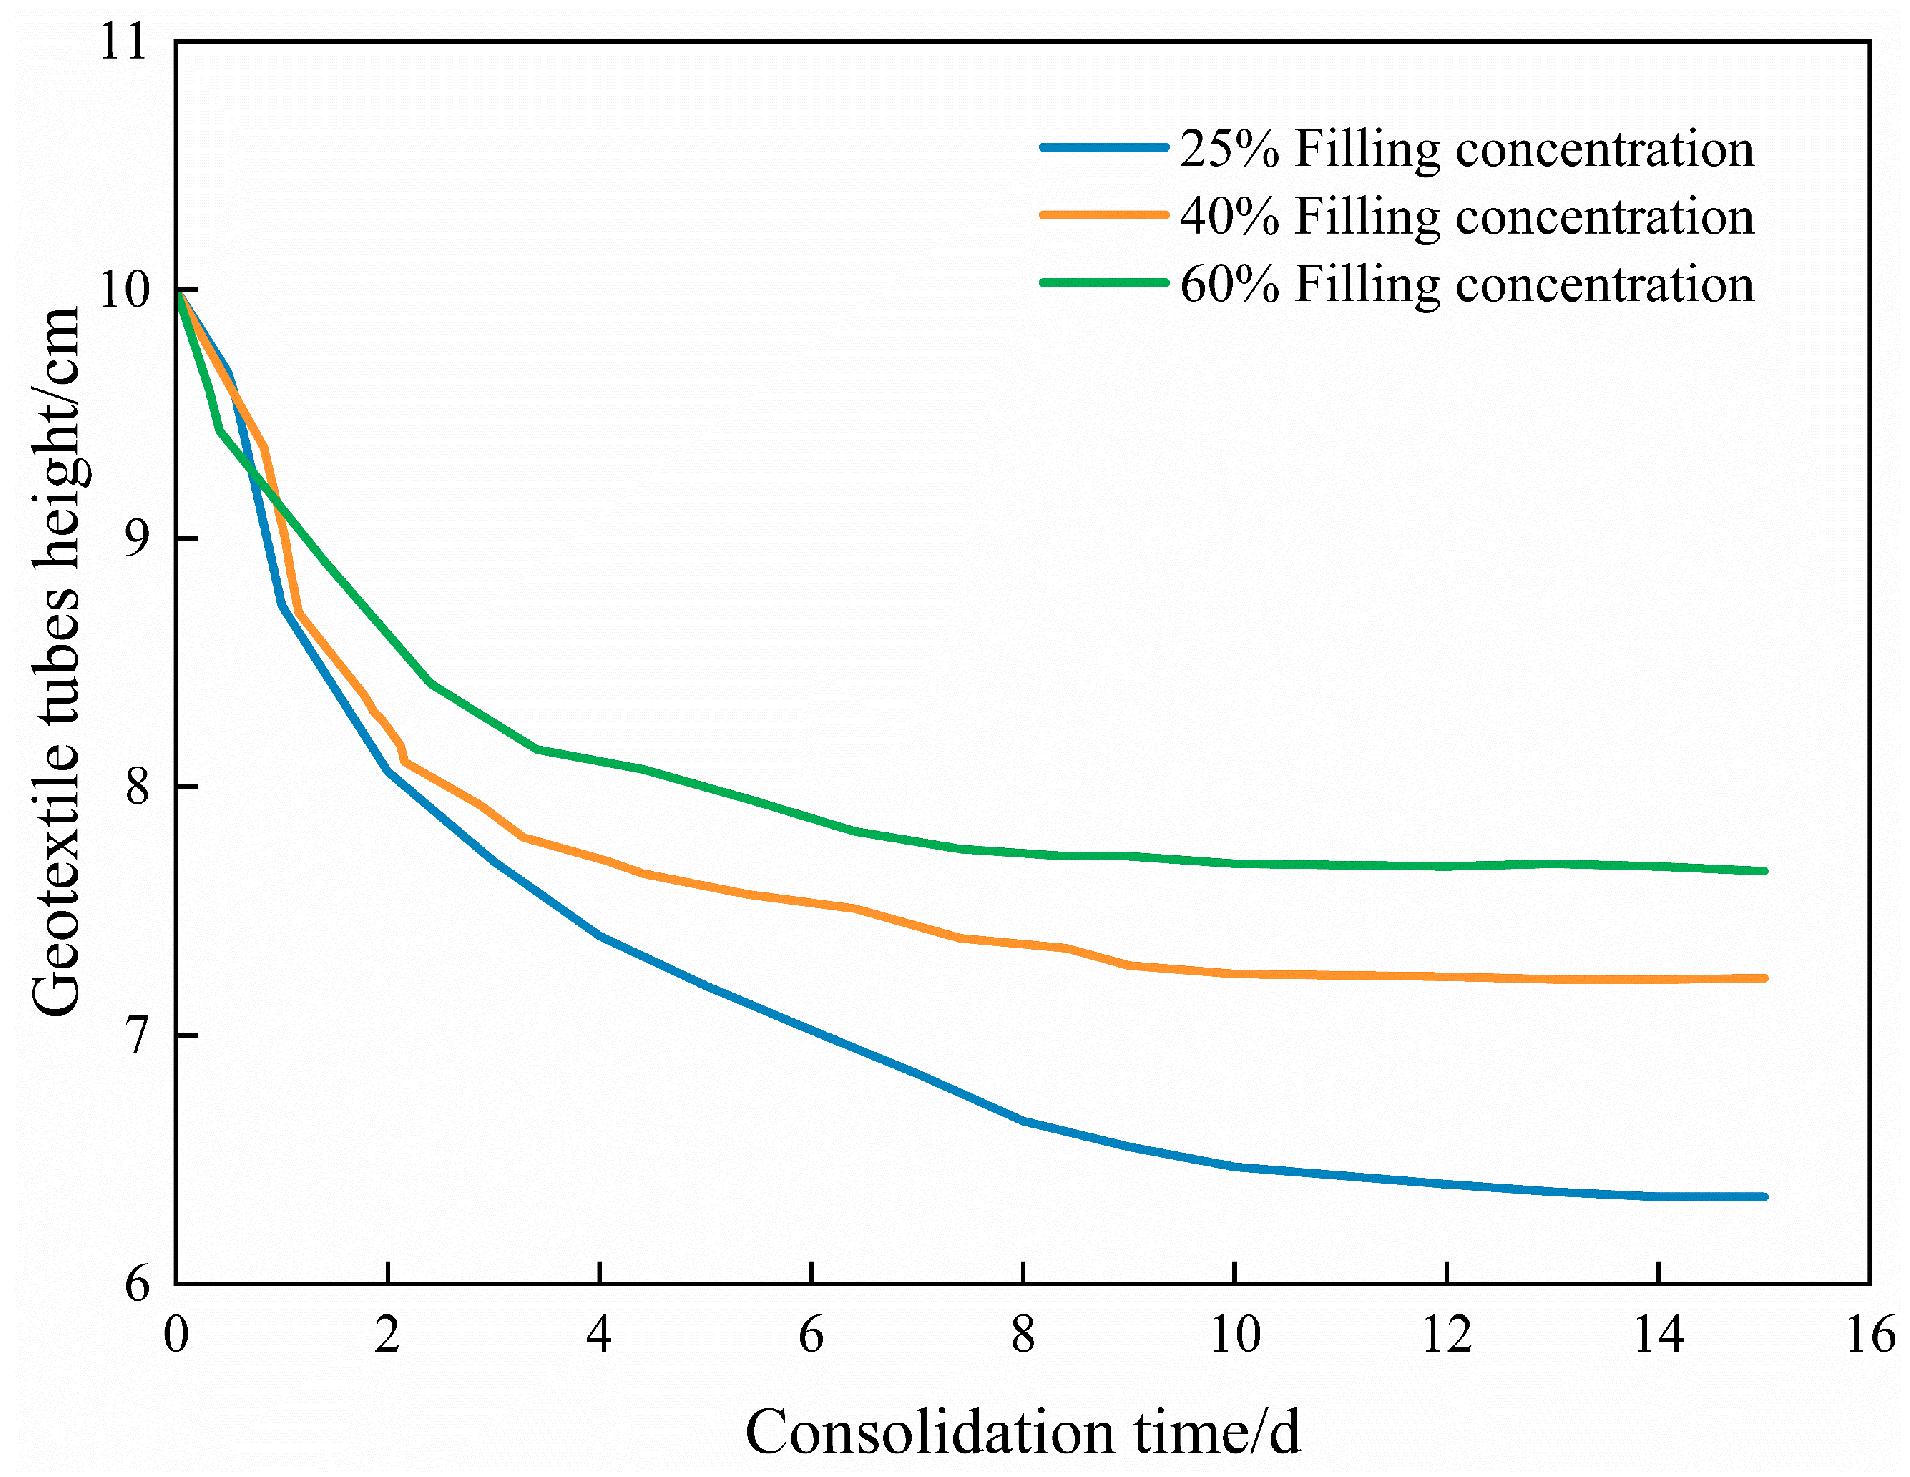
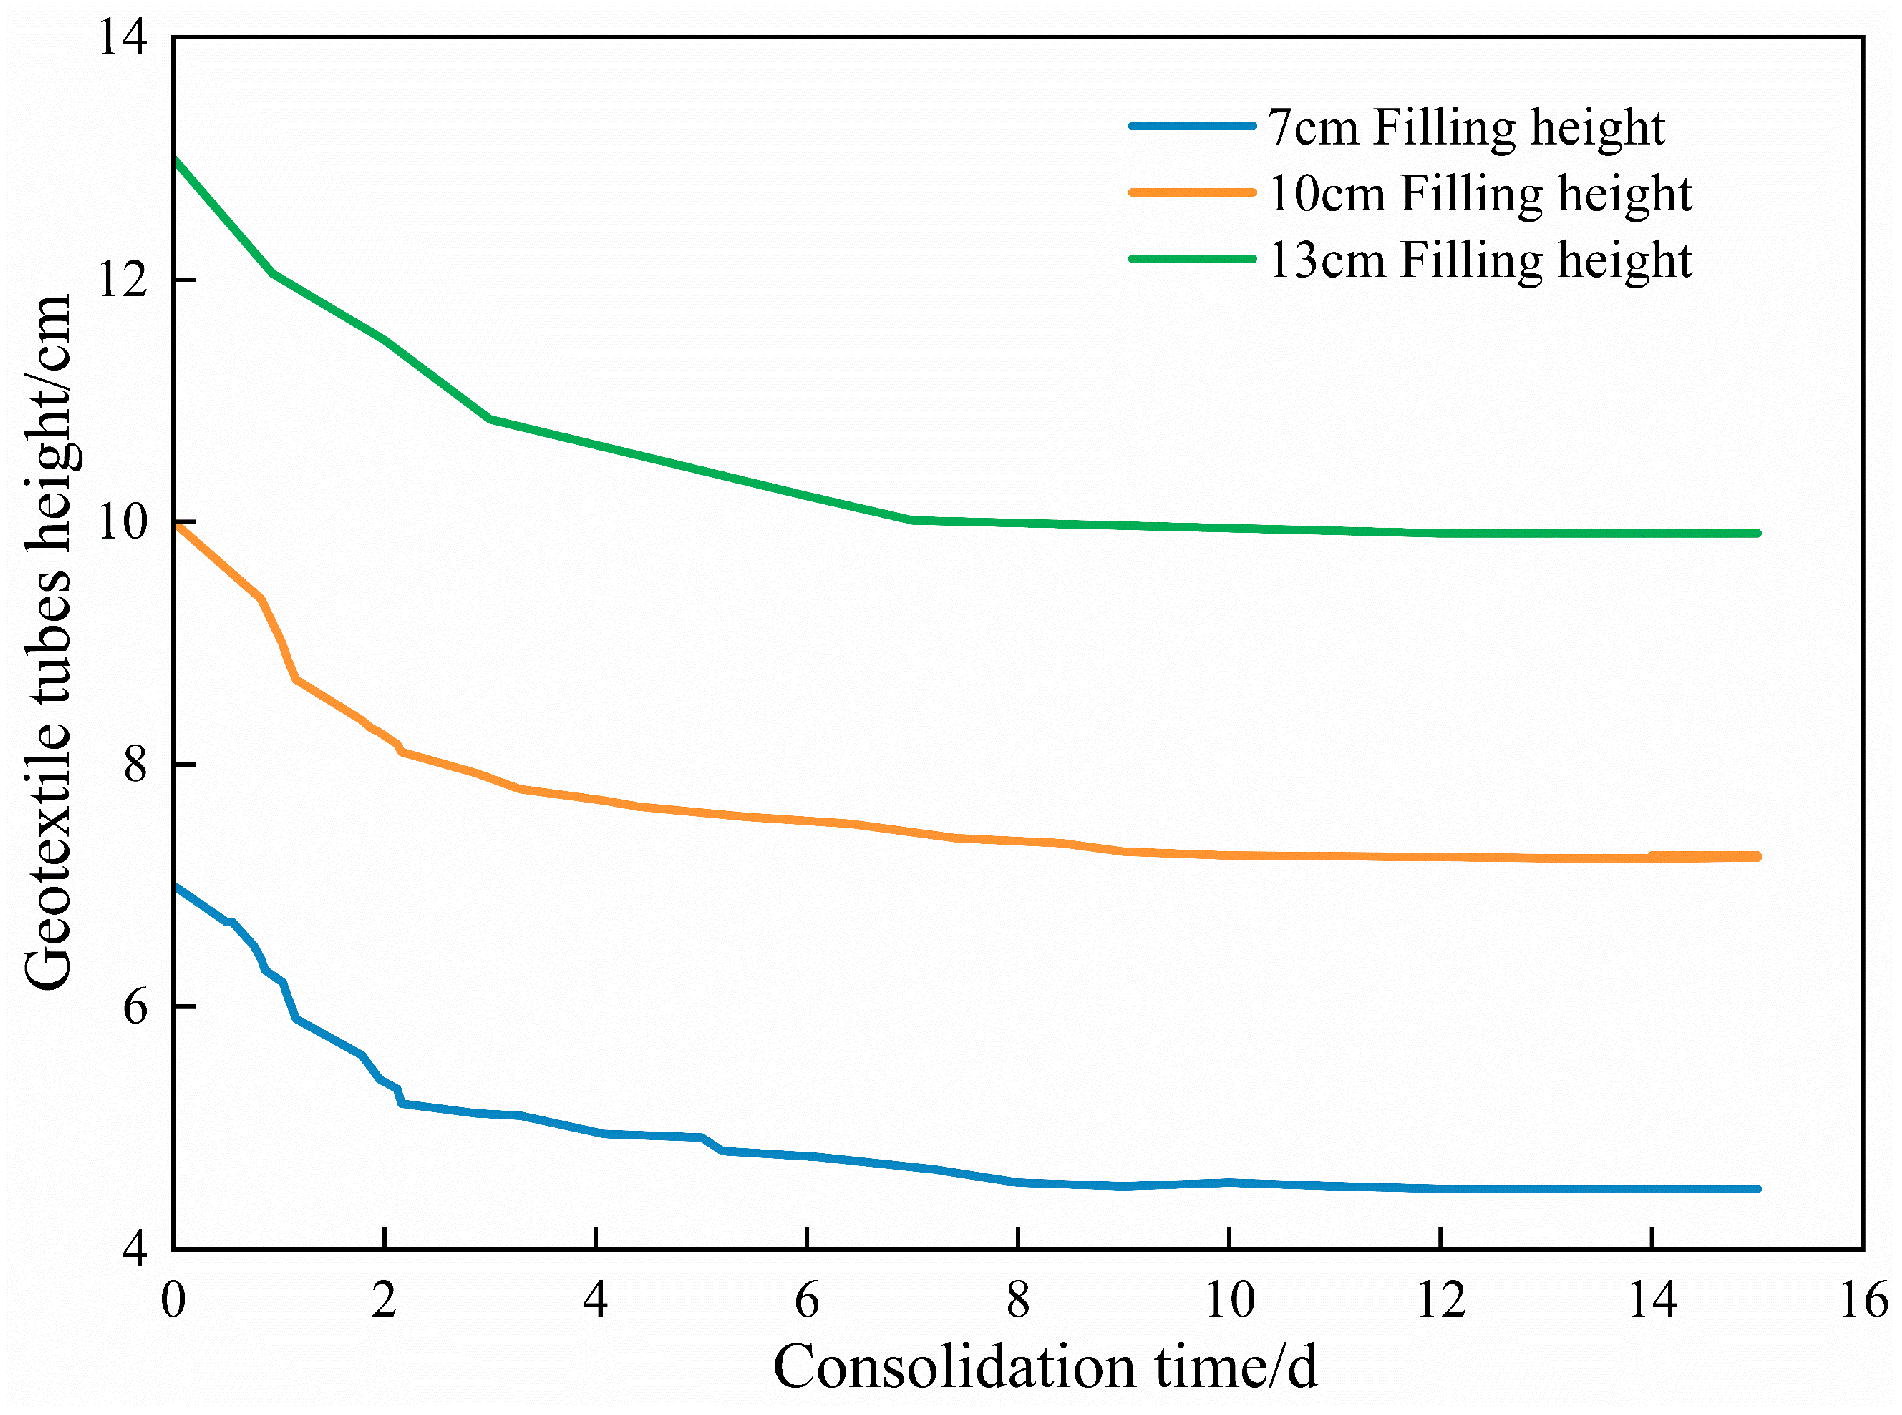
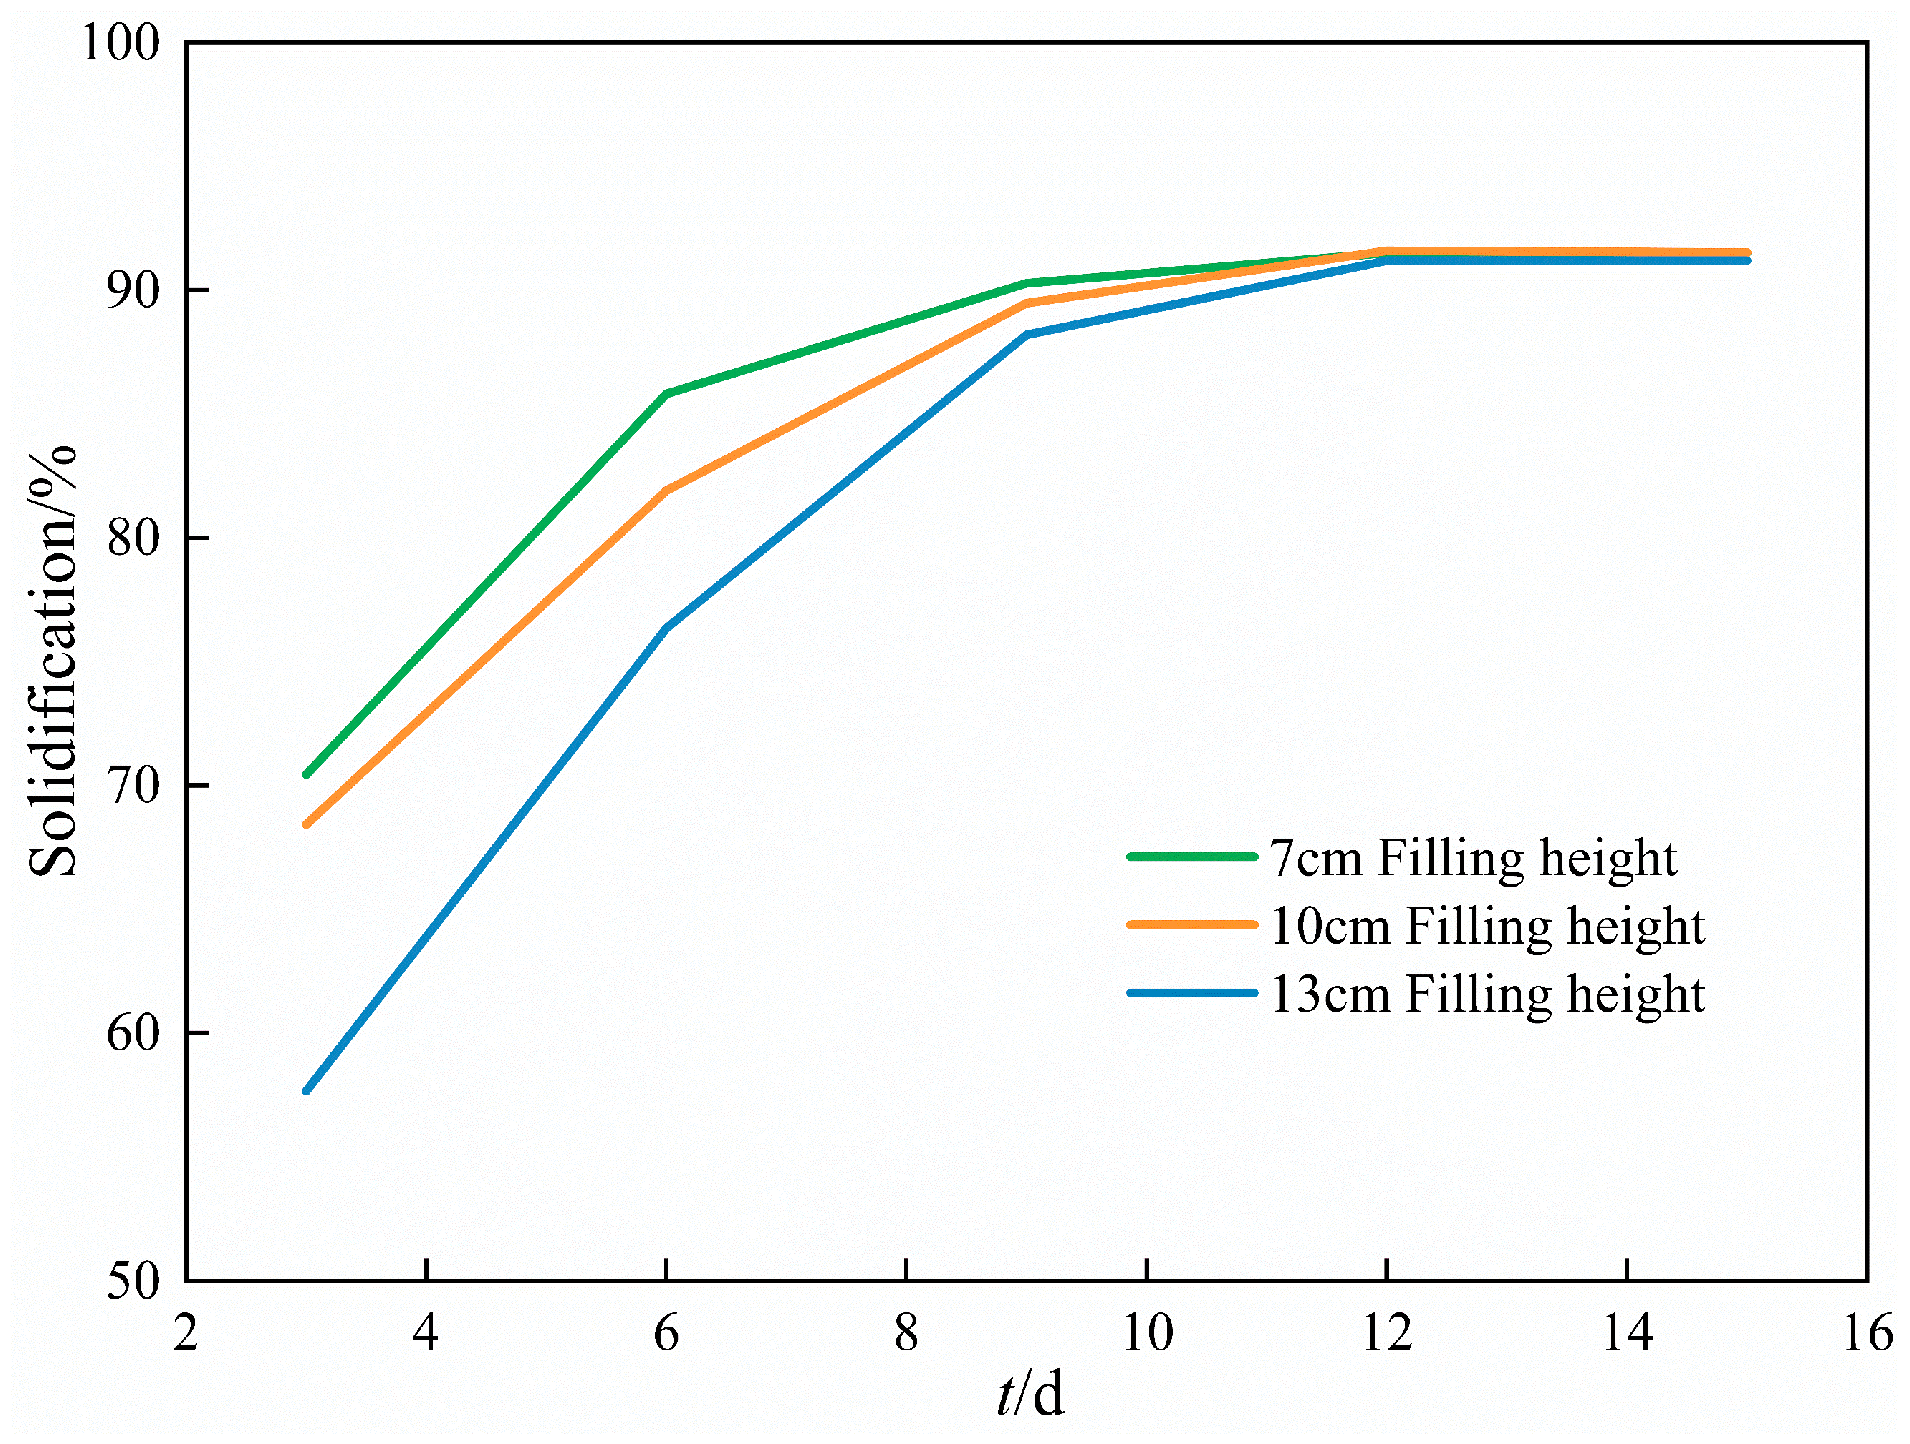
Concerning settlement during consolidation, higher filling concentrations result in faster stabilization during the consolidation phase. After 15 days of consolidation, the settlement of the geotextile tube decreases significantly with an increasing filling concentration. Although settlement increases with a greater filling height, the time required to reach a relatively stable consolidation stage is approximately 12 days across the different heights.
(3)
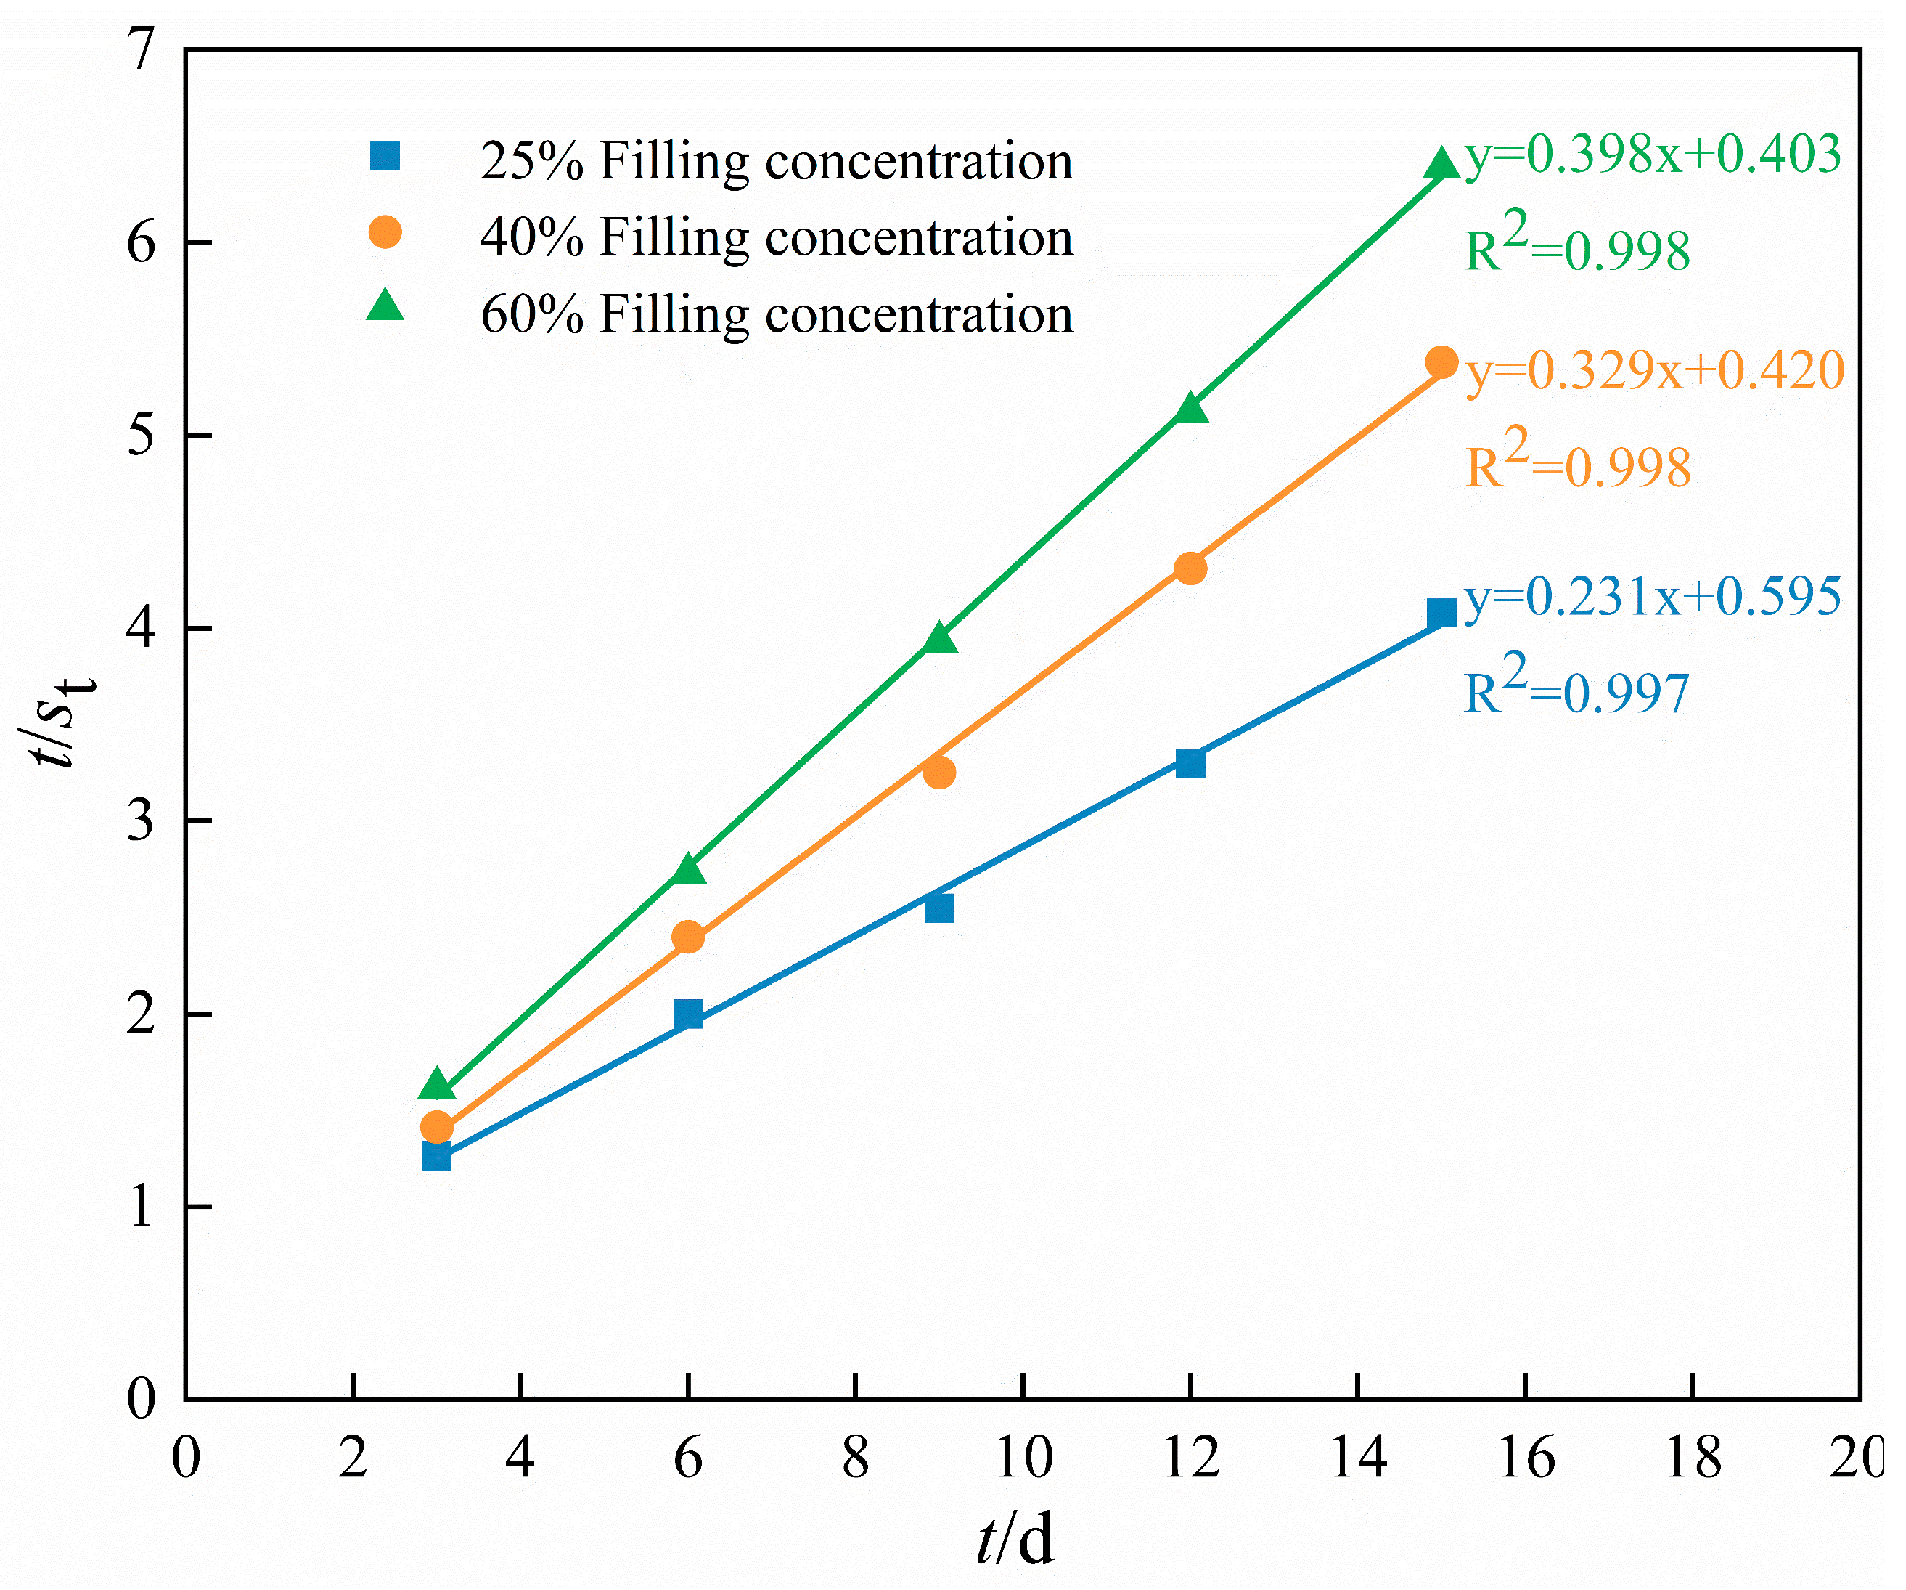
Regarding settlement prediction, by plotting the relationship between ttt and t/stt/s_tt/st for different filling concentrations and heights, it was determined that the hyperbolic method effectively reflects settlement changes over the consolidation time. The final settlement of the geotextile tube under various conditions can be predicted using the hyperbolic formula, which, in turn, provides insights into the degree of the consolidation of the tube over time.
(4)
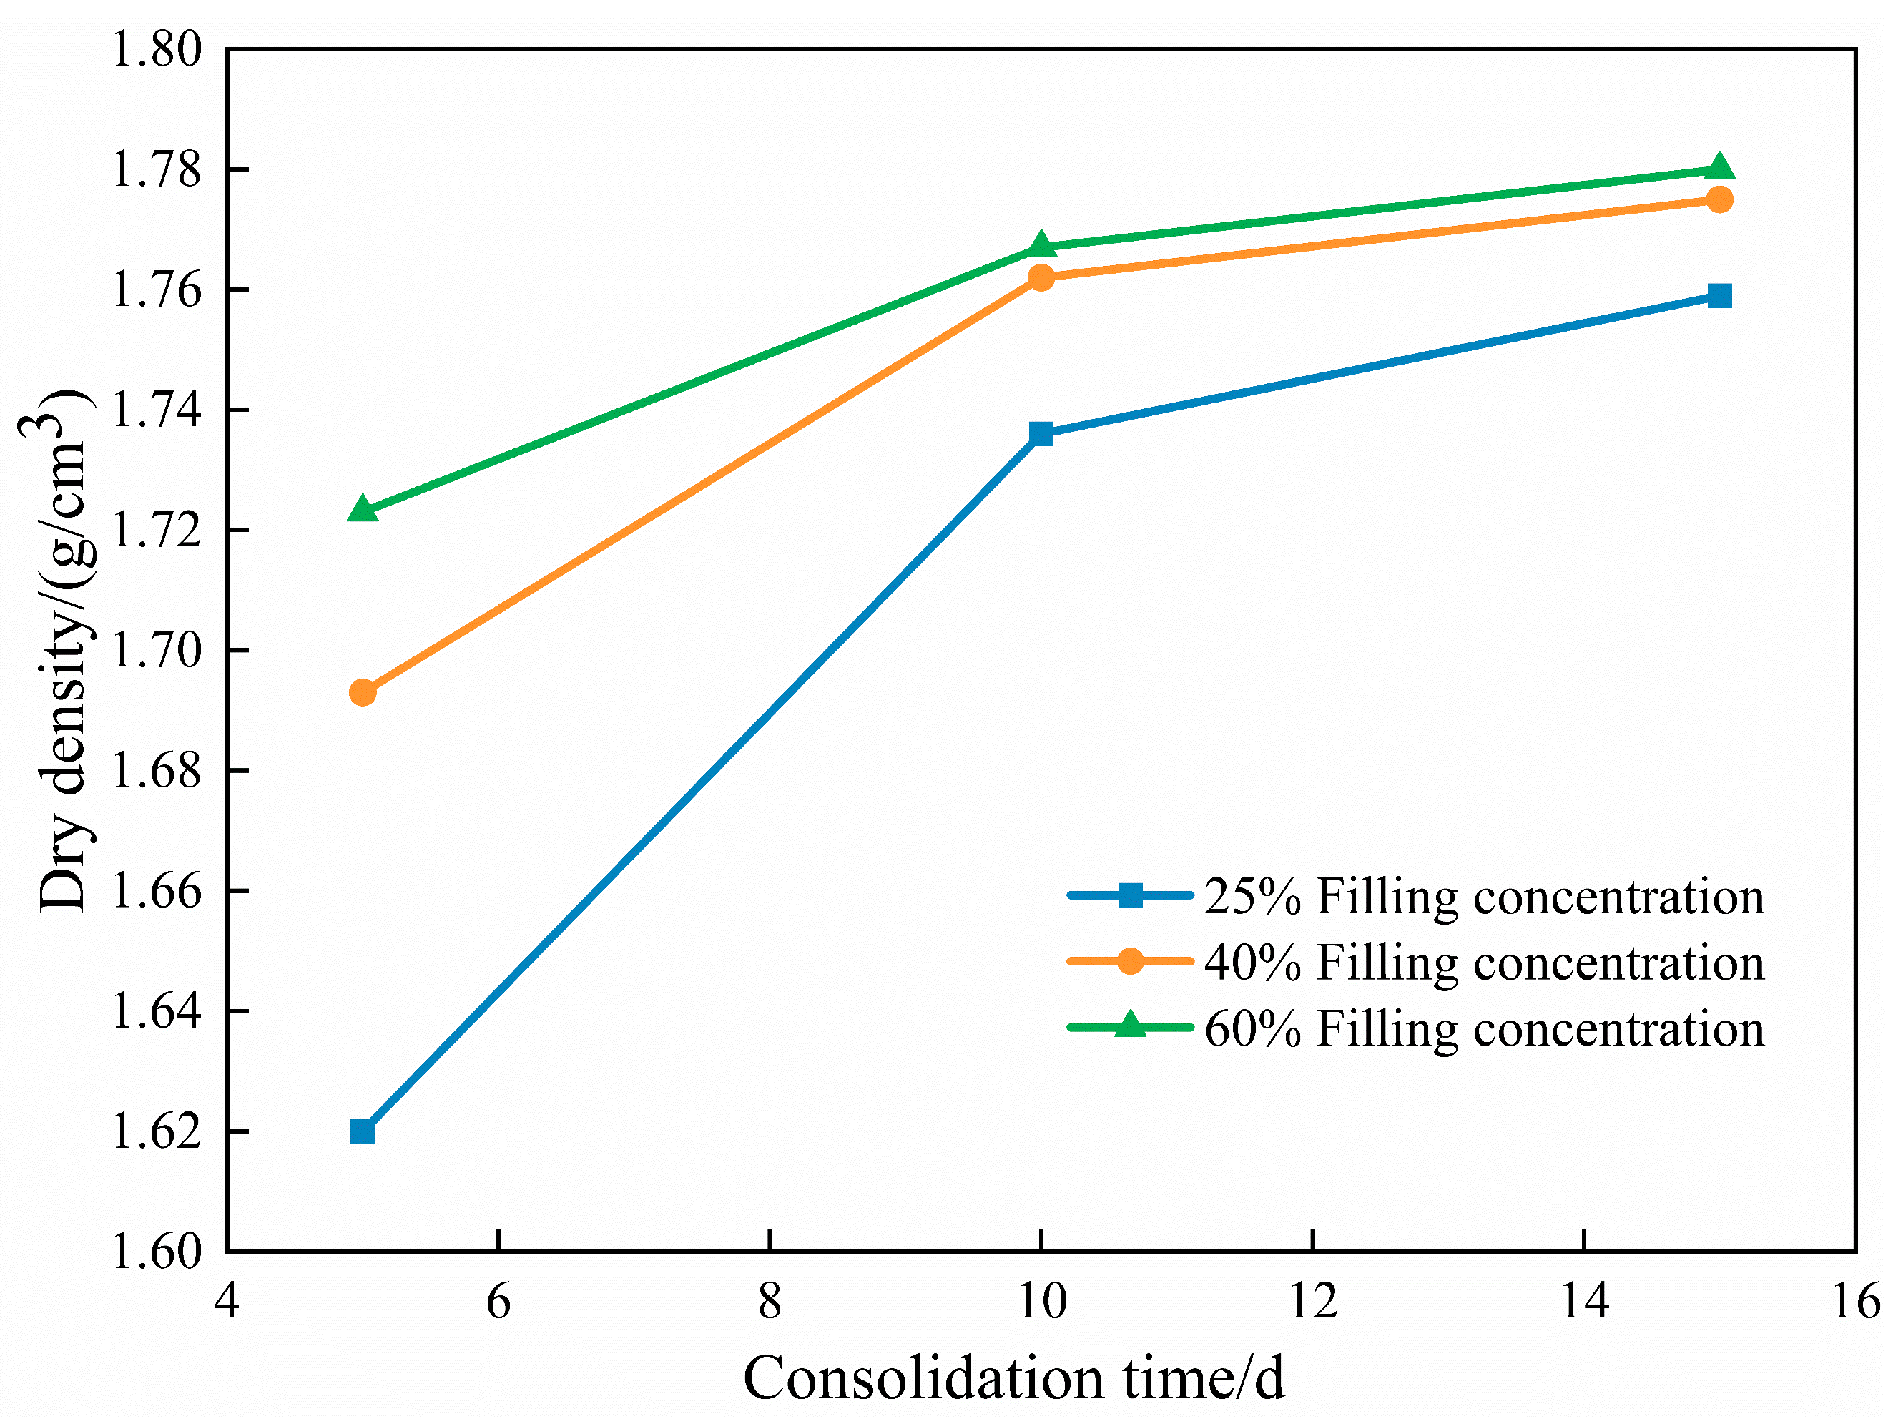
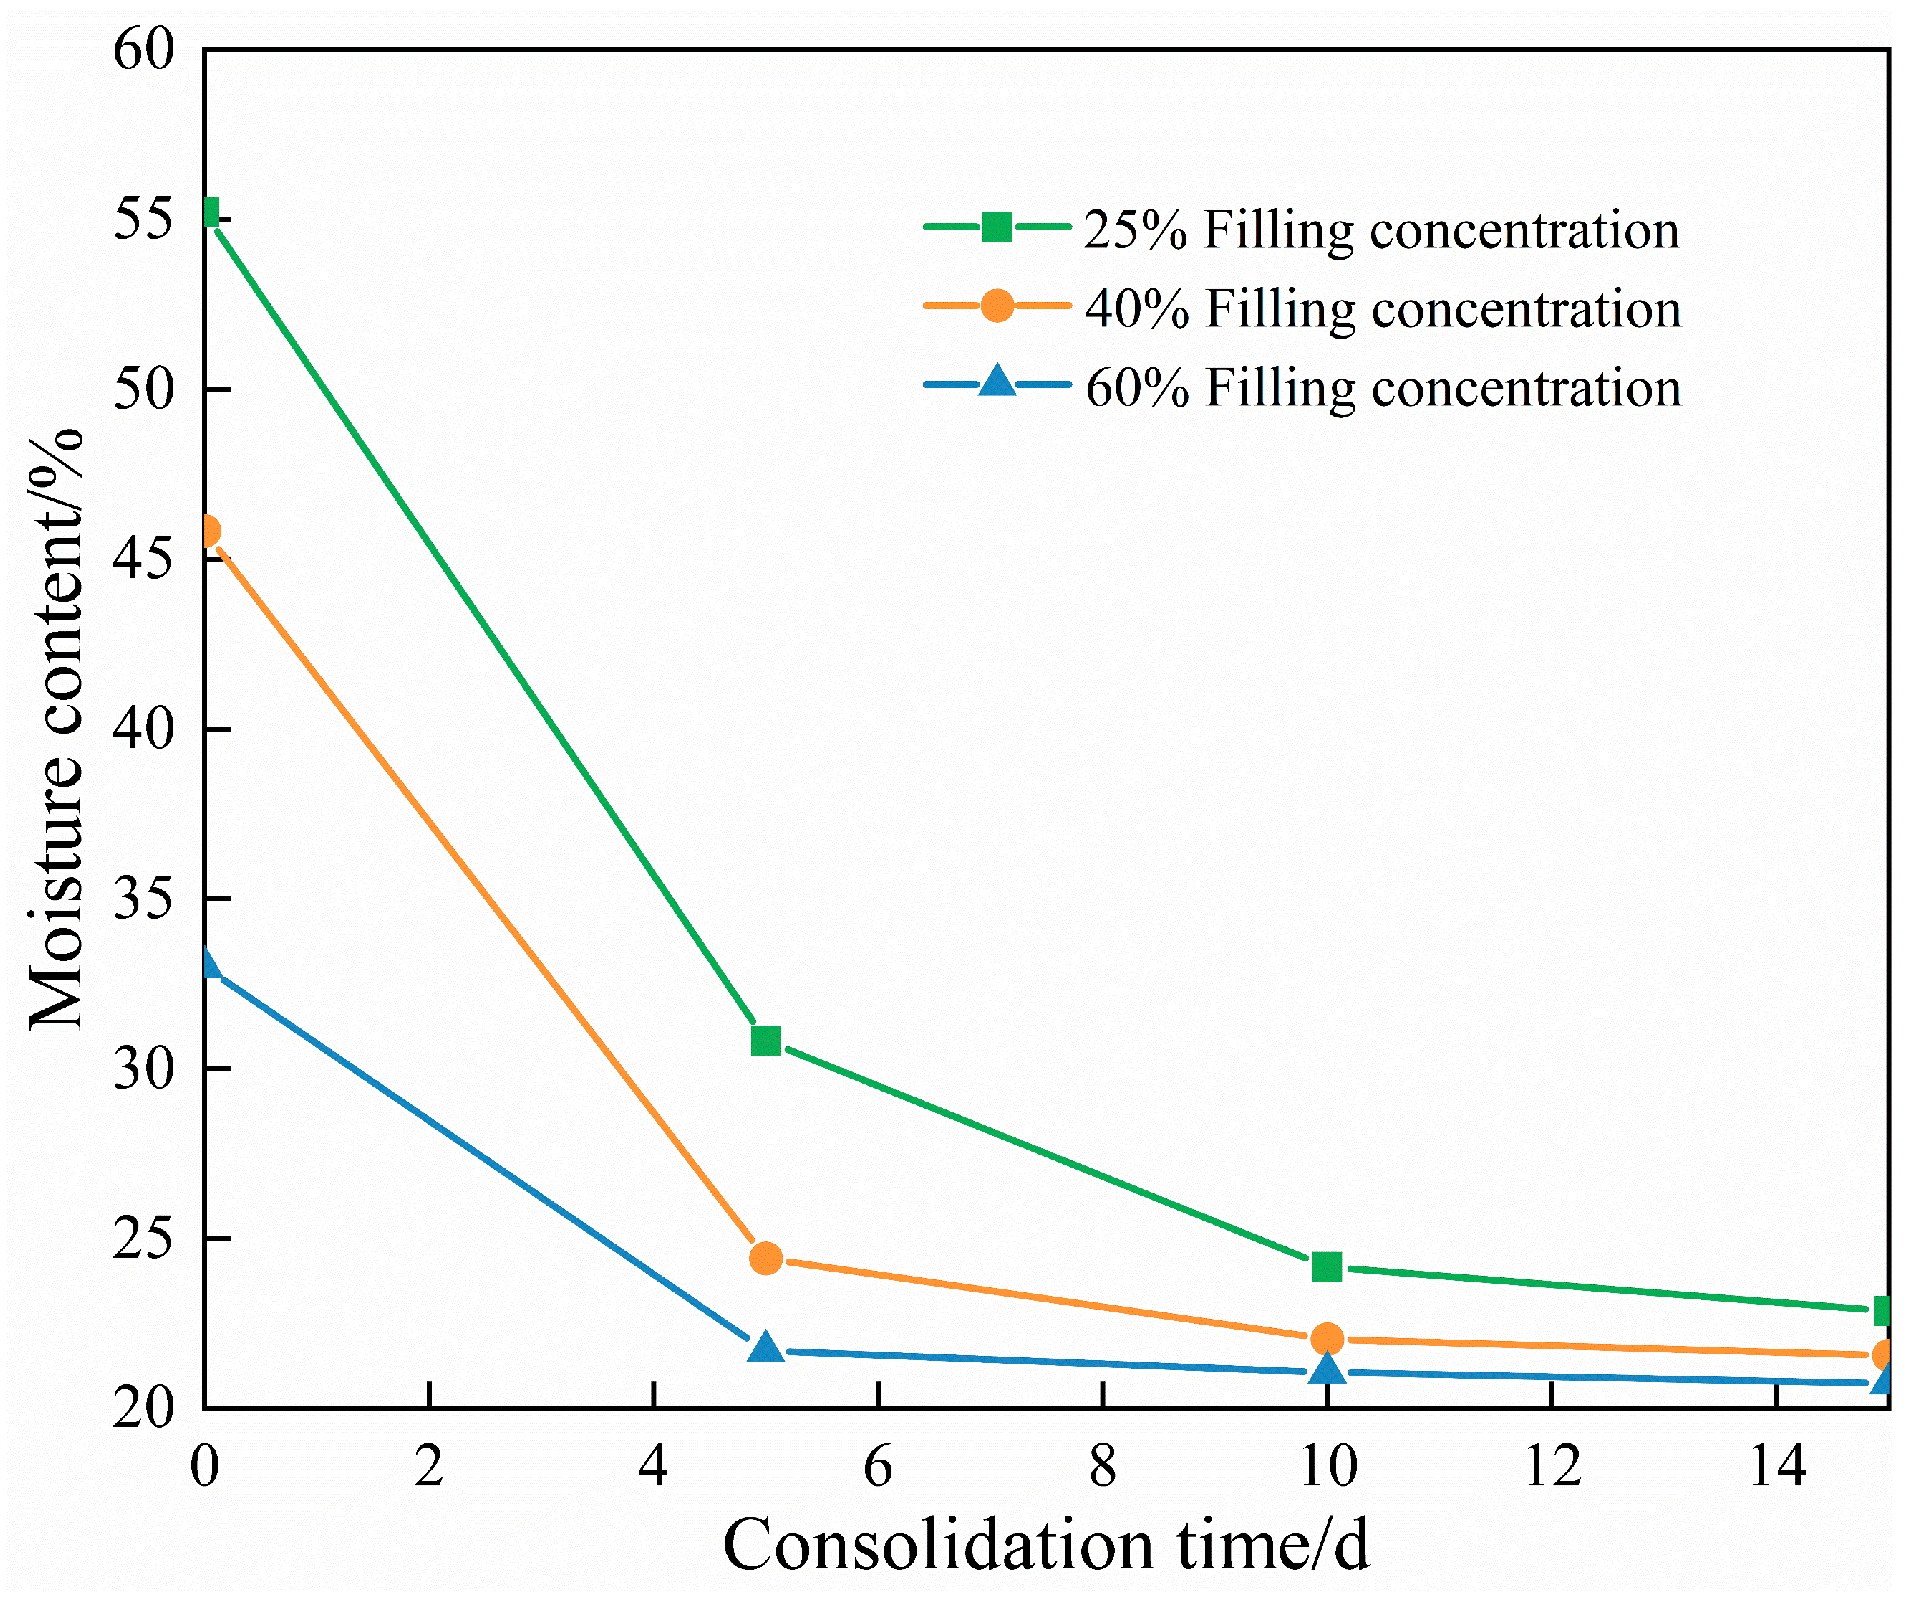
In terms of physical and mechanical properties, the study of the physical and mechanical properties of the tailings within the tubes at different consolidation times shows that, with an increasing consolidation time and filling concentration, the dry density, internal friction angle, cohesion, and compression modulus of the tailings all increase. Conversely, for a given consolidation time, as the filling height of the geotextile tube increases, the consolidation effect worsens, resulting in a decreased dry density, cohesion, internal friction angle, and compression modulus, thereby reducing the deformation resistance of the tailings within the tube.

Author Contributions

Conceptualization, X.L., H.H. and Z.W.; methodology, X.L. and Z.W.; software, Q.X.; validation, Z.W., H.H. and Q.X.; formal analysis, X.L. and H.H.; investigation, Z.W. and H.H.; resources, X.L.; data curation, Z.W.; writing—original draft preparation, Z.W.; writing—review and editing, X.L.; project administration, X.L.; funding acquisition, X.L. All authors have read and agreed to the published version of the manuscript.

Funding

The authors are grateful to all organizations that funded the research in this paper, which was financially supported by the National Natural Science Foundation of China (No. 52169026) and the National Natural Science Foundation of China (No. 52369024).

Institutional Review Board Statement

Not applicable.

Informed Consent Statement

Not applicable.

Data Availability Statement

Data are contained within the article.

Conflicts of Interest

The authors declare no conflicts of interest.

References

  1. Shettima, A.U.; Hussin, M.W.; Ahmad, Y.; Mirza, J. Evaluation of iron ore tailings as replacement for fine aggregate in concrete. Constr. Build. Mater. 2016, 120, 72–79. [Google Scholar] [CrossRef]
  2. Wang, C.; Harbottle, D.; Liu, Q.X.; Xu, Z.H. Current state of fine mineral tailings treatment: A critical review on theory and practice. Miner. Eng. 2014, 58, 113–131. [Google Scholar] [CrossRef]
  3. Azizli, K.M.; Tan Chee, Y.; Birrel, J. Design of the Lohan Tailings Dam, Mamut Copper Mining Sdn. Bhd., Malaysia. Miner. Eng. 1995, 8, 705–712. [Google Scholar] [CrossRef]
  4. Salam, S.; Xiao, M.; Khosravifar, A.; Ziotopoulou, K. Seismic stability of coal tailings dams with spatially variable and liquefiable coal tailings using pore pressure plasticity models. Comput. Geotech. 2021, 132, 104017. [Google Scholar] [CrossRef]
  5. He, Y.; Chen, Q.S.; Qi, C.C.; Zhang, Q.L.; Xiao, C.C. Lithium slag and fly ash-based binder for cemented fine tailings backfill. J. Environ. Manag. 2019, 248, 109282. [Google Scholar] [CrossRef] [PubMed]
  6. Motta, F.L.; Gaikwad, R.; Botha, L.; Soares, J.B.P. Quantifying the effect of polyacrylamide dosage, Na+ and Ca2+ concentrations, and clay particle size on the flocculation of mature fine tailings with robust statistical methods. Chemosphere 2018, 208, 263–272. [Google Scholar] [CrossRef]
  7. Wu, S.; Yang, C.; Zhang, C.; Mao, H.; Du, Y.; Zhang, X. Particle size distribution of fine-grained tailings based on Weibull distribution. J. Chongqing Univ. 2016, 39, 1–12. [Google Scholar]
  8. Yin, G.; Zhang, D.; Wei, Z.; Wan, L.; Huang, G. Testing study on interaction characteristics between fine grained tailings and geosynthetics. Chin. J. Rock Mech. Eng. 2004, 23, 426–429. [Google Scholar]
  9. Chu, J.; Yan, S.W.; Li, W. Innovative methods for dike construction—An overview. Geotext. Geomembr. 2012, 30, 35–42. [Google Scholar] [CrossRef]
  10. Yang, Y.; Wei, Z.; Cao, G.; Yang, Y.; Wang, H.; Zhuang, S.; Lu, T. A case study on utilizing geotextile tubes for tailings dams construction in China. Geotext. Geomembr. 2019, 47, 187–192. [Google Scholar] [CrossRef]
  11. Li, Q.Y.; Ma, G.W.; Li, P.; Su, Z.D. Dynamic characteristics of tailings dam with geotextile tubes under seismic load. Rev. Adv. Mater. Sci. 2021, 60, 599–614. [Google Scholar] [CrossRef]
  12. Fatema, N.; Bhatia, S.K. Sediment Retention and Clogging of Geotextile with High Water Content Slurries. Int. J. Geosynth. Ground Eng. 2018, 4, 13. [Google Scholar] [CrossRef]
  13. Moo-Young, H.K.; Tucker, W.R. Evaluation of vacuum filtration testing for geotextile tubes. Geotext. Geomembr. 2002, 20, 191–212. [Google Scholar] [CrossRef]
  14. Chow, R.W. Dewatering fine-grained soils using geotextile tubes—An Australian case study. In Proceedings of the 8th International Conference on Geosynthetics (8ICG), Yokohama, Japan, 18–22 September 2006; pp. 511–514. [Google Scholar]
  15. Kutay, M.E.; Aydilek, A.H. Retention performance of geotextile containers confining geomaterials. Geosynth. Int. 2004, 11, 100–113. [Google Scholar] [CrossRef]
  16. Zhu, Y.S. Geopipe bags and their application prospects. China Text. Lead. 2005, 12, 75–76+78+92. [Google Scholar] [CrossRef]
  17. Ratnayesuraj, C.R.; Bhatia, S.K. Testing and analytical modeling of two-dimensional geotextile tube dewatering process. Geosynth. Int. 2018, 25, 132–149. [Google Scholar] [CrossRef]
  18. Guo, W.; Chu, J.; Zhou, B. Model tests on methods to improve dewatering efficiency for sludge-inflated geotextile tubes. Geosynth. Int. 2015, 22, 380–392. [Google Scholar] [CrossRef]
  19. Lawson, C.R. Geotextile containment for hydraulic and environmental engineering. In Proceedings of the 8th International Conference on Geosynthetics (8ICG), Yokohama, Japan, 18–22 September 2006; pp. 7–48. [Google Scholar]
  20. Middleton, G.V. The Tukey Chi-Square Test. J. Geol. 1965, 73, 547–549. [Google Scholar] [CrossRef]
  21. Shu, Y. Technical progress of geotextile tubes dam engineering in China. Adv. Sci. Technol. Water Resour. 2018, 38, 1–11+18. [Google Scholar]
  22. Alvarez, I.E.; Rubio, R.; Ricalde, H. Beach restoration with geotextile tubes as submerged breakwaters in Yucatan, Mexico. Geotext. Geomembr. 2007, 25, 233–241. [Google Scholar] [CrossRef]
  23. Dong, Z.; Liu, J.; Zhu, X.; Zhang, B.; Gao, M. Key technology research and application of cofferdam construction in large-area reclamation project. Port Waterw. Eng. 2013, 5, 168–175. [Google Scholar] [CrossRef]
  24. Yan, S.W.; Chu, J. Construction of an offshore dike using slurry filled geotextile mats. Geotext. Geomembr. 2010, 28, 422–433. [Google Scholar] [CrossRef]
  25. Kim, H.; Kim, H. Consolidation Analysis of Geotextile Tubes Filled with Highly Compressible Sludge Using Variable Coefficients of Consolidation. J. Korean Geoenviron. Soc. 2021, 22, 25–32. [Google Scholar]
  26. Liu, W.; Zhang, Y.; Yang, G. Model experimental study of filling property of geotextile tube. Chin. J. Rock Mech. Eng. 2013, 32, 2544–2549. [Google Scholar]
  27. Koerner, G.R.; Koerner, R.M. Geotextile tube assessment using a hanging bag test. Geotext. Geomembr. 2006, 24, 129–137. [Google Scholar] [CrossRef]
  28. Cui, X.; Zhou, H.; Qie, Y.; Wu, P. Experimental Study on the Characteristics of Geofabriform Filling Body with Fine Tailings. Nonferrous Met. (Miner. Process. Sect.) 2016, 198, 60–64. [Google Scholar]
  29. Han, Y.; Cui, X.; Qie, Y. Industrial test of damming using different kinds of geofabriform filled with grade tailings. Nonferrous Met. (Min. Sect.) 2019, 71, 41–46. [Google Scholar] [CrossRef]
  30. Kim, H.J.; Park, T.W.; Dinoy, P.R.; Kim, H.S.; Kim, H.J. Design and consolidation analysis of geotextile tubes for the Saemangeum project in Korea. Geosynth. Int. 2018, 25, 507–524. [Google Scholar] [CrossRef]
  31. Kim, H.J.; Dinoy, P.R. Two-dimensional consolidation analysis of geotextile tubes filled with fine-grained material. Geotext. Geomembr. 2021, 49, 1149–1164. [Google Scholar] [CrossRef]
  32. Kim, H.J.; Won, M.S.; Jamin, J.C.; Joo, J.H. Numerical and field test verifications for the deformation behavior of geotextile tubes considering 1D and areal strain. Geotext. Geomembr. 2016, 44, 209–218. [Google Scholar] [CrossRef]
  33. Leshchinsky, D.; Leshchinsky, O.; Ling, H.I.; Gilbert, P.A. Geosynthetic tubes for confining pressurized slurry: Some design aspects. J. Geotech. Eng. 1996, 122, 682–690. [Google Scholar] [CrossRef]
  34. Muthukumaran, A.E.; Ilamparuthi, K. Laboratory studies on geotextile filters as used in geotextile tube dewatering. Geotext. Geomembr. 2006, 24, 210–219. [Google Scholar] [CrossRef]
  35. Yee, T.W.; Lawson, C.R. Modelling the geotextile tube dewatering process. Geosynth. Int. 2012, 19, 339–353. [Google Scholar] [CrossRef]
  36. Zhang, H.; Wang, W.J.; Liu, S.J.; Chu, J.; Sun, H.L.; Geng, X.Y.; Cai, Y.Q. Consolidation of Sludge Dewatered in Geotextile Tubes under Combined Fill and Vacuum Preloading. J. Geotech. Geoenviron. Eng. 2022, 148, 17. [Google Scholar] [CrossRef]
  37. Zhang, H.; Geng, X.Y.; Sun, H.L.; Deng, Y.F.; Liu, S.J.; Cai, Y.Q. Consolidation theory of slurry dewatered by permeable geotextile tube with distributed prefabricated drains. Can. Geotech. J. 2023, 60, 213–229. [Google Scholar] [CrossRef]
  38. Zhang, H.; Sun, H.-l.; Liu, S.-j.; Chu, J.; Shi, L.; Geng, X.-y.; Deng, Y.-f.; Cai, Y.-q. Large-Strain Consolidation of Sludge in Multiple-Drainage Geotextile Tubes. J. Geotech. Geoenviron. Eng. 2023, 149, 04023037. [Google Scholar] [CrossRef]
  39. Cao, B.; Tian, Y.; Gui, R.; Liu, Y. Experimental Study on the Effect of Key Factors on the Soil–Water Characteristic Curves of Fine-Grained Tailings. Front. Environ. Sci. 2021, 9, 710986. [Google Scholar] [CrossRef]
  40. Fu, S.; Liu, X.; Liu, X.; Chen, M.; Deng, Z. An experimental study of the mechanical properties of tailings filling mold bag. Hydrogeol. Eng. Geol. 2018, 45, 83–88. [Google Scholar]
  41. Zhou, H. Study on the Stability of Tailings Dam Based on the Geotextile Tubes Method. Ph.D. Thesis, University of Science and Technology Beijing, Beijing, China, 2017. [Google Scholar]
  42. Haeri, S.M.; Noorzad, R.; Oskoorouchi, A.M. Effect of geotextile reinforcement on the mechanical behavior of sand. Geotext. Geomembr. 2000, 18, 385–402. [Google Scholar] [CrossRef]
  43. Tan, T.S.; Inoue, T.; Lee, S.L. Hyperbolic method for consolidation analysis. J. Geotech. Eng. 1991, 117, 1723–1737. [Google Scholar] [CrossRef]
  44. Arulrajah, A.; Nikraz, H.; Bo, M.W. Factors affecting field instrumentation assessment of marine clay treated with prefabricated vertical drains. Geotext. Geomembr. 2004, 22, 415–437. [Google Scholar] [CrossRef]
  45. Han, Y. Experimental Study on Filling Characteristics of Geofabriform with Fine Tailings of Different Concentration and Particle Size Distribution. Mod. Min. 2019, 35, 127–130+137. [Google Scholar]
Figure 1. Particle-size distribution curve of graded tailings.
Sustainability 16 05270 g001
Figure 2. Geotextile tube-filling and consolidation test setup.
Sustainability 16 05270 g002
Figure 3. Geotextile tube-filling and drainage process.
Sustainability 16 05270 g003
Figure 4. Diagram of drainage and consolidation process of geotextile tubes. (a) Geotextile tubes drainage. (b) Geotextile tubes consolidation.
Sustainability 16 05270 g004
Figure 5. Variation in geotextile tube height during filling stage. (a) Under different filling concentrations. (b) Under different filling heights.
Sustainability 16 05270 g005
Figure 6. Variation in drainage volume under different filling concentrations.
Sustainability 16 05270 g006
Figure 7. Variation in drainage at different filling heights.
Sustainability 16 05270 g007
Figure 8. Variation in geotextile tube height at different filling concentrations.
Sustainability 16 05270 g008
Figure 9. Variation in geotextile tube height at different filling heights.
Sustainability 16 05270 g009
Figure 10. t vs. t/st for different filling concentrations.
Sustainability 16 05270 g010
Figure 11. Variation in solidity with time for different filling concentrations.
Sustainability 16 05270 g011
Figure 12. t vs. t/st for different filling heights.
Sustainability 16 05270 g012
Figure 13. Variation in consolidation degree with time for different filling heights.
Sustainability 16 05270 g013
Figure 14. Water content change rule with time under different filling concentrations.
Sustainability 16 05270 g014
Figure 15. Law of change of dry density with time under different filling concentrations.
Sustainability 16 05270 g015
Figure 16. Water content change rule with time under different filling heights.
Sustainability 16 05270 g016
Figure 17. Changes in dry density with time under different filling heights.
Sustainability 16 05270 g017
Figure 18. Tailing shear strength as a function of time for different filling concentrations. (a) Variation in cohesion with consolidation time. (b) Variation in angle of internal friction with consolidation time.
Sustainability 16 05270 g018
Figure 19. Effect of concentration on compression modulus of tailings in bags at different consolidation times.
Sustainability 16 05270 g019
Figure 20. Tailing shear strength as function of time for different filling heights. (a) Variation in cohesion with consolidation time. (b) Variation in angle of internal friction with consolidation time.
Sustainability 16 05270 g020
Figure 21. Effect of height on compression modulus of tailings in bags in case of different consolidation times.
Sustainability 16 05270 g021
Table 1. Main parameter index of the geotextile tubes.
Unit Thicknesses/mmMass per Unit Area/(g/m2)Tensile Strength/(kN/m)Elongation/%Tearing Force/NVertical Permeability Coefficient/(cm/s)Equivalent Pore Size O95/mm
WarpWoofWarpWoof
0.518035.225.120212911.1 × 10−30.105
Table 2. Geotextile tubes test scheme.
Serial NumberGeotextile Tube NumberConcentration of Filling and Irrigation/%Filling Height/cmConsolidation Time/d
11~325105, 10, 15
24~660105, 10, 15
37~940105, 10, 15
410~124075, 10, 15
513~1540135, 10, 15
Disclaimer/Publisher’s Note: The statements, opinions and data contained in all publications are solely those of the individual author(s) and contributor(s) and not of MDPI and/or the editor(s). MDPI and/or the editor(s) disclaim responsibility for any injury to people or property resulting from any ideas, methods, instructions or products referred to in the content.

