
The Frequency Characteristics of Vibration Events in an Underground Coal Mine and Their Implications on Rock Burst Monitoring and Prevention

Abstract
:1. Introduction
2. Sensor Assembling and Data Acquisition System
3. Main Frequency Characterization and Statistical Analysis
4. Discussion
5. Conclusions
- (1)
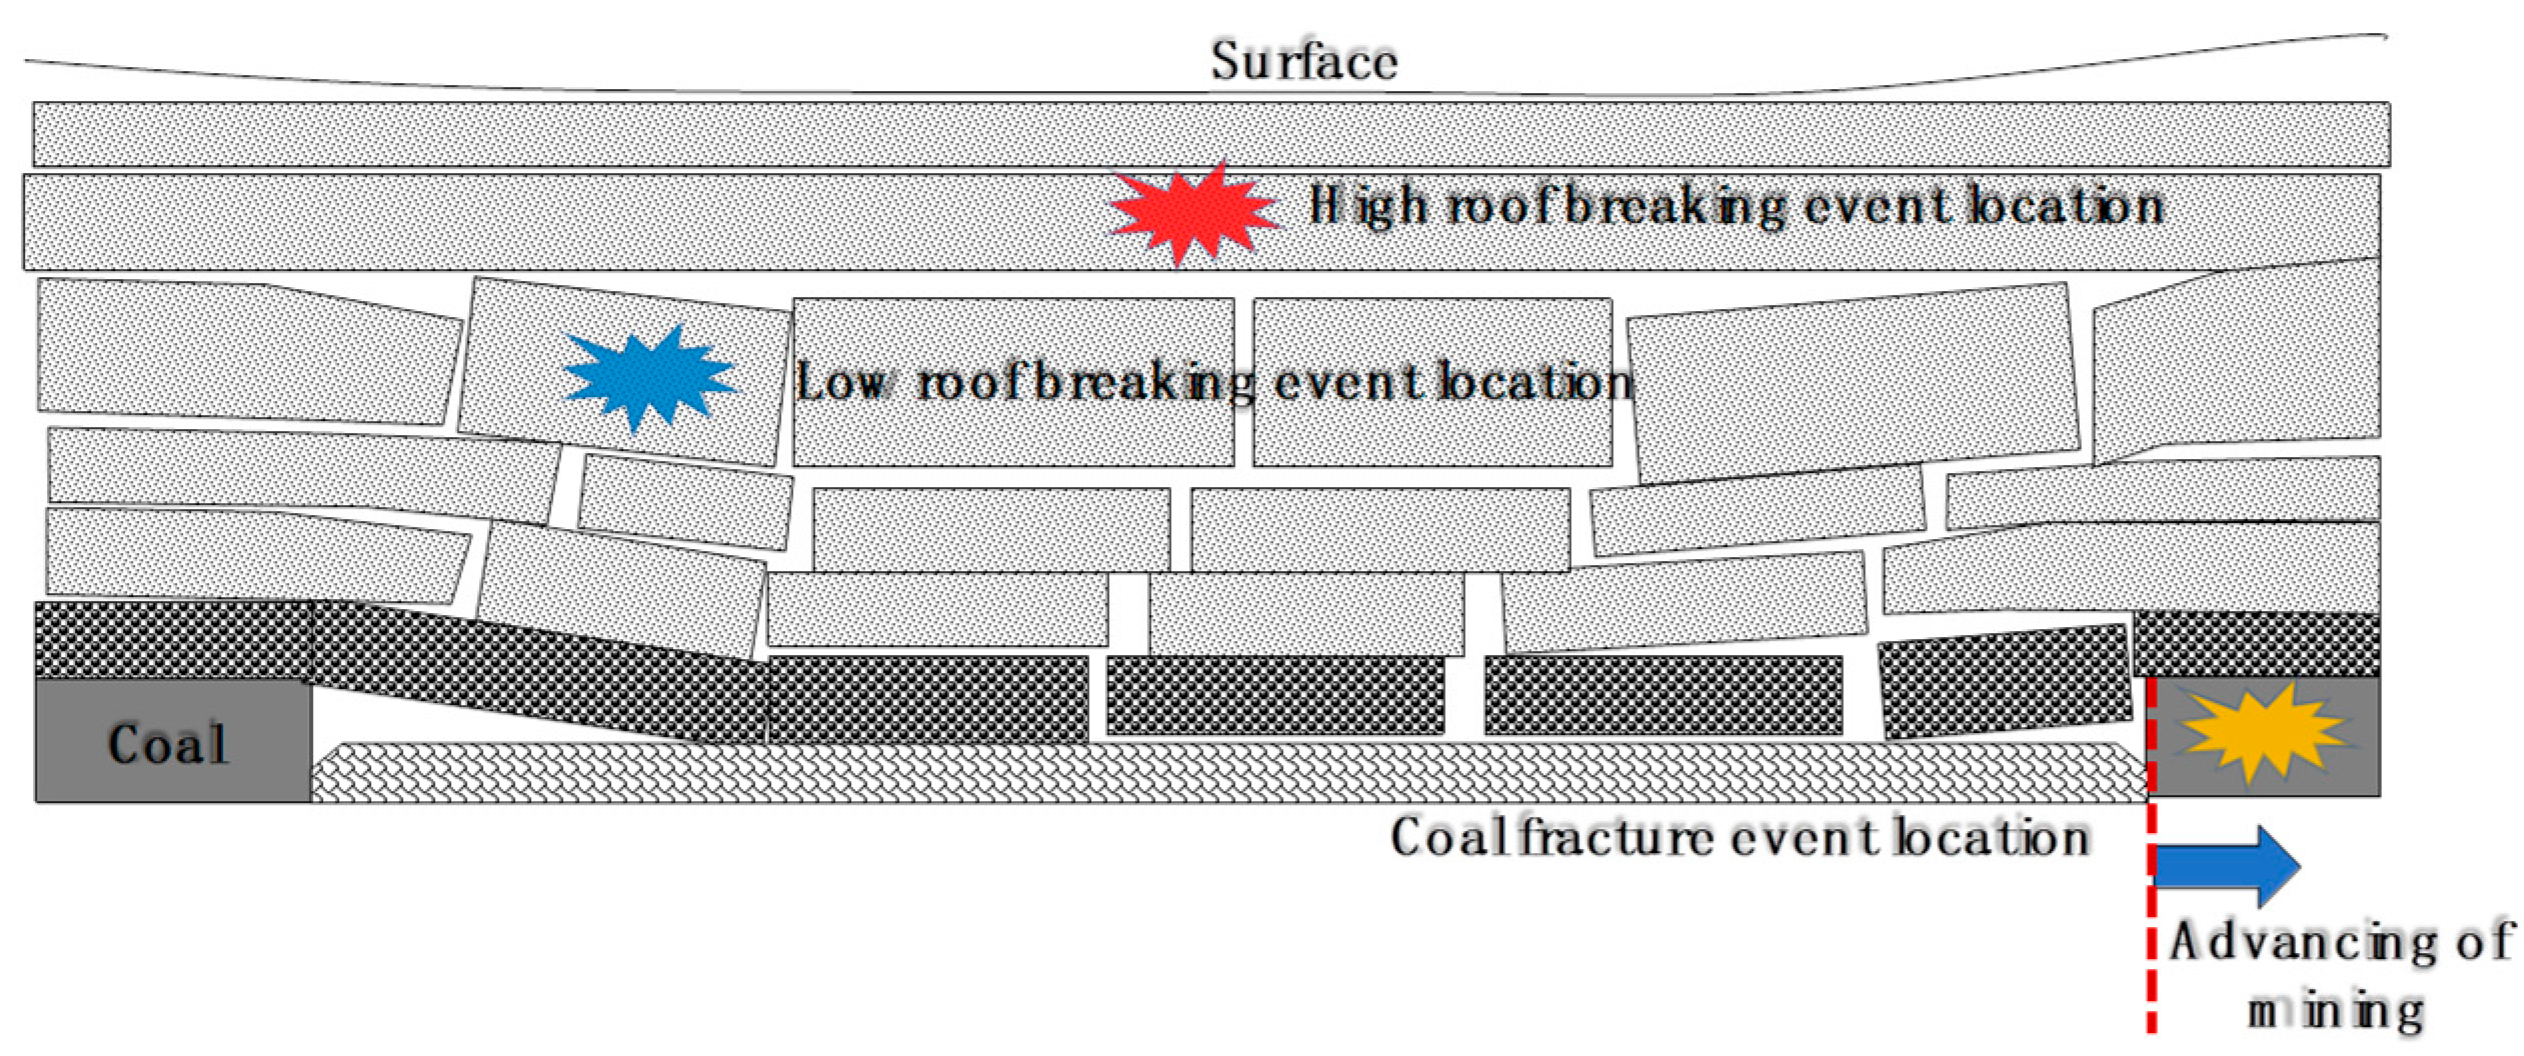
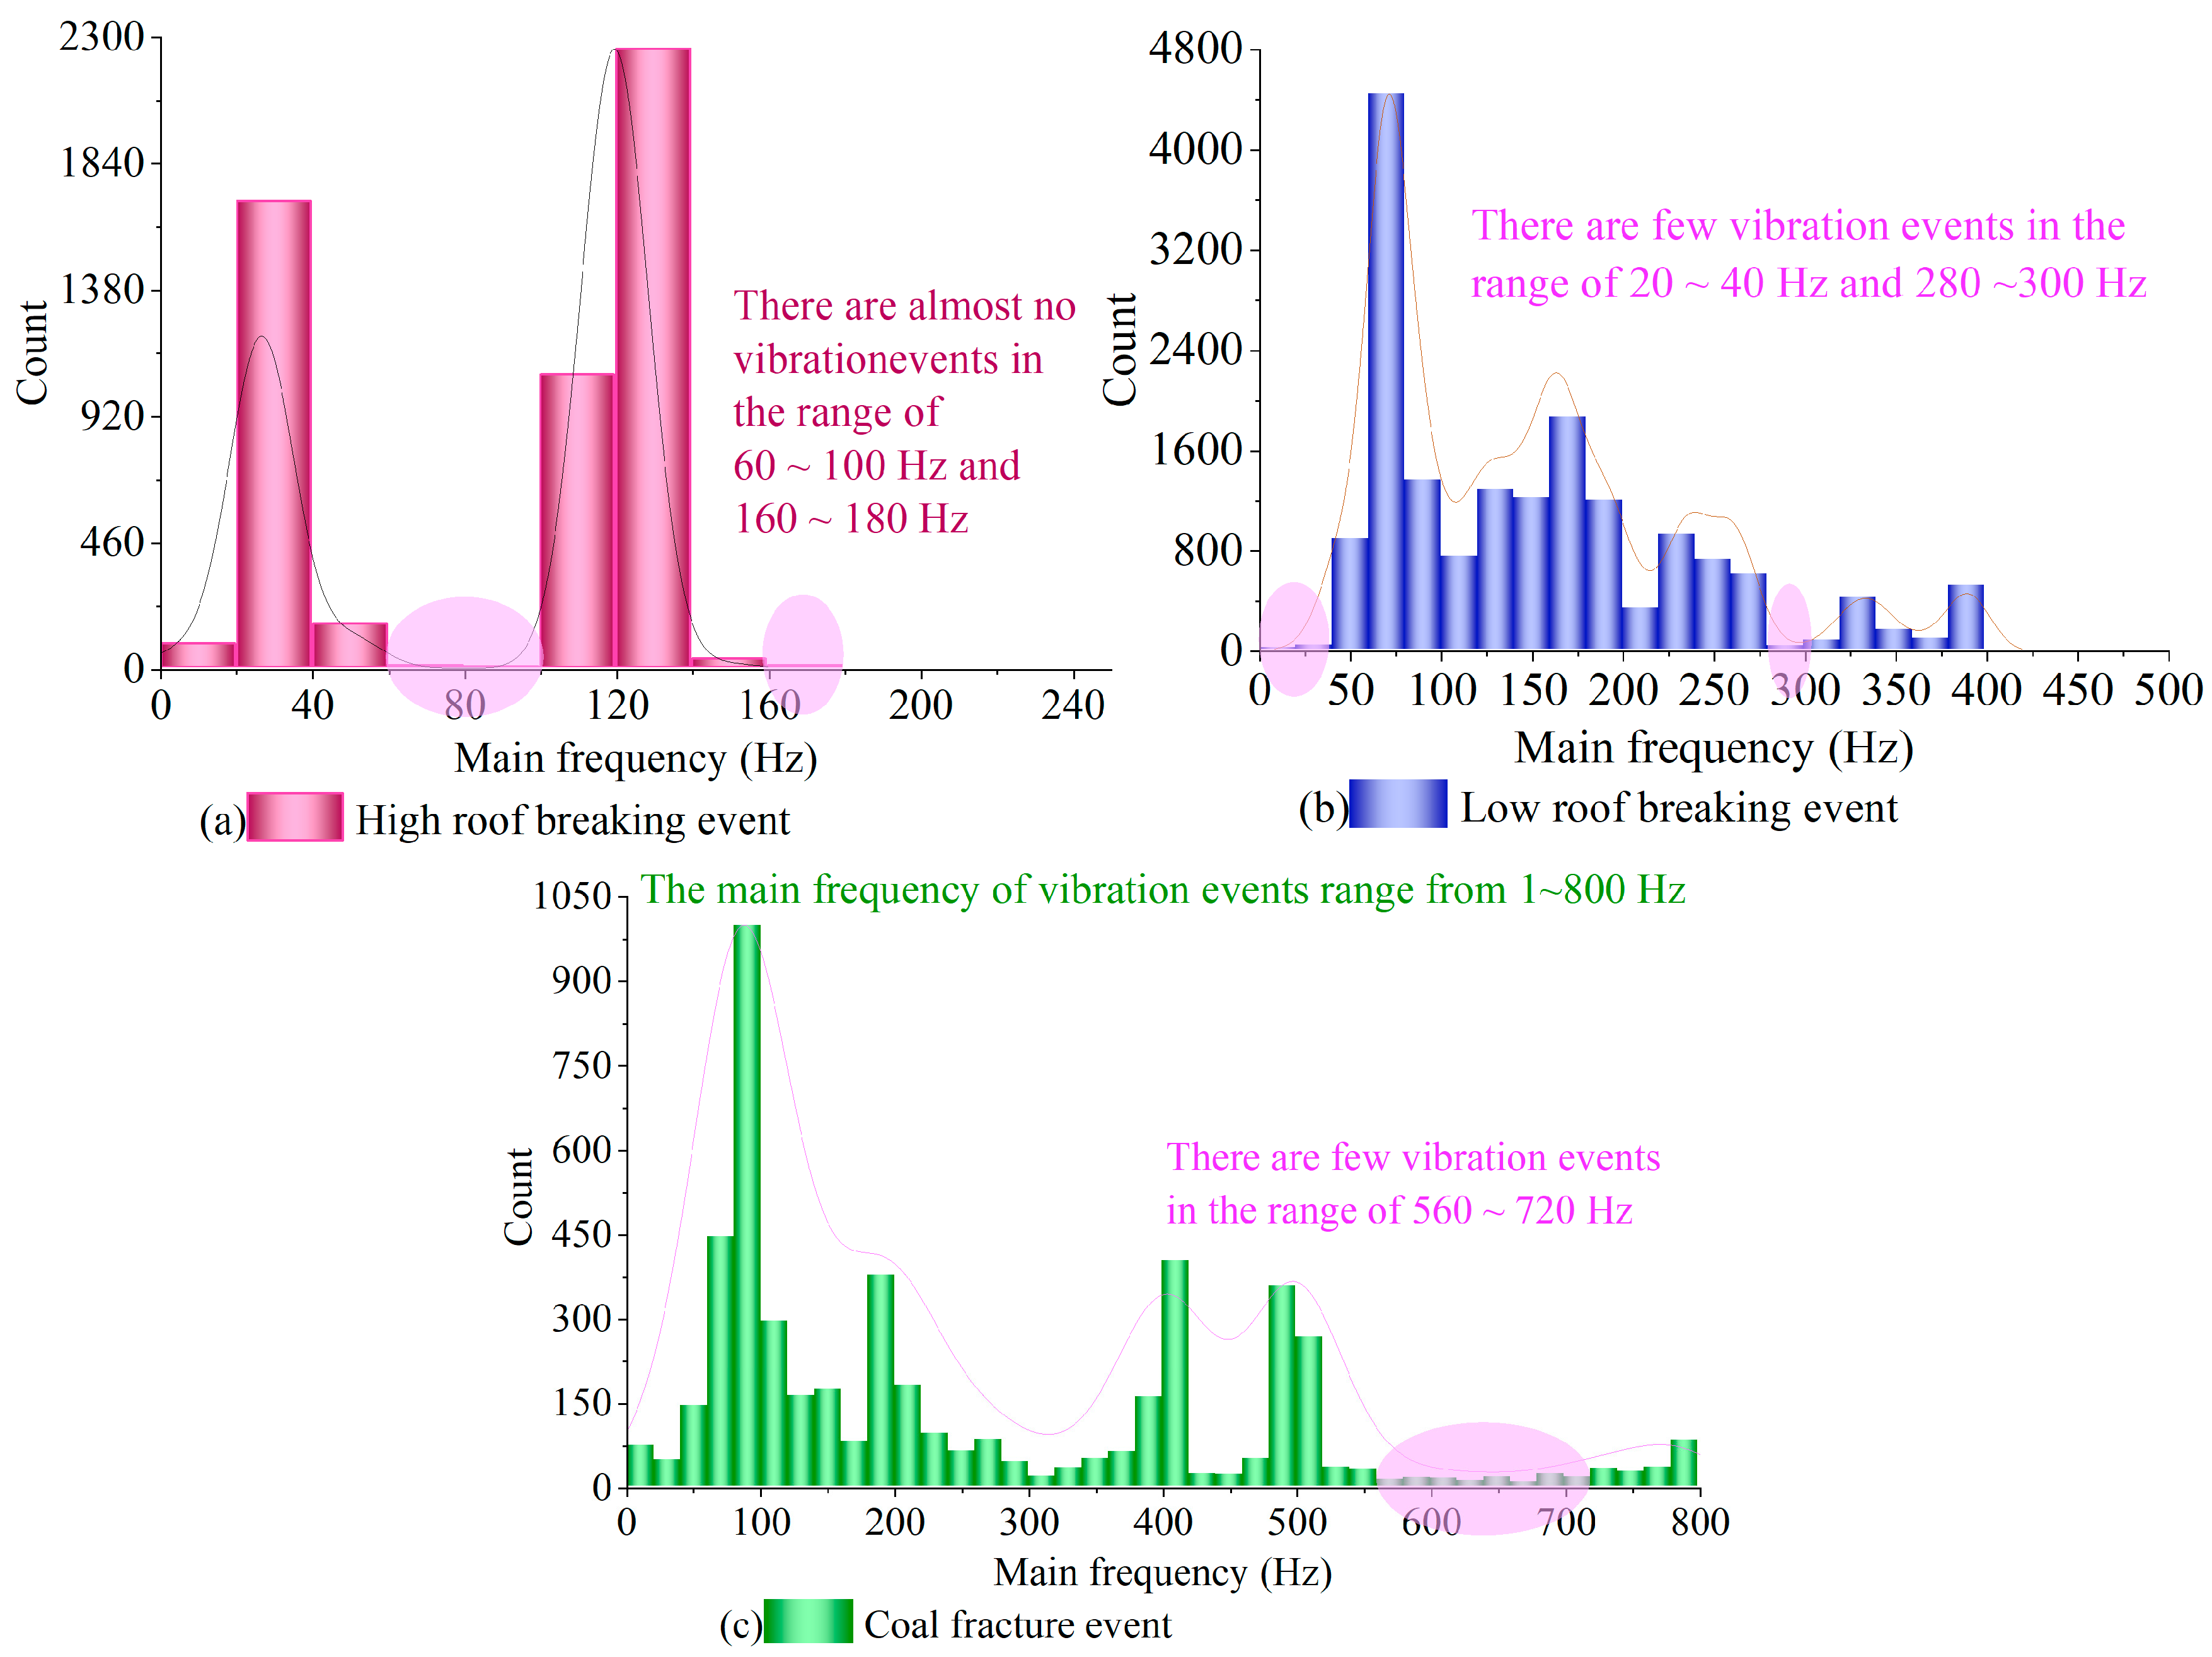
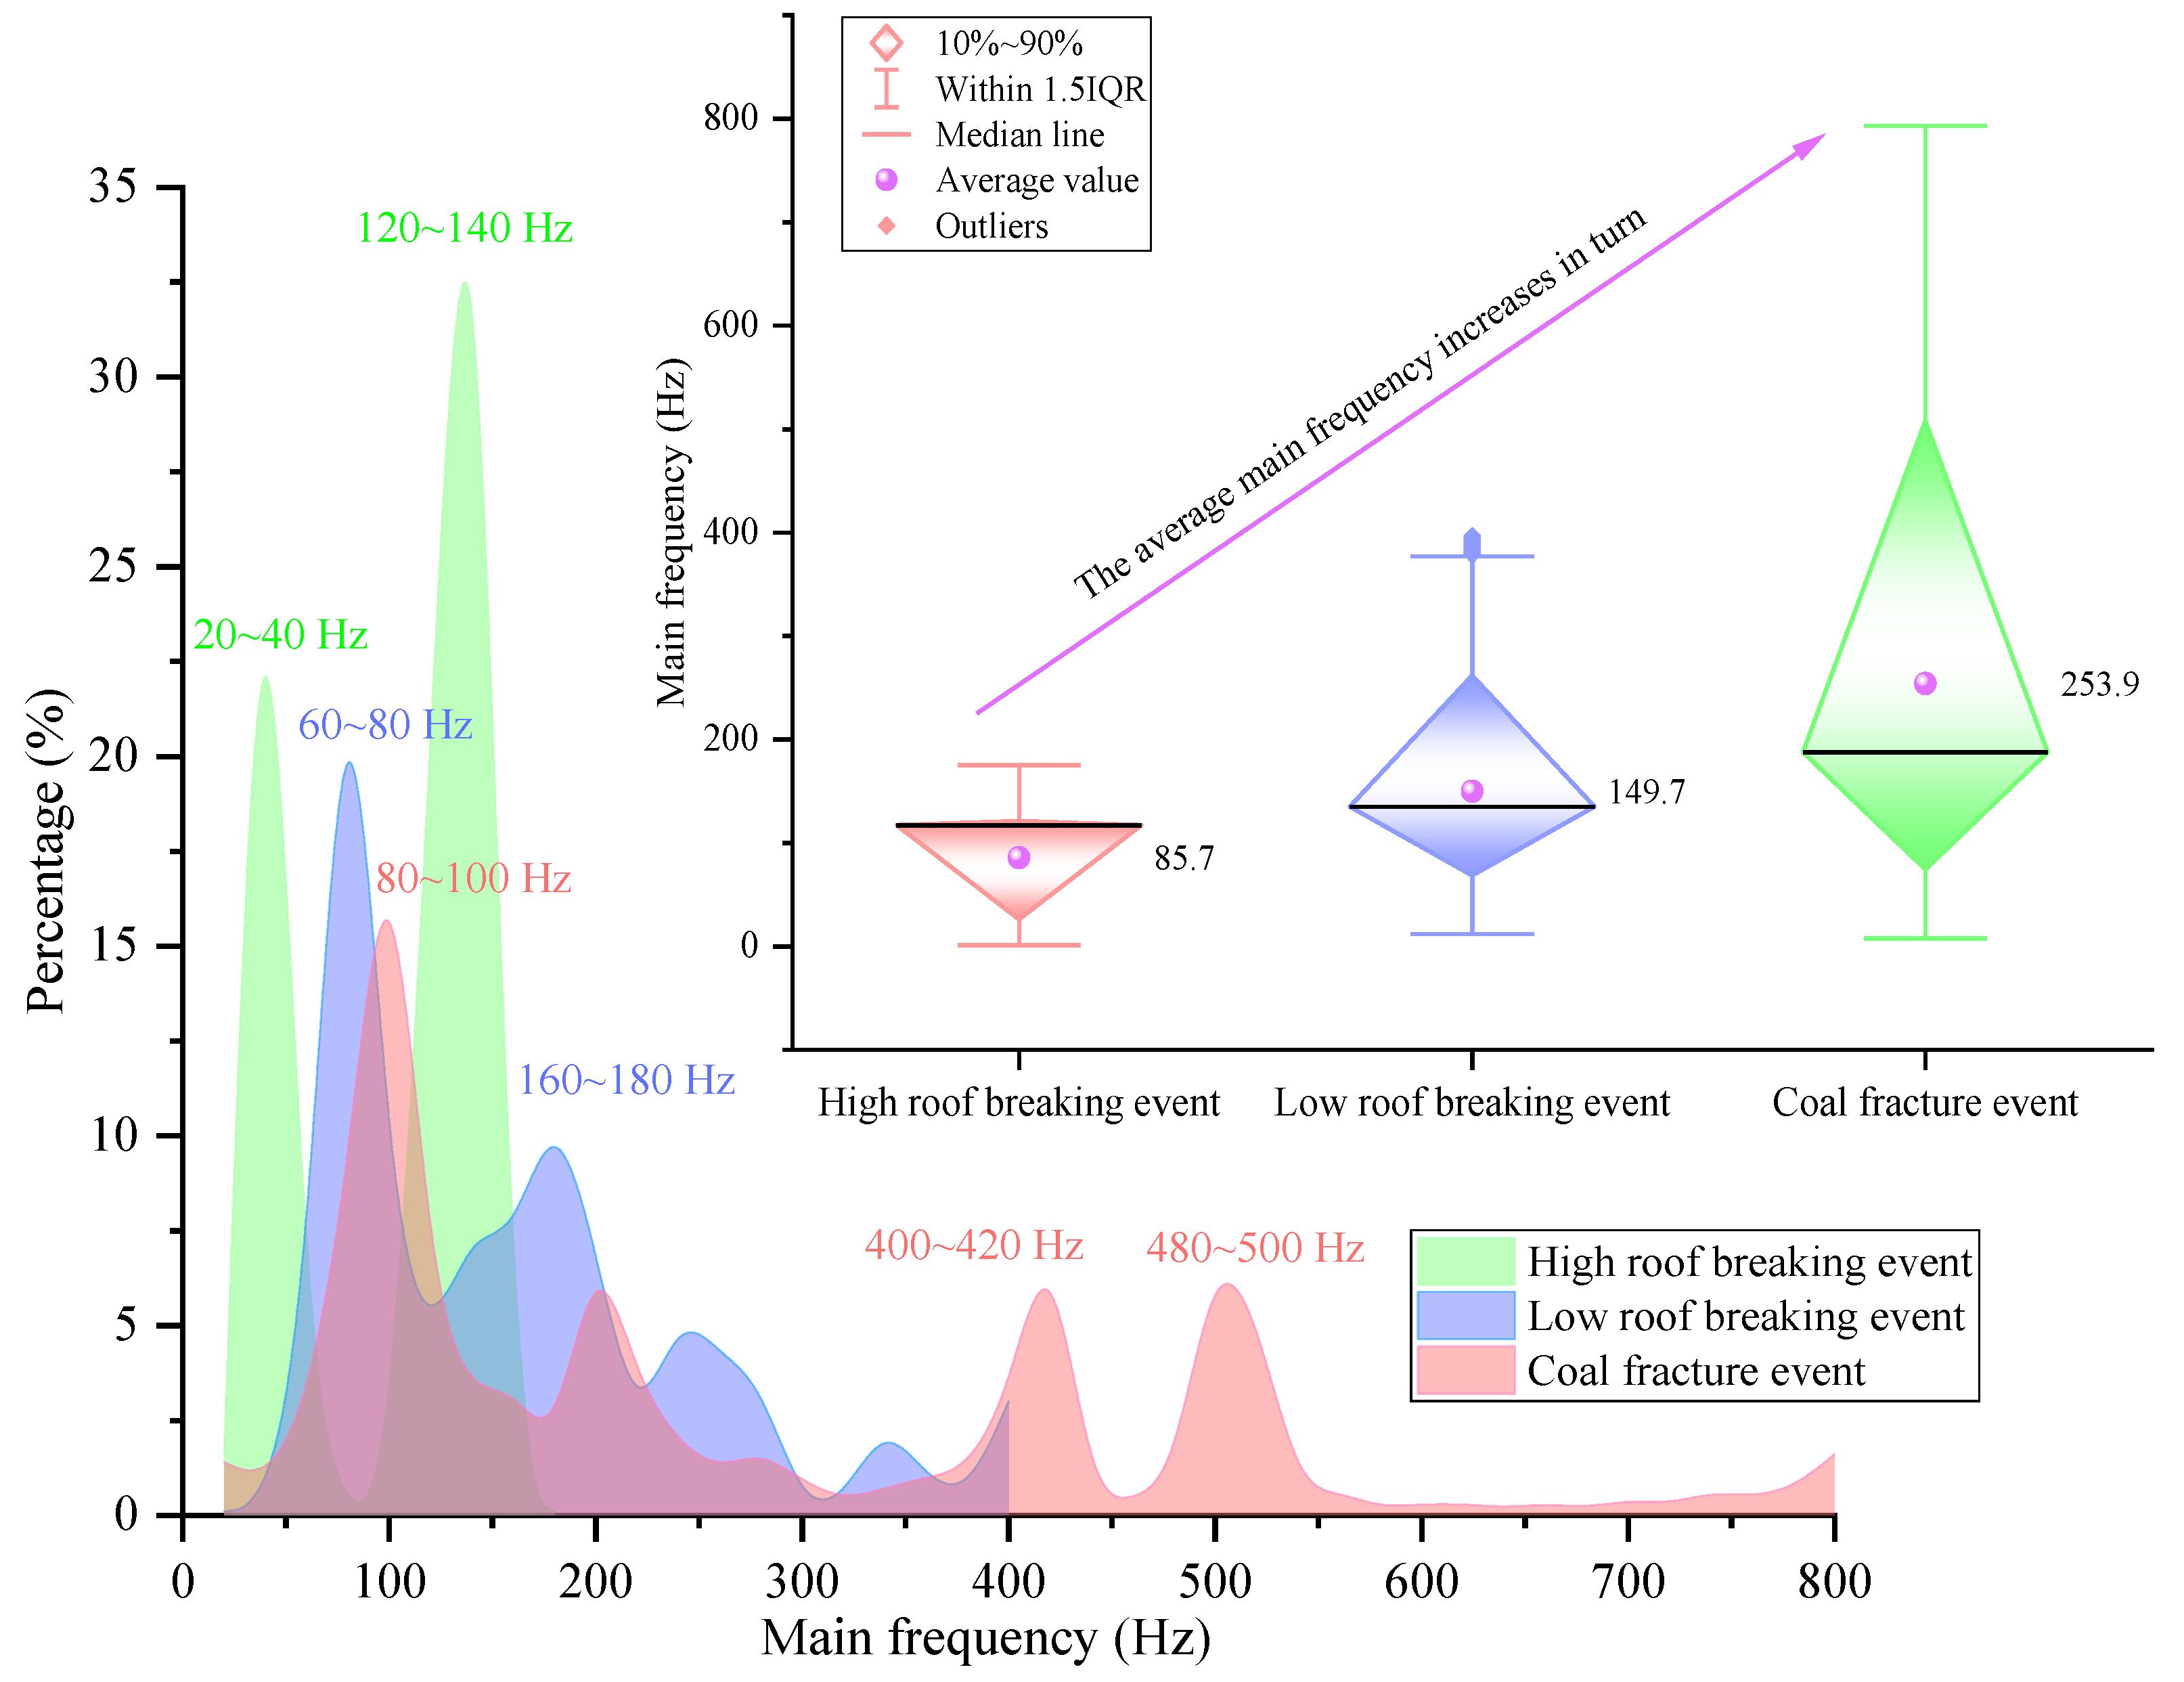
- The main frequency distribution ranges of low roof breaking events, high roof breaking events, and coal fracture events are 20–400 Hz, 1–180 Hz, and 1–800 Hz, respectively. Therefore, the corresponding frequency distribution range can be set to monitor different vibration events to improve detection accuracy and reduce the test and analysis durations.
- (2)
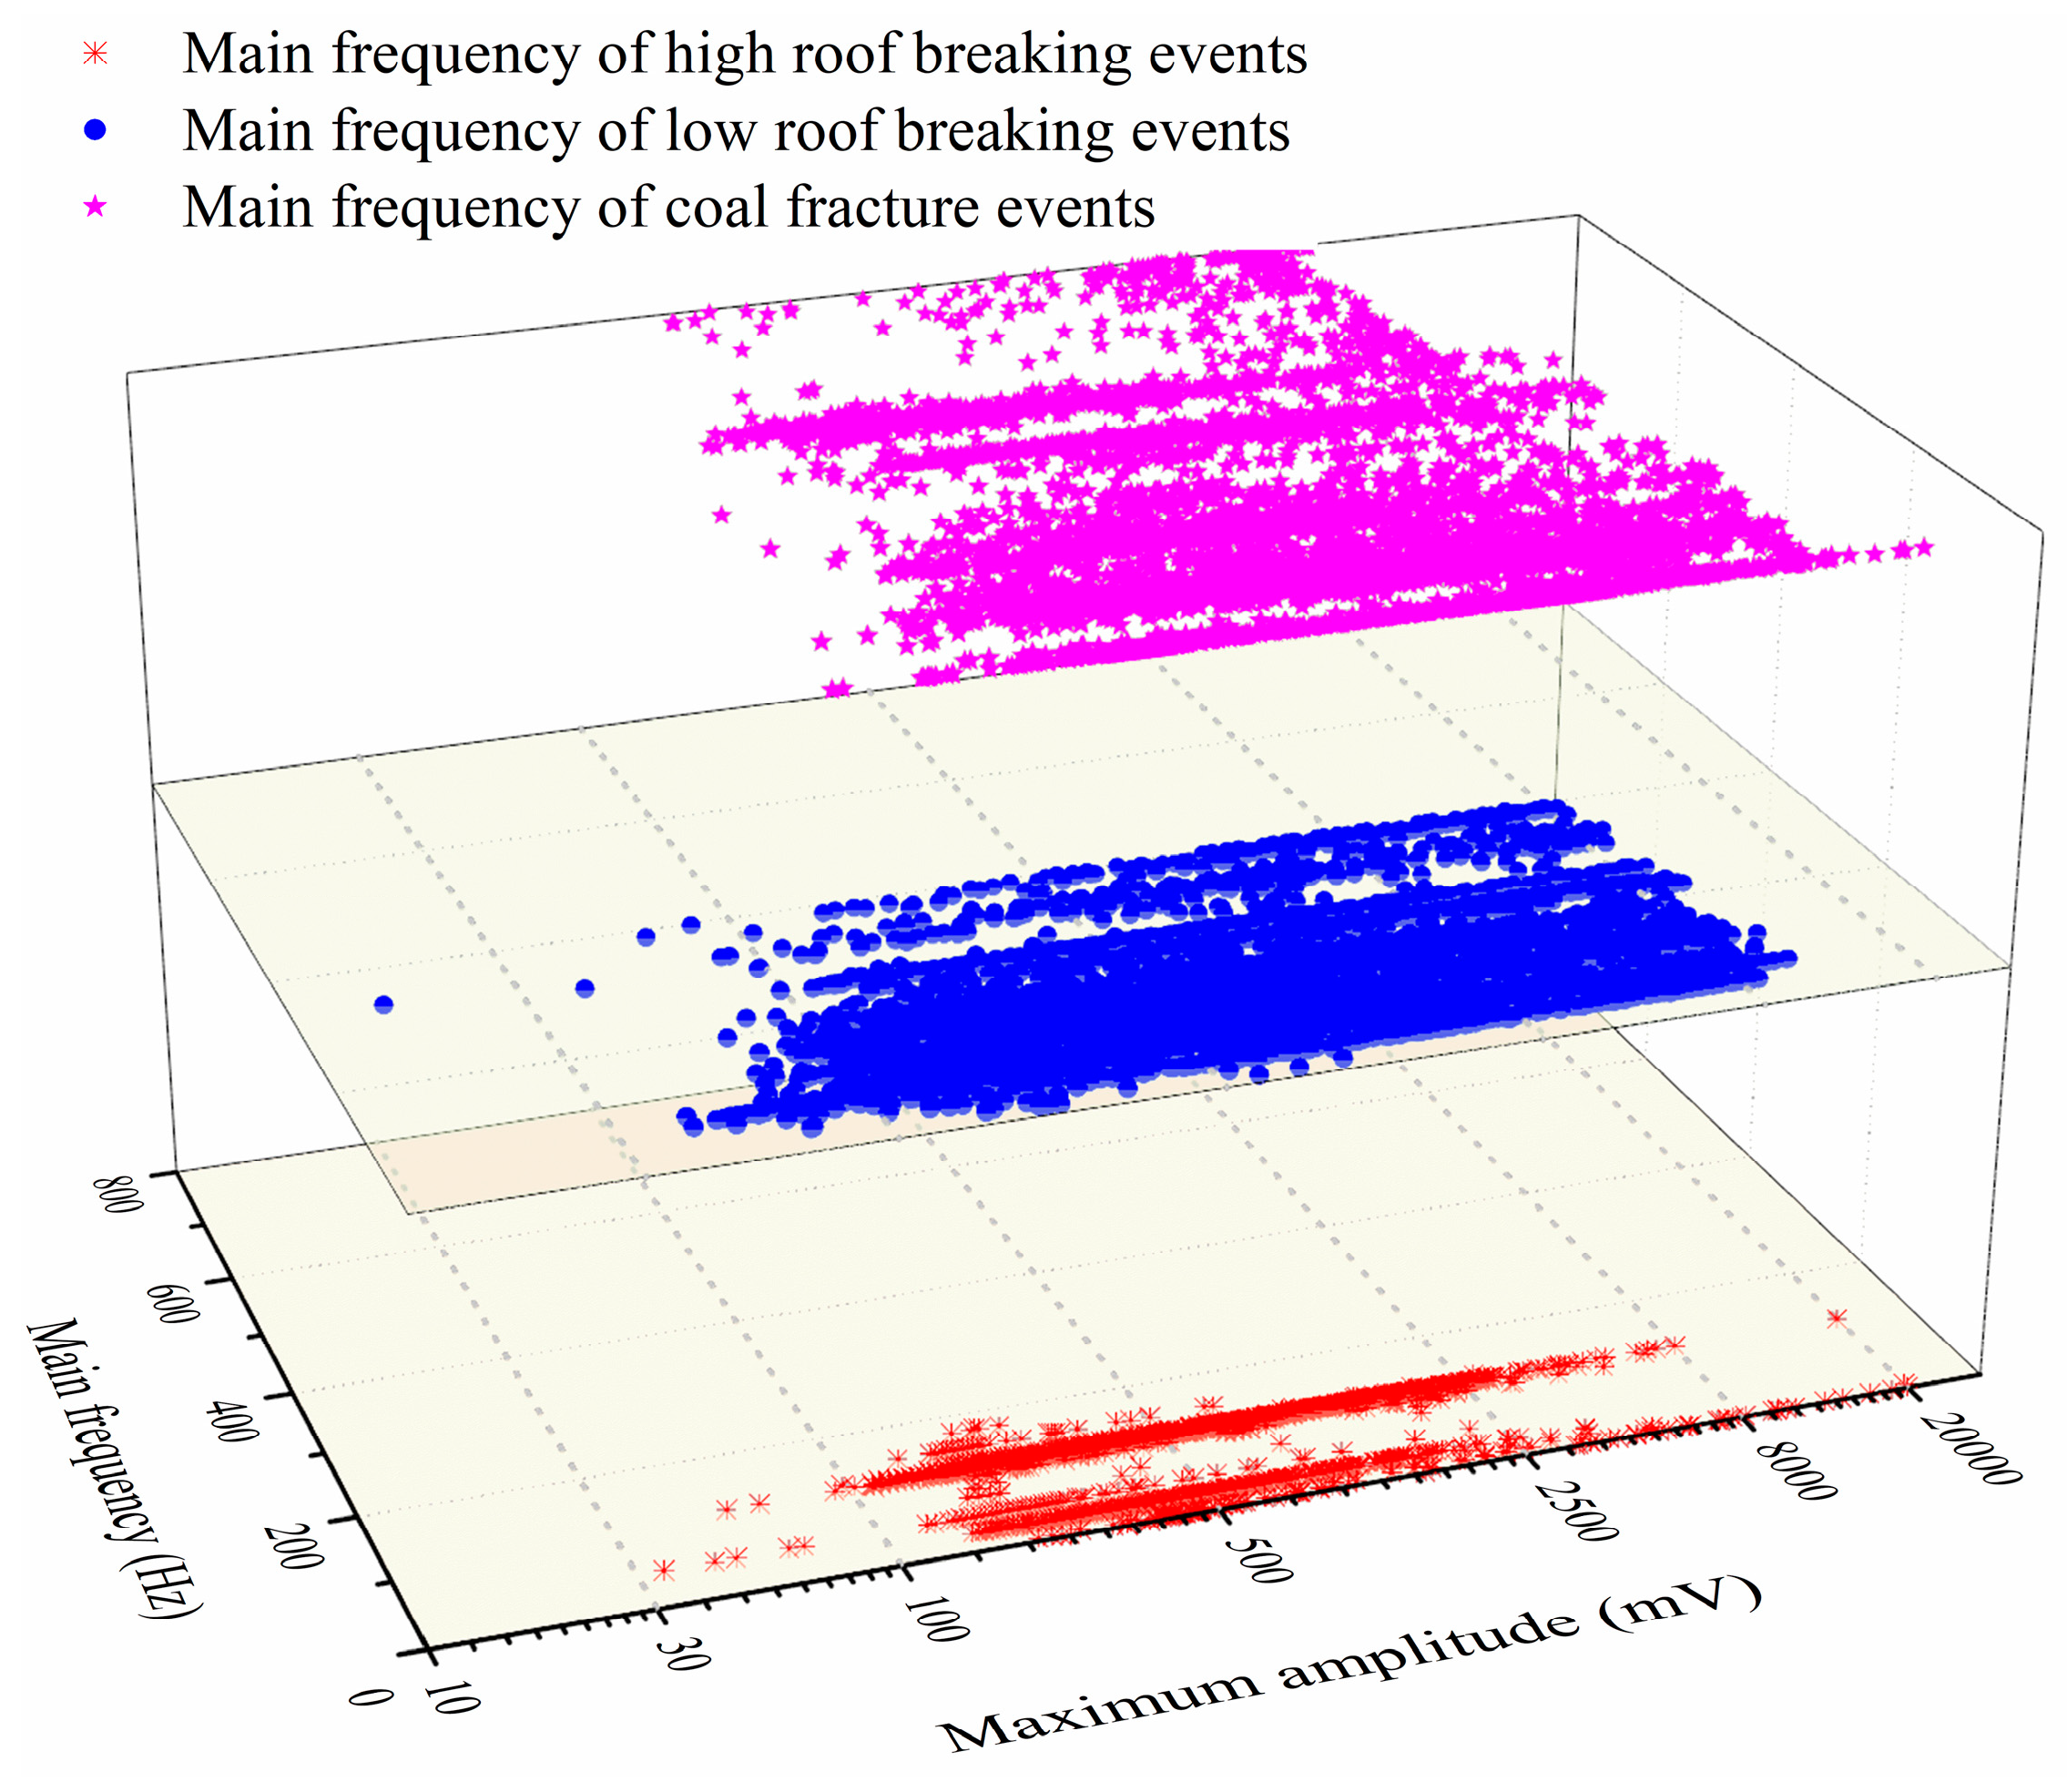
- The failure mechanism in a high roof is quite different from that of low roof failure and coal fracturing, with the main frequency and amplitude clustering in a limited zone close to the origin. Coal fracturing and lower roof failure show a synergistic effect in both the maximum amplitude and the main frequency.
- (3)
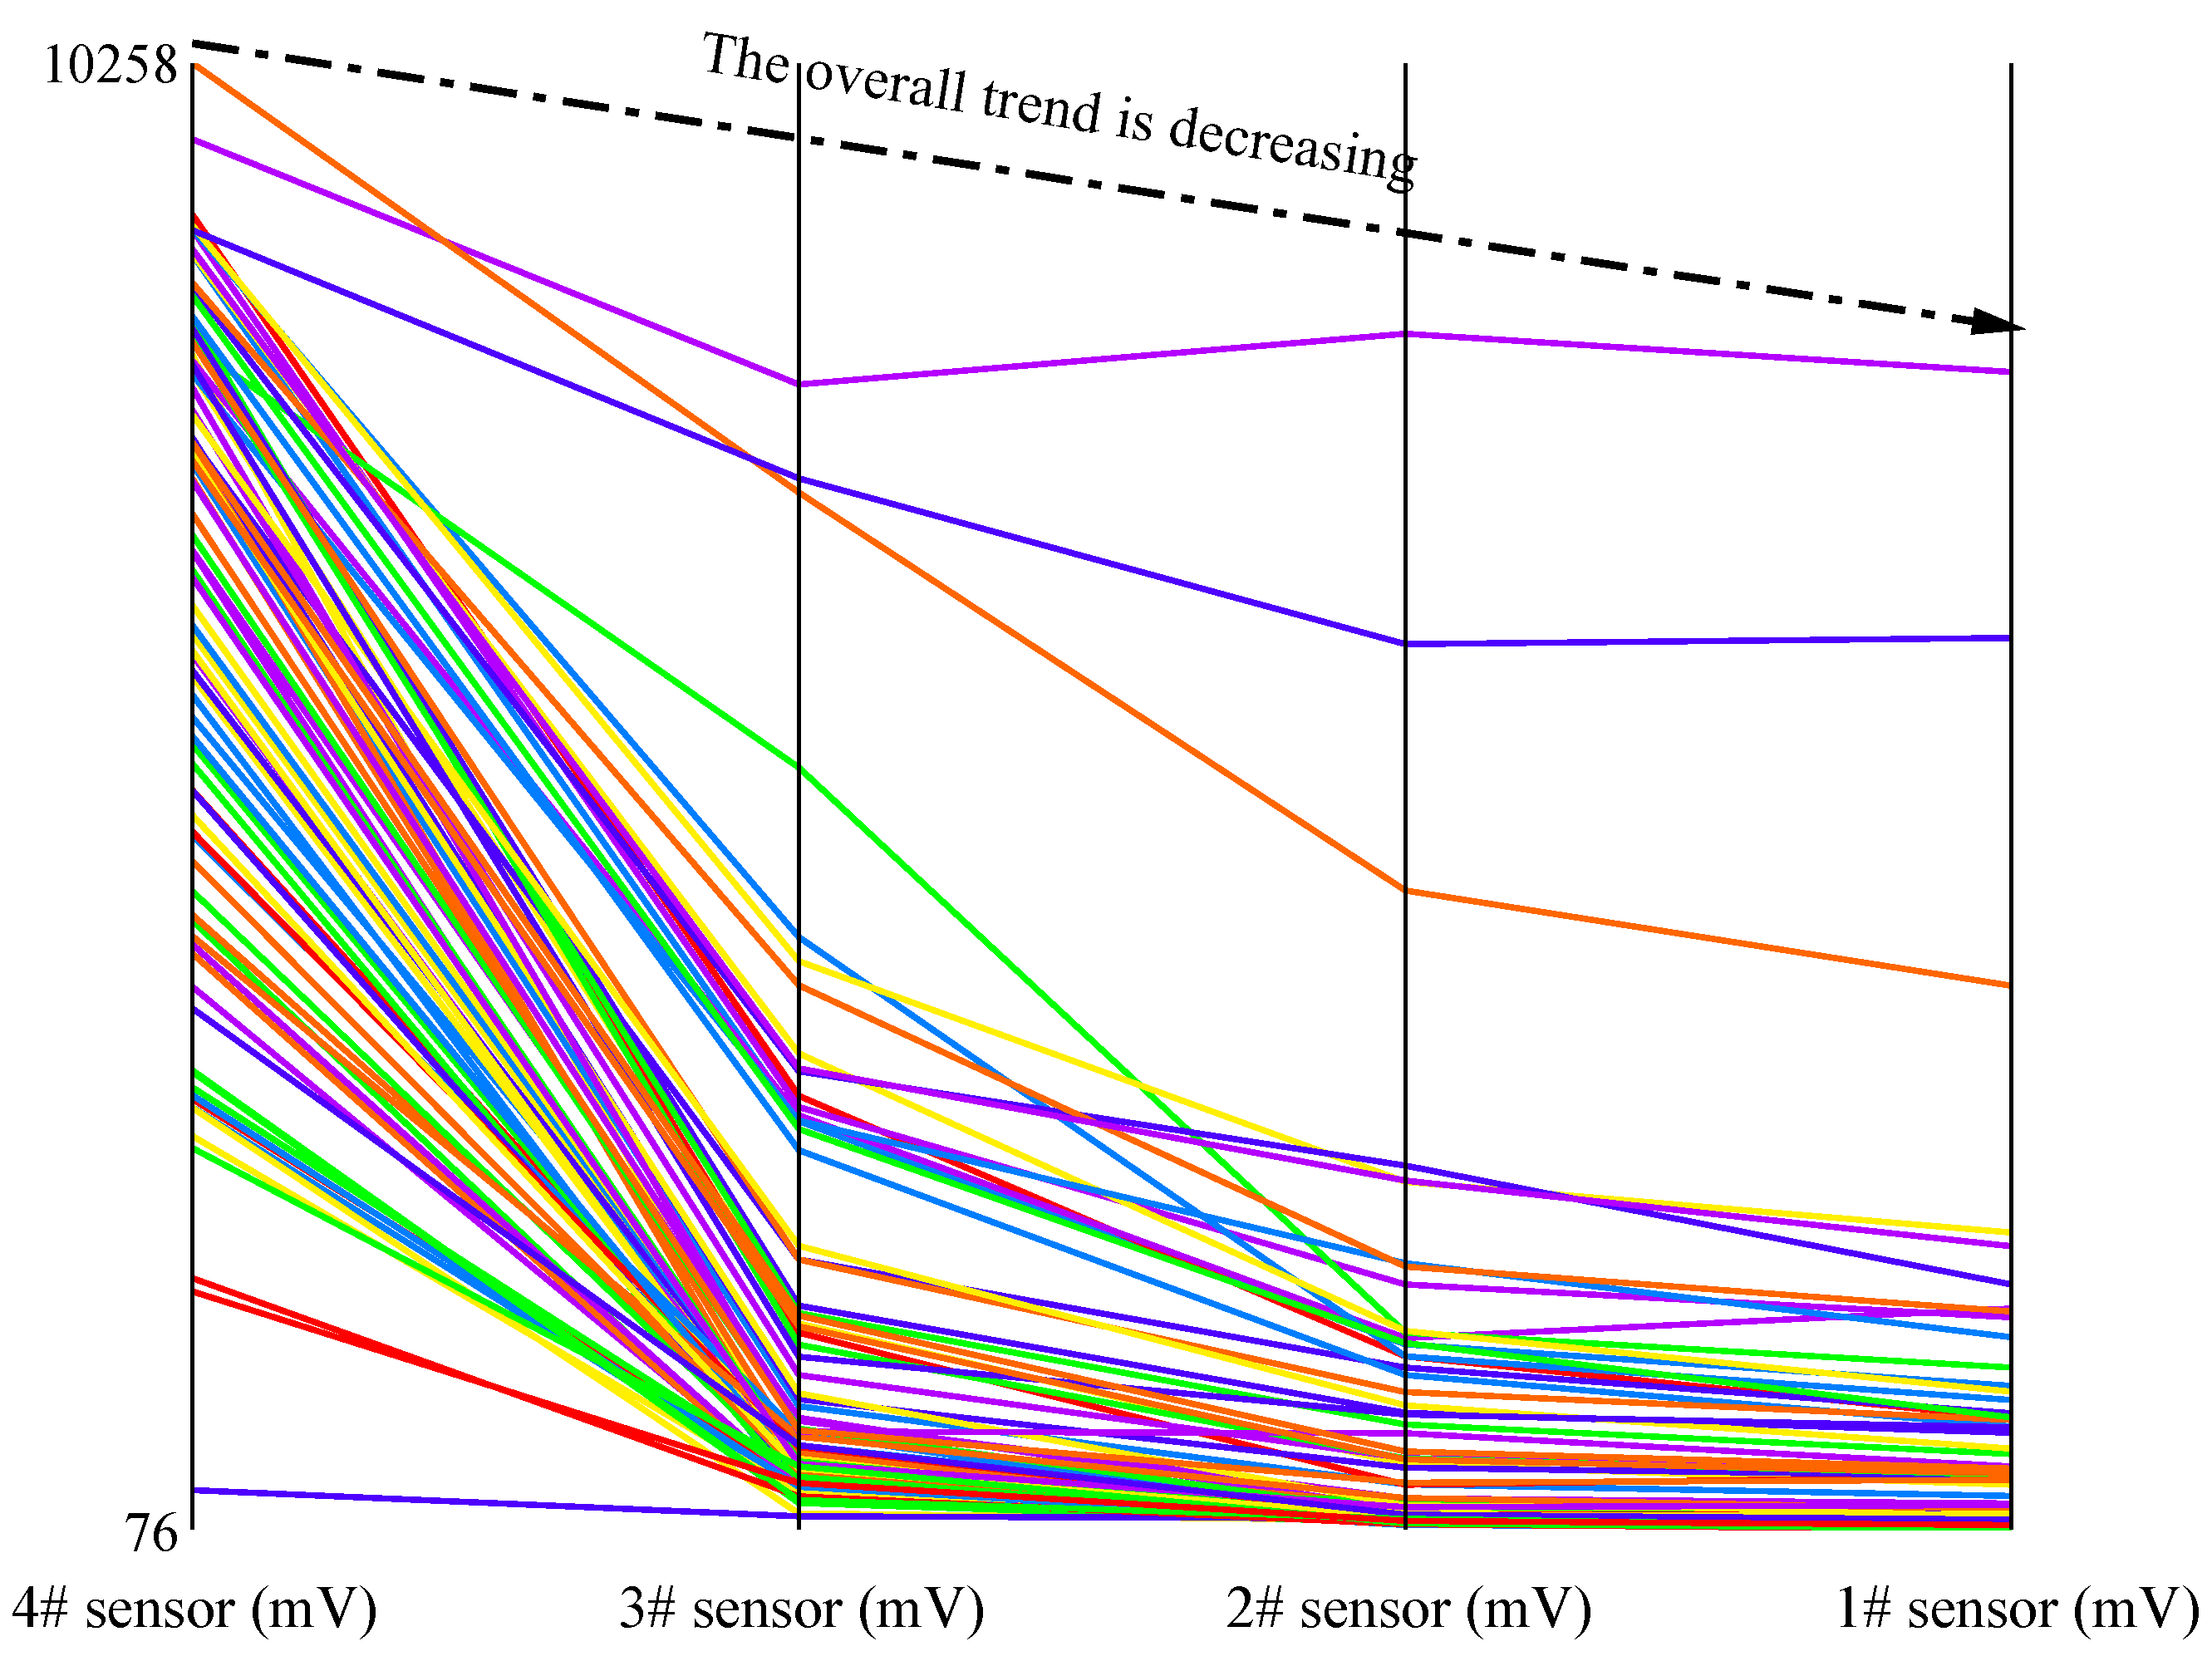
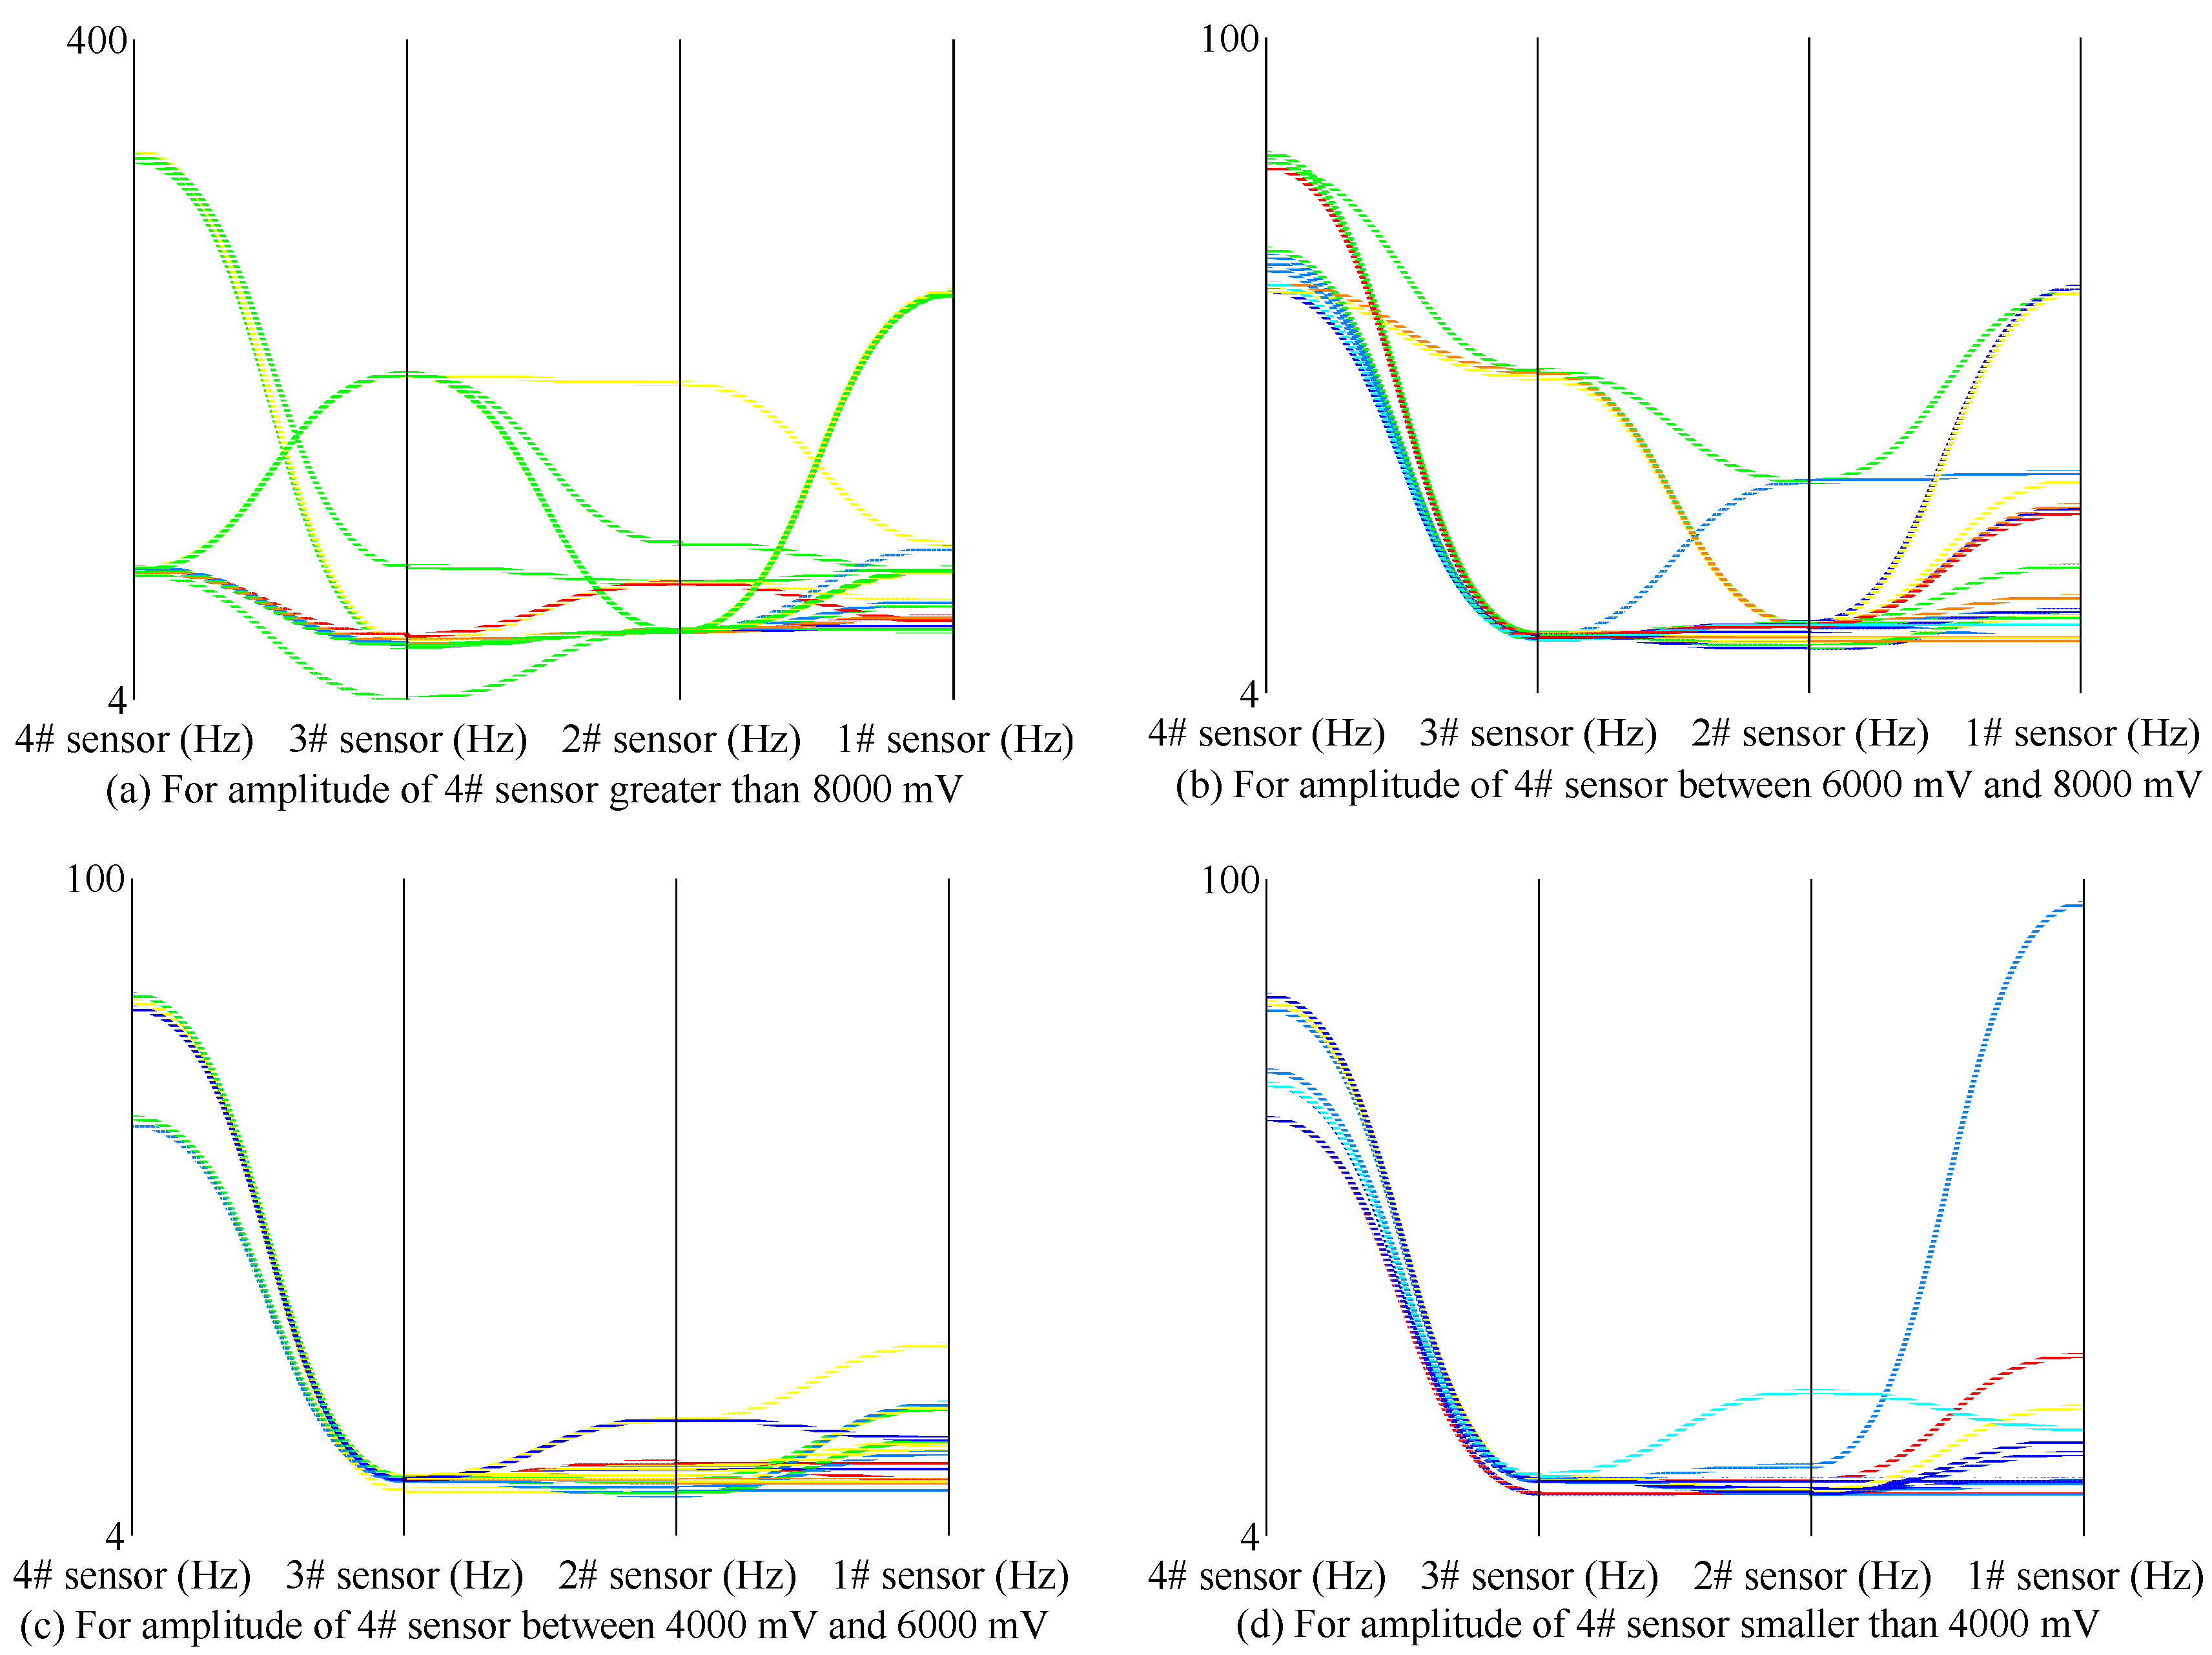
- Amplitude is a more suitable indicator for determining the locations of vibration events. The main frequency change laws of larger initial amplitude events are chaotic, but the main frequency change laws of smaller initial amplitude events are relatively consistent.
Author Contributions
Funding
Institutional Review Board Statement
Informed Consent Statement
Data Availability Statement
Conflicts of Interest
References
- Tang, S.B.; Wang, J.C.; Tang, L.X.; Ding, S. Automatic early warning of rockbursts from microseismic events by learning the feature-augmented point cloud representation. Tunn. Undergr. Space Technol. 2024, 147, 105692. [Google Scholar] [CrossRef]
- Cai, W.; Dou, L.; Zhang, M.; Cao, W.; Shi, J.-Q.; Feng, L. A fuzzy comprehensive evaluation methodology for rock burst forecasting using microseismic monitoring. Tunn. Undergr. Space Technol. 2018, 80, 232–245. [Google Scholar] [CrossRef]
- Zhang, W.; Huo, T.; Li, C.; Wang, C.; Qu, X.; Xin, C.; Berardengo, M. Characteristics of Valuable Microseismic Events in Heading Face of an Underground Coal Mine Using Microseismic System. Shock Vib. 2021, 2021, 6683238. [Google Scholar] [CrossRef]
- Lu, C.-P.; Liu, G.-J.; Liu, Y.; Zhang, N.; Xue, J.-H.; Zhang, L. Microseismic multi-parameter characteristics of rockburst hazard induced by hard roof fall and high stress concentration. Int. J. Rock Mech. Min. Sci. 2015, 76, 18–32. [Google Scholar] [CrossRef]
- Si, G.; Cai, W.; Wang, S.; Li, X. Prediction of Relatively High-Energy Seismic Events Using Spatial–Temporal Parametrisation of Mining-Induced Seismicity. Rock Mech. Rock Eng. 2020, 53, 5111–5132. [Google Scholar] [CrossRef]
- Ma, C.; Jiang, Y.; Li, T. Gravitational Search Algorithm for Microseismic Source Location in Tunneling: Performance Analysis and Engineering Case Study. Rock Mech. Rock Eng. 2019, 52, 3999–4016. [Google Scholar] [CrossRef]
- Li, X.; Li, Z.; Wang, E.; Feng, J.; Chen, L.; Li, N.; Kong, X. Extraction of microseismic waveforms characteristics prior to rock burst using Hilbert–Huang transform. Measurement 2016, 91, 101–113. [Google Scholar] [CrossRef]
- Li, X.; Li, Z.; Wang, E.; Feng, J.; Chen, L.; Li, N.; Zou, Q. Microseismic Signal Spectra, Energy Characteristics, and Fractal Features Prior to Rock Burst: A Case Study from the Qianqiu Coal Mine, China. J. Earthq. Eng. 2016, 21, 891–911. [Google Scholar] [CrossRef]
- Hammer, C.; Ohrnberger, M.; Fäh, D. Classifying seismic waveforms from scratch: A case study in the alpine environment. Geophys. J. Int. 2013, 192, 425–439. [Google Scholar] [CrossRef]
- Mark, C. Coal bursts that occur during development: A rock mechanics enigma. Int. J. Min. Sci. Technol. 2018, 28, 35–42. [Google Scholar] [CrossRef]
- Ji, J.; Li, Y.; Liu, C.; Wang, D.; Jing, H. Application of EMD Technology in Leakage Acoustic Characteristic Extraction of Gas-Liquid, Two-Phase Flow Pipelines. Shock Vib. 2018, 2018, 1529849. [Google Scholar] [CrossRef]
- Xue, Y.R.; Li, Z.L.; Song, D.Z.; He, X.Q.; Wang, H.L.; Zhou, C.; Chen, J.Q.; Sobolev, A. A method to predict rockburst using temporal trend test and its application. J. Rock Mech. Geotech. Eng. 2024, 16, 909–923. [Google Scholar] [CrossRef]
- Zhang, W.; Ma, N.; Ma, J.; Li, C.; Ren, J.; Jiang, B. Mechanism of Rock Burst Revealed by Numerical Simulation and Energy Calculation. Shock Vib. 2020, 2020, 8862849. [Google Scholar] [CrossRef]
- Li, N.; Huang, B.; Zhang, X.; Yuyang, T.; Li, B. Characteristics of microseismic waveforms induced by hydraulic fracturing in coal seam for coal rock dynamic disasters prevention. Saf. Sci. 2019, 115, 188–198. [Google Scholar] [CrossRef]
- Feng, H.; Yi, W. Propagation characteristics of acoustic emission wave in reinforced concrete. Results Phys. 2017, 7, 3815–3819. [Google Scholar] [CrossRef]
- Shiotani, T.; Ohtsu, M.; Ikeda, K. Detection and evaluation of AE waves due to rock deformation. Constr. Build. Mater. 2001, 15, 235–246. [Google Scholar] [CrossRef]
- Carpinteri, A.; Lacidogna, G.; Accornero, F.; Mpalaskas, A.C.; Matikas, T.E.; Aggelis, D.G. Influence of damage in the acoustic emission parameters. Cem. Concr. Compos. 2013, 44, 9–16. [Google Scholar] [CrossRef]
- Tary, J.B.; van der Baan, M.; Herrera, R.H. Attenuation estimation using high resolution time–frequency transforms. Digit. Signal Process. 2017, 60, 46–55. [Google Scholar] [CrossRef]
- Li, X.; Li, Z.; Wang, E.; Liang, Y.; Li, B.; Chen, P.; Liu, Y. Pattern Recognition of Mine Microseismic and Blasting Events Based on Wave Fractal Features. Fractals 2018, 26, 1850029. [Google Scholar] [CrossRef]
- Keneti, A.; Sainsbury, B.-A. Review of published rockburst events and their contributing factors. Eng. Geol. 2018, 246, 361–373. [Google Scholar] [CrossRef]
- Jiang, L.; Kong, P.; Zhang, P.; Shu, J.; Wang, Q.; Chen, L.; Wu, Q. Dynamic Analysis of the Rock Burst Potential of a Longwall Panel Intersecting with a Fault. Rock Mech. Rock Eng. 2019, 53, 1737–1754. [Google Scholar] [CrossRef]
- Li, X.; Li, X.-F.; Zhang, Q.-B.; Zhao, J. A numerical study of spalling and related rockburst under dynamic disturbance using a particle-based numerical manifold method (PNMM). Tunn. Undergr. Space Technol. 2018, 81, 438–449. [Google Scholar] [CrossRef]
- Jiang, L.; Wu, Q.; Wu, Q.; Wang, P.; Xue, Y.; Kong, P.; Gong, B. Fracture failure analysis of hard and thick key layer and its dynamic response characteristics. Eng. Fail. Anal. 2019, 98, 118–130. [Google Scholar] [CrossRef]
- Kong, P.; Jiang, L.; Shu, J.; Wang, L. Mining Stress Distribution and Fault-Slip Behavior: A Case Study of Fault-Influenced Longwall Coal Mining. Energies 2019, 12, 2494. [Google Scholar] [CrossRef]
- Zhang, W.; Qu, X.; Li, C.; Xu, X.; Zhang, S.; Jin, G.; Wang, Y. Fracture analysis of multi-hard roofs based on microseismic monitoring and control techniques for induced rock burst: A case study. Arab. J. Geosci. 2019, 12, 784. [Google Scholar] [CrossRef]
- Ghosh, G.K.; Sivakumar, C. Application of underground microseismic monitoring for ground failure and secure longwall coal mining operation: A case study in an Indian mine. J. Appl. Geophys. 2018, 150, 21–39. [Google Scholar] [CrossRef]
- Fan, L.; Liu, S. A conceptual model to characterize and model compaction behavior and permeability evolution of broken rock mass in coal mine gobs. Int. J. Coal Geol. 2017, 172, 60–70. [Google Scholar] [CrossRef]
- Fan, L.; Liu, S. Evaluation of permeability damage for stressed coal with cyclic loading: An experimental study. Int. J. Coal Geol. 2019, 216, 103338. [Google Scholar] [CrossRef]
- Xie, J.; Xu, J.; Wang, F. Mining-induced stress distribution of the working face in a kilometer-deep coal mine—A case study in Tangshan coal mine. J. Geophys. Eng. 2018, 15, 2060–2070. [Google Scholar] [CrossRef]
- Qiu, L.; Liu, Z.; Wang, E.; He, X.; Feng, J.; Li, B. Early-warning of rock burst in coal mine by low-frequency electromagnetic radiation. Eng. Geol. 2020, 279, 105755. [Google Scholar] [CrossRef]
- Cai, W.; Dou, L.; Cao, A.; Gong, S.; Li, Z. Application of seismic velocity tomography in underground coal mines: A case study of Yima mining area, Henan, China. J. Appl. Geophys. 2014, 109, 140–149. [Google Scholar] [CrossRef]
- Kong, B.; Wang, E.; Li, Z.; Wang, X.; Niu, Y.; Kong, X. Acoustic emission signals frequency-amplitude characteristics of sandstone after thermal treated under uniaxial compression. J. Appl. Geophys. 2017, 136, 190–197. [Google Scholar] [CrossRef]
- Mei, F.; Hu, C.; Li, P.; Zhang, J. Study on main Frequency precursor characteristics of Acoustic Emission from Deep buried Dali Rock explosion. Arab. J. Geosci. 2019, 12, 645. [Google Scholar] [CrossRef]
- Zhang, W.; Ma, N.; Ren, J.; Li, C. Peak particle velocity of vibration events in underground coal mine and their caused stress increment. Measurement 2021, 169, 108520. [Google Scholar] [CrossRef]
- Lu, C.-P.; Liu, Y.; Liu, G.-J.; Zhao, T.-B. Stress evolution caused by hard roof fracturing and associated multi-parameter precursors. Tunn. Undergr. Space Technol. 2019, 84, 295–305. [Google Scholar] [CrossRef]
- Cao, W.; Shi, J.-Q.; Si, G.; Durucan, S.; Korre, A. Numerical modelling of microseismicity associated with longwall coal mining. Int. J. Coal Geol. 2018, 193, 30–45. [Google Scholar] [CrossRef]
- Feng, J.; Wang, E.; Ding, H.; Huang, Q.; Chen, X. Deterministic seismic hazard assessment of coal fractures in underground coal mine: A case study. Soil Dyn. Earthq. Eng. 2020, 129, 105921. [Google Scholar] [CrossRef]
- Yin, S.; Li, Z.H.; Wang, E.Y.; Niu, Y.; Tian, H.; Li, X.L.; Li, H.Y.; Yang, C.J. The infrared thermal effect of coal failure with different impact types and its relationship with bursting liability. Infrared Phys. Technol. 2024, 138, 105263. [Google Scholar] [CrossRef]
- Dou, L.-m.; Mu, Z.-l.; Li, Z.-l.; Cao, A.-y.; Gong, S.-y. Research progress of monitoring, forecasting, and prevention of rockburst in underground coal mining in China. Int. J. Coal Sci. Technol. 2014, 1, 278–288. [Google Scholar] [CrossRef]
- Giraldo, S.A.C.; Melo, P.A.; Secchi, A.R. Enhanced control in time-delay processes: Diagnostic, monitoring, and self-tuning strategies for the filtered smith predictor in response to model-plant mismatch and abrupt load disturbances. Control. Eng. Pract. 2024, 145, 105869. [Google Scholar] [CrossRef]
- Wang, B.F.; Lv, Y.H.; Liu, C.B. Research on fire early warning index system of coal mine goaf based on multi-parameter fusion. Sci. Rep. 2024, 14, 485. [Google Scholar] [CrossRef]
- Zhang, Z.T.; Li, J.Q.; Li, Y.C. Real-time online resistance-alteration-based multiple-fault diagnosis framework and implementation for mine ventilation systems. Adv. Eng. Inform. 2024, 59, 102305. [Google Scholar] [CrossRef]
- Wang, L.X.; Xu, S.S.; Qiu, J.L.; Wang, K.; Ma, E.L.; Li, C.J.; Guo, C.X. Automatic monitoring system in underground engineering construction: Review and prospect. Adv. Civ. Eng. 2020, 2020, 3697253. [Google Scholar] [CrossRef]
- Wu, S.S.; Hao, W.Q.; Yao, Y.Y.; Li, D.Q. Investigation into durability degradation and fracture of cable bolts through laboratorial tests and hydrogeochemical modelling in underground conditions. Tunn. Undergr. Space Technol. 2023, 138, 105198. [Google Scholar] [CrossRef]
- Wu, S.S.; Zhang, Z.R.; Chen, J.H.; Yao, Y.Y.; Li, D.Q. Characterisation of stress corrosion durability and time-dependent performance of cable bolts in underground mine environments. Eng. Fail. Anal. 2023, 150, 107292. [Google Scholar] [CrossRef]
- Shannon, C.E. Communication in the Presence of Noise. Proc. IRE 1949, 37, 10–21. [Google Scholar] [CrossRef]
- Hsu, L.; Cunha, J.P.V.; Costa, R.R.; Lizarralde, F.; Nunes, E.V.L.; Oliveira, T.R.; Peixoto, A.J. Nyquist criterion for chattering avoidance and global stability in observer-based sliding-mode control with parasitics. J. Frankl. Inst. 2024, 361, 106658. [Google Scholar] [CrossRef]
- Niu, Y.Q.; Yang, T.; Yang, F.X.; Feng, X.W.; Zhang, P.; Li, W. Harmonic analysis in distributed power system based on IoT and dynamic compressed sensing. Energy Rep. 2022, 8, 2363–2375. [Google Scholar] [CrossRef]
- Srivastava, A.K.; Bakopoulos, P.; Dris, S.; Argyris, N.; Spatharakis, C.; Avramopoulos, H. 112 Gb/s sub-cycle 16-QAM Nyquist-SCM for intra-datacenter connectivity. In Next-Generation Optical Networks for Data Centers and Short-Reach Links III; SPIE: Bellingham, WA, USA, 2016. [Google Scholar]
- Wang, X.R.; Liu, X.F.; Wang, E.Y.; Liu, S.X.; Shan, T.C.; Labuz, J.F. Microcracking Characterization in Tensile Failure of Hard Coal: An Experimental and Numerical Approach. In Rock Mechanics and Rock Engineering; Springer: Cham, Switzerland, 2024; pp. 1–20. [Google Scholar] [CrossRef]


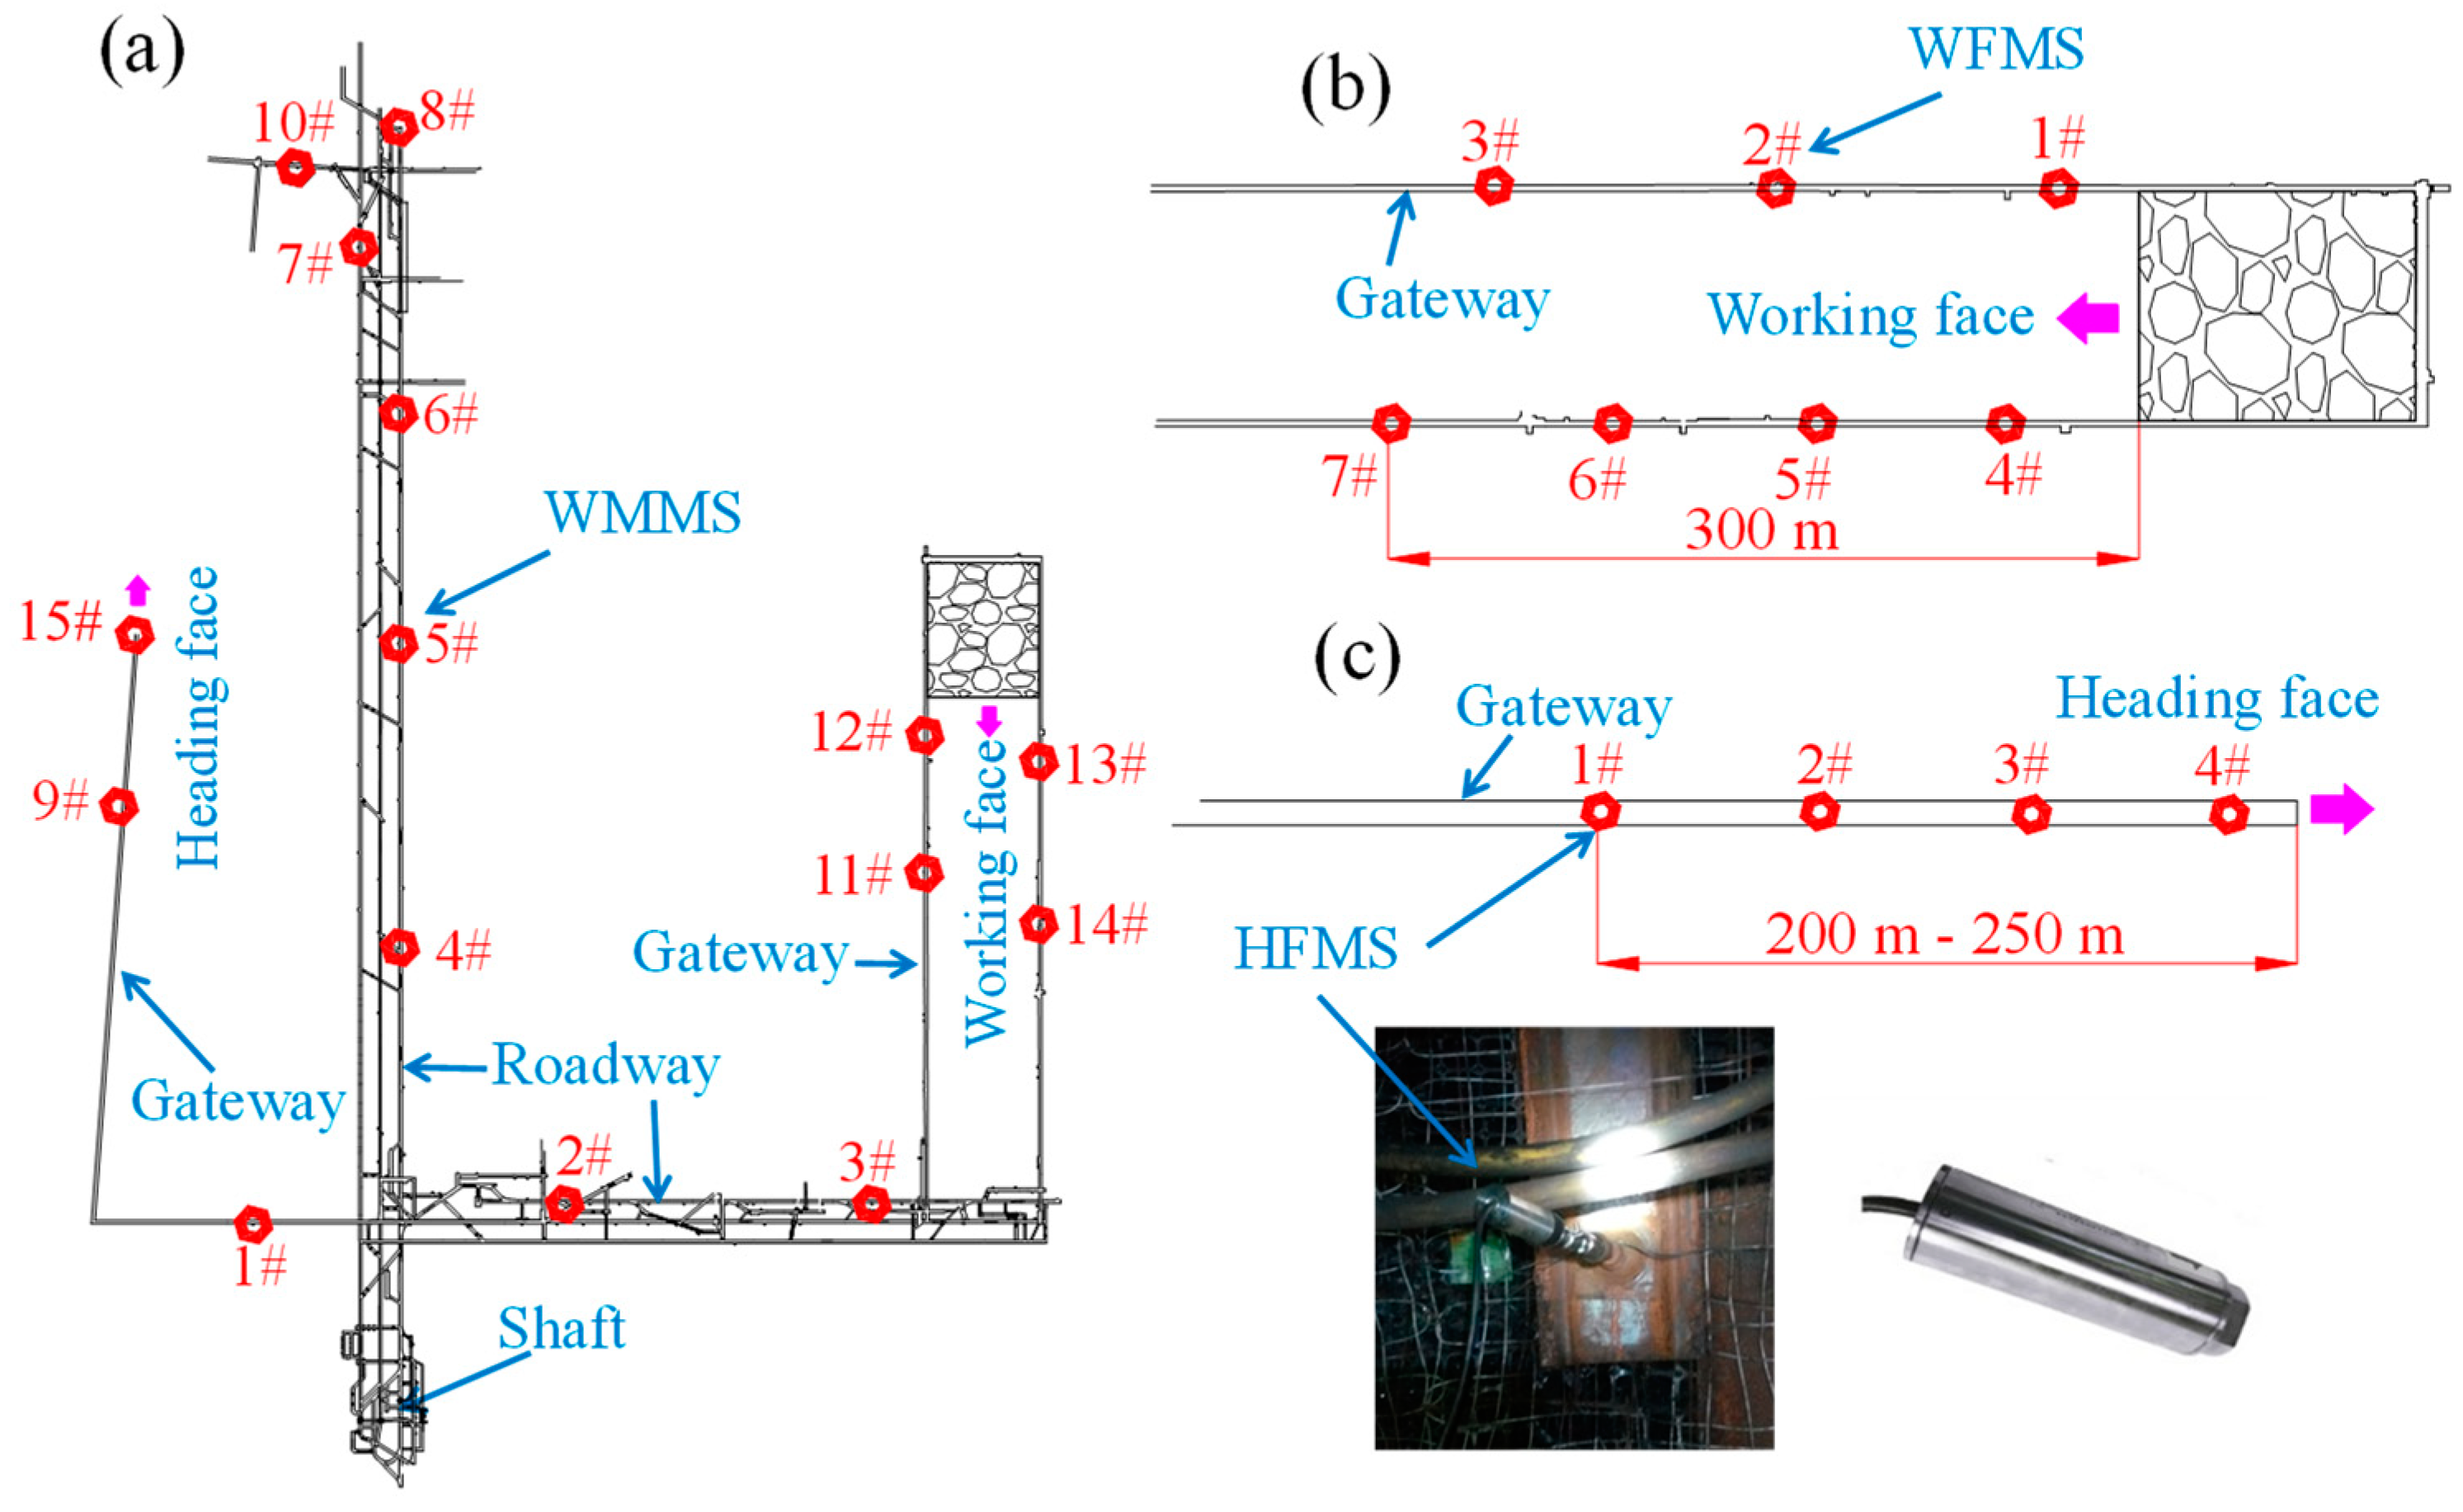
| Systems | Number of Measuring Points | Spacing of Measuring Points (m) | Sampling Frequency (Hz) | Sensor Receiving Frequency (Hz) |
|---|---|---|---|---|
| WMMS | 15 | 100–500 | 500 | 1–600 |
| WFMY | 7 | 50–100 | 1000 | 10–800 |
| HFMY | 4 | 50–60 | 2000 | 10–800 |
Disclaimer/Publisher’s Note: The statements, opinions and data contained in all publications are solely those of the individual author(s) and contributor(s) and not of MDPI and/or the editor(s). MDPI and/or the editor(s) disclaim responsibility for any injury to people or property resulting from any ideas, methods, instructions or products referred to in the content. |
© 2024 by the authors. Licensee MDPI, Basel, Switzerland. This article is an open access article distributed under the terms and conditions of the Creative Commons Attribution (CC BY) license (https://creativecommons.org/licenses/by/4.0/).
Share and Cite
Ren, J.; Zhang, X.; Gu, Q.; Zhang, W.; Wang, W.; Fan, L. The Frequency Characteristics of Vibration Events in an Underground Coal Mine and Their Implications on Rock Burst Monitoring and Prevention. Sustainability 2024, 16, 5485. https://doi.org/10.3390/su16135485
Ren J, Zhang X, Gu Q, Zhang W, Wang W, Fan L. The Frequency Characteristics of Vibration Events in an Underground Coal Mine and Their Implications on Rock Burst Monitoring and Prevention. Sustainability. 2024; 16(13):5485. https://doi.org/10.3390/su16135485
Chicago/Turabian StyleRen, Jianju, Xin Zhang, Qinghua Gu, Wenlong Zhang, Weiqin Wang, and Long Fan. 2024. "The Frequency Characteristics of Vibration Events in an Underground Coal Mine and Their Implications on Rock Burst Monitoring and Prevention" Sustainability 16, no. 13: 5485. https://doi.org/10.3390/su16135485