Abstract
The various hydrological processes that cause waterlogging exhibit regional differences. Studies on the causes of waterlogging in Chinese southern hilly cities from the perspective of urban regional hydrological processes are needed. This article examines Changsha Central City to study the hydrological processes of Chinese southern hilly cities based on waterlogging point data from 2015 to 2017, analyzing the relationships between the degree of waterlogging and changes in the material elements of runoff sources, runoff convergence terminals, and runoff convergence processes using correlation analysis, principal component analysis and comparative analysis. These results show that the urban waterlogging in Chinese southern hilly cities is caused by the hardening of convergence spaces, concentrated water distribution, a decrease in the connectivity of rainwater corridors, complex topographic slopes, and a lag in the construction of drainage facilities. The expansion of impervious surfaces, particularly in areas intended for convergence terminals, has significantly reduced the number of these critical structures. Additionally, disordered changes in topographic slopes, the division caused by roads, and the hardening of underlying surfaces in rainwater corridors have collectively diminished the structural and ecological connectivity of the rainwater corridor system. This obstruction of surface runoff into concentrated water bodies has rendered the runoff regulation function of these water bodies ineffective, making their size a leading cause of urban waterlogging. To mitigate the risk of waterlogging, Chinese southern hilly cities should prevent urban development from encroaching on natural runoff areas. They should also implement dispersed water body layouts, enhance both the structural and ecological connectivity of rainwater corridors and their underlying surfaces, and improve the design standards of drainage facilities.
1. Introduction
The rapid development of urbanization and the increasing frequency and intensity of extreme rainfall events have made urban rainstorm waterlogging an important environmental issue affecting human survival and development in the 21st century [1]. Studies on the causes of waterlogging are essential for prevention and control. Currently, academic research on the causes of waterlogging focuses on the effects of climate change, urbanization on land use and land cover, water system structure, topography, and the construction of basic drainage facilities. It is believed that the increasing frequency and intensity of extreme rainfall events lead to an increase in urban drainage volume [2,3]. Changes in impervious surfaces, water system structure, and topography alter urban hydrological response processes, increasing urban flood sensitivity. Among these factors, the increase in impervious surfaces as a source of urban runoff impedes the surface water acceptance process, leading to increased surface runoff [4,5]. Changes in water system structure and topography reduce the storage capacity of natural water bodies and floodplains, affecting drainage efficiency [6,7,8]. Additionally, drainage facilities with generally low design standards fail to meet the actual needs of rainwater runoff discharge, resulting in shorter runoff convergence times and earlier peak times [9,10]. Under the combined influence of these factors, urban natural hydrological processes change, and the risk of waterlogging increases.
Differences in urban construction characteristics, topography, and water system structure between regions result in regional differences in the causes of waterlogging [11]. In recent years, some scholars have analyzed the causes of waterlogging in Chinese southern hilly cities from the perspectives of changes in hydrological conditions [12,13], changes in rainwater storage space [14,15], and the matching relationship between runoff-producing and runoff-converging areas of watershed units [16]. Additionally, some scholars have discussed the unique hydrological processes in these areas, suggesting that rainwater corridors formed under the influence of terrain and climate are basic hydrological structural features of Chinese southern hilly regions, facilitating horizontal transmission of runoff [17,18], while road networks have a negative impact on this structure [19,20]. Some scholars have researched the factors influencing flooding in slope areas. For instance, Ángeles G. Mayor and colleagues examined how the source–sink landscape paradigm affects runoff volume in mountainous regions, discovering that the connectivity of runoff sources positively influences the runoff volume in catchment areas [21]. Similarly, research by Ninon Le Floch and colleagues on slope cities in Norway found that the runoff volume in downstream catchment areas is crucial for determining the peak flow of the entire region [22]. However, research on the causes of waterlogging from the perspective of hydrological processes in Chinese southern hilly regions is still limited. Therefore, this study examines watershed units in central Changsha that have experienced urban waterlogging. The analysis uses historical waterlogging records as foundational data and selects research indicators based on the impact of urbanization on hydrological processes, drawing from detailed investigations in hilly cities in southern China. Employing quantitative and qualitative methods—including correlation analysis, principal component analysis, and comparative analysis—the study identifies the causes of urban waterlogging in these regions. Based on these findings, the study proposes strategies for preventing and controlling urban waterlogging. Despite potential uncertainties introduced by limitations in the data, research area, and indicators, the findings offer valuable theoretical and practical insights for urban waterlogging prevention and management.
2. Materials and Methods
2.1. Study Area
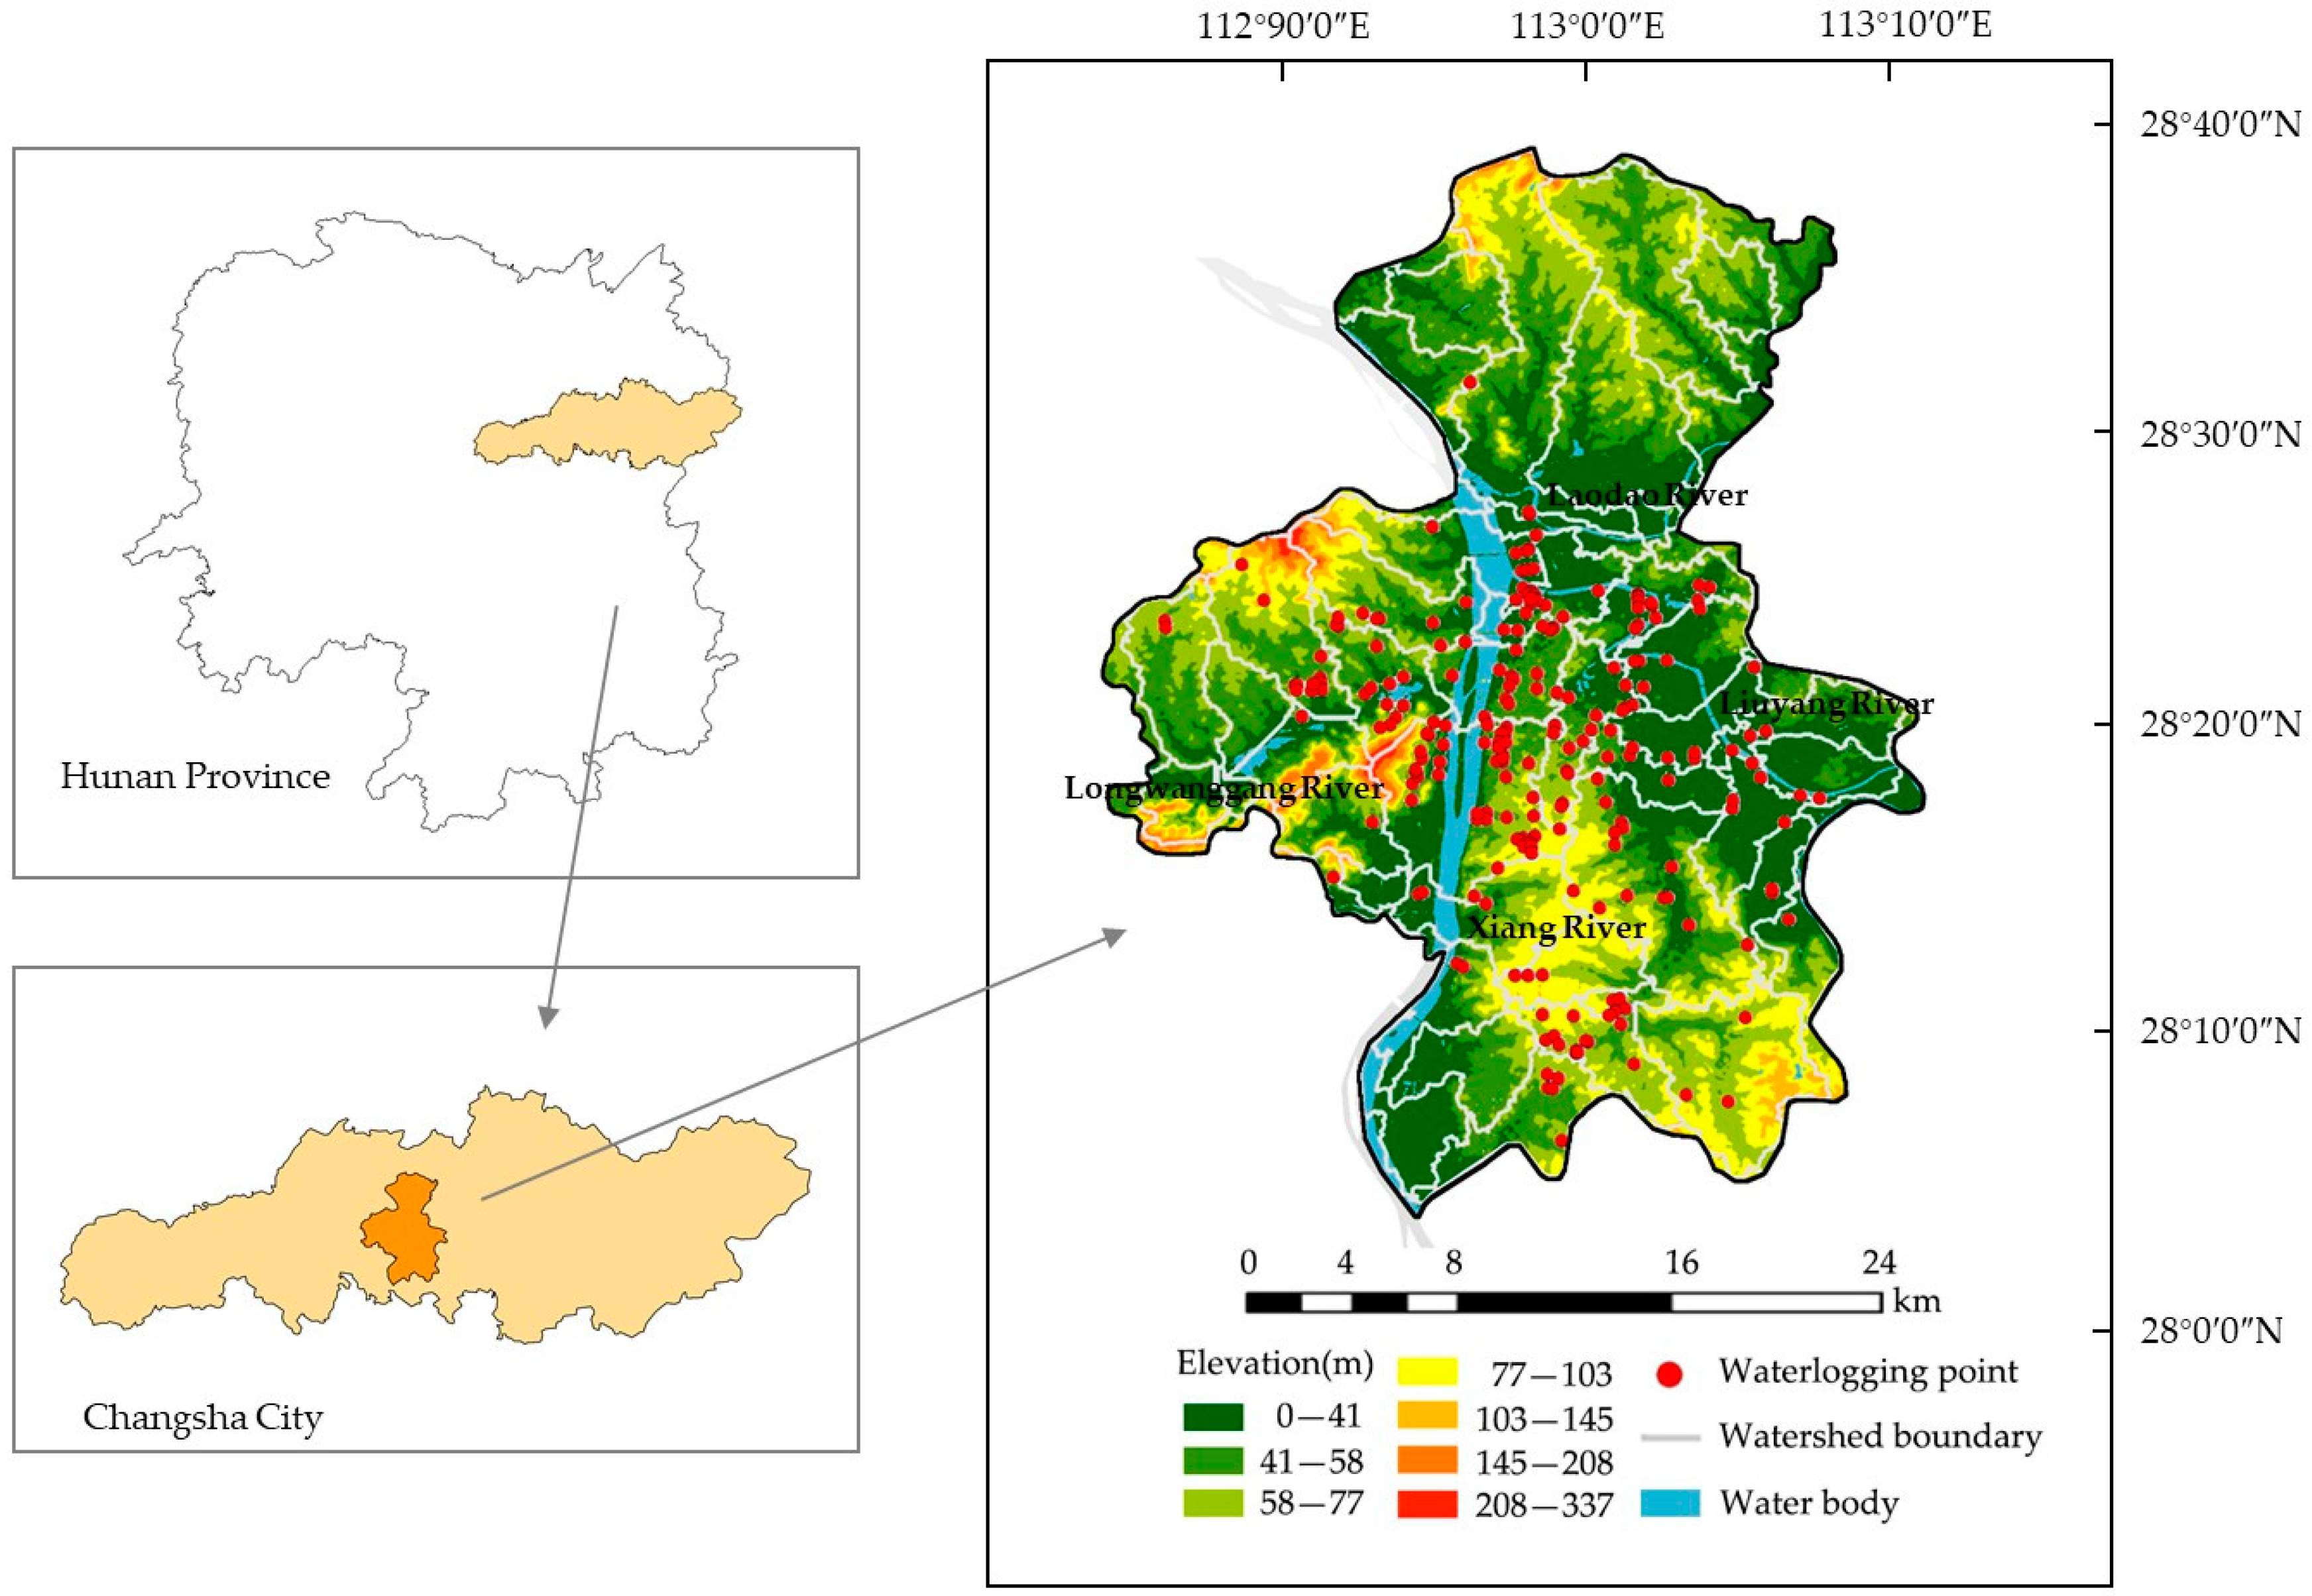
This study focuses on the central urban area of Changsha city, China. It is situated in the hilly region of Hunan Province, slightly north of the downstream region of the Xiang River. It features a typical low mountainous terrain and a subtropical continental monsoon humid climate with abundant precipitation. The annual average precipitation is 1360 mm, 70–80% of which falls between March and June. The city has a well-developed water system, including the Xiang River and its 15 tributaries, with an annual average runoff of 80.8 billion cubic meters. The soil mainly consists of red and yellow soil with low water infiltration rates. Therefore, the region is sensitive to water disasters and prone to waterlogging. The study area is located in the central part of Changsha city, covering an area of approximately 570 km2, about 4.8% of the total urban area, with three tributaries—the Liuyang River, Laodao River, and Longwanggang River—flowing into the Xiang River (Figure 1). The study area is surrounded by a small number of urban areas and a large number of peri-urban areas.

Figure 1.
Location and watershed units map of Changsha Central City.
2.2. Hydrological Processes of the Study Area
In Chinese southern hilly cities, water systems coexist with mountains, forming rainwater corridors that align closely with the topography, presenting a distinct hierarchical branched structure. These corridors include perennially flowing main rivers, seasonally and climatically flowing branched tributaries, and potential capillary corridors that only form clear pathways during heavy rainfall. After rainfall, some water infiltrates through permeable surfaces, while some water flows from the surface into capillary corridors and then into branched tributaries, ultimately joining the main rivers for drainage, thus forming the natural surface runoff hydrological process in Chinese southern hilly cities. Urban development, including the burial and hardening of rainwater corridors, has led to the disappearance of some rainwater corridors, transforming many structured branches and main channels into potential rainwater corridors that only appear during heavy rainfall, altering the original natural hydrological processes of the city. The modified hydrological processes include surface runoff generation (runoff source), runoff transmission (runoff convergence process), runoff infiltration into the ground, and inflow into water bodies (runoff convergence terminal). The runoff source is mainly composed of hard surfaces, while the runoff convergence terminal includes water bodies and green spaces, and the runoff convergence process includes urban rainwater corridors (hereinafter referred to as rainwater corridors) and basic drainage pipes.
2.3. Spatial Distribution Characteristics of Waterlogging in the Study Area
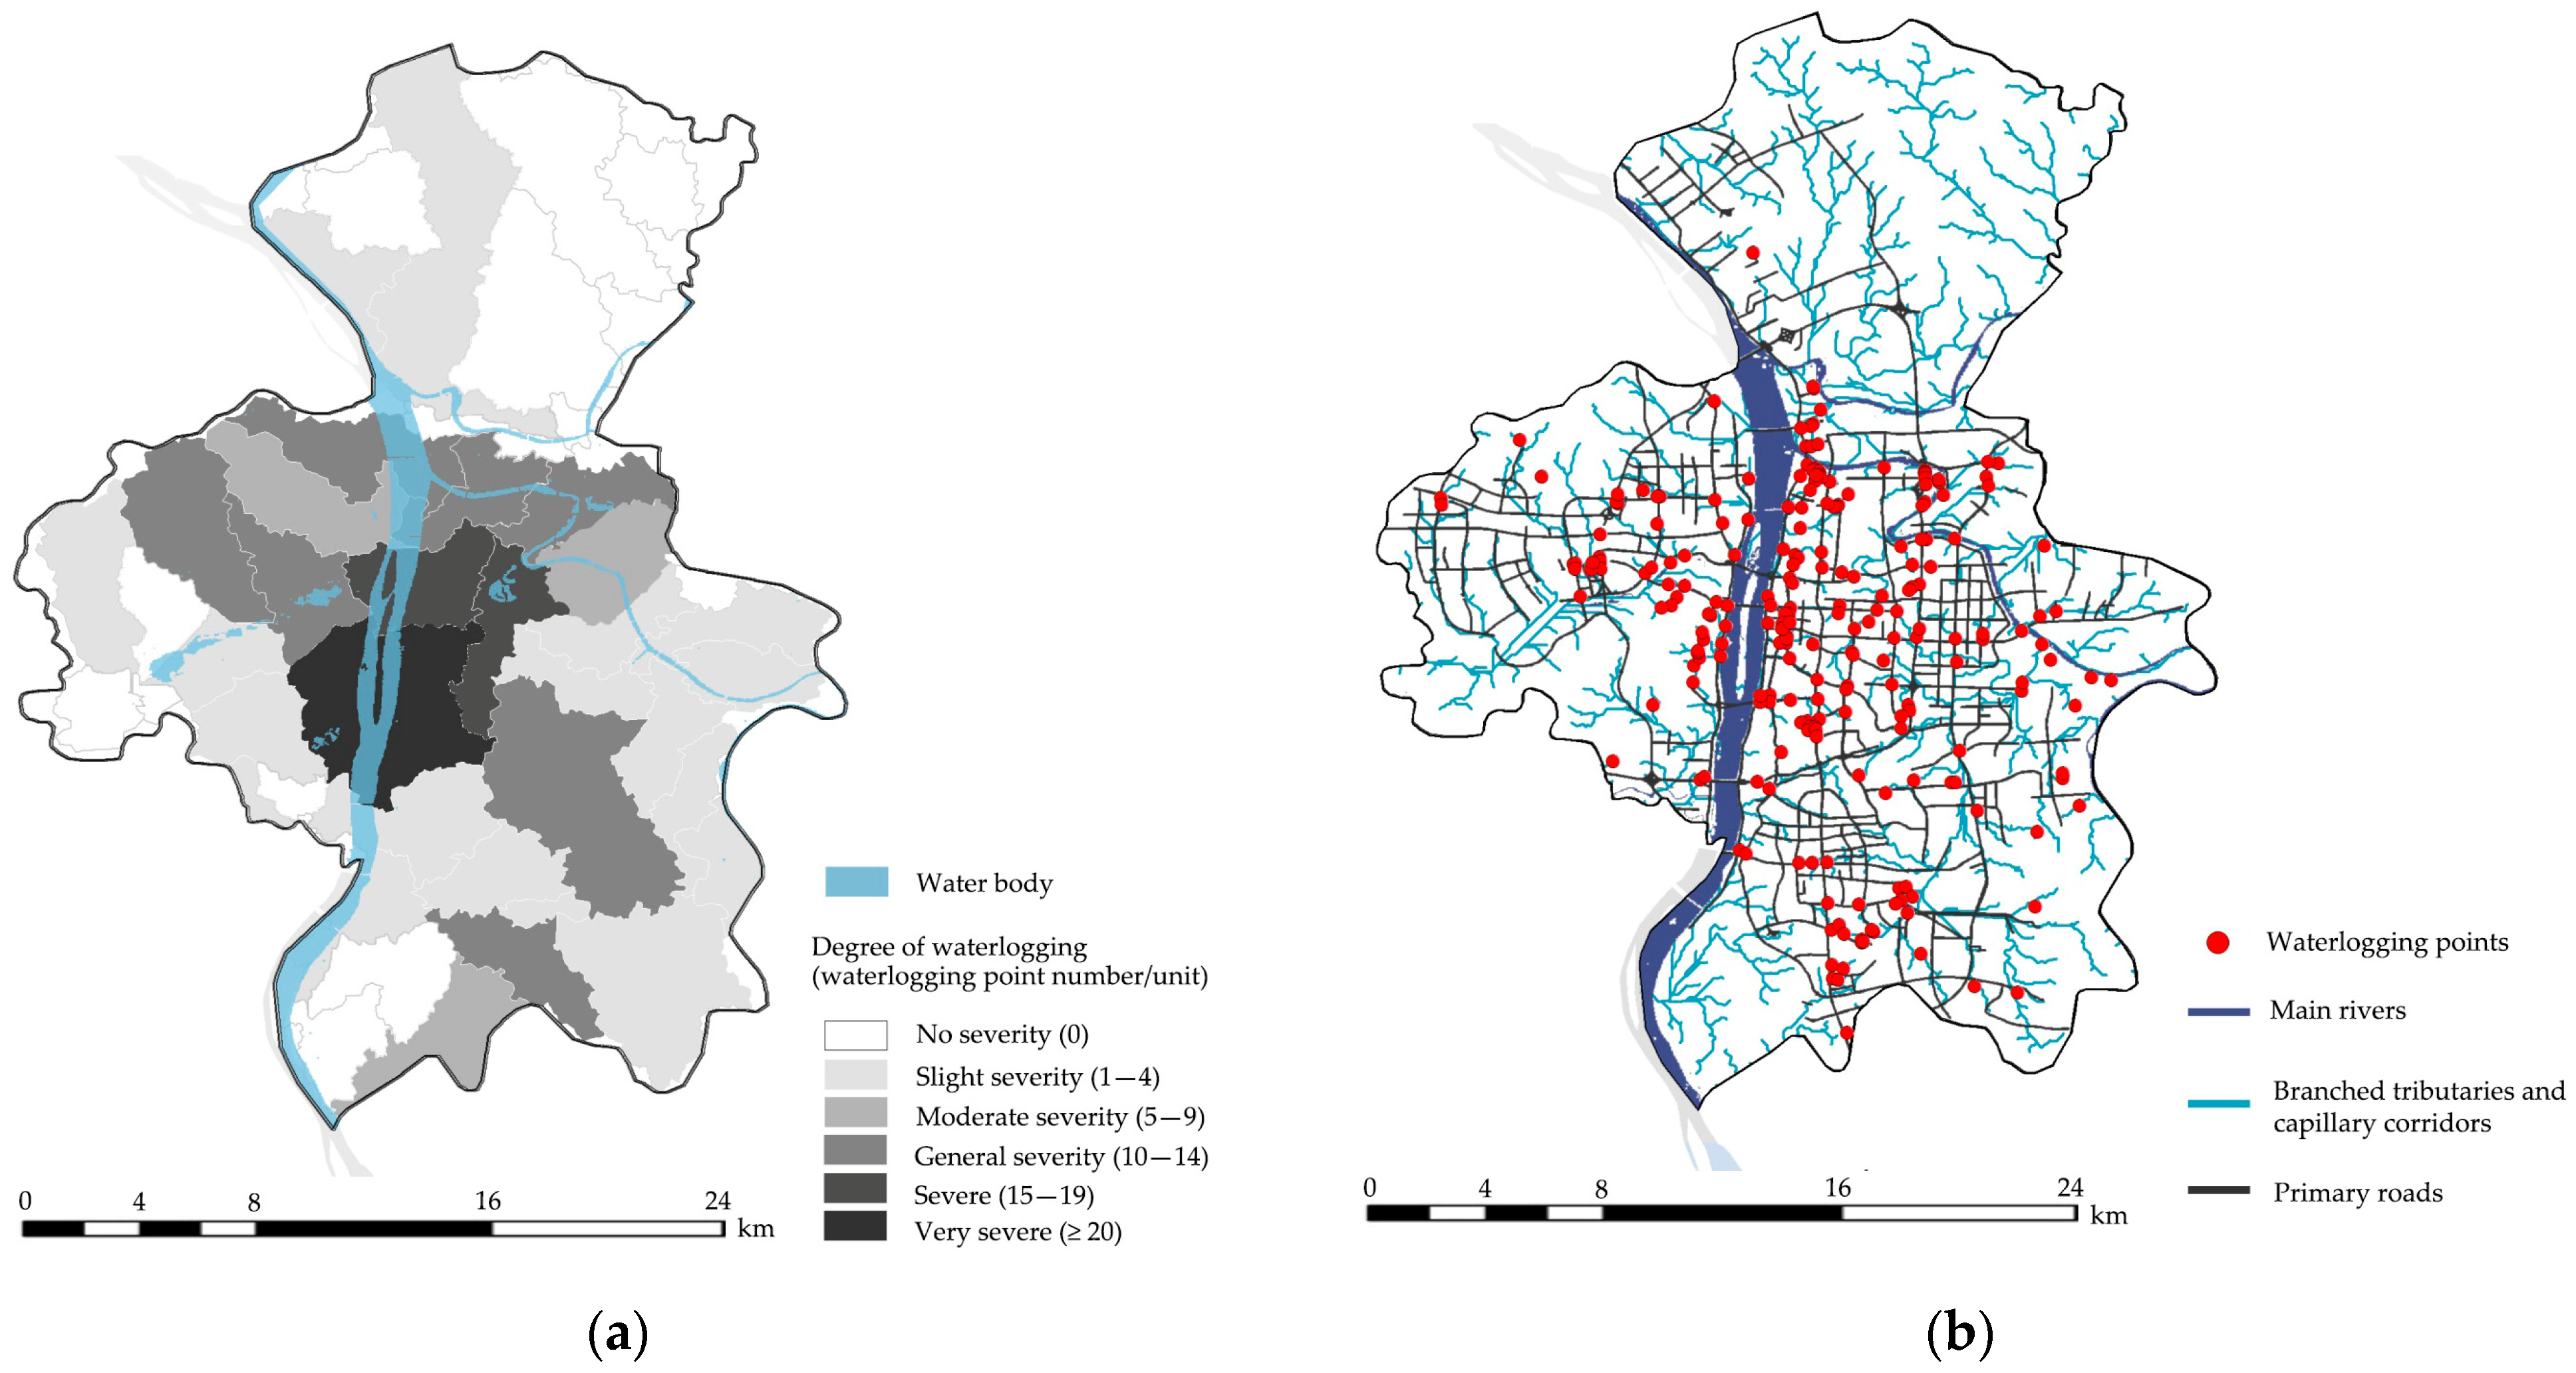
The DEM was used as the basic data, and the hydrological features of the study area were extracted using the “eight-direction method” to obtain watershed units of the central urban area of Changsha city (Figure 1), which was used as the research unit. This study characterizes waterlogging frequency through the number of waterlogging points, with the number of points in each watershed unit representing the frequency of waterlogging events over three years. This frequency defines the degree of waterlogging in each watershed unit. The relationship between the number of waterlogging points and the degree of waterlogging is as follows: 1–4 points per watershed unit indicate slight severity, 5–9 points indicate moderate severity, 10–14 points indicate general severity, 15–19 points indicate severe, and more than 20 points indicate very severe. From the distribution of watershed units and waterlogging points within the study area, it was found that watershed units with a general to severe level of waterlogging (more than 10 waterlogging points) were concentrated along the riverbanks (Figure 2a), while waterlogging points were distributed along urban rainwater corridors, with the highest concentration around conflict points between rainwater corridors and roads (Figure 2b).

Figure 2.
Spatial distribution of waterlogging points in the study area: (a) the degree of waterlogging in watershed units; (b) distribution of waterlogging points, rainwater corridors, and conflict points between rainwater corridors and roads.
2.4. Data and Methodology
2.4.1. Data Source
The data on waterlogging points used in this study were obtained from the waterlogging records in Changsha Central City during heavy rainfall from 2015 to 2017, totaling 227 points. These points were vectorized using ArcGIS 10.2 [23] based on the waterlogging events records provided by Changsha Water Resources Bureau. They were then overlaid with watershed units, identifying 31 watershed units containing waterlogging points for analysis. The number of waterlogging points was used to represent the severity within each watershed unit.
The land use and land cover data of Changsha Central City in 2017 and 1990 were obtained by interpreting the Landsat-8 OLI imageries (path/row: 123-40,123-41) and Landsat4-5TM imageries (path/row: 124-40,124-41), using the Maximum Similarity Classification Method in ENVI5.3 and calculated in ArcGIS10.2. In addition, the 2017 impervious surface data of Changsha Central City was extracted using the normalized difference built-up index (NDBI) in ENVI5.3. The calculation method for NDBI is detailed in Equation (1) [24].
The DEM data for 2017 (30 m resolution) and 1990 (30 m resolution) were downloaded from the Gscloud website (https://www.gscloud.cn/ accessed on 7 August 2024). The rainwater corridor data were derived from these DEM datasets through hydrological analysis, specifically flow direction analysis, performed in ArcGIS10.2. Drainage network and road data were obtained from the Changsha City Drainage Plan provided by the Changsha City Government. All the required data for the study are presented in Table 1.
where SWIR denotes the reflectance value of the shortwave infrared band and NIR denotes the reflectance value of the near-infrared band.
NDBI = (SWIR − NIR)/(SWIR + NIR)

Table 1.
List of data sources.
2.4.2. Indicators to Identify Urbanization and Hydrological Processes Characteristics
Previous studies have shown that the impact of urbanization on waterlogging includes four aspects: land use and land cover, water system structure, surface topography, and drainage facilities. Based on this, combined with the characteristics of hydrological processes in hilly cities and the distribution of waterlogging points, this study, following the indicators proposed by previous studies on river networks [25,26,27,28,29,30,31], added factors reflecting the structural characteristics of rainwater corridors in hilly urban areas. Then, quantitative indicators of material elements relevant to hilly city hydrological processes were selected from the four previously mentioned aspects (Table 2).
Table 2.
List of indicators.
In this study, land use and land cover area and ratio indicators were used to characterize the extent and concentration of land and its cover in a watershed unit. Ratio indicators are calculated with the formula:
where x denotes the specific land use or land cover category, Ax is the area of that respective category in the watershed unit, and A is the corresponding area of the watershed unit.
Rx = Ax/A
Eight indicators were investigated to characterize the quantity, structure, and connectivity of rainwater corridor system in Chinese southern hilly cities concerning previous studies: for its quantity characteristics, the number of rainwater corridors (Nc), frequency of rainwater corridors (Rf), total length of rainwater corridors (Lc), density of rainwater corridors (Rd), for its structural characteristics, the rainwater corridor complexity (CR), and for its connectivity characteristics, the number of conflict points between rainwater corridors and roads (M), the density of conflict points between rainwater corridors and roads (Rm), the connectivity of rainwater corridors (β).
The frequency of rainwater corridors (Rf) describes the degree of quantity of the rainwater corridor system in a watershed unit. A higher value of Rf indicates more rainwater corridors in the region. It is calculated with the formula [25]:
where N is the total number of rainwater corridors within the watershed unit; A is the corresponding area of the watershed unit.
Rf = N/A
The density of rainwater corridors (Rd) reflects the sparseness of the rainwater corridor system in a watershed unit. It is calculated with the formula [26]:
where L is the total length of rainwater corridors within the watershed unit; A is the corresponding area of the watershed unit.
Rd = L/A
The rainwater corridor complexity (CR) reflects the development of rainwater corridor branching degree and branch lengths in a watershed unit. The larger the value of CR, the higher the corridor order and the longer branches within the watershed unit. It is calculated with the formula [27]:
where No is the rainwater corridor order number in the watershed unit, and L and Lm are the total corridor length and the main corridor length in the watershed unit.
CR = No × (L/Lm)
The density of conflict points between rainwater corridors and roads (Rm) reflects the intensity of road interference with rainwater corridors in a watershed unit. It is calculated with the formula:
where M is the number of conflict points between rainwater corridors and roads in the watershed unit; A is the corresponding area of the watershed unit.
Rm = M/A
The connectivity of rainwater corridors (β) is constructed drawing on the methods of analyzing the connectivity of the river corridors in landscape ecology. The points where rainwater corridors intersect, and points, where rainwater corridors intersect with roads within the rainwater corridor system, are defined as nodes. The edges connecting two such nodes are defined as corridor links. The connectivity index β represents the average number of links per node in the network in a watershed unit [28]. It is calculated with the formula:
where le is the total number of links of rainwater corridors in the watershed unit; P is the total number of rainwater corridor nodes in the watershed unit; M is the total number of conflict points between rainwater corridors and roads.
β = le/(P + M)
In addition to land use, land cover, and water system structure, urban surface topography, and drainage facilities also have a significant impact on waterlogging. Six indicators were investigated to describe surface topography and drainage facilities in this study quantitatively: for the surface topography, the average of elevation (EA) and slope (SA) are used to describe the overall elevation and slope in a watershed unit, the standard deviation of elevation (Ste) and slope (Sts) are used to describe the degree of change in elevation and slope in a watershed unit; for the drainage facilities, the length (Ld) and density (Dd) of drainage networks were used to reflect the subsurface drainage capacity in a watershed unit. These indicators are calculated from the DEM data and drainage network data through ArcGIS10.2.
2.4.3. Methods
This study employs Pearson correlation analysis, principal component analysis, and comparative analysis to investigate the causes of waterlogging in Chinese southern hilly cities. Correlation analysis and principal component analysis were computed using SPSS 20 [32]. Firstly, Pearson correlation analysis is conducted on the aforementioned factors to identify those significantly correlated with the degree of waterlogging within watershed units. Secondly, principal component analysis is applied to these significant factors to elucidate their individual impacts on waterlogging causes. Finally, by comparing material factors changes in natural hydrological processes in the study area between 1990 and 2017, an in-depth analysis of the causes of waterlogging in Chinese southern hilly cities is performed.
3. Results
3.1. Correlation Analysis Results
Correlation analysis between the 24 factors and the degree of waterlogging in the watershed units revealed that factors related to convergence spaces (runoff convergence terminals and runoff convergence processes) were correlated with the degree of waterlogging in the watershed units at various confidence levels, with as many as nine factors, including four factors related to the branched rainwater corridor system in hilly cities.
The following are factors related to runoff sources (two factors) and surface topography (one factor). These indicate a close relationship between changes in convergence space and the occurrence of waterlogging, suggesting that the branched rainwater corridor system, which has undergone urbanization changes, still significantly influences the formation of waterlogging (Table 3).
Table 3.
Results of Pearson correlation analysis between waterlogging points in watershed units and four groups of influencing factors.
3.1.1. Affecting Factors of Runoff Sources
Among the factors characterizing runoff sources, the area of construction land and the impervious surface area in a watershed unit show positive correlations with the degree of waterlogging. The correlation coefficients between the area of construction land, impervious surface area, and degree of waterlogging are 0.501 and 0.403, respectively(Table 3), at different confidence levels, with a high correlation coefficient of 0.819 between the area of construction land and impervious surface area(Table 4). This indicates that construction land is the main carrier of impervious surfaces, and an increase in its area will increase the risk of waterlogging in the region.
Table 4.
Results of Pearson correlation analysis between construction land, other urban green spaces and connectivity of rainwater corridors and other impact factors.
3.1.2. Affecting Factors of Runoff Convergences Terminals
Among the factors characterizing convergence terminals, the area of water bodies and the ratio of water bodies are positively correlated with the degree of waterlogging, with the area of water bodies exhibiting a strong positive correlation (correlation coefficient of 0.717), indicating that watershed units with larger water bodies are at a greater risk of waterlogging (Table 3).
Among the factors representing various types of green spaces, only the ratio of farmland and the area of other urban green spaces are correlated with the degree of waterlogging, with correlation coefficients of −0.378 and 0.658, respectively. This indicates that green spaces, intended to act as primary covers for runoff retention, have yet to serve this function effectively. The weak negative correlation between the ratio of farmland and the degree of waterlogging suggests that while farmland may help reduce waterlogging risk, its impact is relatively minor. Conversely, the positive correlation between the area of other urban green spaces and the degree of waterlogging indicates that these areas have contributed to waterlogging. The correlation analysis between the area of other urban green spaces and other influencing factors revealed that the area of other urban green spaces were strongly correlated with impervious surface area, construction land area, and the number of conflict points between rainwater corridors and roads, with correlation coefficients of 0.838, 0.894, and 0.903, respectively (Table 4). This indicates that other urban green spaces might be closely linked to impervious surfaces, such as construction areas and roads. However, they do not effectively perform their rainwater retention functions. Furthermore, there is no significant correlation between the area of woodland or the woodland ratio and the severity of waterlogging within watershed units, suggesting that woodland has a minimal impact on waterlogging in Chinese southern hilly cities.
3.1.3. Affecting Factors of Runoff Convergence Processes
Among the five factors characterizing convergence processes correlated with the degree of waterlogging in the watershed unit, fourfactors are related to surface runoff processes (Table 3). The connectivity of rainwater corridors shows a moderate negative correlation with the degree of waterlogging, while the number of rainwater corridors, total length of rainwater corridors, and number of conflict points between rainwater corridors and roads show positive correlations with the degree of waterlogging. In terms of absolute correlation coefficient values, the importance of factors influencing waterlogging is as follows: the number of conflict points between rainwater corridors and roads > the number of rainwater corridors > the total length of rainwater corridors. Specifically, the correlation coefficients for the number of conflict points between rainwater corridors and roads and the number of rainwater corridors are 0.627 and 0.590, respectively. This suggests that the rainwater corridor network in Chinese southern hilly cities still has the function of draining runoff, but artificial constructions such as roads are segmenting rainwater corridors, disrupting their hydrological functions, and turning them into factors causing waterlogging. The connectivity of rainwater corridors shows positive correlations with the ratio of woodland and farmland, with correlation coefficients of 0.458 and0.600, respectively (Table 4). Both woodlands and farmlands are land cover types that facilitate rainwater infiltration and retention. This implies that the permeability of the underlying surface of the rainwater corridors can enhance their connectivity. In contrast, the length of the drainage network, which reflects underground runoff processes, exhibits only a weak positive correlation with the degree of waterlogging in watershed units, indicating that the existing drainage pipe networks have not effectively drained rainwater runoff but have become factors causing waterlogging. Furthermore, the complexity of rainwater corridors does not correlate with the degree of waterlogging in watershed units, suggesting that the hierarchy and development of branched tributaries and capillary corridors do not noticeably impact waterlogging formation.
3.1.4. Affecting Factors of Surface Topography and Surface Characteristics
Among the factors characterizing surface topography and surface characteristics, the standard deviation of the slope is positively correlated with the degree of waterlogging in watershed units, with a correlation coefficient of 0.413 (Table 3). This indicates that the complexity of terrain variation exacerbates the degree of waterlogging in watershed units. Compared to elevation variation, average elevation, and averageslope, the impact of terrain complexity on waterlogging risk in Chinese southern hilly cities is more significant.
3.2. Principal Component Analysis Results
The mutual influences among waterlogging factors may result in insufficient explanatory power in correlation analysis or situations where correlation does not imply causation. To more clearly reveal the influence of each factor on the formation of waterlogging, this study conducted a principal component analysis on factors significantly correlated with the degree of waterlogging in watershed units and selected indicator variables with loading coefficients exceeding 0.80 for principal component interpretation (Table 5).
Table 5.
Principal component analysis.
In the first principal component, seven factors exhibit loadings greater than 0.8, including the number of rainwater corridors, the area of impervious surface, the total length of rainwater corridors, the area of other urban green spaces, the length of drainage pipe networks, the area of construction land, and the number of conflict points between rainwater corridors and roads. All these factors are related to the hardening of urban surfaces. Among them, the number of rainwater corridors, the length of rainwater corridors, the area of other urban green spaces, and the number of conflict points between rainwater corridors and roads characterize surface convergence spaces. This indicates that urban surface hardening, especially the hardening of surfaces in convergence spaces, is one of the causes of waterlogging in Chinese southern hilly cities.
In the second principal component, three factors exhibit loadings greater than 0.8: the ratio of water bodies, the area of water bodies, and the standard deviation of slope. This suggests that changes in water bodies and slope significantly contribute to waterlogging in Chinese southern hilly cities.
In the third principal component, the loadings of two factors, the ratio of farmland and the connectivity of rainwater corridors are greater than 0.8. Table 4 demonstrates a positive correlation between the farmland ratio and the connectivity of rainwater corridors. Therefore, the third principal component represents the level of connectivity in rainwater corridors, highlighting its influence on waterlogging risk in Chinese southern hilly cities.
3.3. Comparative Analysis Results
Based on the above investigations, this study compares changes in land use, land cover, and topography in Changsha Central City before and after urban development. It investigates the relationships between these changes and three aspects: the hardening of urban runoff convergence surfaces, variations in urban water bodies and topographic slopes, and alterations in rainwater corridor connectivity. The study examines how these factors influence waterlogging in Chinese southern hilly cities. The waterlogging data utilized consist of waterlogging points collected between 2015 and 2017. However, analysis of remote sensing images from 2015 and 2017 indicates minimal land use and land cover changes during this period. Consequently, the study compares land use, land cover, and topographic slope data from 1990 and 2017 to provide a more comprehensive analysis.
3.3.1. Changes in Urban Runoff Convergence Surfaces
Variations in convergence surfaces are closely related to land use and cover changes. Therefore, this study examines changes in runoff convergence surface by comparing construction land’s quantity, composition, and distribution changes, which contribute to runoff, with woodland and farmland, which facilitate runoff convergence between 1990 and 2017.
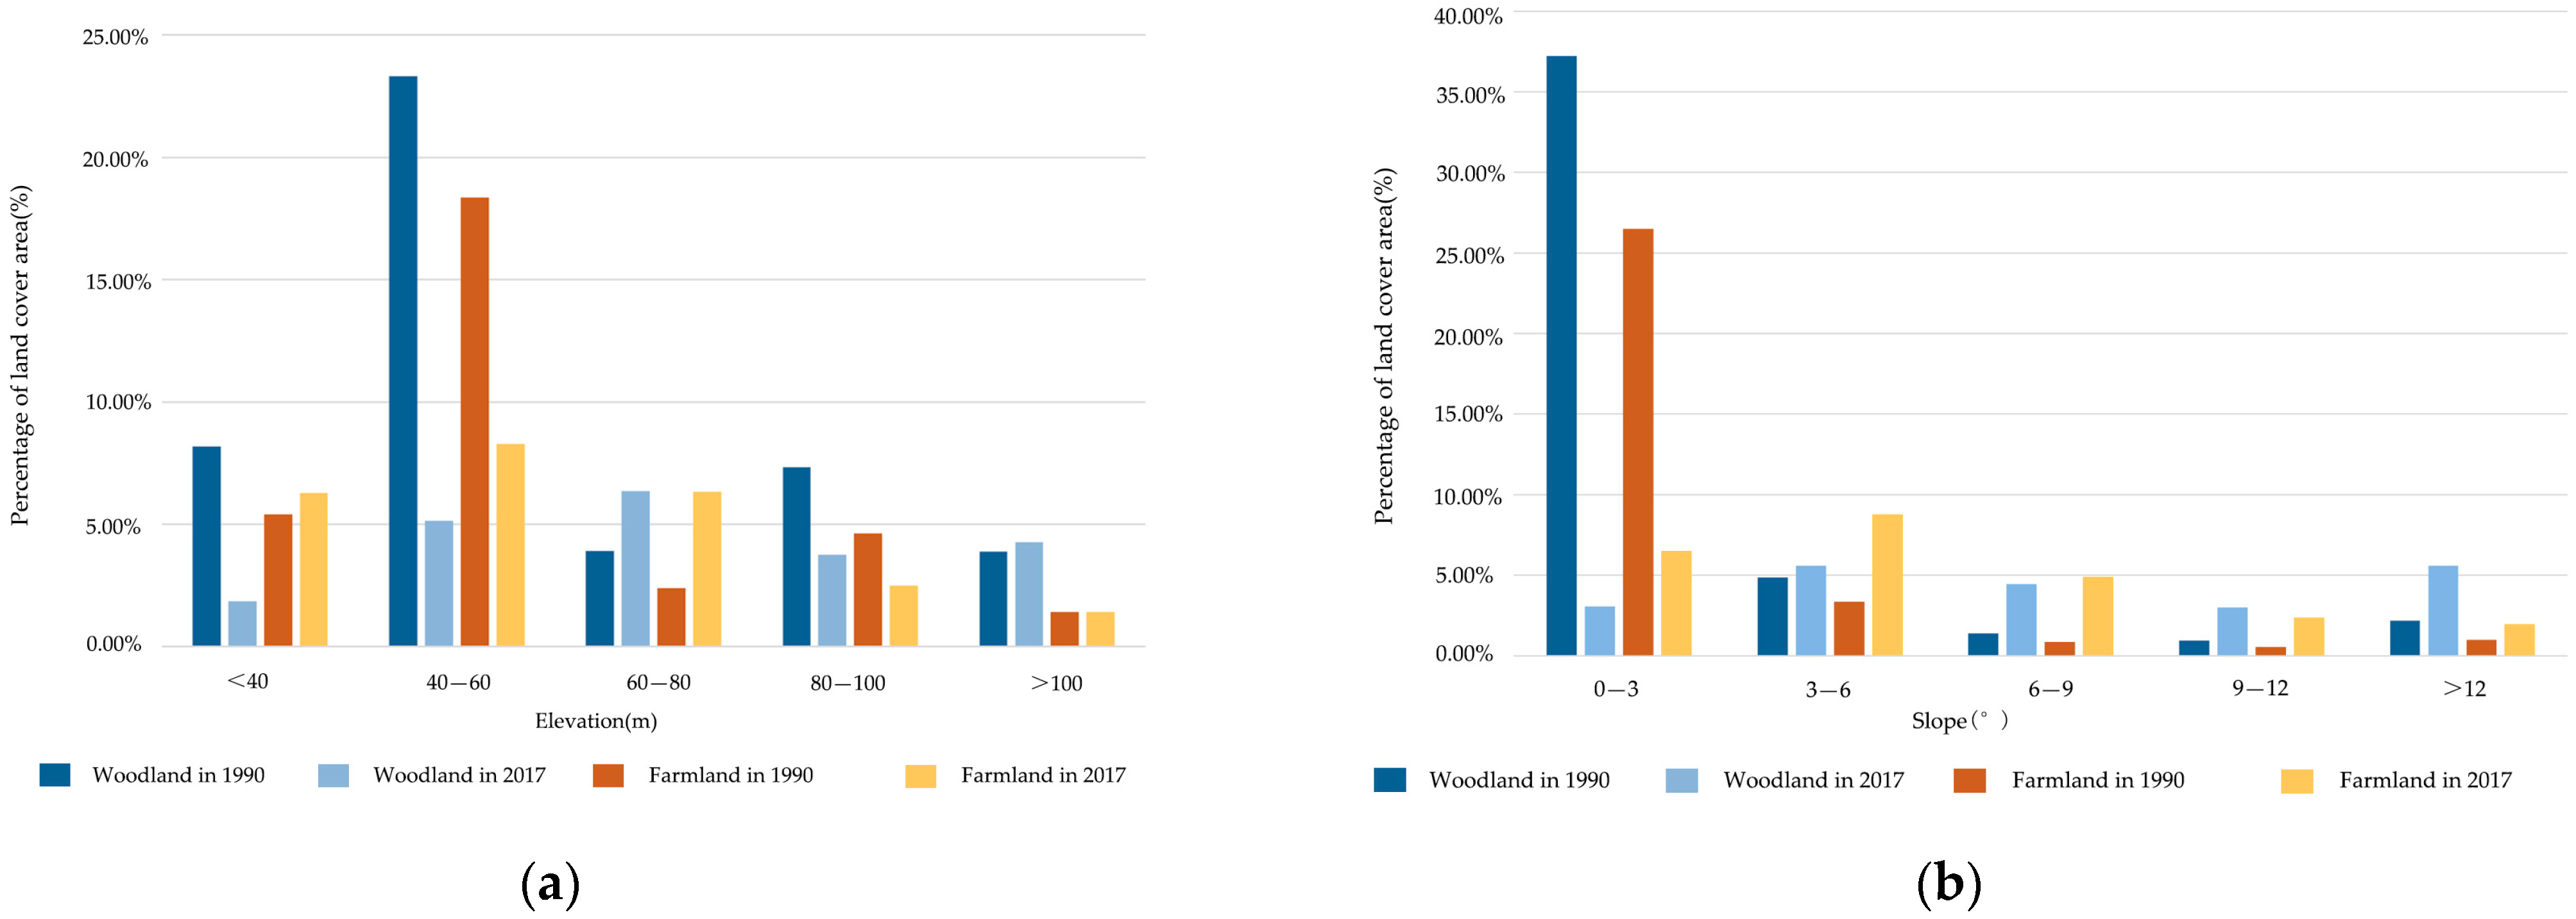
The land use transfer results from 1990 and 2017 (Table 6) reveal that construction land and other urban green spaces positively correlated with waterlogging degree in watershed units, increased by 79.08 km2 and 10.74 km2, respectively. In contrast, woodland and farmland, which contribute to runoff retention, decreased by 61.02 km2 and 33.38 km2, respectively. Specifically, woodland was converted to farmland, construction land, and other urban green spaces by 31.15 km2, 21.77 km2, and 18.18 km2, respectively. In comparison, farmland was converted to construction land by 62.18 km2. These reductions in woodland and farmland primarily occurred in relatively flat areas with elevations below 60 m (Figure 3). Figure 3 illustrates that between 1990 and 2017, the proportion of woodland at elevations below 40 m and between 40 and 60 m decreased from 8.16% and 23.31% to 1.86% and 5.15%, respectively. Although the proportion of farmland at elevations below 40 m increased from 5.39% to 6.28%, farmland at elevations between 40 and 60 m decreased from 18.36% to 8.29%. Over the 27 years, the proportion of woodland in relatively flat areas with slopes of 0–3 degrees decreased from 37.23% to 3.06%, while farmland decreased from 26.50% to 6.49%. Urbanization has reduced woodland areas to small patches on steeper slopes above 60 m. Rainfall on these sloped woodland areas tends to flow downhill due to gravitational forces, reducing local infiltration and diminishing its runoff retention capacity.
Table 6.
Land use transition matrix for Changsha central area from 1990 to 2017 (km2).
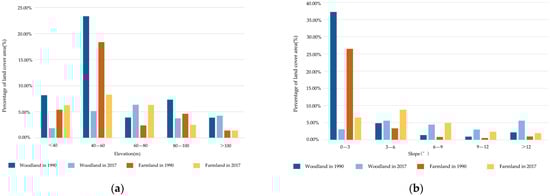
Figure 3.
(a) Distribution of land cover with different elevations, (b) distribution of land cover with different slopes.
Additionally, Figure 4 shows significant encroachment of rainwater corridors and adjacent areas by construction land over the 27 years. This encroachment likely explains the significant positive correlations between the length of rainwater corridors, the number of rainwater corridors and construction land, and impervious surfaces observed in the correlation analysis. As a significant carrier of impervious surfaces, construction land has substantially reduced the effectiveness of surface ecological runoff convergence spaces, significantly decreasing regional runoff capacity and converting these areas into runoff-producing spaces, thereby increasing regional runoff volumes.
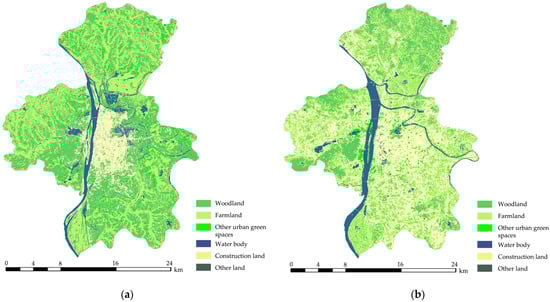
Figure 4.
The land use and cover maps for Changsha Central City in 1990 and 2017: (a) 1990; (b) 2017.
3.3.2. Changes in Urban Water Bodies and Topographic Slopes
This study examines the changes in water bodies by comparing the variations in their quantity, composition, and distribution between 1990 and 2017. It also investigates the impact of topographic slope changes on waterlogging point distribution by analyzing the overlap of these changes with waterlogging point locations during the same period. As shown in Table 6, while the total area of water bodies increased by 0.89 km2 from 1990 to 2017, their composition was significantly shifted. During this time, 11.80 km2 of original water bodies were converted into construction land, while 6.12 km2 of woodland and 9.55 km2 of construction land were transformed into water bodies. Figure 5a illustrates that the spatial distribution of water bodies in the study area changed significantly. Figure 5a shows several large lakes and numerous small ponds in 1990. However, in 2017, there was a sharp reduction to smaller, unevenly distributed island-like patches, with increased water bodies concentrated along the main rivers. These changes reduced the potential for nearly nearby surface runoff retention, increasing the risk of waterlogging. Furthermore, overlaying slope change maps from 1990 and 2017 in Changsha central area with rainwater corridors and waterlogging points indicate that waterlogging points are most concentrated in areas with diverse slope changes on the rainwater corridor surfaces (Figure 5b). This pattern reflects, to some extent, the spatial relationship between disordered topographic changes and the occurrence of waterlogging events.
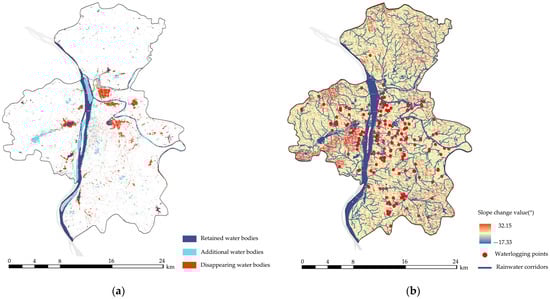
Figure 5.
Changes in water body distribution and slope in Changsha Central City from 1990 to 2017: (a) water body distribution; (b) slope.
3.3.3. Changes in Connectivity Levels of Urban Rainwater Corridors
Connectivity levels of urban rainwater corridors comprise both structural and ecological connectivity levels. The morphological structure of rainwater corridors indicates their structural connectivity levels, while the underlying surface reflects their ecological connectivity levels. This study examines changes in rainwater corridors by analyzing these two aspects. By comparing the land use and cover maps of Changsha Central City in 1990 and 2017 (Figure 4), it is evident that in 1990, the dendritic rainwater corridors in the suburbs had a clear morphological structure, with permeable farmland as their underlying surface. The 2017 land use map reveals that due to construction encroachment and road network fragmentation, some rainwater corridors have lost their morphological structure, while others maintain their structural form but have been converted to impervious surfaces. As a result, the structural and ecological connectivity of rainwater corridors has significantly decreased, reducing their ability to manage and retain rainwater, thereby increasing the risk of waterlogging in the region.
4. Discussion
4.1. The Role of Runoff Source Factors in Waterlogging Cause
Correlation analysis and principal component analysis both show a moderate positive correlation between construction land and impervious surfaces with the degree of waterlogging in watershed units. The increase in impervious underlying surfaces, which act as runoff sources, is one of the causes of waterlogging, aligning with the findings of most previous studies [33,34]. However, the correlation analysis reveals no significant relationship between the ratio of construction land, impervious surfaces, and the degree of waterlogging in watershed units. This may be related to using the number of waterlogging points as the indicator for the degree of waterlogging in this study. Comparative analysis shows that in Chinese southern hilly cities, the encroachment of impervious surfaces on runoff convergence spaces with retention functions, such as woodlands and farmlands in relatively flat areas below 60 m in elevation, increases runoff source areas while reducing surface runoff convergence spaces. This is a significant cause of waterlogging. This conclusion aligns with Samuel et al.’s proposal, which suggested that urban construction in floodplain areas is more likely to increase flood risk [6].
Furthermore, the correlation analysis shows that other urban green spaces, which are significantly correlated with construction land and roads, also have a positive correlation with the degree of waterlogging in watershed units. This suggests that other urban green spaces may increase the risk of waterlogging, contrary to some studies [35,36]. This discrepancy may be related to rainfall intensity and the retention capacity of green spaces. Zhou et al. [16] suggested that watershed units with high impervious surface rates often have limited green spaces, which can only retain runoff from small to moderate rainfall. Under extreme rainfall conditions, the retention capacity of green spaces in watershed units quickly becomes saturated, leading to runoff and exacerbating regional waterlogging. On the other hand, this may also be related to the insufficient implementation of LID in urban areas. Therefore, future urban planning should organize urban land use layouts more effectively, reduce the encroachment of construction land and other impervious surfaces on natural runoff spaces, and focus on LID strategies in areas with high impervious surface rates.
4.2. The Role of Runoff Convergence Terminals Factors in Waterlogging Cause
Correlation analysis reveals a strong relationship between the area of water bodies and the degree of waterlogging in watershed units. Specifically, larger water body areas are associated with more severe waterlogging. Consequently, an increase in the area of water bodies may be a significant factor contributing to waterlogging. This finding contrasts with the conclusions of Xue et al. [37]. However, the observation that watershed units with more than ten waterlogging points exhibit a river-aligned distribution pattern supports the validity of this conclusion (Figure 2). Among the factors characterizing runoff convergence terminal, the area and ratio of woodland and farmland did not significantly correlate with the degree of waterlogging in watershed units. This may be due to replacing retention-functioning woodlands and farmlands with impervious surfaces. Additionally, the ratio of other urban green spaces did not significantly correlate with the degree of waterlogging, possibly because this study used the number of waterlogging points as an indicator.
Principal component analysis reveals that changes in water bodies significantly impact waterlogging formation. Comparative analysis further identifies that the disappearance of dispersed small water bodies and the centralization of water body distribution are significant factors contributing to waterlogging. This finding aligns with studies by Kim et al. and Ge et al. [38,39]. The loss of distributed small water bodies, which facilitate runoff alleviation, hampers runoff retention near the source, directing it through surface and underground drainage systems to main rivers. This increases reliance on artificial drainage facilities and makes the city more vulnerable to external river levels [14]. This finding is consistent with the observations of Dinget al., who reported that waterlogging volumes at Nanhu Port in Changsha City increase as external river water levels rise [13].
Furthermore, both correlation and principal component analyses reveal that increasing complexity in slope variations can also contribute to urban waterlogging. Comparative analysis demonstrates that variations in the slope of rainwater corridor surfaces are a major contributor to waterlogging in watershed units resulting from topographic changes. Complex slopes can lead to the disappearance or discontinuity of dendritic rainwater corridors, obstructing surface runoff processes and making it difficult for runoff to reach convergence terminals, indirectly reducing the rainwater retention capacity of these runoff convergence terminals. Consequently, water bodies’ runoff detention and retention functions and other convergence terminals become ineffective. This conclusion is consistent with Jiang et al.’s study on Changsha, which found that the city’s vertical design did not adequately integrate terrain and LID facilities, resulting in Meixi Lake’s substantial retention capacity not being fully utilized for rainwater retention [14]. This may also be one of the reasons for the strong positive correlation between the area of water bodies and the degree of waterlogging in watershed units.
4.3. The Role of Surface Runoff Convergence Process Factors in Waterlogging Cause
Correlation analysis indicates that the connectivity of rainwater corridors is negatively correlated with the degree of waterlogging in watershed units. This suggests that improving the connectivity of rainwater corridors in Chinese southern hilly cities can somewhat reduce waterlogging. However, the analysis reveals a moderate positive correlation between the number and total length of rainwater corridors and the degree of waterlogging. This implies that these corridors, as surface runoff channels, have limited effectiveness in alleviating runoff and may increase waterlogging risk. This finding contrasts with Jiao et al.’s qualitative analysis of Changsha [40], which is potentially due to the loss of rainwater retention and detention functions caused by the hardening of rainwater corridor surfaces. Furthermore, the frequency and density of rainwater corridors and the density of conflict points between rainwater corridors and roads do not show significant correlations with the degree of waterlogging in watershed units, possibly because this study uses the number of waterlogging points as an indicator.
Principal component analysis and comparative analysis reveal that the destruction of the structural connectivity of rainwater corridors caused by urban roads, coupled with a decline in ecological connectivity due to surface hardening, significantly reduces the runoff alleviation effect of rainwater corridors. This is consistent with the positive correlation observed in the correlation analysis between the number of conflict points and the degree of waterlogging in watershed units, as well as the positive correlation between the connectivity of rainwater corridors and the ratio of woodland and farmland. These findings are also consistent with the conclusion by Han et al. that road networks are positively correlated with urban flooding [41].
In Chinese southern hilly cities, road construction often follows the circular-radial or grid road network typical of plain cities. This network, which is disconnected from the structure of rainwater corridors, increases the fragmentation of rainwater corridors (Figure 2). Runoff at these conflict points can cause localized waterlogging due to drainage difficulties. Moreover, the hardening of rainwater corridors surfaces the ecological connectivity of rainwater corridors, leading to runoff accumulation along roads. The impact of waterlogging spreads through point effects, corridor effects, and their superimposition across the water unit and beyond [42], increasing regional waterlogging risk.
4.4. The Role of Underground Runoff Convergence Process Factors in Waterlogging Cause
Correlation analysis indicates that within the factors representing the underground runoff convergence process, the length of the drainage pipe network shows a weak positive correlation with the degree of waterlogging in watershed units. This suggests that drainage networks, functioning as underground runoff channels, are ineffective in mitigating urban waterlogging. This finding is consistent with the conclusions of most studies on the causes of urban waterlogging in China [9,10]. The outdated design standards of urban drainage facilities cannot manage the rapid increase in stormwater runoff during extreme rainfall events. When these systems reach capacity, they lose their drainage capability and overflow, exacerbating waterlogging. The density of the drainage pipe network does not exhibit a significant correlation with the degree of waterlogging in watershed units, which may be related to using the number of waterlogging points as an indicator in this study.
Urban construction in China often relies on small drainage systems, with underground drainage networks as the primary means for water discharge. In Chinese urban development, drainage has primarily relied on underground drainage networks. These systems are designed to manage typical urban rainfall events, with storm recurrence intervals typically set between 2 and 10 years. In Changsha Central City, the standard drainage pipe design recurrence period is nearly 1 year. In contrast, the design recurrence period for areas such as overpasses and squares is 3 to 5 years. The storm recurrence period for flood control standards is 20 years. These outdated urban drainage facilities struggle to cope with frequent extreme rainstorms and rainfall events. They may increase urban flood risks due to stormwater overflow.
4.5. Limitations and Uncertainties
This study provides valuable insights into the causes of waterlogging in Chines southern hilly cities. However, it has limitations that should be addressed in future research. First, the urban waterlogging data used in this study are vectorized points based on historical records of waterlogging events, with statistics compiled annually. The absence of specific details for each waterlogging event, such as depth, area, duration, or external river levels, inevitably introduces some uncertainty to the results. Second, the waterlogging data used in this study only covers the central urban area of Changsha, resulting in a limited number of watershed unit samples and contributing to this uncertainty. Third, factors such as land use, land cover, and city surface changes are closely related to the urban context.Consequently, the conclusions of this study may not apply to suburban areas of Changsha or other hilly cities in southern China. Fourth, the study employs only a few common indicators to quantify the scale, density, length, and connectivity of material elements. As a result, research on the composition and spatial patterns of these elements and their relationship to urban waterlogging is insufficient. With the rise of big data technology, research that combines social media data with land use and other information for urban waterlogging prevention has become increasingly common. Therefore, future research could benefit from methods proposed by Liu et al. and Chen et al. [43,44] for acquiring waterlogging data through big data to increase the quantity and precision of research data and samples, thereby improving the reliability of results. Additionally, future studies could gather waterlogging information from both urban centers and suburban areas of different hilly cities in southern China to compare and verify the generalizability of the study’s conclusions. Finally, when data are sufficient, two-dimensional and three-dimensional pattern indices representing the spatial distribution of urban land use, land cover, and rainwater corridors, and soil infiltration and vegetation retention indices characterizing surface storage capacity can be introduced to gain a deeper and more comprehensive understanding of how hydrological-process-related material elements contribute to waterlogging.
5. Conclusions
This study focuses on the Changsha central area and, based on the hydrological processes of Chinese southern hilly cities, utilizes correlation analysis, principal component analysis, and comparative analysis to qualitatively and quantitatively explain the causes of waterlogging in Chinese southern hilly cities. The main conclusions are as follows:
- Material element changes in runoff sources, runoff convergence terminals, and runoff convergence processes induced by urbanization are the leading causes of waterlogging in Chinese southern hilly cities. Overall, contributing factors include the hardening of convergence spaces, the concentration of water body distribution, declining connectivity levels of rainwater corridors, spatial alterations in topographic slope complexity, and outdated drainage facilities.
- In terms of runoff sources, the expansion of impervious surface-dominated construction land exacerbates urban waterlogging. The encroachment of impervious surfaces into runoff convergence spaces transforms areas that could initially retain runoff into runoff sources, which is one of the causes of urban waterlogging in Chinese southern hilly cities. Moreover, due to the limited capacity to capture and retain runoff, green spaces in urban centers are susceptible to generating runoff during extreme rainfall events when their retention capacity is exceeded, increasing the risk of urban waterlogging.
- In terms of runoff convergence terminals, woodlands and farmlands with runoff retention functions, particularly those in low-elevation, flat urban areas, have been encroached upon by impervious surfaces, reducing urban runoff convergence terminals. The complex changes in the topographic slopes of rainwater corridor surfaces have obstructed some natural surface runoff processes, hindering runoff from reaching water bodies. The centralization of water body distribution forces runoff to travel longer distances to reach these convergence terminals, thereby increasing the city’s reliance on artificial drainage systems. Consequently, the combined effects of reduced urban runoff convergence terminals, obstructed runoff processes, and inadequate drainage capacity have rendered the runoff detention function of water bodies ineffective. As a result, the area of these water bodies has become a primary factor that increases the risk of urban waterlogging.
- In terms of surface runoff convergence processes, enhancing the structural and ecological connectivity of rainwater corridors is crucial for mitigating urban waterlogging. However, in Chinese southern hilly cities, intersecting roads frequently disrupt these corridors, which impairs their structural connectivity. Moreover, woodlands and farmlands, which are the primary underlying surfaces of rainwater corridors, have been replaced by impervious surfaces, further diminishing the ecological connectivity of these corridors. As a result of these combined factors, rainwater corridors have increasingly become contributors to urban waterlogging.
- In terms of underground runoff convergence processes, drainage networks frequently contribute to urban waterlogging because of outdated design standards. These networks are susceptible to overflow during extreme rainfall events once they reach full capacity.
Based on the above research conclusions, Chinese southern hilly cities should focus on the following aspects in future urban development to comprehensively enhance urban drainage and flood prevention capabilities:
- Urban land layouts should be reasonably organized to reduce construction land encroachment on natural runoff convergence spaces.
- Urban water bodies should be scattered, and green rainwater infrastructure should be integrated to form decentralized urban ecological rainwater discharge systems.
- The urban vertical slopes should be designed to create continuous runoff dispersal channels.
- Urban road networks should be optimized to minimize interference with rainwater corridors, avoiding conflicts between roads and rainwater corridors.
- The continuity of green spaces along rainwater corridors should be increased, and buffering green spaces should be established at conflict points between rainwater corridors and road networks.
- The design standards of drainage facilities should be updated and improved.
Author Contributions
Conceptualization, B.L., S.J. and M.Z.; methodology, B.L. and Y.Z.; software, B.L. and Y.Z.; validation, B.L.; investigation, B.L. and M.Z.; resources, B.L. and S.J.; data curation, Y.Z.; writing—original draft preparation, B.L.; writing—review and editing, B.L., S.J. and M.Z.; visualization, B.L.; supervision, M.Z.; project administration, B.L.; funding acquisition, B.L., Y.Z. and S.J. All authors have read and agreed to the published version of the manuscript.
Funding
This research was funded by the National Natural Science Foundation of China (grant number 52078440 and 52278059), Science and Technology Project of Sichuan Province—Youth Fund Project (grant number 2022NSFSC1039), Special Fund for Basic Research Operating Costs of Central Universities (grant number ZYN2023055), Ministry of Education Industry-University Co-operation Collaborative Education Project (grant number 230805377024212).
Institutional Review Board Statement
Not applicable.
Informed Consent Statement
Not applicable.
Data Availability Statement
Data are contained within the article.
Acknowledgments
The authors gratefully acknowledge the editors and the anonymous reviewersfor their valuable comments.
Conflicts of Interest
The authors declare no conflicts of interest.
References
- Zhang, Q.X.; Hu, J.Y.; Song, X.P.; Li, Z.H.; Yang, K.H.; Sha, Y.Z. How Does Social Learning Facilitate Urban Disaster Resilience? A Systematic Review. Environ. Hazards 2020, 19, 107–129. [Google Scholar] [CrossRef]
- Fowler, H.J.; Lenderink, G.; Prein, A.F.; Westra, S.; Allan, R.P.; Ban, N.; Barbero, R.; Berg, P.; Blenkinsop, S.; Do, H.X.; et al. Anthropogenic Intensification of Short-duration Rainfall Extremes. Nat. Rev. Earth Environ. 2021, 2, 107–122. [Google Scholar] [CrossRef]
- Hemmati, M.; Kornhuber, K.; Kruczkiewicz, A. Enhanced Urban Adaptation Efforts Needed to Counter Rising Extreme Rainfall Risks. NPJ Urban Sustain. 2022, 2, 16. [Google Scholar] [CrossRef]
- Liu, W.; Zhang, X.; Feng, Q.; Yu, T.F.; Engel, B.A. Analyzing The Impacts of Topographic Factors and Land Cover Characteristics on Waterlogging Events in Urban Functional Zones. Sci. Total Environ. 2023, 904, 166669. [Google Scholar] [CrossRef] [PubMed]
- Wang, Y.H.; Li, C.L.; Liu, M.; Cui, Q.; Wang, H.; Lv, J.S.; Li, B.L.; Xiong, Z.P.; Hu, Y.M. Spatial Characteristics and Driving Factors of Urban Flooding in Chinese Megacities. J. Hydrol. 2022, 613, 128464. [Google Scholar] [CrossRef]
- Brody, S.D.; Gunn, J.; Peacock, W.; Highfield, W.E. Examining the Influence of Development Patterns on Flood Damages Along the Gulf of Mexico. J. Plan. Educ. Res. 2011, 31, 438–448. [Google Scholar] [CrossRef]
- Zhang, Y.; Qiu, H.F. Regulation Strategies of the Distribution of Lake Parks Based on Detention and Retention of Stormwater in the Central City of Wuhan. Chin. Landsc. Archit. 2017, 33, 104–109. [Google Scholar]
- Li, Y.; Ye, S.S.; Wu, Q.Z.; Qian, S.H. Analysis and Countermeasures of the “7.20” Flood in Zhengzhou. J. Asian Archit. Build. Eng. 2023, 22, 3782–3798. [Google Scholar] [CrossRef]
- Zhang, J.Y.; Wang, Y.T.; Liu, C.S.; He, R.M. Discussion on The Standards of Urban Flood and Waterlogging Prevention in China. J. Hydroelectr. Eng. 2017, 36, 1–6. [Google Scholar]
- Zhang, C.; Zhang, L.W.; Mo, Z.L.; Chen, Y.; Gao, W.; Yan, F. Discussion on Coordination of Control Systems between Urban Flooding and River Basin Flooding in New Era. Water Wastewater Eng. 2020, 56, 9–13. [Google Scholar]
- Chen, L.D. Urban Stormwater Control Needs Eco-Smart Leadership. Acta Ecol. Sin. 2016, 36, 4932–4934. [Google Scholar]
- Hu, H.L.; Tan, J. Causes and Countermeasures of Waterlogging in Changsha Urban Area under Extreme Meteorological and Hydrological Conditions. Henan Water Resour. South--North Water Divers. 2022, 51, 27–29. [Google Scholar]
- Ding, J.; He, W.; Wu, S.J.; Fan, L.L.; Zhang, G.W.; Yang, L.; Feng, Q. Effects of Heavy Rainfall and Outer River Level on Urban Waterlogging in Hilly Areas of South China: A Case Study of Nanhu Port, Changsha City. Desalination Water Treat. 2023, 302, 121–128. [Google Scholar] [CrossRef]
- Jiang, Q.; Zheng, B.H. Study on The Influence of Urban Stormwater Detention and Retention Space on Flood Disaster—Case Study of Flood Disaster in Changsha, 2017. J. Nat. Disasters 2018, 27, 29–38. [Google Scholar]
- Jiao, S.; Hu, X.; Han, Z.W. A Study on Quantitative Evaluation of Effect Factors of Urban Waterlogging under Multiple Scales: Taking Five Internal Zones in Changsha as an Example. Ecol. Econ. 2020, 36, 222–229. [Google Scholar]
- Zhou, K.J.; Jiao, S.; Han, Z.W.; Liu, Y.C. Assessment of Flood Regulation Service Based on Source–Sink Landscape Analysis in Urbanized Watershed. River Res. Appl. 2023, 39, 1382–1398. [Google Scholar] [CrossRef]
- Jiao, S.; Li, S.M.; Gao, Q.; Zhou, K.; Wei, C.Y.; He, S.Y. The Application of Landscape Connectivity Theory in Urban Ecology Suitability Assessment and Optimization. Geogr. Res. 2013, 32, 720–730. [Google Scholar]
- Xu, Y.Q.; Liu, B.; Huang, J. Regional Planning in Hilly Area of South China. Planners 2017, 33, 85–93. [Google Scholar]
- Chen, H.; Jiang, J.L.; Xu, Y.Q. Road and Water Networking Symbiosis in Hilly Region. Planners 2014, 30, 42–48. [Google Scholar]
- Chen, N.C.; Yao, S.; Wang, C.; Du, W.Y. A Method for Urban Flood Risk Assessment and Zoning Considering Road Environments and Terrain. Sustainability 2019, 11, 2734. [Google Scholar] [CrossRef]
- Mayor, Á.G.; Susana, B.; Eric, E.; Small, M.D.; Juan, B. Measurement of The Connectivity of Runoff Source Areas as Determined by Vegetation Pattern and Topography: A Tool for Assessing Potential Water and Soil Losses in Drylands. Water Resour. Res. 2008, 10, W10423. [Google Scholar] [CrossRef]
- Ninon, L.F.; Vincent, P.; Elhadi, M.H.A.; Knut, A. Catchment Scale Effects of Low Impact Development Implementation Scenarios at Different Urbanization Densities. J. Hydrol. 2022, 612, 128178. [Google Scholar]
- Wu, J.S.; Sha, W.; Zhang, P.H.; Wang, Z.Y. The Spatial Non-Stationary Effect of Urban Landscape Pattern on Urban Waterlogging: A Case Study of Shenzhen City. Sci. Rep. 2020, 10, 7369. [Google Scholar] [CrossRef] [PubMed]
- Zha, Y.; Gao, J.; Ni, S. Use of Normalized Difference Built-Up Index in Automatically Mapping Urban Areas from TM Imagery. Int. J. Remote Sens. 2003, 24, 583–594. [Google Scholar] [CrossRef]
- Yuan, W.; Yan, G.K.; Tang, M.; Xu, Q.X. Stream Structure Characteristics and Their Impact on Storage and Flood Control Capacity in The Urbanized Plain River network. Geogr. Res. 2005, 5, 717–724. [Google Scholar]
- Zhou, K.J.; Kong, F.H.; Zhuang, X.Y.; Ban, Y.L.; Yin, H.W.; Yang, Z.J.; Song, X.H. Structure and Function of River Network and The Influence Mechanism in Plain Polder Area: A Case Study of Southern Flood District in Kunshan. Acta Ecol. Sin. 2024, 8, 3268–3279. [Google Scholar]
- Yuan, W.; Philip, J.; Yang, K. Impact of Urbanization on Structure Function of River System-Case Study of Shanghai, China. Chin. Geogr. Sci. 2006, 16, 102–108. [Google Scholar] [CrossRef]
- Liu, S.; Wu, L.; Guo, Z.J.; Zhang, H.Y.; Du, B.L. Elucidating The Response Mechanisms of Hydrological and Sediment Connec tivity to the River Network Structure, Vegetation, and Topographic Features in the Jinghe River Basin. Land Degrad. Dev. 2024, 35, 1699–1715. [Google Scholar] [CrossRef]
- Fu, C.; Li, Y.Y.; Wang, S.T. Analysis of Water System Structure and Connectivity in the Center of Nanchang under the Ur banization Process. Resour. Environ. Yangtze Basin 2017, 26, 1042–1048. [Google Scholar]
- Mustafa, U.; Hasan, Ö. The Role of Basin Morphometric Features in Flood Output: A Case Study of the Biga River Basin. J. Geogr. 2018, 36, 49–62. [Google Scholar]
- Zhou, H.J.; Shi, P.J.; Wang, J.A.; Gao, L.; Zheng, J.; Yu, D. River Network Change and Its Ecological Effects in Shenzhen Region in Recent 30 Years. Acta Geogr. Sin. 2008, 63, 968–980. [Google Scholar]
- Zhang, W.T.; Dong, W. Advanced Tutorial in SPSS Statistical Analysis, 3rd ed.; Higher Education Press: Peking, China, 2018; pp. 239–295. [Google Scholar]
- Wang, Y.B.; Xie, X.H.; Liang, S.L.; Zhu, B.W.; Yao, Y.; Meng, S.S.; Lu, C.Y. Quantifying the Response of Potential Flooding Risk to Urban Growth in Beijing. Sci. Total Environ. 2020, 705, 135868. [Google Scholar] [CrossRef] [PubMed]
- Li, C.L.; Liu, M.; Hu, Y.M.; Shi, T.; Qu, X.Q.; Walter, M.T. Effects of Urbanization on Direct Runoff Characteristics in Urban Functional Zones. Sci. Total Environ. 2018, 643, 301–311. [Google Scholar] [CrossRef]
- Fry, T.J.; Maxwell, R.M. Evaluation of Distributed BMPs in an Urban Watershed-High Resolution Modeling for Stormwater Management. Hydrol. Process. 2017, 31, 700–2712. [Google Scholar] [CrossRef]
- Yang, B.; Lee, D. Urban Green Space Arrangement for an Optimal Landscape Planning Strategy for Runoff Reduction. Land 2021, 10, 897. [Google Scholar] [CrossRef]
- Xue, J.; Yan, J.; Chen, C. Combining Catastrophe Technique and Regression Analysis to Deduce Leading Landscape Patterns for Regional Flood Vulnerability: A Case Study of Nanjing, China. Front. Ecol. Evol. 2022, 10, 1002231. [Google Scholar] [CrossRef]
- Kim, M.; Song, K.; Chon, J. Key Coastal Landscape Patterns for Reducing Flood Vulnerability. Sci. Total Environ. 2021, 759, 143454. [Google Scholar] [CrossRef]
- Ge, Z.; Guhathakurta, S.; Lee, S.; Susannah, L.; Amy, M.; Yan, L.J. Grid-Based Land-Use Composition and Configuration Optimization for Watershed Stormwater Management. Water Resour. Manag. 2014, 28, 2867–2883. [Google Scholar]
- Jiao, S.; Zhou, M.; Dai, Y.J.; Yin, Y.C.; Han, J.Y. Establishment of A Multiscale Sponge System in Hilly Cities Based on Rainwater Corridor. Urban Plan 2019, 43, 95–102. [Google Scholar]
- Han, F.; Zhang, X.; Yu, J.; Xu, S.; Zhou, G.; Li, S. Study on Spatiotemporal Dynamic Characteristics of Precipitation and Causes of Waterlogging Based on A Data-Driven Framework. Sci. Total Environ. 2024, 913, 169796. [Google Scholar] [CrossRef]
- Zong, Y.G.; Zhou, S.Y.; Peng, P. Perspective of Road Ecology Development. Acta Ecol. Sin. 2003, 11, 2396–2405. [Google Scholar]
- Li, J.; Cai, R.; Tan, Y.; Zhou, H.; Sadick, A.M.; Shou, W.; Wang, X. Automatic Detection of Actual Water Depth of Urban Floods from Social Media Images. Measurement 2023, 216, 112891. [Google Scholar] [CrossRef]
- Chen, Y.; Hu, M.; Chen, X.; Wang, F.; Liu, B.; Huo, Z. An Approach of Using Social Media Data to Detect The Real Time Spatio Temporal Variations of Urban Waterlogging. J. Hydrol. 2023, 625, 130128. [Google Scholar] [CrossRef]


Disclaimer/Publisher’s Note: The statements, opinions and data contained in all publications are solely those of the individual author(s) and contributor(s) and not of MDPI and/or the editor(s). MDPI and/or the editor(s) disclaim responsibility for any injury to people or property resulting from any ideas, methods, instructions or products referred to in the content. |
© 2024 by the authors. Licensee MDPI, Basel, Switzerland. This article is an open access article distributed under the terms and conditions of the Creative Commons Attribution (CC BY) license (https://creativecommons.org/licenses/by/4.0/).