Abstract
This study examines the impact of COVID-19 on customer satisfaction and the value relevance of customer satisfaction. COVID-19 is an unprecedented pandemic that has changed all areas of business. Customer relations are one of the biggest paradigm shifts of this period. Companies have placed more attention on customer relations than on any other areas, and customer relations are an essential element in corporate sustainability. The value relevance directly represents the sustainability of corporations. It is very important for firms to retain their customers in the market, create a potential demand, and, thus, increase the firm value. We investigate whether companies financially benefit from customer relations. Employing the value relevance model, we regress firm value on the customer satisfaction scores with other control variables. We find that the customer satisfaction score has increased throughout the sample period, and that the value relevance of customer satisfaction has declined after the COVID-19 outbreak. Together, we interpret the results as indicating the impact of COVID-19 on the value relevance of customer satisfaction, especially the decreasing trends in value relevance. The results are robust even after controlling endogeneity and outliers. This study has several implications for practitioners and academia regarding the impact of COVID-19 on the value relevance of customer satisfaction.
1. Introduction
This study aims to investigate whether COVID-19 has an impact on the value relevance of customer satisfaction. The COVID-19 pandemic is an unprecedented experience, and this has caused difficulties for all areas of businesses, especially in the customer-related area [1,2,3]. The business environment has changed, and business practice focuses on survival mode. Companies have placed greater importance on customer relations than ever before, and customer relations play a critical role in corporate sustainability [4,5,6]. The corporate sustainability can be represented by profitability, financial performance, and non-financial performance. Researchers raise questions about how customer satisfaction is related to corporate sustainability. The customer relation is one of the biggest paradigm shifts in this area. The business purpose of firm is to create a potential demand, to retain experienced customers, and eventually to increase the firm value [7,8,9]. The benefits of customer relation cannot be overemphasized, and the firms should pay close attention to it [10,11]. Prior studies find that the positive relation between customer satisfaction and firm’s financial performance has grown in the past 40 years [12,13]. Other studies also highlights the financial impact of marketing activities and confirms that there is a significant association between customer satisfaction and financial performance at a firm level [14,15].
Customer satisfaction is the most emphasized elements of business aspects in recent periods. Some accounting studies first argue that customer satisfaction is an investment in the quality of a firm’s asset and, in return, that customer satisfaction is the “intangible asset” that creates value in firms [16,17]. If the information (especially accounting information) has the ability to capture and reflect firm value, one believes that the information is value relevant [18,19,20,21,22]. Various studies in accounting and finance have examined the value relevance of financial and non-financial information, including financial statement numbers, financial disclosures, and customer satisfaction [23,24,25,26]. For example, Yang (2008) presents that six variables measuring both quantity and quality features of patents predict the subsequent market values in the biotech industry [27]. The study also argues that the patent information is particularly important to value relevance, but these studies have difficulty in finding such results because they fail to correctly measure the information in patents. Others also examined three aspects in value relevance of customer satisfaction, including the indicators of accounting performance, the reflection of customer satisfaction in accounting book values, and the indicators of stock market performance [16,28]. In contrast to the previous studies that examine the relationship between financial numbers, such as income and sales, and the stock market performance, the study suggests that the non-financial information such as customer satisfaction may be a better predictor of stock market performance. Accordingly, one can conclude that customer satisfaction is of relevant value [29].
Consumer behavior was one of the most changing phenomena during the pandemic era. Consumer patterns changed from face-to-face to non-face-to-face. During the pandemic, being confined changed customer habits and behaviors significantly. Prior studies report a significant change in customer satisfaction and the customers’ use of reviews by other people [12,15]. This change has been blamed for, at least partially, the supply chain crisis and online review system. Thus, customer satisfaction has become complicated for companies to respond to [30]. As [31] noted, the pandemic considerably changed customers’ expectations due to the need for social distancing, sanitization, and mask use. They also investigate whether the pandemic has affected customer satisfaction in the hotel industry [30]. They found that there was an enormous reduction in customer satisfaction, and the results are robust with worldwide hotel chains. Although some studies investigate customer satisfaction during the post-pandemic era, little is known yet about the new trends in customer satisfaction. The lack of evidence in the prior studies [30,31] encourages our research questions: Is there a change in customer satisfaction? Does COVID-19 affect the value relevance of customer satisfaction?
Using the NCSI scores of customer satisfaction, we employ various test models and find that (1) customer satisfaction has increased steadily before and after the COVID-19 pandemic; (2) the value relevance of customer satisfaction significantly dropped during COVID-19. In particular, the coefficients on customer satisfaction in the value relevance models show even to be negative during the pandemic (2020–2023). In addition, the results are robust even after adjusting the scores to use the country-adjusted score. The study also confirms qualitatively similar results with the additional tests excluding potential outliers during COVID-19. Together, we interpret the results as indicating new customer satisfaction trends, especially reduction trends.
In this study, we make valuable contributions to the literature. First, this study contributes to the literature by extending the extent of customer satisfaction. The COVID-19 pandemic is an unprecedented experience and has caused difficulties for all businesses. The business environment has changed, and business practice focuses on survival mode. Prior studies have examined the effect of COVID-19 on customer satisfaction and reported some mixed results [32,33,34]. Our study finds evidence for the increase in customer satisfaction. Second, the current study is the first study to examine the value relevance of customer satisfaction during the pandemic. The value relevance of customer satisfaction provides critical perspectives because it is directly related to the value creation of marketing spending. Practitioners might have to consider the return on investment of their marketing strategies [31,32,33,34]. Although customer satisfaction increased during the pandemic, it is also possible that the return on investment and the value relevance of investment decreased during this period. Lastly, this study is consistent with the academic theories for viewing customer satisfaction as a value-creation practice. To the best of our knowledge, this is the first study examining such value-creation processes during the pandemic.
2. Literature Review and Research Question
2.1. Customer Relations
In a global market where competition is intensifying, corporate sustainability is more important than ever. There are several ways to measure corporate sustainability. The corporate sustainability may include profitability, financial performance, and non-financial performance. The prior studies have focused on the metrics such as the return on asset (ROA), return on equity (ROE), and net income to quantify firms’ profitability [35,36,37,38,39]. There are also a number of studies that deliver the measures of corporate sustainability using market metrics such as the value of a firm, Tobin’s Q, and buy-and-hold returns [40,41]. Since the 1990s, however, researchers have begun to change the direction of their research on corporate sustainability [16]. Especially, the importance of non-financial information is increasing every year. The customer relation is one of the biggest paradigm shifts in this area. It is very important for firms to retain their customers in the market, create a potential demand, and, therefore, increase the firm value [29]. Customer relations play a critical role in business, and firms pay close attention to it.
2.2. Customer Satisfaction
Among numerous elements of customer relation, customer satisfaction is the most emphasized element in recent periods. To the best of our knowledge, Ittner and Larcker (1998) and Banker et al. (2000) are the first accounting studies to link customer satisfaction with the performance measures of the firm [16,17]. They argue that customer satisfaction is an investment in the quality of firm’s asset and, in return, that customer satisfaction is the “intangible asset” that creates value in firms. Since Refs. [16,17] address the value relevance of customer satisfaction, others constantly investigate the relationship between customer satisfaction and firm value in various aspects of market metrics [40,41]. The results of pricing (or mispricing) of customer satisfaction is first presented by [29]. Using the American Customer Satisfaction Index (ACSI), they re-investigate the relationship between customer satisfaction and future stock market performance [29]. The study argues that the mispricing anomaly presented in the prior studies [16] stems from the abnormal returns by leading firms in customer satisfaction performance. Thus, they conclude that the relationship between customer satisfaction and market returns may not be generalized. The anomaly may be due to inappropriate risk adjustment and/or capital market irrationality. In a supplementary study, Ittner et al. (2009) executee a more comprehensive set of tests and finds that the ACSI score has incremental information on the firm’s future performance [28]. Consequently, the market participants respond to the information in the index only when the satisfaction scores increase on a large scale. Their results are limited to only short window tests, and they find no evidence on long window tests. Accordingly, the study by [28] supplements the findings of [29]. Although the researchers in prior studies [28,29] implement customer satisfaction in their test models, caution must be taken when the readers interpret the results [42,43].
2.3. Value Relevance
If the information (especially accounting information) has the ability to capture and reflect firm value, one believes that the information is value relevant [18,19,20,21,22]. Various studies in accounting and finance have examined the value relevance of financial and non-financial information, including financial statement numbers, financial disclosures, and customer satisfaction [23,24,25,26]. For example, prior study finds that the POPS (population measure) and market penetration measures are highly value relevant in the wireless communications industry [44]. In the high-tech industry where there is heavy investment in intangibles, such as research and development, brand development, and customer-base activity, the traditional accounting variables, such as earnings and book values, may not be the best to predict the market value of the firm [44]. Another study also presents that six variables measuring both quantity and quality features of patents predict the subsequent market values in the biotech industry [27]. The study also argue that the patent information is particularly important to value relevance, but [44] has the difficulty to find such results because they fail to correctly measure the information in patents. Ittner and Larcker (1998) examines three aspects in value relevance of customer satisfaction, including the indicators of accounting performance, the reflection of customer satisfaction in accounting book values, and the indicators of stock market performance [16]. Contrary to the previous studies that examine the relationship between financial numbers, such as income and sales, and the stock market performance, the study suggests that non-financial information, such as customer satisfaction, may be a better predictor of stock market performance. Accordingly, one can conclude that the customer satisfaction is value relevant [29]. The researchers have turned their eyes to the hospitality and tourism industry, where customer satisfaction has been given much attention [45]. They empirically examine whether the customer satisfaction index (CSI) is associated with the firm’s financial performance. The findings indicate that the customer satisfaction index is positively associated with the firm value. In a related study, Agag et al. (2023) examines the relationship between customer feedback and financial performance with the recent data set of the tourism industry [46]. The study has important implications for both academia and practitioners [35,36,37,38,39]. It implies that the effective use of intangible assets (i.e., customer satisfaction) can improve the firm performance and create the value.
2.4. The Impact of COVID-19
The COVID-19 pandemic has changed almost everything in our lives. Consumer behavior is one of the most changing phenomena during the pandemic era. Consumer patterns have changed from face-to-face to non-face-to-face. Nowadays, people order food for delivery and leave online reviews for the food store and the delivery driver. Thus, customer satisfaction has been complicated during the pandemic, and it is difficult for companies to monitor when they use it [30]. As [31] noted, the pandemic considerably changed customers’ expectations due to the need for social distancing, sanitization, and mask use. Prior studies investigate whether the pandemic has affected customer satisfaction in the hotel industry, where the effects of the pandemic were the greatest [30,31]. They found that there was an enormous reduction in customer satisfaction, and the results are robust with worldwide hotel chains. Although some studies [16,19] investigate customer satisfaction during the post-pandemic era, little is known yet about the change in customer satisfaction.
The considerable gap in the literature encourages our research questions: Is there a change in customer satisfaction? Does COVID-19 change the value relevance of customer satisfaction? Consequently, this is an empirical question, and this study provides a new empirical analysis of the new trends in customer satisfaction.
3. Research Methods
3.1. Customer Satisfaction Index
We collected the customer satisfaction data from NCSI (National Customer Satisfaction Index) of Korea. NCSI is a similar measure of customer satisfaction developed by the University of Michigan (ACSI). This index aims to improve the quality metrics of companies, industries, and the quality of life of the people. It was first published in 1998 and has grown to become one of the largest quality indicators in Korea, covering 82 industries, 349 companies, and 95,927 samples as of 2023. The index has helped companies improve their customer satisfaction via diverse efforts and thus has improved the quality competitiveness of Korea as a whole nation. Although it was originally developed in the USA, NCSI is a reliable and comparable index because the index scores of any country, industry, and company can be compared with those of other countries, industries, and companies. Accordingly, the comparison may include more than 1000 companies in more than 30 countries worldwide.
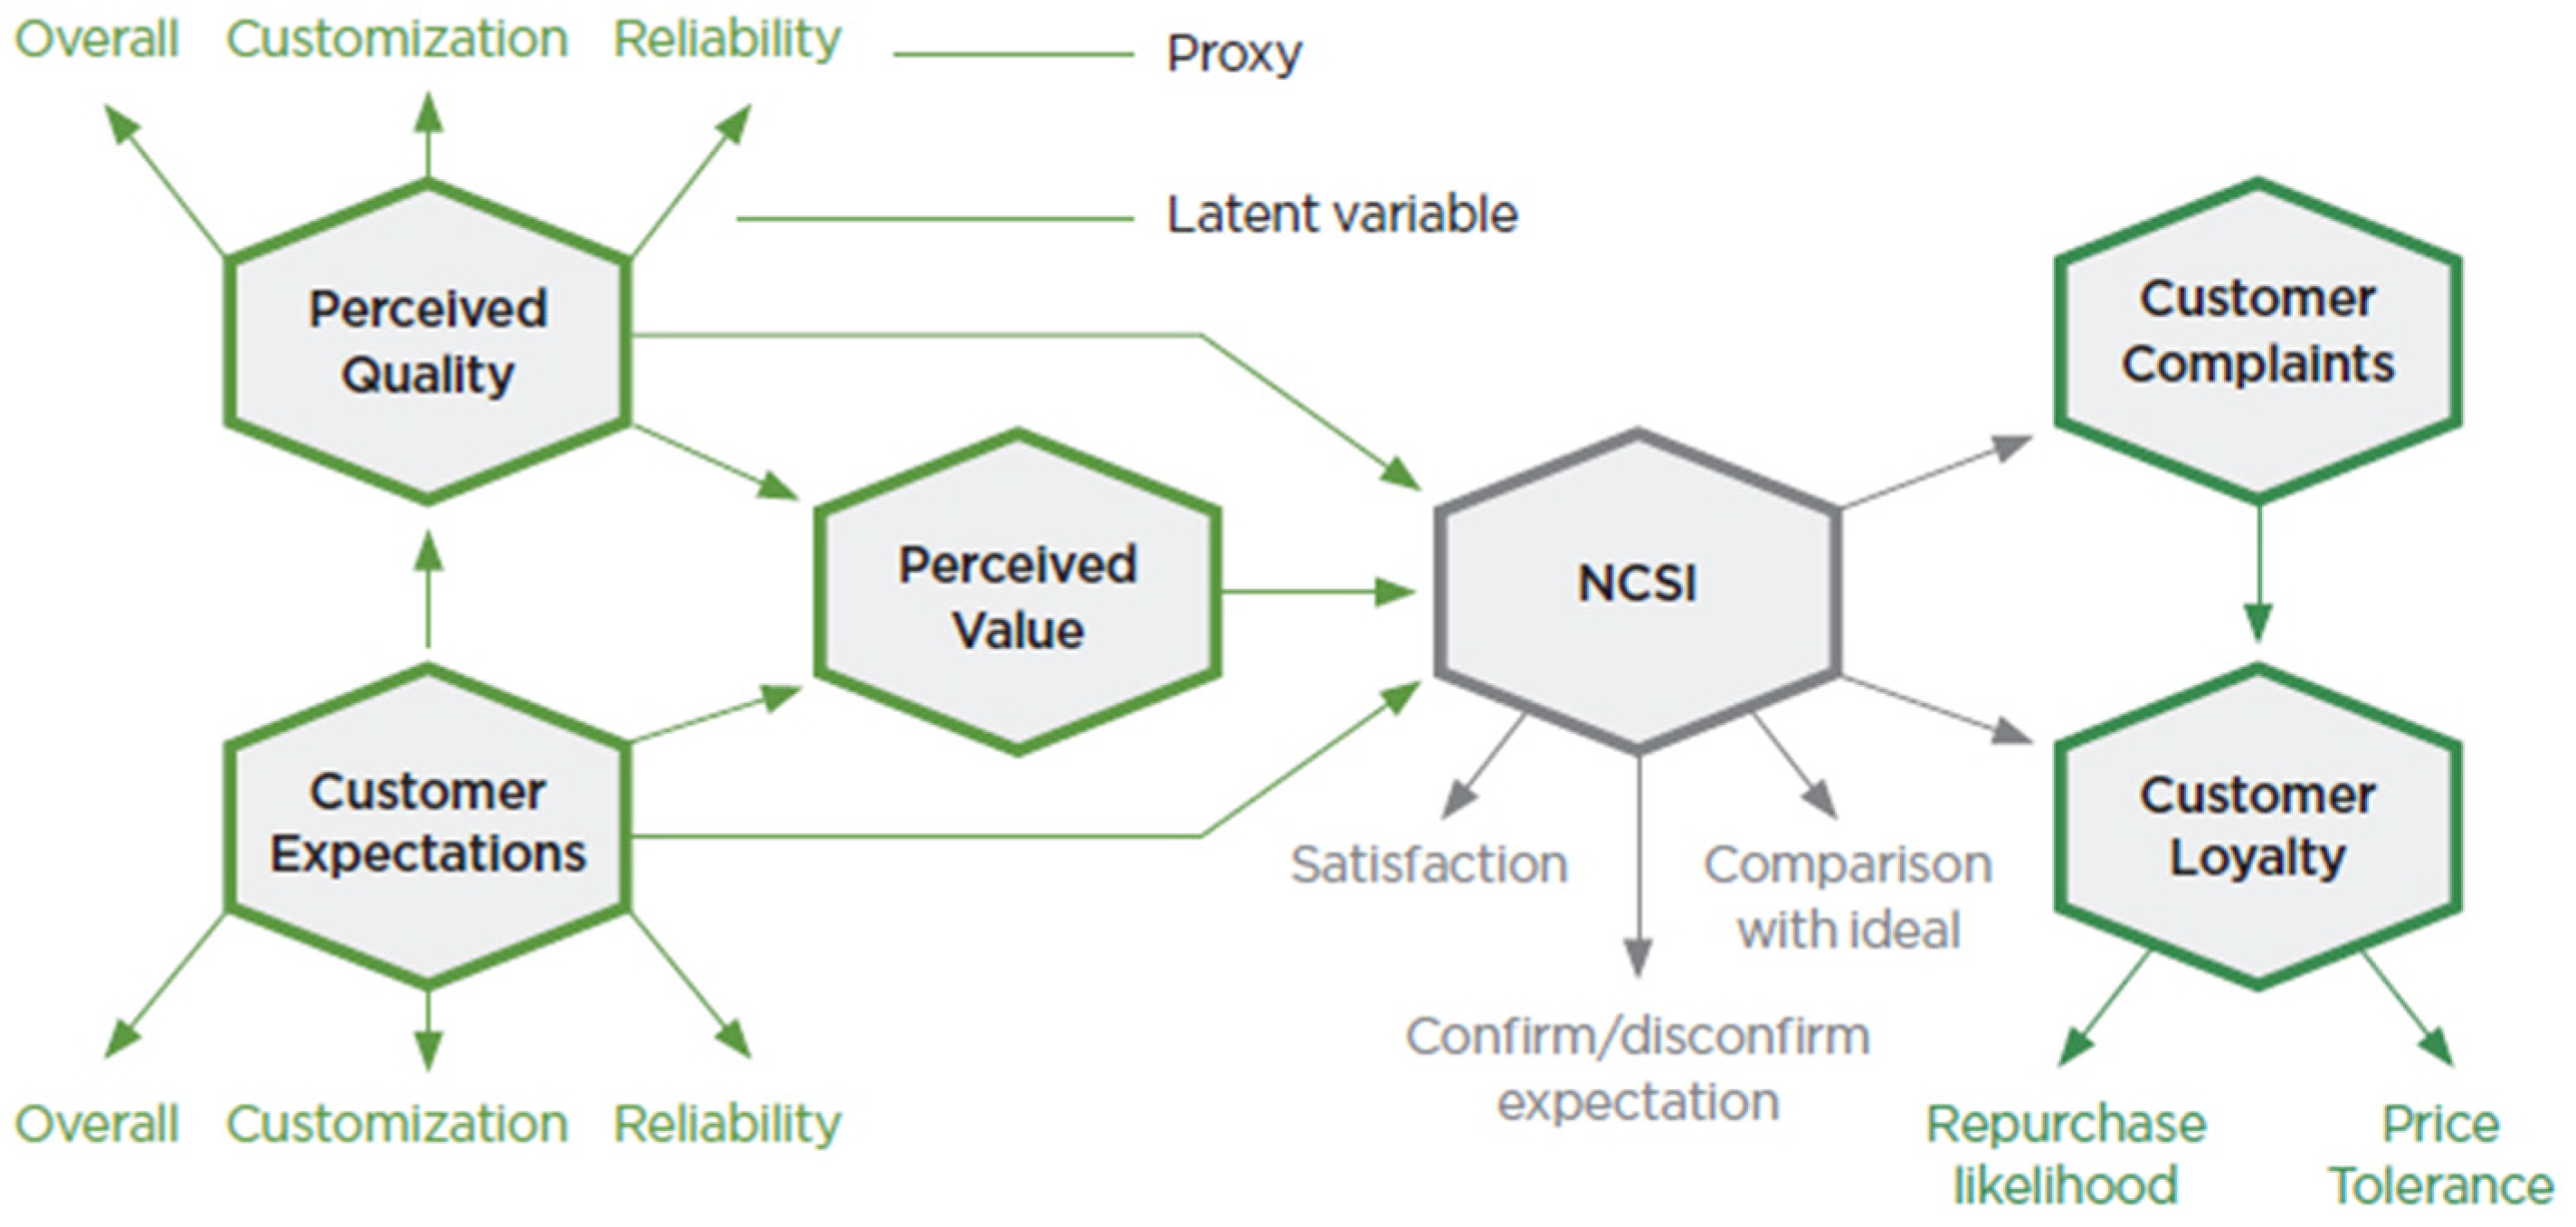
Figure 1 depicts the evaluation model of NCSI. NCSI measures the satisfaction scores by aggregating all the products and services companies offer. In this regard, the scores are based on an individual company rather than a particular product or brand. The NCSI index model consists of six latent variables, including customer expectations, customer’s perceived quality, customer’s perceived value, customer satisfaction, customer complaints, and customer loyalty. There are three variables categorized as leading variables (customer expectations, perceived quality, and perceived value) that impact customer satisfaction. There are also two variables (customer complaints and customer loyalty) that are affected by the customer satisfaction level [47]. Three proxies are measured and evaluated for each variable. The evaluation agency measures these proxies, including overall, customization, and reliability, and thus, completes the evaluation process for each variable. After three variables are determined, the NCSI score is given considering three factors: satisfaction, confirm/disconfirm expectation, and comparison with ideal [48,49]. The NCSI score provides a standardized set of customer satisfaction. Although we believe the NCSI score is unbiased, one needs to be cautious that customer satisfaction may not be perfectly measurable [50,51]. Thus, our results must be interpreted with caution.
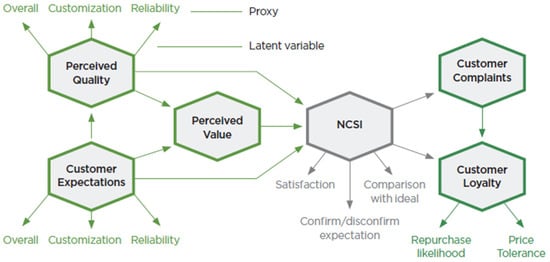
Figure 1.
NCSI model [Source: www.ncsi.or.kr (accessed on 1 April 2024)].
3.2. Value Relevance Models
In order to test the value relevance of customer satisfaction, we implement the following valuation models [52].
where Pt is the price at time t, EARNt is earnings for period t, Return is the periodic buy-and-hold return for t, α is the intercept and β is the slope coefficient, and εt is error term. Two models provide equivalent tests for the value relevance of earnings. They include assumptions that earnings follow a random walk, and thus market uses the information in the current and past period of earnings. Although they are equivalent in their specifications, it is always better when you implement both models if available. In this study, however, we only adopt the price model because of the loss of sample when we use the return model. It is also possible that our results might be biased when we run the change model (return model) with the change of NCSI score.
Price Model Pt = α + βEARNt + εt
Return Model Returnt = α + βΔEARNt + εt
3.3. Empirical Tests
Following the previous studies in the literature, we examine the value relevance of customer satisfaction by regressing the measures of financial performance on the variable of interest (customer satisfaction) with other control variables [28,29,43,53]. In value relevance studies, the response variables are usually market-based metrics that include the firm’s market value, Tobin’s Q and market-to-book ratio [40,41]. In this study, we include the aforementioned market-based metrics and the profitability measures, including the return on equity (ROE), return on assets (ROA), and profit margin. The following regression models are assessed for our test.
TOBINit = α + β1CSit + β2POSTit +β3CS × POSTit + β4SIZEit + β5LEVit + β6LIQit +
β7CAPINTENit + β8R&Dit + β9ADVINTENit + Year + Ind + εit
β7CAPINTENit + β8R&Dit + β9ADVINTENit + Year + Ind + εit
MBit = α + β1CSit + β2POSTit +β3CS × POSTit + β4SIZEit + β5LEVit + β6LIQit +
β7CAPINTENit + β8R&Dit + β9ADVINTENit + Year + Ind + εit
β7CAPINTENit + β8R&Dit + β9ADVINTENit + Year + Ind + εit
We estimate the above regression equations using two market-based dependent variables. For our empirical test of the value relevance of customer satisfaction, the coefficient of interest is β3, the interaction term between customer satisfaction and the indicator variable of COVID-19. If there is any significant change in the value relevance of customer satisfaction during the COVID-19 period, the β3 will be statistically significant, and the sign of β3 depends on the direction of change. TOBIN measures a firm’s financial performance, calculated as the sum of the market value of equity and long-term debt scaled by total assets. MB is the market-to-book ratio, calculated as the market value of equity scaled by the book value of equity. BETA is a CAPM beta, calculated using one-year daily returns. ROE is the return on equity, calculated as the ratio of net income over total equity. ROA is the return on asset, calculated as the ratio of net income over total assets. PROFIT is the profitability measure, calculated as the ratio of net income divided by total sales. CS is the percentile measure of NCSI score. POST is a dummy variable, coded one if the period belongs to the post-COVID-19 period. SIZE is a measure of firm size, calculated as the natural log of total asset. LEV is the measure of leverage, calculated as the ratio of total liability divided by common equity. LIQ is the liquidity measure, calculated as the ratio of current assets over current liabilities. CAPINTEN is the capital intensity measure, calculated as the ratio of total asset divided by sales. R&D is the research and development intensity, calculated as the ratio of research and development spending divided by sales. ADVINTEN is the advertising intensity, calculated as the ratio of advertising expenses over sales. All equations include the year and industry dummies to control for other effects.
4. Results
4.1. Descriptive Statistics
We collected the customer satisfaction data from NCSI (National Customer Satisfaction Index) of Korea. NCSI is a similar measure of customer satisfaction developed by the University of Michigan (ACSI). This index aims to improve the quality metrics of comparison. Our sample period spans from 2014 to 2023, including both pre-COVID-19 and post-COVID-19. In this study, we investigate the impact of COVID-19 on the value relevance of customer satisfaction. Thus, our sample includes the period before COVID-19 (2014–2019) and the period after COVID-19 (2020–2023). Because we try to examine the difference between two periods, one may need to be cautious when interpreting our results. The individual scores for the firms were collected, and the country average was also collected for further analysis. We also run the test with the industry-adjusted score (untabulated), and the results are qualitatively equivalent. Figure 2 depicts the average scores of NCSI for each year. Surprisingly, the scores have increased throughout the period, even during COVID-19. The scores in 2014, for example, were 73.71 for the average of individual firms and 73.4 for the country. The score continued to rise until 2020, then the rate of increase slowed down after 2020. We expected that customer satisfaction during COVID-19 possibly fell because of social distancing and the lack of outside activities. However, the data indicates that this is not the case. Also, the satisfaction scores slightly went down after 2022 with the re-opening period. We interpret that the expansion of online commerce and the non-face-to-face experience was better than expected for the customers. Thus, the customers may prefer such a consumption experience. For our main results, we compare the value relevance of customer satisfaction before and after COVID-19. Note that the value relevance does not always mean the scores themselves.
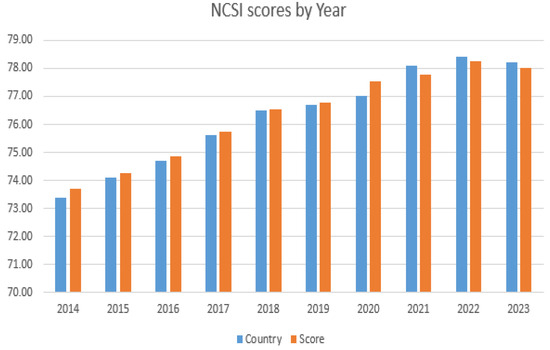
Figure 2.
NCSI scores by year.
Table 1 outlines further details about the descriptive statistics of the sample. The table reports the basic statistics of each variable, including the mean, standard deviation, and percentile point. The mean score of NCSI is 76.45, and the median is 77. The one percentile (0.70) and ninety-nine percentile (0.84) show the sample has a normal distribution. The country score has similar patterns. For the value relevance test, we include two main variables of interest from the capital market, Tobin’s Q and Market-to-book ratio [40,41]. Tobin’s Q is similar to the market-to-book ratio in terms of calculation. Tobin’s Q is measured using the sum of market value of equity and long-term debt scaled by total assets, but the market-to-book ratio is calculated by the ratio of market value of equity divided by book value of equity. Both measure a firm’s financial performance by comparing the book value of equity with the market metrics of that. The mean of Tobin’s Q and MB is 1.17 and 1.26, respectively. The median of Tobin’s Q and Mb is 0.94 and 0.90, respectively. The means of two variables are slightly greater than the medians of two variables. This shows that the distribution of two variables is skewed to the right. It is possible that some firms with high NCSI scores are dominant in the sample. SIZE shows that the average firm is relatively large (mean of 29.17), and those firms’ leverage is quite low (0.42). This is evidence that NCSI covers large and financially healthy companies. In other words, the firms included in the sample are in their stable stage of business life, and thus, the liquidity is fairly high (1.45). Still, capital intensity (4.33), research and development (0.0087), and advertising intensity (0.023) are moderately low [29,43]. Another reason for those numbers being low is probably because the sample coverage of NCSI is centered on the firms with services and consumer products. Those firms may not necessarily spend lots of resources to the capital investment, R&D, and advertising.

Table 1.
Descriptive Statistics.
4.2. Correlations
Table 2 provides the Pearson correlations among the variables. The NCSI score is negatively correlated with the market-based performance (TOBIN and MB) of the firms. Although the p-value shows statistical insignificance, the correlation itself shows that the value relevance of NCSI score is weak for whole sample. The correlations between NCSI scores and SIZE indicate that the firms are relatively large in the sample. The correlation coefficient on LEV is −0.144 and statistically significant, which shows that the firms in the sample have low leverage and are financially healthy. The correlation of the score with capital intensity presents a negative coefficient and is statistically significant. We interpret the coefficient that the firms in this sample tend not to spend on capital investment [29]. Even though the results show some preliminary evidence, this suggests that the sample consists of large and financially healthy firms [43]. For the value relevance of customer satisfaction, it is unclear yet whether the overall value relevance exists or whether there is a change in the value relevance of customer satisfaction.
Table 2.
Correlations.
4.3. Univariate Tests
Table 3 presents the univariate tests of our analysis. We first decompose our sample into two groups: Pre-COVID-19, which consists of the years before 2020, and Post-COVID-19, which consists of the years in or after 2020. POST, a dummy variable coded one if the period belongs to years after 2019, is included for the sample partition. The pre-group has 188 observations in the sample, and the post-group has 136 observations. The last column of Table 3 indicates the difference between the two groups and the applicable statistics. As the previous chapters show, the scores of the post-group are bigger than those in the pre-group. The table also shows that the overall profitability between the two groups is not significantly different. The variables that may represent the firm characteristics, such as SIZE and LEV, also indicate that the firms in the sample are homogeneous in their size, leverage, and investment intensity [50]. In this preliminary analysis, we interpret the results that there might be a reduction in the value relevance of customer satisfaction. This is consistent with the results reported in other tables.
Table 3.
Univariate Test.
4.4. Regression Analysis
Table 4 presents our main findings on the value relevance of customer satisfaction. We regress our dependent variables (TOBIN and MB) on the score of NCSI and other control variables. Column 1 and Column 3 provide evidence of the value relevance of customer satisfaction for the overall sample, and Column 2 and Column 4 provide evidence of the differential value relevance of customer satisfaction during the COVID-19 period. The regression coefficient on SCORE indicates the association between customer satisfaction and the market metrics (TOBIN and MB) [40,41]. Both Column 1 (−0.583) and Column 3 (−1.131) show negative coefficients but are statistically insignificant. We interpret these results that there is no value relevance of customer satisfaction during the overall period. However, as we include the dummy variable (POST), our regression analysis shows that there is a significant difference in the value relevance of customer satisfaction between the two periods. When TOBIN is employed for the dependent variable, the coefficient on SCORE is positive and statistically significant at 5% level. The coefficient on the interaction term between SCORE and POST is negative and also statistically significant at 5% level. The positive and significant coefficient on SCORE indicates that customer satisfaction is positively associated with the firm’s market performance (TOBIN) for the years before 2020. Furthermore, the negative and significant coefficient on SCORE × POST indicates that customer satisfaction is negatively associated with the firm’s market performance (TOBIN) for the years during COVID-19. When MB is employed for the dependent variable, the results are similar to those based on TOBIN (columns 3 and 4). All the t-statistics in the regression estimation are based on the White’s (1980) standard errors [54,55,56,57].
Table 4.
Regression Analysis. (Raw Score).
With the positive association between TOBIN and customer satisfaction, we interpret the results as showing that the value relevance of customer satisfaction existed before COVID-19. Interestingly, though, the negative association between TOBIN and customer satisfaction during COVID-19 indicates that the value relevance of customer satisfaction becomes reversed. Although customer satisfaction scores have increased during COVID-19, the market value of customer satisfaction has not increased or even dramatically decreased for the sample period. Therefore, Table 4 provides evidence of the new trends in customer satisfaction.
Table 5 shows results similar to those in Table 4. We employed the regression models using the NCSI raw score in Table 4. However, using the raw score may raise concerns about possible endogeneity [58,59]. Thus, we adjusted the NCSI score from its raw number to a country-adjusted number. In particular, each score is adjusted based on the percentage change of the country score. Therefore, the score used in Table 5 indicates whether the score is above or below the country mean on a percentage basis. The results in this table are even stronger than those in Table 4. Columns 2 and 4 present the main findings that the value relevance of customer satisfaction was strong before COVID-19, but such relevance has become reversed during COVID-19. The t-stats are based on the White’s standard errors [54,55,56,57]. Even though we employ the country-adjusted NCSI score in test models, the results are qualitatively similar to those using the raw scores.
Table 5.
Regression Analysis. (Country-adjusted score).
4.5. Robustness Check
Another concern that researchers may raise is the extreme effects of COVID-19 on the results. While we investigate whether there is a change before and after COVID-19 in this study, the year 2020 may have played a critical role as an outlier in our tests [60]. Accordingly, we replicate Table 4 and Table 5, excluding the observations from the year 2020. The number of observations is now down from 324 to 290. Table 6 presents the results of reduced value relevance of customer satisfaction using the raw score of NCSI, and the results are qualitatively similar to those in Table 4.
Table 6.
Regression Analysis. (Raw Score excluding year 2020).
Table 7 replicates the results from Table 5, excluding the observations from the year 2020. The results are also qualitatively similar to those in Table 5. Consequently, the results from Table 6 and Table 7 confirm a significant change in the value relevance of customer satisfaction during COVID-19 even after excluding any observations from the year 2020 [60].
Table 7.
Regression Analysis. (Country-adjusted excluding year 2020).
5. Discussion
This study aims to investigate whether there is an impact of COVID-19 on the value relevance of customer satisfaction. Using the sample of NCSI scores of customer satisfaction from 2014 to 2023, we employ various test models to test the value relevance of customer satisfaction [52]. The descriptive statistics show that the NCSI score had increased even before the COVID-19 outbreak (2020). The increasing trend reached its peak during the pandemic. It is consistently shown with a prior study by Ref. [61] that COVID-19 impacted lower overall customer satisfaction during the pandemic. Kothari and Zimmerman (1995) provides a simple but precise analysis of the value relevance [52]. We implemented the price-level test using TOBIN’s Q and the market-to-book ratio as dependent variables. In the analysis, we regress two price variables on the NCSI score with other control variables. We find, in the basic model, that the regression coefficient on the NCSI score shows the positive sign and statistical significance at a conventional level. We interpret this that the customer satisfaction score is value relevant in overall sample period. However, when we add the indicator variable of POST that divides our sample into before 2020 and after 2019 in the model, the interaction term between customer satisfaction score and the period indicator (POST*CS) presents the negative coefficient and statistical significance at conventional level. We interpret this that the value relevance of customer satisfaction significantly changed in or after the year 2020. In addition, the results are robust even after adjusting the scores from the individual level to the country-adjusted level to control for possible endogeneity issues [49,50]. The study also confirms qualitatively similar results with the additional tests excluding potential outliers in the middle of COVID-19. Together, we interpret the results as indicating new customer satisfaction trends, especially reduction trends.
6. Conclusions
The findings in this study have several implications for practitioners and academia. First, this study contributes to the literature by extending the extent of customer satisfaction. The COVID-19 pandemic is an unprecedented experience and has caused difficulties for all businesses. The business environment has changed, and business practice focuses on survival mode, not growth. Prior studies have examined the effect of COVID-19 on customer satisfaction and reported some mixed results [32,33,34]. However, many studies provide dominant evidence for the reduction [31]. Our study finds evidence for the increasing trend in customer satisfaction. With a unique dataset of the Korean NCSI, a total of 324 observations for a ten-year span indicate that the customer satisfaction score has increased during the sample period. We interpret the results as follows: companies in Korea, an IT powerhouse, overcame the pandemic crisis well, and the customers were pleased. Second, this study first examines the value relevance of customer satisfaction throughout the pandemic period. The value relevance of customer satisfaction provides critical perspectives because it is directly related to the value creation of marketing spending. Practitioners always have to consider the effectiveness of their marketing strategy. In other words, the return on investment of their efforts [35,36,37,38,39]. Although customer satisfaction increased during the pandemic, it is also possible that the return on investment and the value relevance of investment decreased during this period. Our results stimulate practitioners not only to increase customer satisfaction but also to increase the value relevance of customer satisfaction. Thus, the practitioners achieve their goals by accomplishing the effectiveness of the marketing strategy. Lastly, this study is consistent with the academic theories for viewing customer satisfaction as a value-creation practice [16,17]. In this regard, our results confirm that customer satisfaction as non-financial information provides useful information for investors. To the best of our knowledge, this is the first study examining such value-creation processes during the pandemic.
Even though our study makes valuable contributions to the literature, our study also has some limitations, and there are related calls for future research. Our sample of 324 Korean firms may limit the generalization of our findings. The sample may have only large firms because of the nature of NCSI coverage. However, we believe the sample selection is unbiased because our sample consists of firms from various industries. The distribution of NCSI score also confirms our unbiased results. Nevertheless, the future study may have to expand the sample coverage for further generalization. Customer satisfaction is a very complicated emotion to measure. Researchers may have to encompass all the criteria when measuring customer satisfaction. Although the NCSI score is standardized scientifically, the score is not always perfect in representing customer satisfaction. Thus, researchers interpret their results with caution [Ferreira 2]. Further research may have to discover the qualitative comportments of customer satisfaction. One of the qualitative issues in this study is why this phenomenon happens. This study provides empirical evidence of the reduction in value relevance of customer satisfaction. However, future study may explore why and how the value relevance of customer satisfaction decreases during the period [62]. For this research question, researchers may employ qualitative methods in the examination [63].
Author Contributions
This study is a joint work of the two authors. H.-Y.P. contributed to data collection and empirical analysis. C.-K.P. participated in the ideas of customer satisfaction, developing the research design, writing, and interpreting the analysis. Both authors contributed to the literature review and conclusions. All authors have read and agreed to the published version of the manuscript.
Funding
This research was supported by the 2020 new faculty research fund program of Dongguk University (S-2020-G0001-00108).
Institutional Review Board Statement
Not applicable.
Informed Consent Statement
Not applicable.
Data Availability Statement
All the data are publicly available.
Acknowledgments
We are grateful to Na-Young Cho for her assistance.
Conflicts of Interest
The authors declare no conflicts of interest.
References
- How, S.; Lee, C.G. Customer satisfaction and financial performance linear or non-linear relationship: A case study of Marriot International. Curr. Issu. Tourism. 2021, 24, 1184–1189. [Google Scholar] [CrossRef]
- Eachempati, P.; Srivastava, P.R.; Kumar, A.; de Prat, J.M.; Delen, D. Can customer sentiment impact firm value? An integrated text mining approach. Technol. Forecast. Soc. Chang. 2022, 174, 121265. [Google Scholar] [CrossRef]
- Alexandre, N. Vertical Integration in Healthcare and Patient Satisfaction: An Exploratory Analysis of Portuguese Reforms. Sustainability 2024, 16, 1078. [Google Scholar] [CrossRef]
- Prados-Peña, M.B.; Crespo-Almendros, E.; Porcu, L. How Online Sales Promotions via Social Networks Affect the Brand Equity of a Heritage Destination. Heritage 2022, 5, 2547–2564. [Google Scholar] [CrossRef]
- Ebrahim, R.S. The role of trust in understanding the impact of social media marketing on brand equity and brand loyalty. J. Relatsh. Mark. 2020, 19, 287–308. [Google Scholar] [CrossRef]
- Chang, H.J.J.; Jai, T.M.C. Is fast fashion sustainable? The effect of positioning strategies on consumers’ attitudes and purchase intentions. Soc. Responsib. J. 2015, 11, 853–867. [Google Scholar] [CrossRef]
- Schivinski, B.; Dabrowski, D. The effect of social media communication on consumer perceptions of brands. J. Mark. Commun. 2016, 22, 189–214. [Google Scholar] [CrossRef]
- Lili, Z.; Al Mamun, A.; Hayat, N.; Salamah, A.A.; Yang, Q.; Ali, M.H. Celebrity endorsement, brand equity, and green cosmetics purchase intention among Chinese youth. Front. Psychol. 2022, 13, 860177. [Google Scholar] [CrossRef]
- Sadyk, D.; Islam, D.M.Z. Brand equity and usage intention powered by value Co-creation: A case of instagram in Kazakhstan. Sustainability 2022, 14, 500. [Google Scholar] [CrossRef]
- Assaf, A.G.; Josiassen, A.; Cvelbar, L.K.; Woo, L. The effects of customer voice on hotel performance. Int. J. Hosp. Manag. 2015, 44, 77–83. [Google Scholar] [CrossRef]
- Ferreira, D.C.; Vieira, I.; Pedro, M.I.; Caldas, P.; Varela, M. Patient Satisfaction with Healthcare Services and the Techniques Used for its Assessment: A Systematic Literature Review and a Bibliometric Analysis. Healthcare 2023, 11, 639. [Google Scholar] [CrossRef] [PubMed]
- Udofia, E.E.; Adejare, B.O.; Olaore, G.O.; Udofia, E.E. Supply disruption in the wake of COVID-19 crisis and organisational performance: Mediated by organisational productivity and customer satisfaction. J. Humanit. Appl. Soc. Sci. 2021, 3, 319–338. [Google Scholar] [CrossRef]
- Mittal, V.; Han, K.; Frennea, C.; Blut, M.; Shaik, M.; Bosukonda, N.; Sridhar, S. Customer satisfaction, loyalty behaviors, and firm financial performance: What 40 years of research tells us. Mark. Lett. 2023, 34, 171–187. [Google Scholar] [CrossRef]
- Williams, P.; Naumann, E. Customer satisfaction and business performance: A firm-level analysis. J. Serv. Mark. 2011, 25, 20–32. [Google Scholar] [CrossRef]
- Nilashi, M.; Abumalloh, R.A.; Alghamdi, A.; Minaei-Bidgoli, B.; Alsulami, A.; Thanoon, M.; Asadi, S.; Samad, S. What is the impact of service quality on customers’ satisfaction during COVID-19 outbreak? New findings from online reviews analysis. Telemat. Inform. 2021, 64, 101693. [Google Scholar] [CrossRef]
- Ittner, C.D.; Larcker, D.F. Are nonfinancial measures leading indicators of financial performance? An analysis of customer satisfaction. J. Account. Res. 1998, 36, 1–35. [Google Scholar] [CrossRef]
- Banker, R.; Potter, C.; Srinivasan, D. An empirical investigation of an incentive plan that includes nonfinancial performance measures. Account. Rev. 2000, 75, 65–92. [Google Scholar] [CrossRef]
- Carhart, M. On persistence in mutual fund performance. J. Financ. 1997, 52, 57–82. [Google Scholar] [CrossRef]
- Fama, E.F.; French, K.R. Multifactor explanations of asset pricing anomalies. J. Financ. 1996, 51, 55–84. [Google Scholar] [CrossRef]
- Fama, E.F.; French, K.R. Forecasting profitability and earnings. J. Bus. 2000, 73, 161–175. [Google Scholar] [CrossRef]
- Penman, S. Return to fundamentals. J. Account. Audit. Financ. 1992, 7, 465–483. [Google Scholar] [CrossRef]
- McAlister, L.; Srinivasan, R.; Kim, M.C. Advertising, research and development, and systematic risk of the firm. J. Mark. 2007, 71, 35–48. [Google Scholar] [CrossRef]
- Kaplan, R.; Norton, D. The balanced scorecard-measures that drive performance. Harv. Bus. Rev. 1992, 70, 71–79. [Google Scholar] [PubMed]
- Kaplan, R.; Norton, D. The Balanced Scorecard: Translating Strategy into Action; Harvard Business School Press: Boston, MA, USA, 1996; pp. 1–330. [Google Scholar]
- Ittner, C.D.; Larcker, D.F.; Rajan, M. The choice of performance measures in annual bonus contracts. Account. Rev. 1997, 72, 231–255. [Google Scholar]
- Ittner, C.D.; Larcker, D.F.; Randall, T. Performance implications of strategic performance measurement in financial services firms. Account. Organ. Soc. 2003, 28, 715–741. [Google Scholar] [CrossRef]
- Yang, Y. The value-relevance of nonfinancial information: The biotechnology industry. Adv. Account. 2008, 23, 287–314. [Google Scholar] [CrossRef]
- Ittner, C.D.; Larcker, D.F.; Taylor, D. Commentary: The stock market’s pricing of customer satisfaction. Mark. Sci. 2009, 28, 826–835. [Google Scholar] [CrossRef]
- Jacobson, R.; Mizik, N. The financial markets and customer satisfaction: Reexaming possible financial market mispricing of customer satisfaction. Mark. Sci. 2009, 28, 810–819. [Google Scholar] [CrossRef]
- Leoni, V.; Moretti, A. Customer satisfaction during COVID-19 phases: The case of the Venetian hospitality system. Curr. Issues Tour. 2024, 27, 396–412. [Google Scholar] [CrossRef]
- Das, S.S.; Tiwari, A.K. Understanding international and domestic travel intention of Indian travellers during COVID-19 using a Bayesian approach. Tour. Recreat. Res. 2020, 46, 228–244. [Google Scholar] [CrossRef]
- Mehta, M.P.; Kumar, G.; Ramkumar, M. Customer expectations in the hotel industry during the COVID-19 pandemic: A global perspective using sentiment analysis. Tour. Recreat. Res. 2021, 48, 110–127. [Google Scholar] [CrossRef]
- Padma, P.; Ahn, J. Guest satisfaction & dissatisfaction in luxury hotels: An application of big data. Int. J. Hosp. Manag. 2020, 84, 102318. [Google Scholar]
- Srivastava, A.; Kumar, V. Hotel attributes and overall customer satisfaction: What did COVID-19 change? Tour. Manag. Perspect. 2021, 40, 100867. [Google Scholar] [CrossRef] [PubMed]
- Davras, Ö.; Caber, M. Analysis of hotel services by their symmetric and asymmetric effects on overall customer satisfaction: A comparison of market segments. Int. J. Hosp. Manag. 2019, 81, 83–93. [Google Scholar] [CrossRef]
- Mittal, V.; Frennea, C. Customer Satisfaction: A Strategic Review and Guidelines for Managers; MSI Fast Forward Series; Marketing Science Institute: Cambridge, MA, USA, 2010; Available online: https://www.semanticscholar.org/paper/Customer-Satisfaction%3A-A-Strategic-Review-and-for-Mittal-Frennea/8b058135d1e47a88e0272fe57e8f86d2faa7bb39 (accessed on 1 April 2024).
- Kumar, V. Introduction: Is customer satisfaction (ir)relevant as a metric? J. Mark. 2016, 80, 108–109. [Google Scholar] [CrossRef]
- Anderson, E.W.; Fornell, S.; Mazvancheryl, S.K. Customer satisfaction and shareholder value. J. Mark. 2004, 68, 172–185. [Google Scholar] [CrossRef]
- Vitanova, I. Nurturing overconfidence: The relationship between leader power, overconfidence and firm performance. Leadersh. Q. 2021, 32, 101342. [Google Scholar] [CrossRef]
- Fornell, C.; Mathas, S.; Morgenson III, F.V.; Krishnan, M.S. Customer satisfaction and stock prices: High returns, low risk. J. Mark. 2006, 70, 3–14. [Google Scholar] [CrossRef]
- Tuli, K.R.; Bharadwaj, S.G. Customer satisfaction and stock returns risk. J. Mark. 2009, 73, 184–197. [Google Scholar] [CrossRef]
- Ferreira, D.C.; Soaresb, R.; Pedroc, M.I.; Marquesa, R.C. Customer satisfaction in the presence of imperfect knowledge of data. Int. Trans. Oper. Res. 2023, 30, 1505–1536. [Google Scholar] [CrossRef]
- Vieiraa, I.; Ferreira, D.; Pedro, M.I. The satisfaction of healthcare consumers: Analysis and comparison of different methodologies. Int. Trans. Oper. Res. 2023, 30, 545–571. [Google Scholar] [CrossRef]
- Amir, E.; Lev, B. Value-relevance of nonfinancial information: The wireless communications industry. J. Acct. Econ. 1996, 22, 3–30. [Google Scholar] [CrossRef]
- Sun, K.; Kim, D. Does customer satisfaction increase firm performance? An application of American Customer Satisfaction Index (ACSI). Int. J. Hosp. Mgmt. 2013, 35, 68–77. [Google Scholar] [CrossRef]
- Agag, G.; Durrani, B.A.; Shehawy, Y.M.; Alharthi, M.; Alamoudi, H.; El-Halaby, S.; Hassanein, A.; Abdelmoety, Z.H. Understanding the link between customer feedback metrics and firm performance. J. Retail Consum Servic. 2023, 73, 103301. [Google Scholar] [CrossRef]
- Malarvizhi, C.a.N.; Mamun, A.A.; Jayashreem, S.; Naznen, F.; Abir, T. Modelling the significance of social media marketing activities, brand equity and loyalty to predict consumers’ willingness to pay premium price for portable tech gadgets. Heliyon 2022, 8, e10145. [Google Scholar] [CrossRef]
- Chih-Ming, T.; Shih-Peng, H. The Influence of Influencer Marketing on the Consumers’ Desire to Travel in the Post-Pandemic Era: The Mediation Effect of Influencer Fitness of Destination. Sustainability 2023, 15, 14746. [Google Scholar] [CrossRef]
- Górska-Warsewicz, H. Factors determining city brand equity-A systematic literature review. Sustainability 2020, 12, 7858. [Google Scholar] [CrossRef]
- Ferreira, D.C.; Marques, R.C.; Nunes, A.M.; Figueira, J.R. Patients’ satisfaction: The medical appointments valence in Portuguese public hospitals. Omega 2018, 80, 58–76. [Google Scholar] [CrossRef]
- Ferreira, D.C.; Marques, R.C.; Nunes, A.M.; Figueira, J.R. Customers satisfaction in pediatric inpatient services: A multiple criteria satisfaction analysis. Socio-Econ. Plan. Sci. 2021, 78, 101036. [Google Scholar] [CrossRef]
- Kothari, S.P.; Zimmerman, J.L. Price and return models. J. Account. Econ. 1995, 20, 155–192. [Google Scholar] [CrossRef]
- Wu, C.H.-J. The impact of customer-to-customer interaction and customer homogeneity on customer satisfaction in tourism service-the service encounter prospective. Tour. Manag. 2007, 28, 1518–1528. [Google Scholar] [CrossRef]
- White, H. A heteroscedasticity-consistent covariance matrix estimator and a direct test for heteroscedasticity. Econometrica 1980, 48, 817–838. [Google Scholar] [CrossRef]
- Gow, I.; Ormazabal, G.; Taylor, D. Correcting for cross-sectional and time-series dependence in accounting research. Account. Rev. 2010, 85, 483–512. [Google Scholar] [CrossRef]
- Sullivan, R.; Timmermann, A.; White, H. Data-snooping, technical trading rule performance, and the bootstrap. J. Financ. 1999, 54, 1647–1691. [Google Scholar] [CrossRef]
- Greene, W.H. Econometric Analysis, 3rd ed.; Prentice-Hall: Upper Saddle River, NJ, USA, 1997. [Google Scholar]
- Blume, M.E.; Stambaugh, R.F. Biases in computed returns: An application to the size effect. J. Financ. Econ. 1983, 12, 387–404. [Google Scholar] [CrossRef]
- Brav, A.; Geczy, C.; Gompers, P.A. Is the abnormal return following equity issuances anomalous? J. Financ. Econ. 2000, 56, 209–249. [Google Scholar] [CrossRef]
- Peco-Torres, F.; Polo-Peña, A.I.; Frías Jamilena, D.M. Antecedents and consequences of strategic online-reputation management: Moderating effect of online tools. J. Hosp. Tour. Technol. 2023, 14, 384–400. [Google Scholar] [CrossRef]
- Kubler, R.V.; Seggie, S.H. The impact of COVID-19 on how core and peripheral service satisfaction impacts customer satisfaction. J. Bus. Res. 2024, 182, 114784. [Google Scholar] [CrossRef]
- Andaleeb, S.S.; Conway, C. Customer satisfaction in the restaurant industry: An examination of the transaction-specific model. J. Serv. Mark. 2009, 20, 311. [Google Scholar] [CrossRef]
- Arora, R.; Singer, J. Customer satisfaction and value as drivers of business success for fine dining restaurants. Serv. Mark. Q. 2006, 28, 89–102. [Google Scholar] [CrossRef]

Disclaimer/Publisher’s Note: The statements, opinions and data contained in all publications are solely those of the individual author(s) and contributor(s) and not of MDPI and/or the editor(s). MDPI and/or the editor(s) disclaim responsibility for any injury to people or property resulting from any ideas, methods, instructions or products referred to in the content. |
© 2024 by the authors. Licensee MDPI, Basel, Switzerland. This article is an open access article distributed under the terms and conditions of the Creative Commons Attribution (CC BY) license (https://creativecommons.org/licenses/by/4.0/).