Abstract
Access to clean and safe water is essential to sustain human life. With the growth of the world population, the demand for clean water is also increasing. Water Treatment Plants (WTPs) are among the highest electricity consumers, thus causing damage to the environment and human health by producing solid waste and sludge as by-products, along with air pollution and noise. With the fourth highest population in the world, Indonesia faces a high demand for clean water. The country has pledged to reach net zero by 2060 or sooner, requiring effort in all sectors of the economy. Taiwan is relatively small compared to Indonesia but has a higher average clean water supply per capita than Indonesia. This study assessed and compared the Carbon Footprint (CF) emitted from four WTPs in Indonesia and Taiwan. A Life Cycle Assessment (LCA) was used, employing a cradle to gate as the methodology. The results showed that the Indonesian WTPs emit more CF than the Taiwanese ones. Electricity consumption from the intake operation and screening process mainly contributes to the CF in most of the studied WTPs. While chemical usage is related to the amount of treated water and the water quality regulations, their consumption has more impact on ecosystem services in Taiwan. Using both renewable energy and good chemical management will be a better solution to lessen the environmental impact of all of these WTPs.
1. Introduction and Literature Review
1.1. Background
Ensuring clean water access, sanitation, hygiene, and sustainable water resources are the leitmotivs of Sustainable Development Goal 6. The 2010 United Nations (UN) General Assembly identified clean and safe water as a fundamental human right. As the world population increases, estimated at 7.79 billion people in 2020 [1], the demand for clean water and sanitation services increases. Most of this population expansion is predicted to occur in emerging nations at the bottom of the pyramid (BoP) [2]. Water resources are becoming scarce; their availability in many countries and cities is already compromised, and several methods and technologies are being implemented to enhance their availability for as long as possible [1]. Indonesia is the world’s fourth most populated country and has the largest economy in Southeast Asia. However, 24 million Indonesians still do not have access to safe drinking water [3]. Worldwide, more than two billion people still do not have access to proper sanitary facilities [4]. In Indonesia, the drinking water facility company named Perusahaan Daerah Air Minum (PDAM) is the principal supplier of clean water with a production capacity of 153,881 L/s, which meets around 19–20% of the country’s basic needs [5]. In Taiwan, water demand is managed by the government’s water resource agency (MOEA), which cooperates with the Taiwan Water Company (TWC). According to the TWC statistical book published in 2020, the total water consumption in Taiwan mostly comes from agriculture, industrial, and domestic sectors. In 2021, Taiwan suffered from severe drought, which is a direct outcome of extreme weather and climate change. There is a growing demand for access to clean water and proper sanitary services affecting the capacity for clean water treatment, therefore increasing energy consumption and chemical product usage in the water treatment plants (WTPs). According to the 2013 United States Environmental Protection Agency report (US EPA), water and wastewater treatment plants are major sources of greenhouse gas (GHG) emissions within communities, due to their high energy consumption. The energy consumed exacerbates climate change; this is addressed by SDG13 and underlies the interconnectedness of the SDGs. The energy sector produces the most GHG emissions of any industry, thus prompting worries about the effects of increasing non-renewable resource usage and spurring the search for renewable energy sources, even for WTPs [6]. Carbon Footprint (CF) is a standard environmental burden measurement tool. To evaluate a product’s effects on the environment over the entire period of its life, the life cycle assessment (LCA) method is considered a guiding tool. In LCA studies, ISO 14067 establishes the concepts, regulations, and recommendations for calculating and reporting a product’s CF. The 2015 Paris Agreement was adopted by several nations, including Indonesia and Taiwan, who pledged to reduce their emissions and achieve net-zero emissions shortly. Many efforts are therefore required from all sectors, including water and sanitation services, to achieve this target. Modern technologies in water treatment play a vital role in serving good-quality consumable water [7]. Still, they also emit many greenhouse gases (GHG) due to their energy consumption. Therefore, research about the environmental sustainability of these WTPs should be conducted more intensively. Numerous studies have been conducted on the carbon emissions of water supply systems, but limited research on the CF of WTPs has been undertaken using an LCA in Indonesia. This research is a comparative case study of four WTPs in Surabaya, Indonesia, and Taipei, Taiwan. We aim to compute and compare the CF emitted by these four WTPs of developed and developing regions. The results of this study will highlight the differences among these four WTPs in terms of their CF emissions and the technologies employed during the process of clean water production. The results of the CF analysis will serve as a critical point for recommendations to improve the environmental performance of these WTPs, especially for Indonesia.
1.2. Water Treatment Process and Supply System
Although the Earth has more water than land, water scarcity remains a problem worldwide. Clean water availability is becoming a significant issue in many areas, especially in low-income countries with constrained resources, which are known as “base of the pyramid” countries. Rapid population growth, drought, groundwater contamination, surface water pollution, and more substantial usage of water-saving technologies influence clean water supply systems [8]. Water and air are the two essential fluids on which all life depends. While water requires more advanced technologies for purifying, nature purifies the air effectively with little human assistance, limiting CF emissions. Surface water and groundwater are being polluted by growing industrialization and modern farming activities. Almost every country is facing water issues. Freshwater pollution affects nearly half of the world’s population. Each year, about 250 million cases of water-related illnesses are caused by ingesting polluted water containing harmful bacteria, viruses, or parasites, leading to several deaths [9]. Approximately 4 billion people, or roughly two-thirds of the world’s population, face extreme water scarcity at least once a year [10]. As the world’s population increases rapidly, water is consumed more significantly for farming activities, industries, and home usage. Global water consumption has increased, owing to a mix of population expansion and socio-economic development. Global water use is expected to climb similarly through 2050, indicating a 20% to 30% increase over current levels [11]. Thus, water quality and sanitation services should be ensured to avoid a severe crisis shortly.
Potable water can be found in rivers, streams, lakes, and underground aquifers, but pollution of this water makes it unsafe for direct usage. Human activities, such as farming and industrialization, have polluted much of this water. To remove the pollutants, many techniques and technologies are necessary. Modern technologies in water treatment are barriers or lines of defense between consumers and waterborne illnesses. When these obstacles are applied as a series of treatment procedures, they are referred to as a treatment process train [12]. A water treatment facility eliminates odors, color, turbidity, bacteria with microbiological contaminants, chemical pollutants, and other pollutants from raw water. The turbidity of the raw water entering a treatment facility is often produced by colloidal clay and silt particles. Chemicals such as aluminum sulfate are added to the water to neutralize the particles electrically and make them “sticky”, allowing them to assemble and form large particles known as flocs. This process is known as coagulation and flocculation [13]. Coagulation is adding chemicals to make sedimentation and filtration easier for removing dissolved and total suspended particles.
Hydrolyzing metal salts, such as aluminum Al2(SO4)3·4H2O, ferric sulfate Fe2(SO4)3 ·9H2O, and ferric chloride FeCl3·6H2O, are the most frequently used main coagulants. Flocculation is a purely physical process that involves gently stirring treated water to stimulate interparticle collisions and thereby promote the creation of large particles, making them easier to remove from the water [12]. Many flocculation types exist, which either use a hydraulic method or mechanical devices. Hydraulic methods are primarily used in small plants, while mechanical flocculators have many range configurations [6]. Settling or sedimentation, also called clarification, removes settleable solids using gravity. This process typically happens after coagulation and flocculation, but before filtration, in a conventional treatment process. Settling refers to the descent of all forms of particles through the water due to gravity. Filtration removes the suspended particles, which is crucial for natural groundwater purification and for removing both naturally occurring and treatment-induced particulates in treatment plants [14]. Filtration is frequently regarded as the primary particle removal procedure for water treatment. Many filters are used for particle removal, which can be classified by several factors, including the dominant particle removal process, the filtration media and apparatus employed, and the hydraulic loading rate. Chlorination or disinfection is the last process for water treatment. It aims to reduce the presence of pathogenic microorganisms. Chlorine is the most commonly used substance for disinfection. It can destroy most biological contaminants through mechanisms such as breaking the cell wall, breaking through cell permeability, passing through the protoplasm, inhibiting cell enzyme activity, and inhibiting cell production [15].
1.3. Life Cycle Assessment and Carbon Footprint of Water Treatment Plants
The present study employs an LCA to compute and compares the CF emitted by four WTPs in Indonesia and Taiwan. The concept of an LCA is described as a holistic procedure studying how a product is developed from its “cradle”, when the product is extracted from its raw resources, through production and use, to its “grave”, where it is disposed of [16]. During the energy crisis of the early 1970s, an LCA was considered a valuable tool for analyzing environmental performance and improving the energy consumption of materials to lessen their ecological impact. Many tools, such as SimaPro, developed by the Dutch company PRé located in Amersfoort, in the Netherland Gabi, Umberto, and openLCA, are used to perform an LCA, and the results may vary according to the tools used [17]. The development of international standards for LCAs, from ISO 14040: 1997, ISO 14041: 1999, and ISO 14042: 2000, was a significant step towards standardizing LCA techniques and methods. Considering the ISO 14040 framework, LCA studies consist of four phases: goal and scope definition, inventory analysis, impact assessment, and interpretation [18]. In LCA research, the goal is to find the best product alternative with the least negative impact on human health and the environment. A life cycle inventory analysis entails compiling a list of flows from and to nature for a product system. In this study, the flow inputs include raw water abstraction and filtration, electricity, chemicals used, and the outputs include emissions to the air, land, and water. The Life Cycle Impact Assessment (LCIA) approach converts inventory data from an LCA into a list of possible consequences. Based on ISO 14044, the mandatory elements for conducting an LCA study include characterization, classification of LCIA results, and selection of impact categories [19].
Many authors have conducted various studies analyzing CF emissions from water supply systems in the LCA of clean water supply studies. For illustration, in 2022, Lakho et al. [20] in Belgium confirmed that Drinking Water Treatment Sludge (DWTS) had less potential for depletion, global warming, eutrophication, and ecotoxicity than their traditional equivalent methods. DWTS is a waste by-product from WTPs that commonly use rich iron salts as coagulants during water treatment. In Israel, Meron et al. [21] conducted a study using ReCiPe 2016 and found that annual water production fluctuates significantly due to the production of desalinated water in the supply mix and identified that, in the categories of terrestrial ecotoxicity and mineral resource scarcity, the infrastructure’s contribution to the impact scores is the most significant. Li et al. [22], in China, using Gabi 6.0 software in their study related to water supply systems analysis, realized that both acidification potential and global warming are major impact categories and the dominant factor is energy consumption. Bonoli et al. [23] analyzed the water footprint in Italy and discovered that fossil resource scarcity was the lowest, followed by global warming potential, in the LCA results. They suggested that manufacturing greywater recycling tanks and installing solar panels for electricity production could systematically improve the sustainability of the WTP. In Denmark, Godskesen et al. [24] proved that rainwater and stormwater harvesting have the lowest environmental effect in an LCA study, followed by groundwater abstraction choices. Conversely, they found that desalination significantly increases ecological impacts. Membrane filtration is an attractive technique for use in clean water production. However, this technique has a high energy demand and contributes to a significant amount of CF emission. Zijp MC and Van der Laan H. [25] confirmed that when wind energy is employed in place of the Dutch mixed power system, membrane filtration CF emissions can be offset, rendering its environmental impact comparable to that of the conventional clean water production technique. Ghimire et al. [26], in the USA, confirmed that the commercial rainwater harvest outperformed the municipal water supply systems, except for ozone depletion. In their system, the rainwater harvest system does not require pumping technology, which consumes much energy, and thereby lowers the CF emissions. In Singapore, Hsien et al. [27] argued that purified recycled water has a higher impact in three of the eight categories studied than tap water, and the climate change impact of the direct emissions produced during the wastewater collection and water reclamation phases is substantial. According to the latest synthesis report from the UN Intergovernmental Panel on Climate Change (IPCC), human activities, through the emission of greenhouse gases, have unequivocally caused global warming, with global surface temperatures in 2011–2020 reaching 1.1 °C above those seen in 1800–1900. Global GHG emissions in 2030 are likely to cause these increases to exceed 1.5 °C, making it harder to limit the warming to below 2 °C (IPCC 2023 report page 10) [28]. This has reduced food security and affected water security, hindering efforts to meet the goals of sustainable development. Different protocols and agreements such as the Kyoto Protocol and the Paris Agreement should therefore be strengthened by all the nations. To date, several countries have acknowledged the need to shift to a more sustainable economy, and all sectors, including the water treatment sector, must contribute to the solution if governments are to keep their commitments. The assessment of GHG-emitting processes, along with their sources, composition, and quantity is known as a Carbon Footprint (CF) analysis. In general, CF refers to the number of emissions caused by a person’s or an organization’s activities. The terms “CF analysis” and “GHG inventory” are interchangeable. Based on the 2018 version of the ISO 14047 framework, a CF evaluation should include the four phases of an LCA. This impact assessment uses the 100-year global warming potential (GWP 100) as stated by IPCC.
2. Materials and Methods
2.1. Study Area
This study compares the CF emissions of four (4) WTPs named Karang Pilang II and III from Indonesia, as well as Changxing and Gongguan in Taipei, Taiwan. Indonesia and Taiwan were selected because they stand as good examples of developing and developed regions in Asia, respectively. Karang Pilang WTPs are located in Surabaya City. Surabaya City is located on Java Island, with a population of 2.97 million people in 2020; it covers an area of 326.36 km2 [29]. It is the capital city of East Java Province. Most areas are lowlands, with elevations up to three meters above sea level. Surya Sembada Water Company is a local company owned by the government that provides clean water and sanitation services to the community. This city has six WTPs with an average area of 29,613,244 m3 [30]. The raw water for these water treatment facilities is mainly from the Jagir River. The treatment technologies employed in this city vary based on the WTP. In the present study, among the six WTPs, Karang Pilang II and III have been considered. The Karang Pilang II WTP was built in 1996 with an initial capacity of 2000 L/s, reaching a capacity of 2750 L/s today. The operation units of the Karang Pilang II WTP include an intake and bar screen, surge well, aerator, pre-sedimentation, coagulator, clearator, filters and disinfector, and a reservoir and stand, representing the biggest WTP in this city. The most recent WTP is Karang Pilang III, which was established in 2009. It has a capacity of 2400 L/s and has the same operational units as Karang Pilang II.
Taipei City, located in northern Taiwan, had a population of 2.60 million as of the end of 2020 [31]. Clean water supply in Taipei is organized by the Taipei Water Department (TWD), which operates under the Taipei municipal government’s jurisdiction. Most of the water consumed in Taipei is sourced from the Xindian River. This river features two primary raw water intake units, the Qingtian Dam and the Zhitan Dam, which are integral to the city’s water supply infrastructure. The Qingtian Dam, which supplies raw water to the Changxing and Gongguan purification plants, has a daily capacity of 1.08 million m3 of raw water, while the Zhitan Dam, serving only the Zhitan water treatment plant, has a daily capacity of 2.70 million m3 of raw water [32]. Five water purification plants operate actively in Taipei: Changxing, Gongguan, Zhitan, Shuangxi, and Yangming. However, this study focuses on Changxing and Gongguan’s WTP carbon footprint assessment. Changxing and Gongguan WTPs have a daily capacity of 314,124.02 m3 and 237,186.91 m3, respectively [32]. The treatment processes are testing, applying chemical disinfectants, coagulation, mixing, sedimentation, and filtering. These two countries have different technologies regarding water treatment facilities, as highlighted in Table 1, and stand as good examples for a comparative study on developed and developing regions in Asia. In their treatment process, Karang Pilang WTPs do not have flocculation technology or a sedimentation tank, but the technology employed in Taipei includes these facilities. However, Karang Pilang WTPs in Indonesia possess a clarifier for removing solid particulates or suspended solids from the raw water, and the WTPs in Taipei, equipped with sludge treatment facilities, eliminate the need for this technology.

Table 1.
Operation units of different WTPs.
2.2. Goal and Scope, Functional Unit and System Boundary Definition
The primary goal of this LCA was to comparatively assess the environmental impact of the CF emitted by four WTPs in developed and developing regions in Asia during clean water production. This study involved a comprehensive secondary data analysis. Therefore, no primary experimental testing or laboratory preparations were conducted. This approach allowed us to determine the most sustainable WTPs and enabled broad comprehensive analysis that can contribute to policy discussions and guidance for future researchers and the respective water-dispatching administrations of Indonesia and Taiwan. The results of this study will serve as a valuable resource for enabling mutual learning, aiming at achieving a sustainable world as highlighted by SDG 17.6.
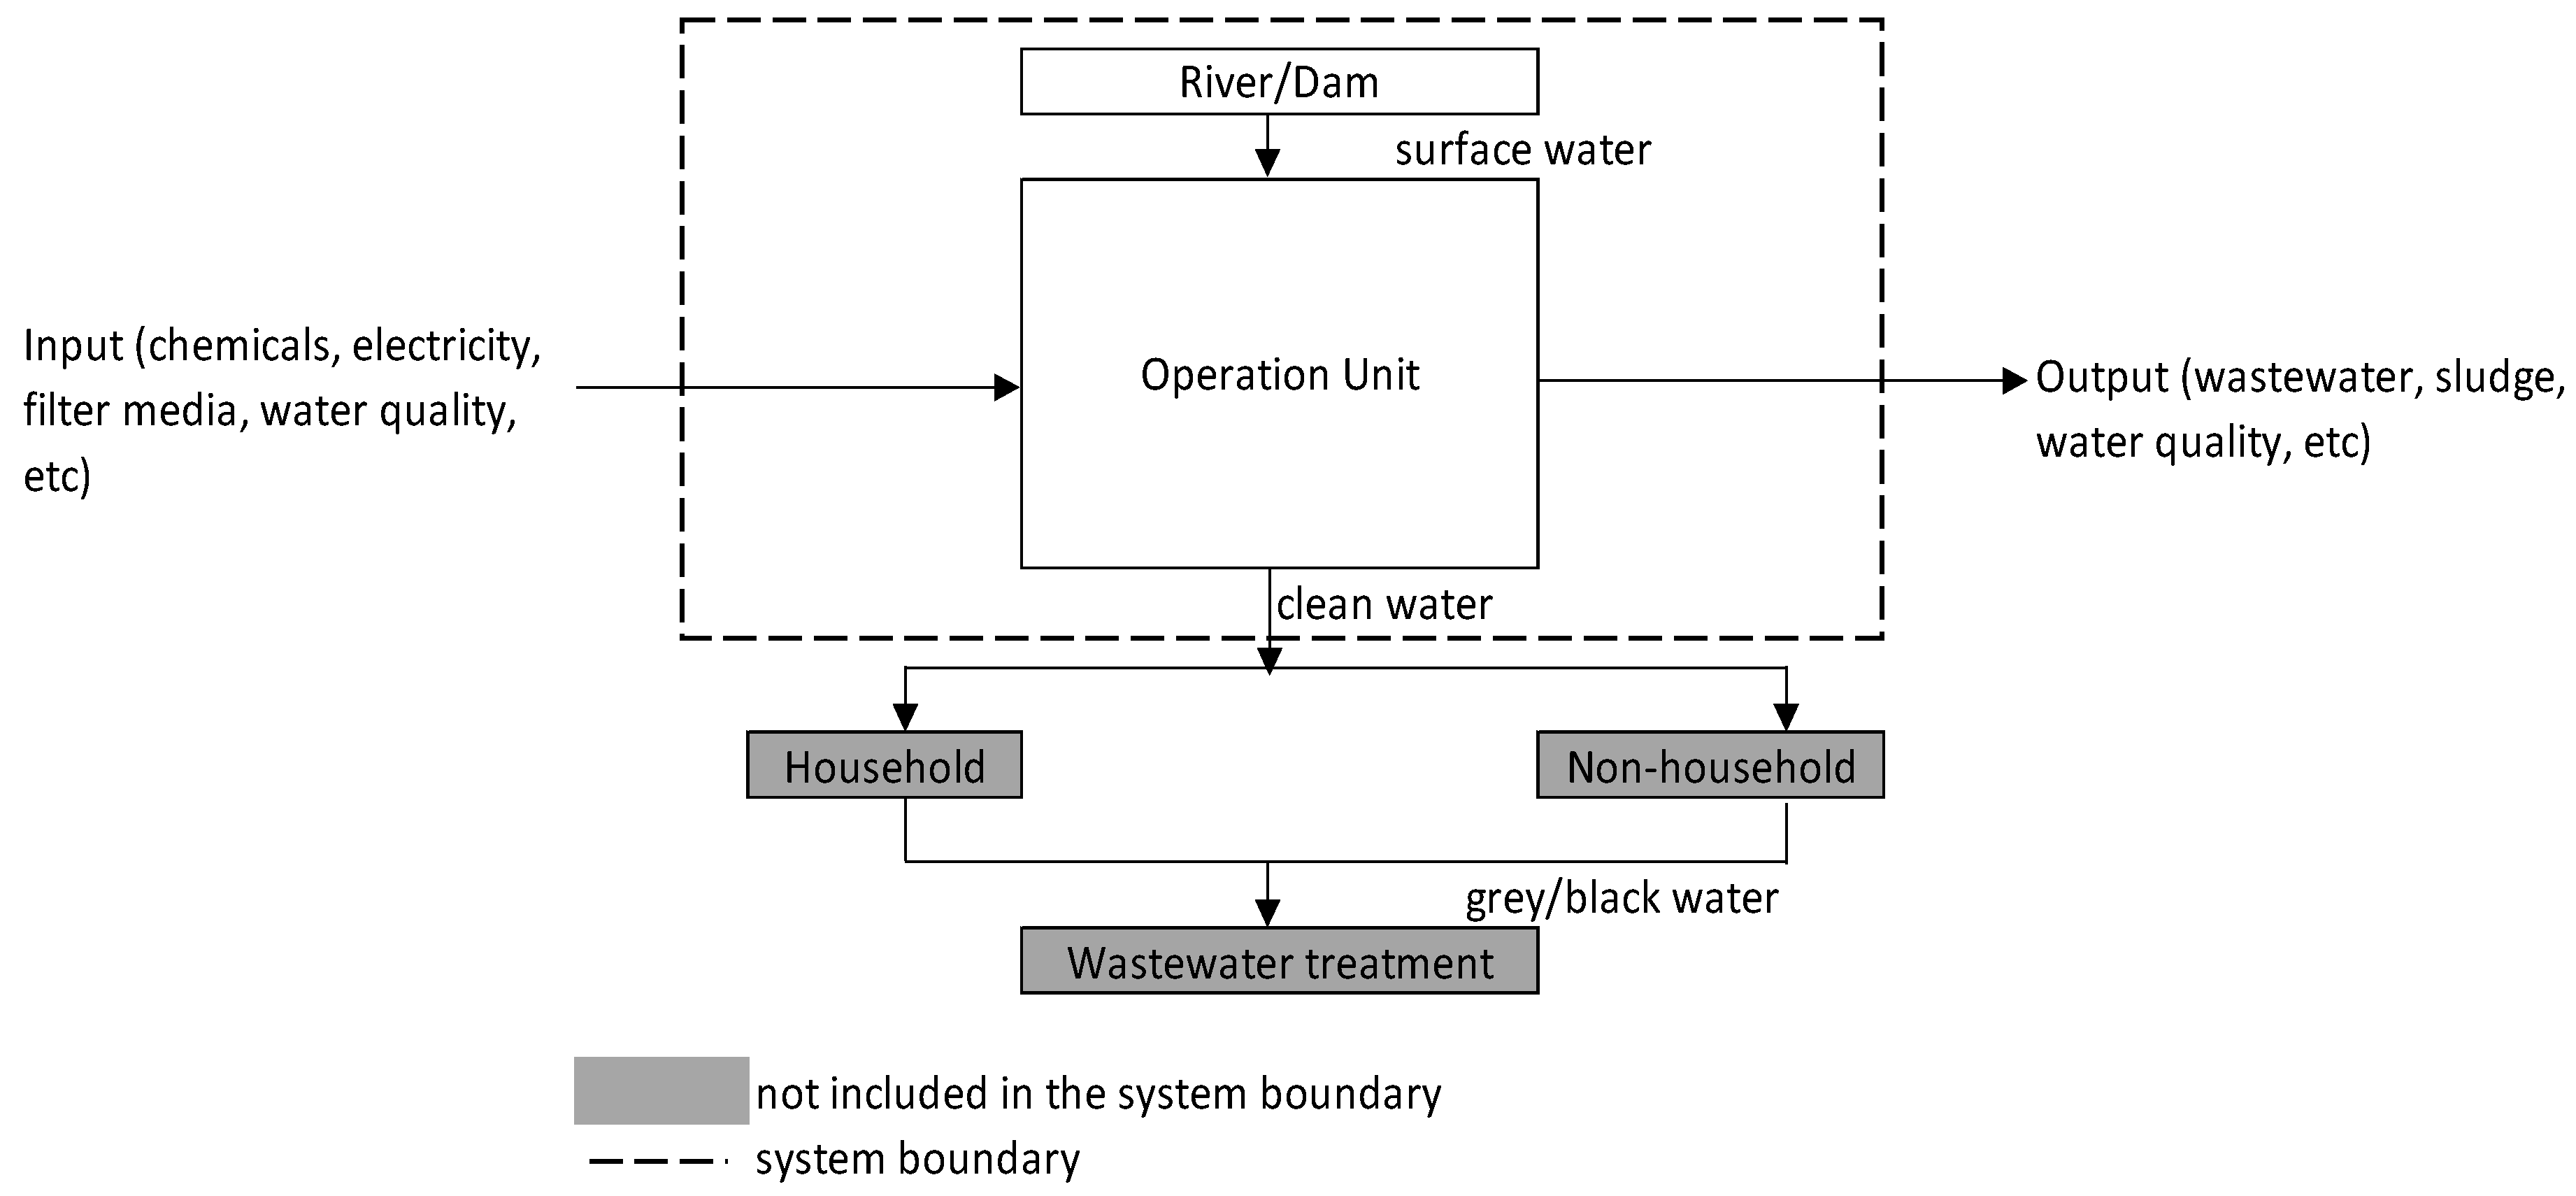
A functional unit (FU) of 1 m3 of clean water ready to be distributed through the network was chosen. Figure 1 illustrates the system boundary, implemented with a cradle-to-gate approach spanning from the raw water abstraction to the last step before clean water is distributed. All the inputs and outflows were normalized into the defined FU, enhancing the calculation of the impacts easily. ISO 14067 was used to quantify the carbon footprint, while ISO 14040 and ISO 14044 were employed as guidelines for the LCA method to calculate the CF in the study. The inventory data used were based on the operational year of 2020. This study did not include the sludge treatment process because some WTPs could not provide sludge treatment data. The main target of this study was to assess and compare the CF associated with the extraction of raw water, the chemicals used, and the treatment process, including the impact of the generated waste. While some factors could potentially impact the CF emission during water distribution, this study assumes that CF emissions are uniform, allowing us to exclude the distribution phase from the system boundary. Therefore, these omissions are set as the main limitations of this research.
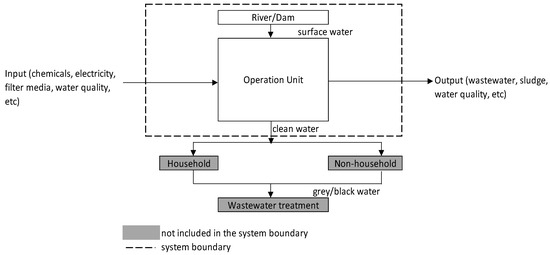
Figure 1.
Research system boundary.
2.3. Life Cycle Inventory Analysis and Impact Assessment
The Life Cycle Inventory (LCI), which is crucial for impact assessment, encompasses data collection, calculation methods, and validation. WTPs exhibit varying characteristics, such as differences in water volumes, electricity consumption, and technologies employed. The life cycle impact assessment translates emissions and resource extractions into a limited number of environmental impact scores through characterization. Characterization is derived from midpoint and endpoint levels. LCA began with raw water abstraction until clean water was ready for distribution (cradle-to-gate), as illustrated in Figure 1. The inventory consists of electricity, chemicals used, filters, energy consumption, amount of raw water treated, and waste generated. The data were collected from the companies’ inventories and annual Corporate Social Responsibility (CSR) books. The electricity coefficient for GHG emission characterization is based on 2020 data reflecting each country’s overall GHG emissions. Based on data from the National Energy Administration of Indonesia and Taiwan, the average GHG emissions coefficient used for electricity was 0.848 kg CO2eq/kWh for Indonesia and 0.574 kg CO2eq/kWh for Taiwan [33,34]. Detailed inventories for the analyzed WTPs are presented in Tables S2–S5 of the Supplementary Materials for Karang Pilang II, Karang Pilang III, Changxing, and Gongguan WTPs.
Data from the inventories were used to generate the environmental impacts of the four WTPs for the chosen impact categories. The data were aggregated based on the FU and at the LCI phase and then input into the impact assessment software, Simapro 9.0.0.33. This software was employed due to its capability to accommodate various environmental impact assessment methods [35]. In this research, the IPCC 2013 GWP 100a version 1.03 and ReCiPe 2016 midpoint endpoint version 1.03 were used as the impact assessment methods, and consisted of 18 midpoint impact categories and 3 endpoints categories that were fully covered.
2.4. Limitation of This Study
Based on the defined scope and system boundary, the following assumptions and limitations have been adopted:
- The system boundary includes raw water abstraction until the last step before clean water delivery to consumers.
- This study does not include the sludge treatment unit because some WTPs do not have sludge treatment facilities.
- Chemical transportation to the treatment plant is not included in our system boundary.
3. Results and Discussions
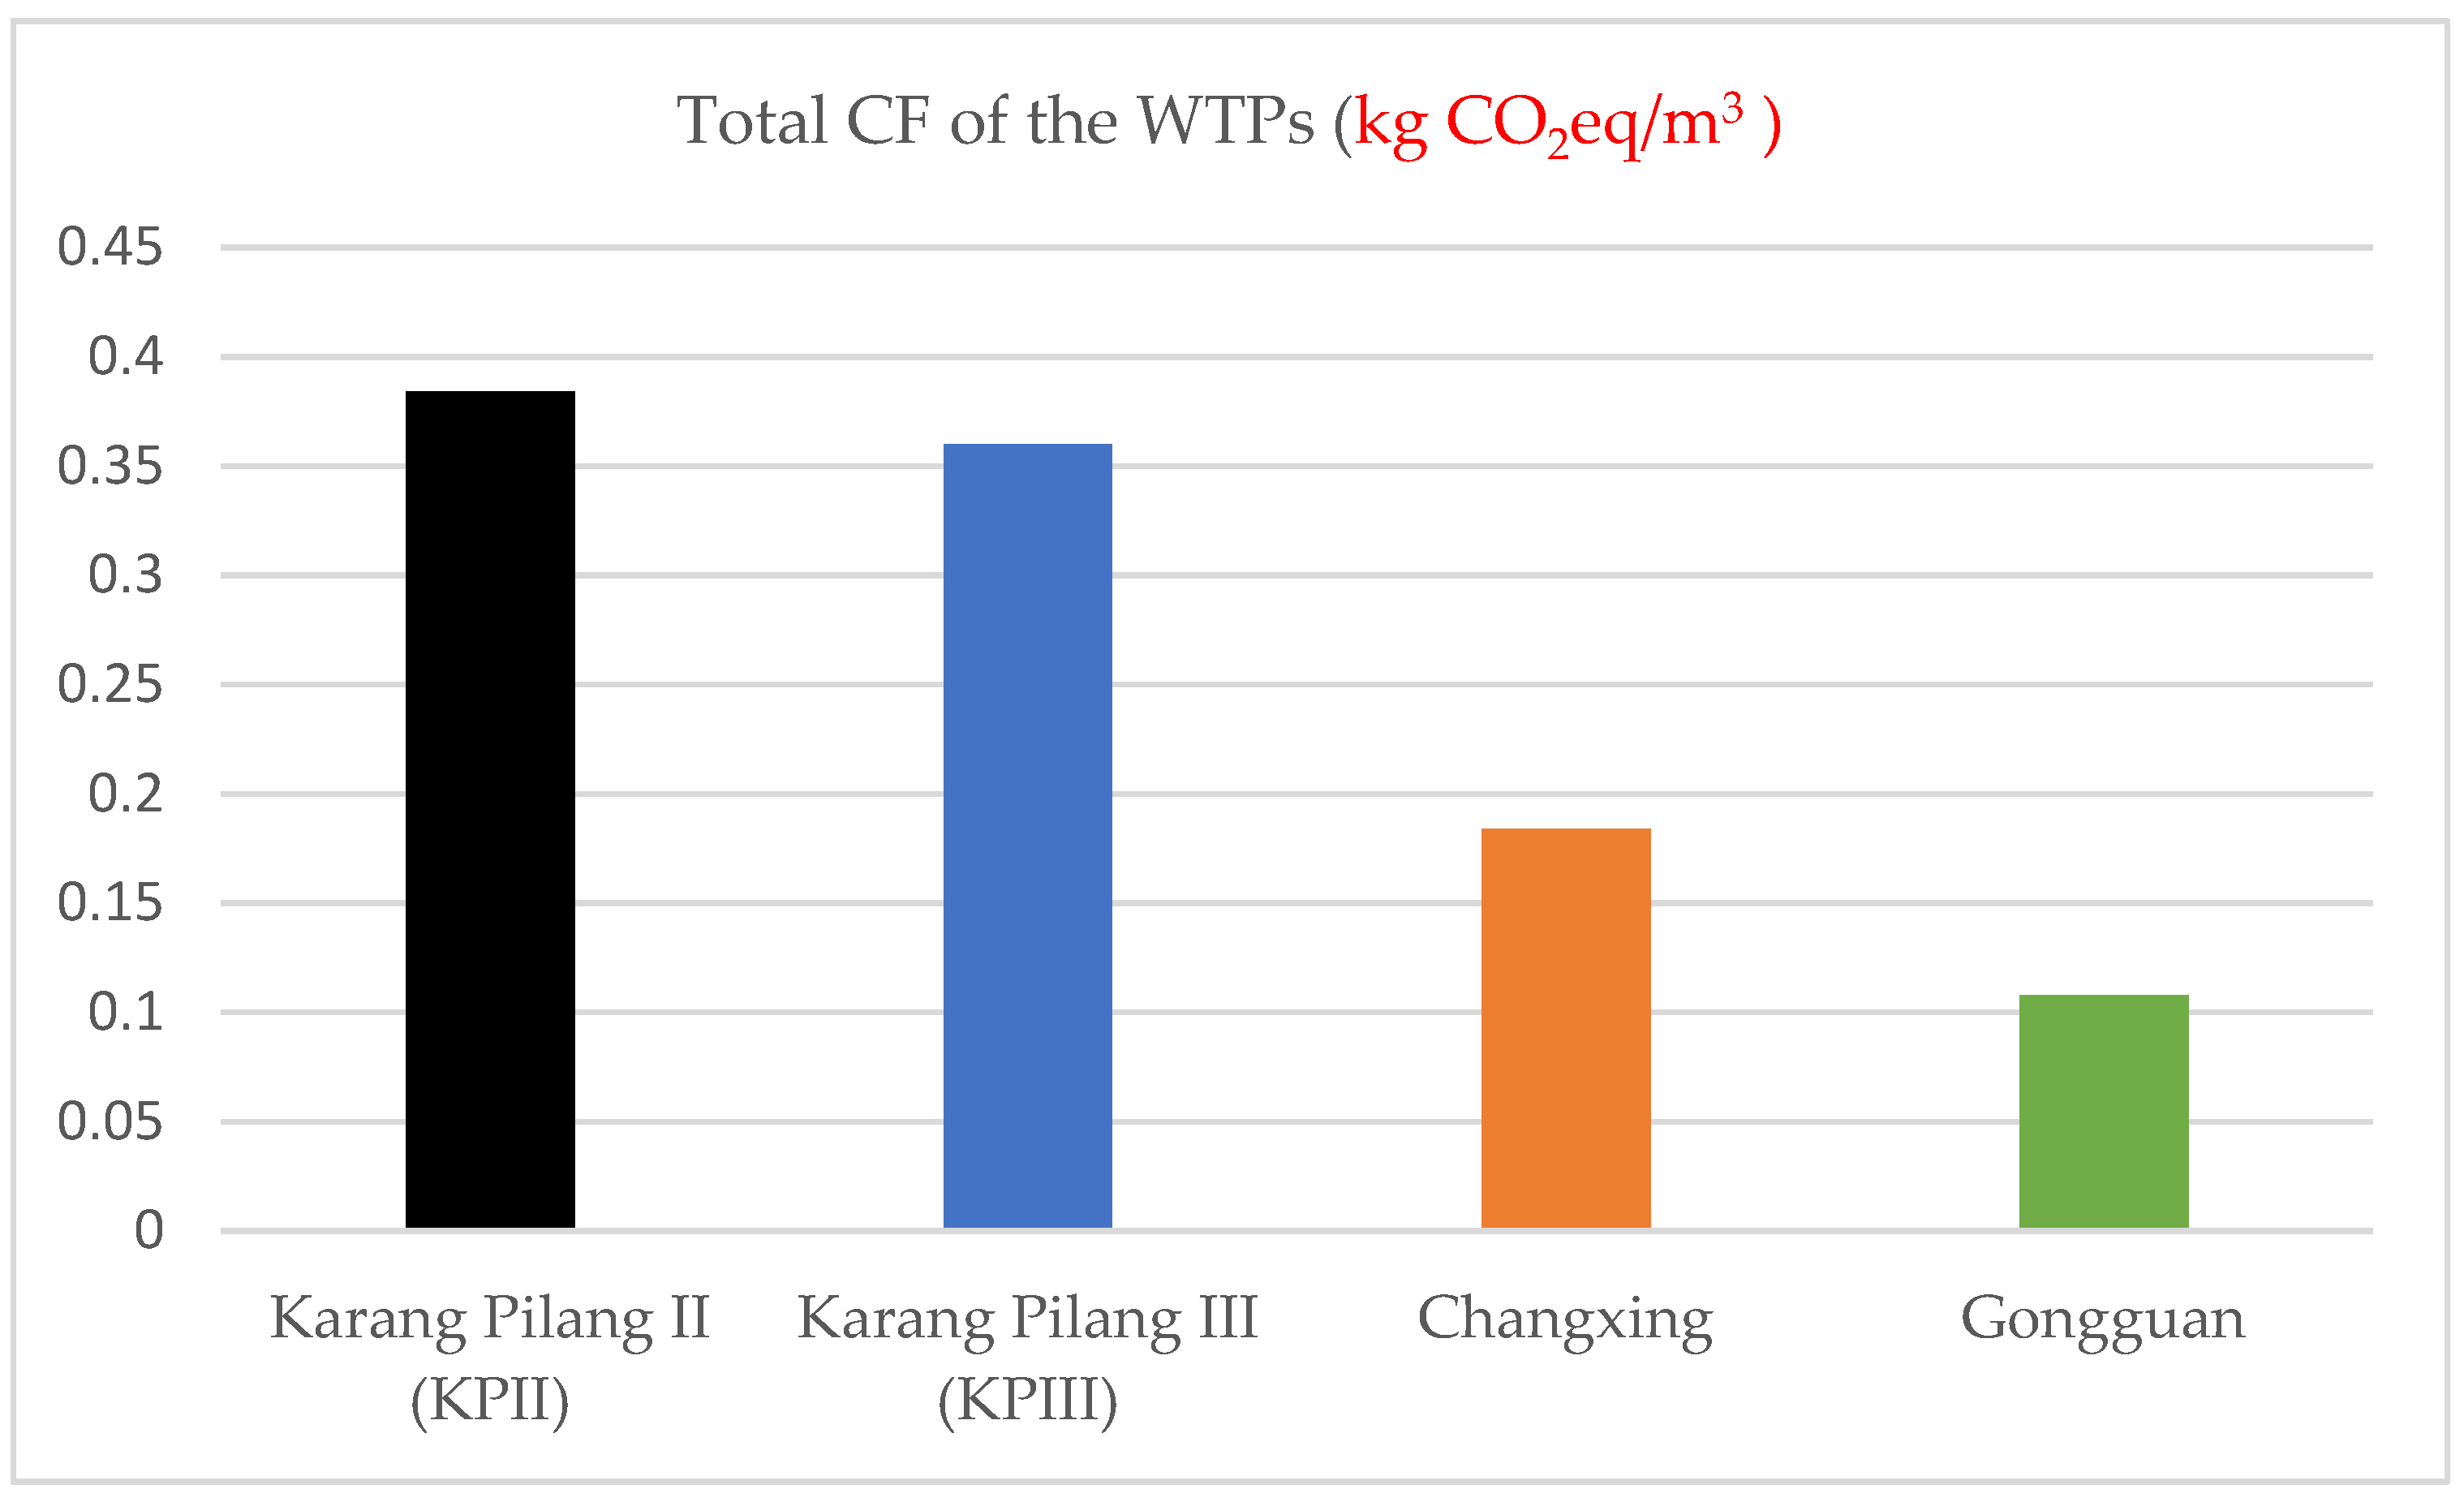
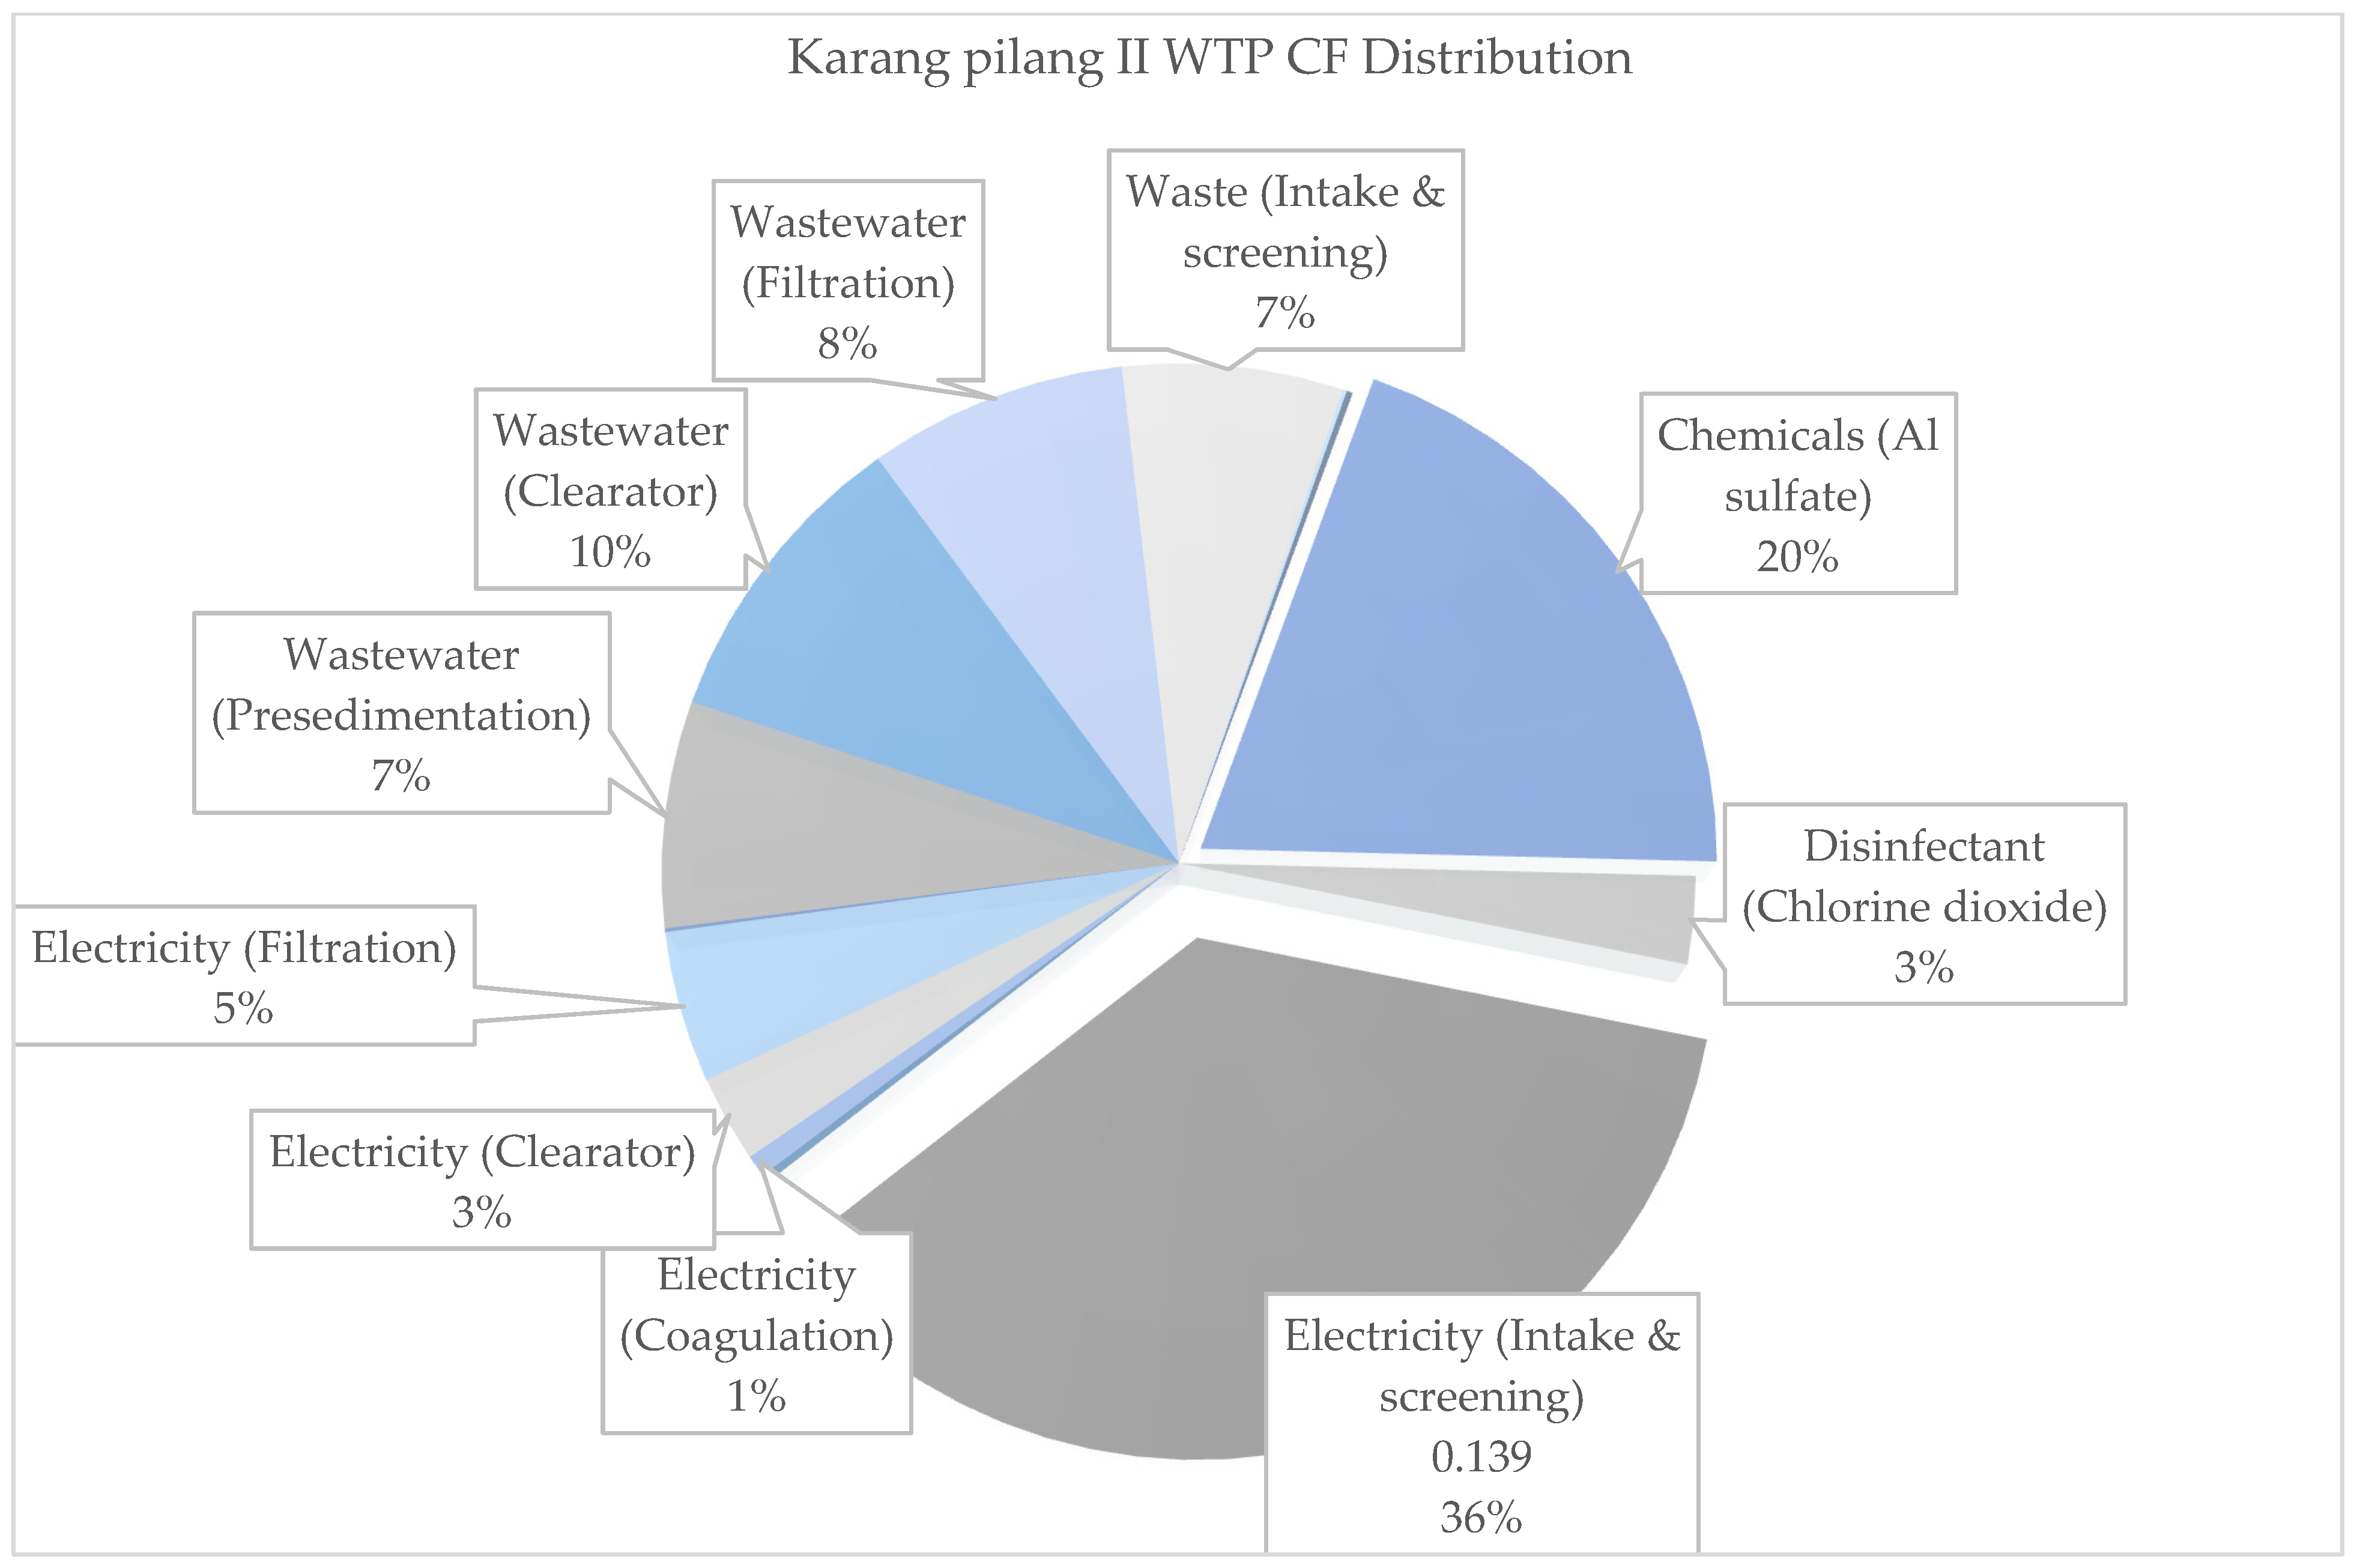
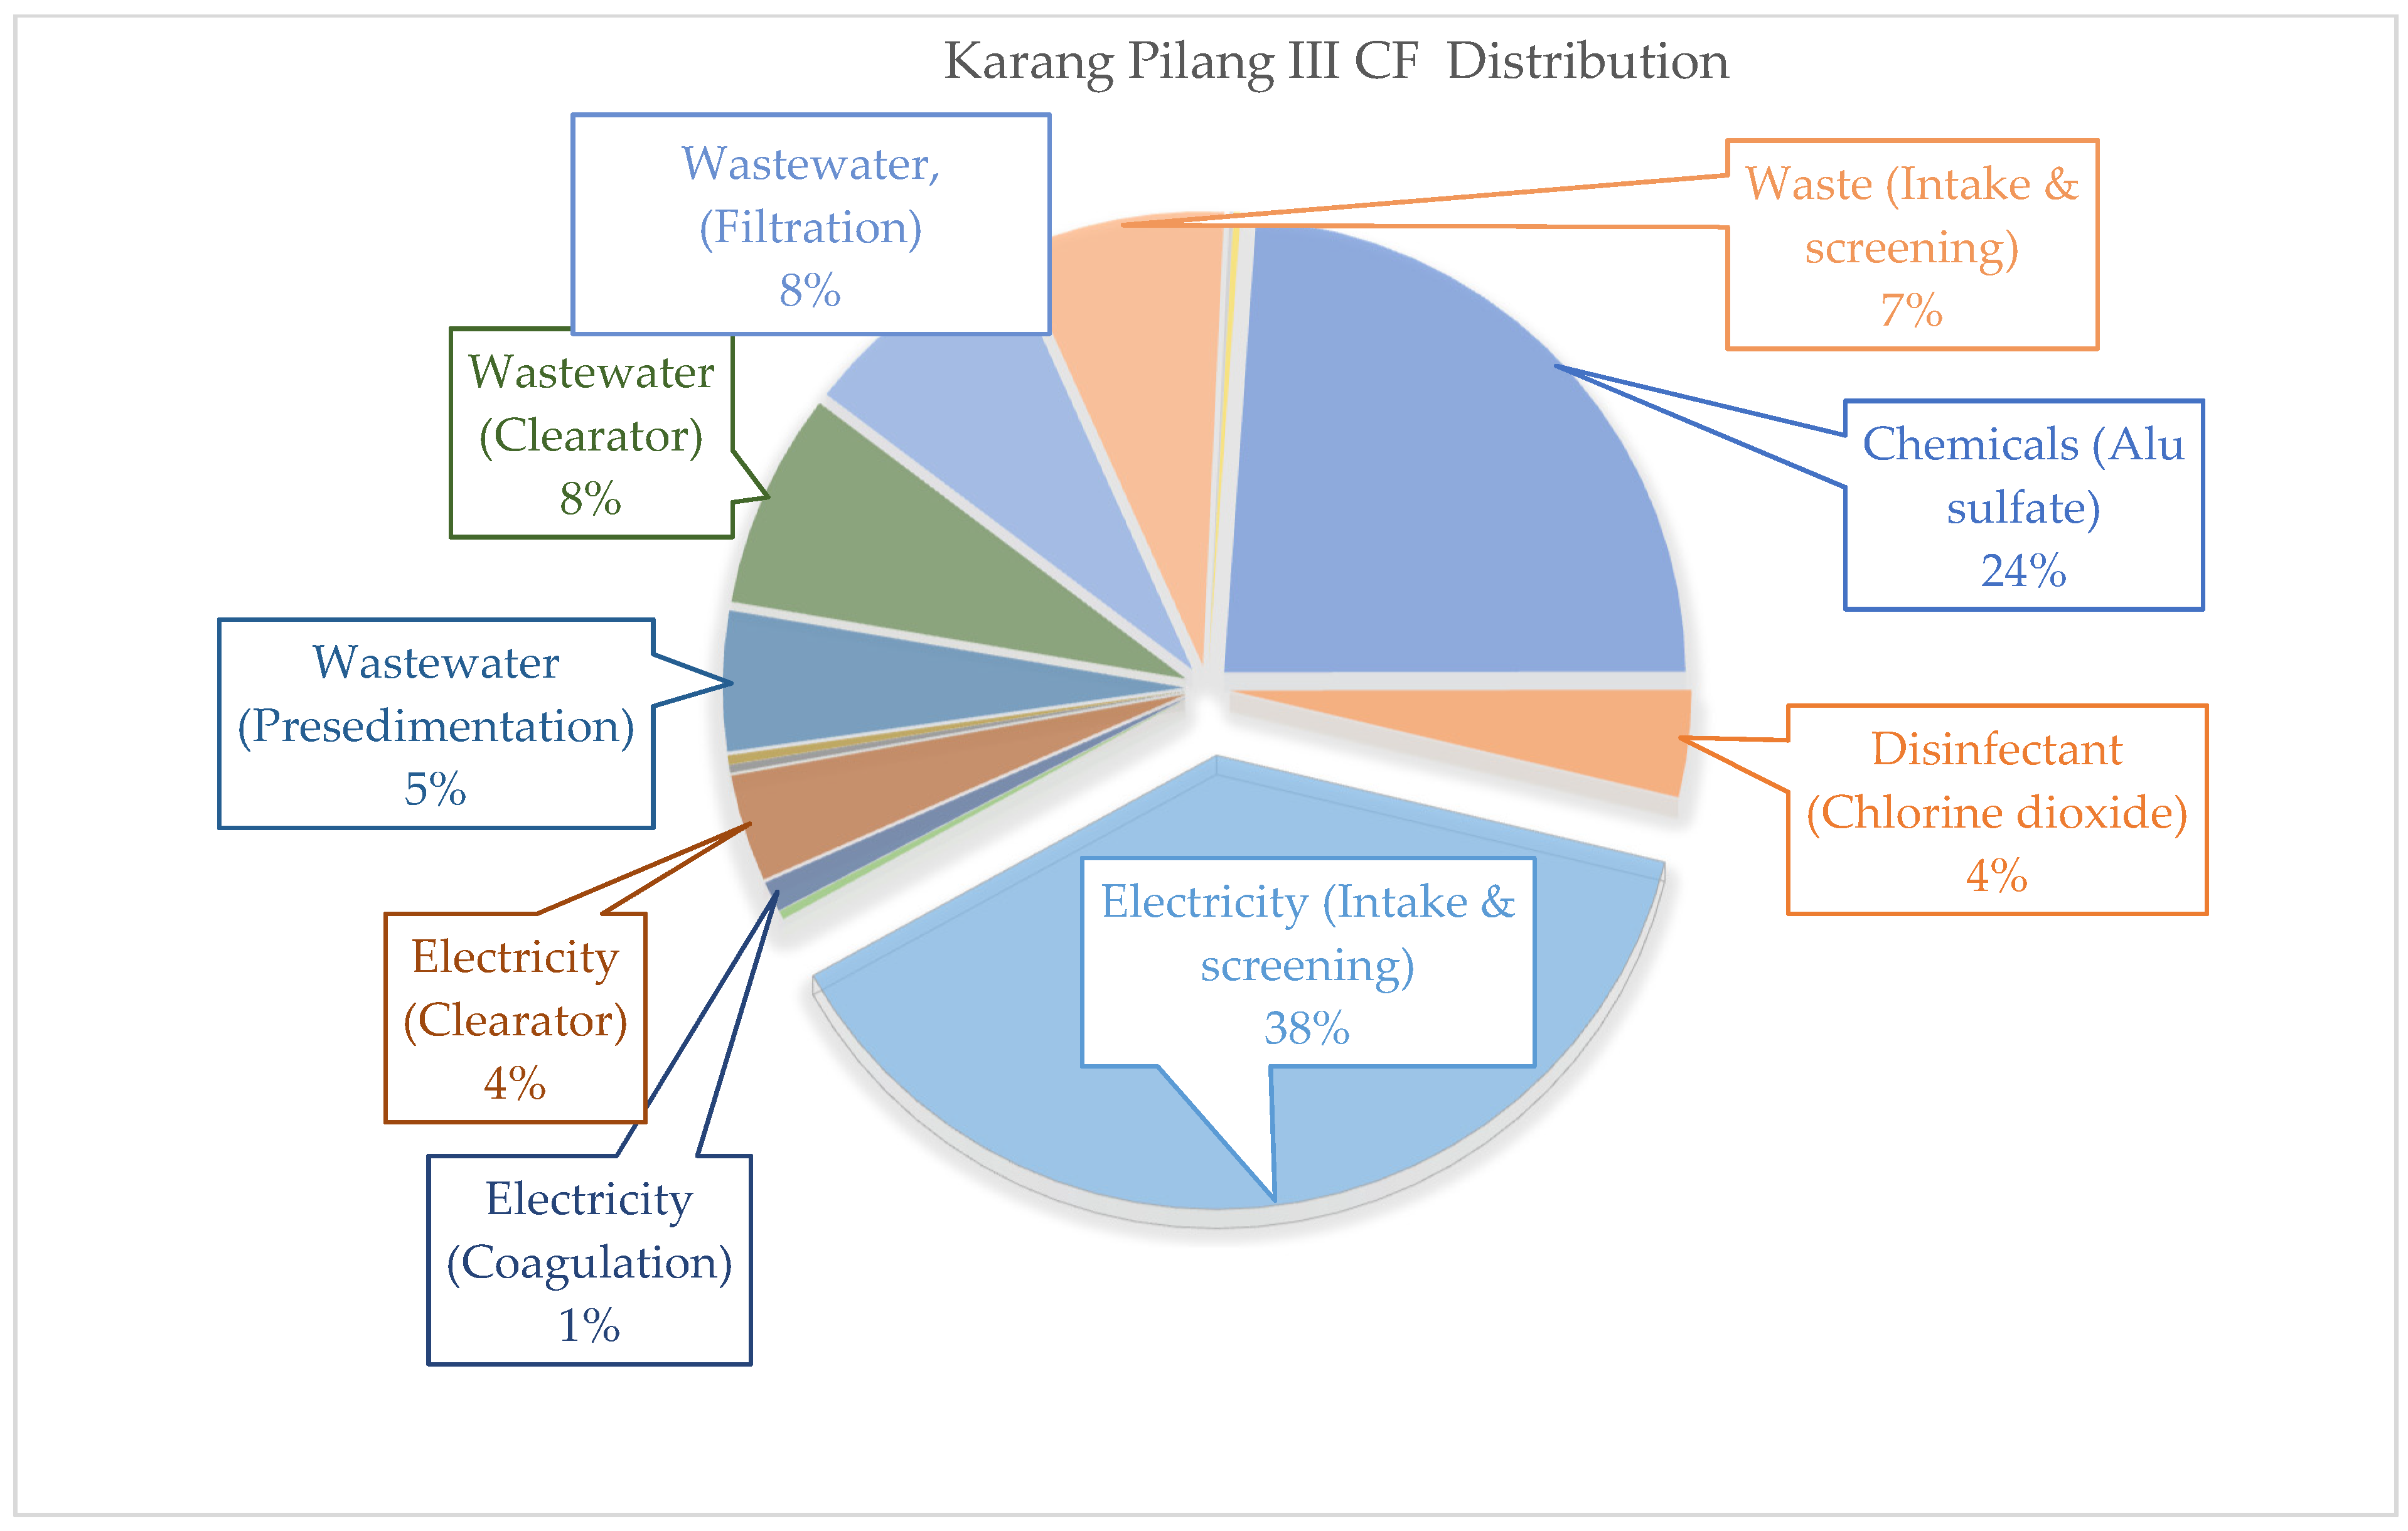
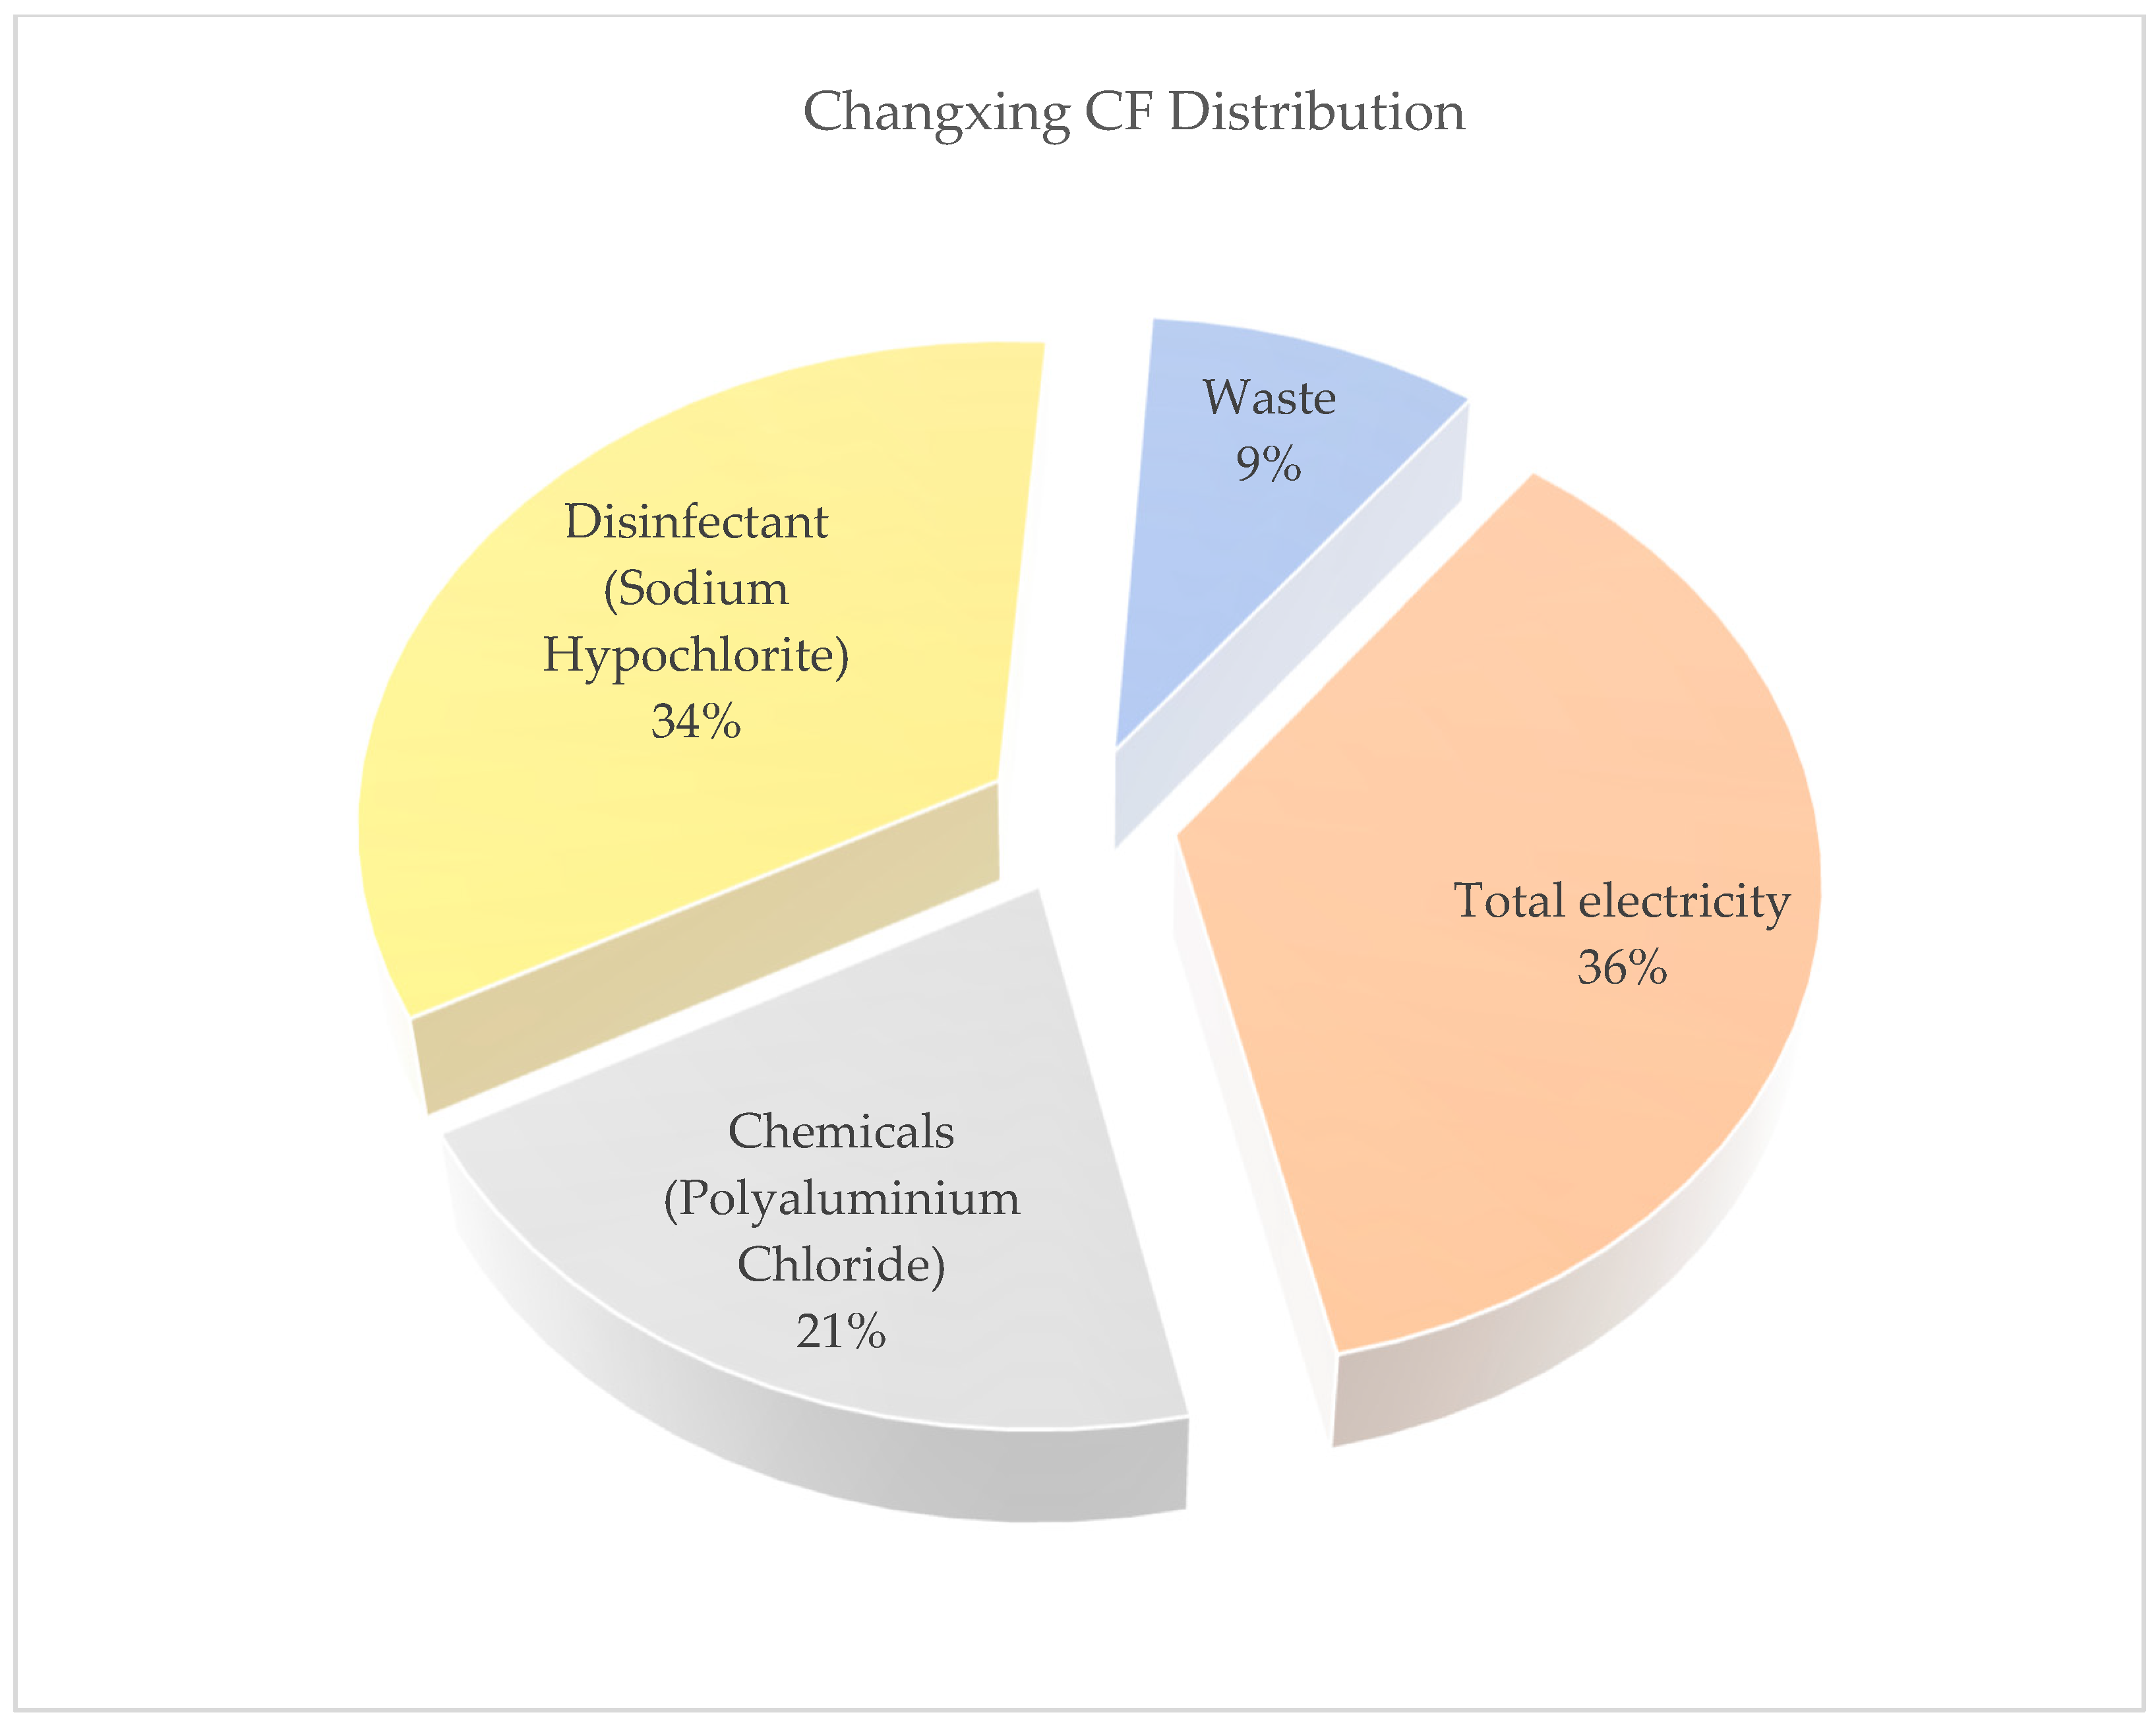
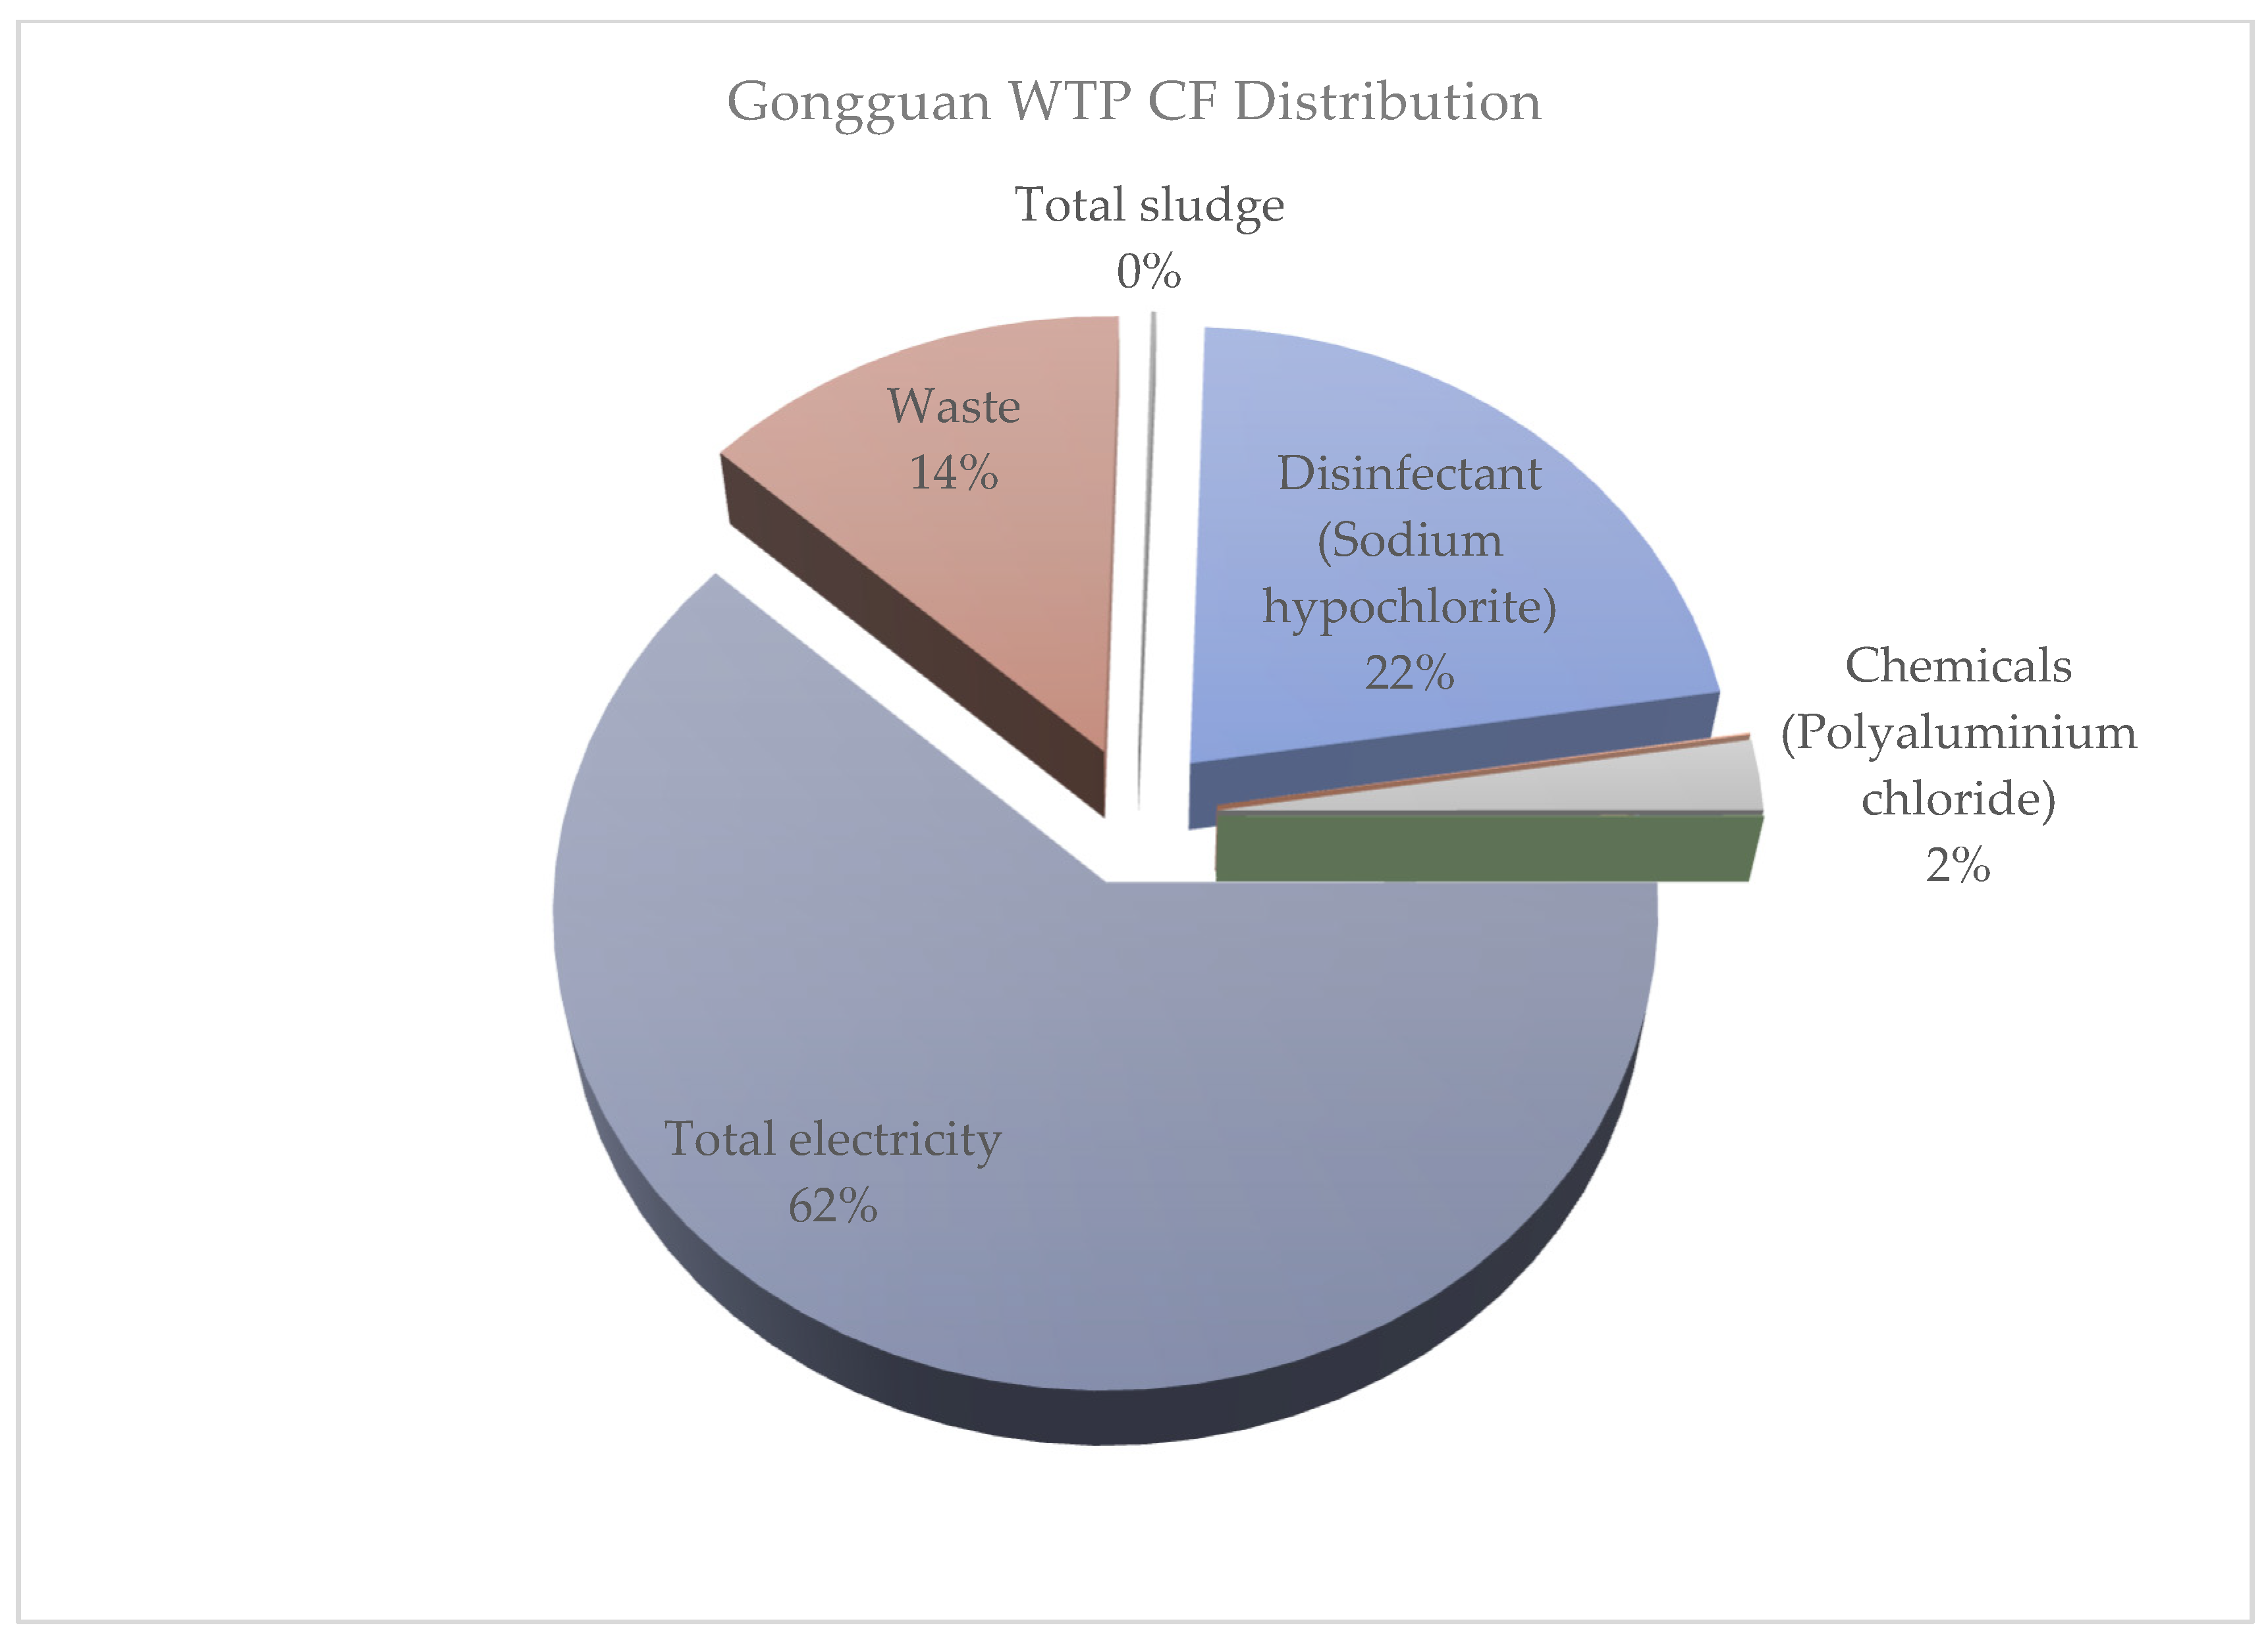
The primary objective of this study is to assess and compare the CF emissions of four water treatment plants in Indonesia and Taiwan and analyze their impacts on the environment. Indonesia and Taiwan are good candidates for a comparative study on carbon footprint assessment because they represent developing and developed regions, respectively. The LCA tool was used to compute and analyze the CF emission impact based on the clean water treatment process of these WTPs. The purpose of comparing the results of these WTPs is to know which unit contributes more to CF emissions, having low ecological performance, and to give suggestions to policymakers on improving the sustainability of these WTPs. The system boundary encompasses the raw water abstraction, the water treatment process, and the impact of the generated waste. During the calculation of the greenhouse gas emission amounts, they are examined from each component, including the electricity consumed by the whole setup, the impact of chemicals used, and the waste generated. The carbon footprint assessment results showed that the WTPs in Taiwan are more eco-friendly than the WTPs in Indonesia (Table 2). This implies that the economic structure of a region can affect the CF emissions. In this era of technological innovations, decoupling economic and environmental burdens should be further nurtured. The analysis results, described in Table 2 and Figure 2, show that treating one cubic meter of water in Indonesia accounted for 0.384 kg CO2eq and 0.360 kg CO2eq for Karang Pilang II and III, respectively. These amounts of CF are very high compared to the emissions from the Taiwanese WTPs, which emit 0.108 kg CO2eq and 0.184 kg CO2eq amounts of CF for Gongguan and Changxing, respectively. Many factors, including the operational unit setup and the overall technology used, explain this significant difference in the results obtained. The chosen treatment unit depends on the technology and the resources available in each area. As described in Table 1, the studied WTPs do not have the same operational units. The Surabaya City WTPs use different operational units, such as clearwater, predicant, and accelerator, which have the same function as the other modern units used in Taipei, such as the coagulation–flocculation tank and the sedimentation tank. Such operational units also influence CF emissions through electricity consumption and efficiency. Also, WTPs in Taiwan do not have a “clearator system”. The clearator is an old technique used in Indonesia to remove the biggest solid particulate. That system is known to consume much more electricity. This is one reason why the Indonesian WTPs are emitting more CF compared to the ones in Taiwan. For Karang Pilang II and III, their electricity consumption contributed 0.172 kg CO2eq/m3 and 0.151 kg CO2eq/m3, respectively (Figure 3 and Figure 4). The Karang Pilang II WTPs contribute 36% of their CF emissions during the intake and screening phase. The intake and screening phase includes raw water abstraction, clearator, etc. In Taiwan, for Changxing and Gongguan, their electricity consumption is 0.067 kg CO2eq/m3 and 0.065 kg CO2eq/m3 (Figure 5 and Figure 6), respectively. The differences in CF emissions from electricity consumption can be explained by the state of the electrical equipment used and the quality of the raw water. In Indonesia, the electricity consumed to filter raw water is higher. The Taiwanese WTPs employed more advanced technologies, explaining the lower amount of CF emitted by these WTPs. More advanced technologies consume less electricity. In Indonesia, electricity consumption contributes 45% and 43% for Karang Pilang II and III, respectively, to the carbon footprint emission. In the Changxing WTP, the CF emitted as a result of electricity consumption is much lower, estimated at 36%, while the Gongguan electricity emission is very high, estimated at 62%. In most cases, the contribution of electricity consumption to the CF was more than 25%. The studied WTPs in Indonesia do not have sludge treatment facilities, so the produced sludge is discharged back into the river, worsening the raw water quality. In this situation, the WTPs must employ much more electricity for the filtration step, increasing overall energy consumption and causing more negative effects on the environment. In some cases, this situation leads to the breakdown of the filtration technologies. The sludge treatment unit is of great importance if working to achieve the sustainability of the WTPs.
Table 2.
Total CF results in kg CO2eq/m3 of all WTPs.
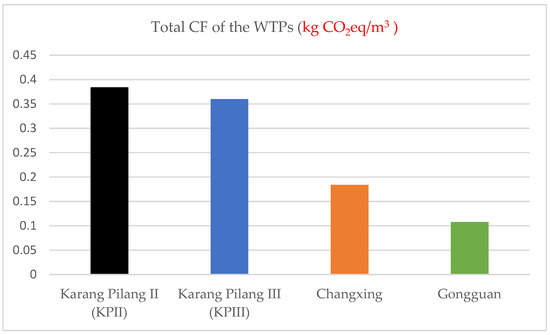
Figure 2.
Comparison of CF emissions from the different WTPs.

Figure 3.
Carbon footprint assessment results of Karang Pilang II WTP.
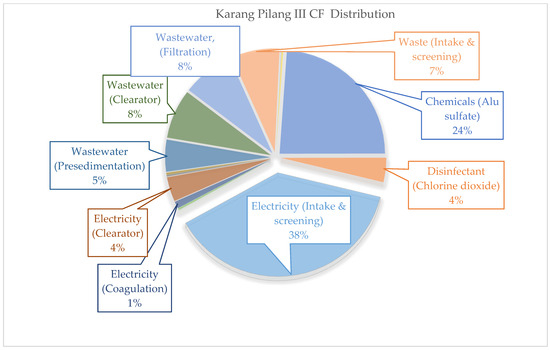
Figure 4.
Carbon footprint assessment result of Karang Pilang III WTP.

Figure 5.
Carbon footprint assessment result of Changxing WTP.
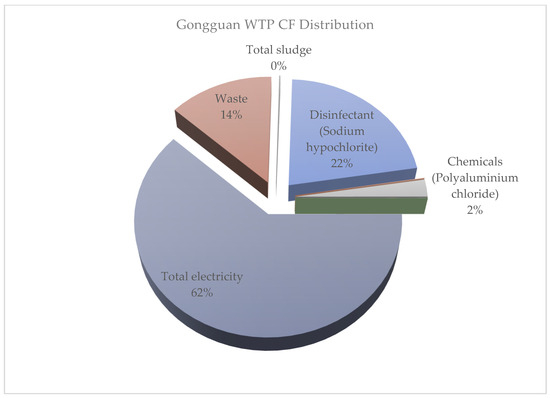
Figure 6.
Carbon footprint assessment result of Gongguan WTP.
The second highest contributor is the chemicals used in the coagulation and disinfection steps during clean water production in the WTPs. The amount of chemicals consumed during clean water production is affected by the water quality regulations elaborated by the different administrative authorities. Knowing that the water quality regulations are different for Taiwan and Indonesia, the contribution of chemical consumption to CF emissions will therefore be different. Chemicals are used to eliminate odors and other microbes in the drinking water; therefore, their consumption is influenced by the quality of raw water. In Indonesia, raw water requires a more extensive filtration process to remove debris and chemicals are also useful in this process. Moreover, they are used to eliminate odors and other microorganisms. In Taiwan, chemical consumption contributed 0.101 kg CO2eq and 0.028 kg CO2eq for Changxing and Gongguan, respectively per functional unit. The chemical consumption also depends on the volume of water-treated WTP. In Indonesia, chemical consumption contributes 0.098 kg CO2eq/m3 and 0.087 kg CO2eq/m3 for Karang Pilang III and II, respectively. In Taiwan, drinking water regulations are stricter than in Indonesia. In summary, several factors can affect CF emissions, and Figure 3, Figure 4, Figure 5 and Figure 6 give more details about each of the elements that contribute to greenhouse gas emissions during clean water production.
The results of the LCA showed that the Indonesian WTPs slightly contributed to a higher score in almost all damage categories than the Taiwanese WTPs (Table 3). Treating one cubic meter of water at the Karang Pilang WTP contributed to 0.106 kg oil-eq fossil resource scarcity. On average, the Taiwan WTPs contributed less to fossil resource scarcity. Regarding terrestrial eco-toxicity, the participation of Karang Pilang II was the highest, with a contribution of 1.163 of 1,4-DCB. The contribution to marine eutrophication was notably high in Indonesia due to the lack of wastewater treatment facilities. The chemicals are put back into the river, causing severe effects to marine eutrophication.
Table 3.
Comparative impact assessment per functional unit of WTPs.
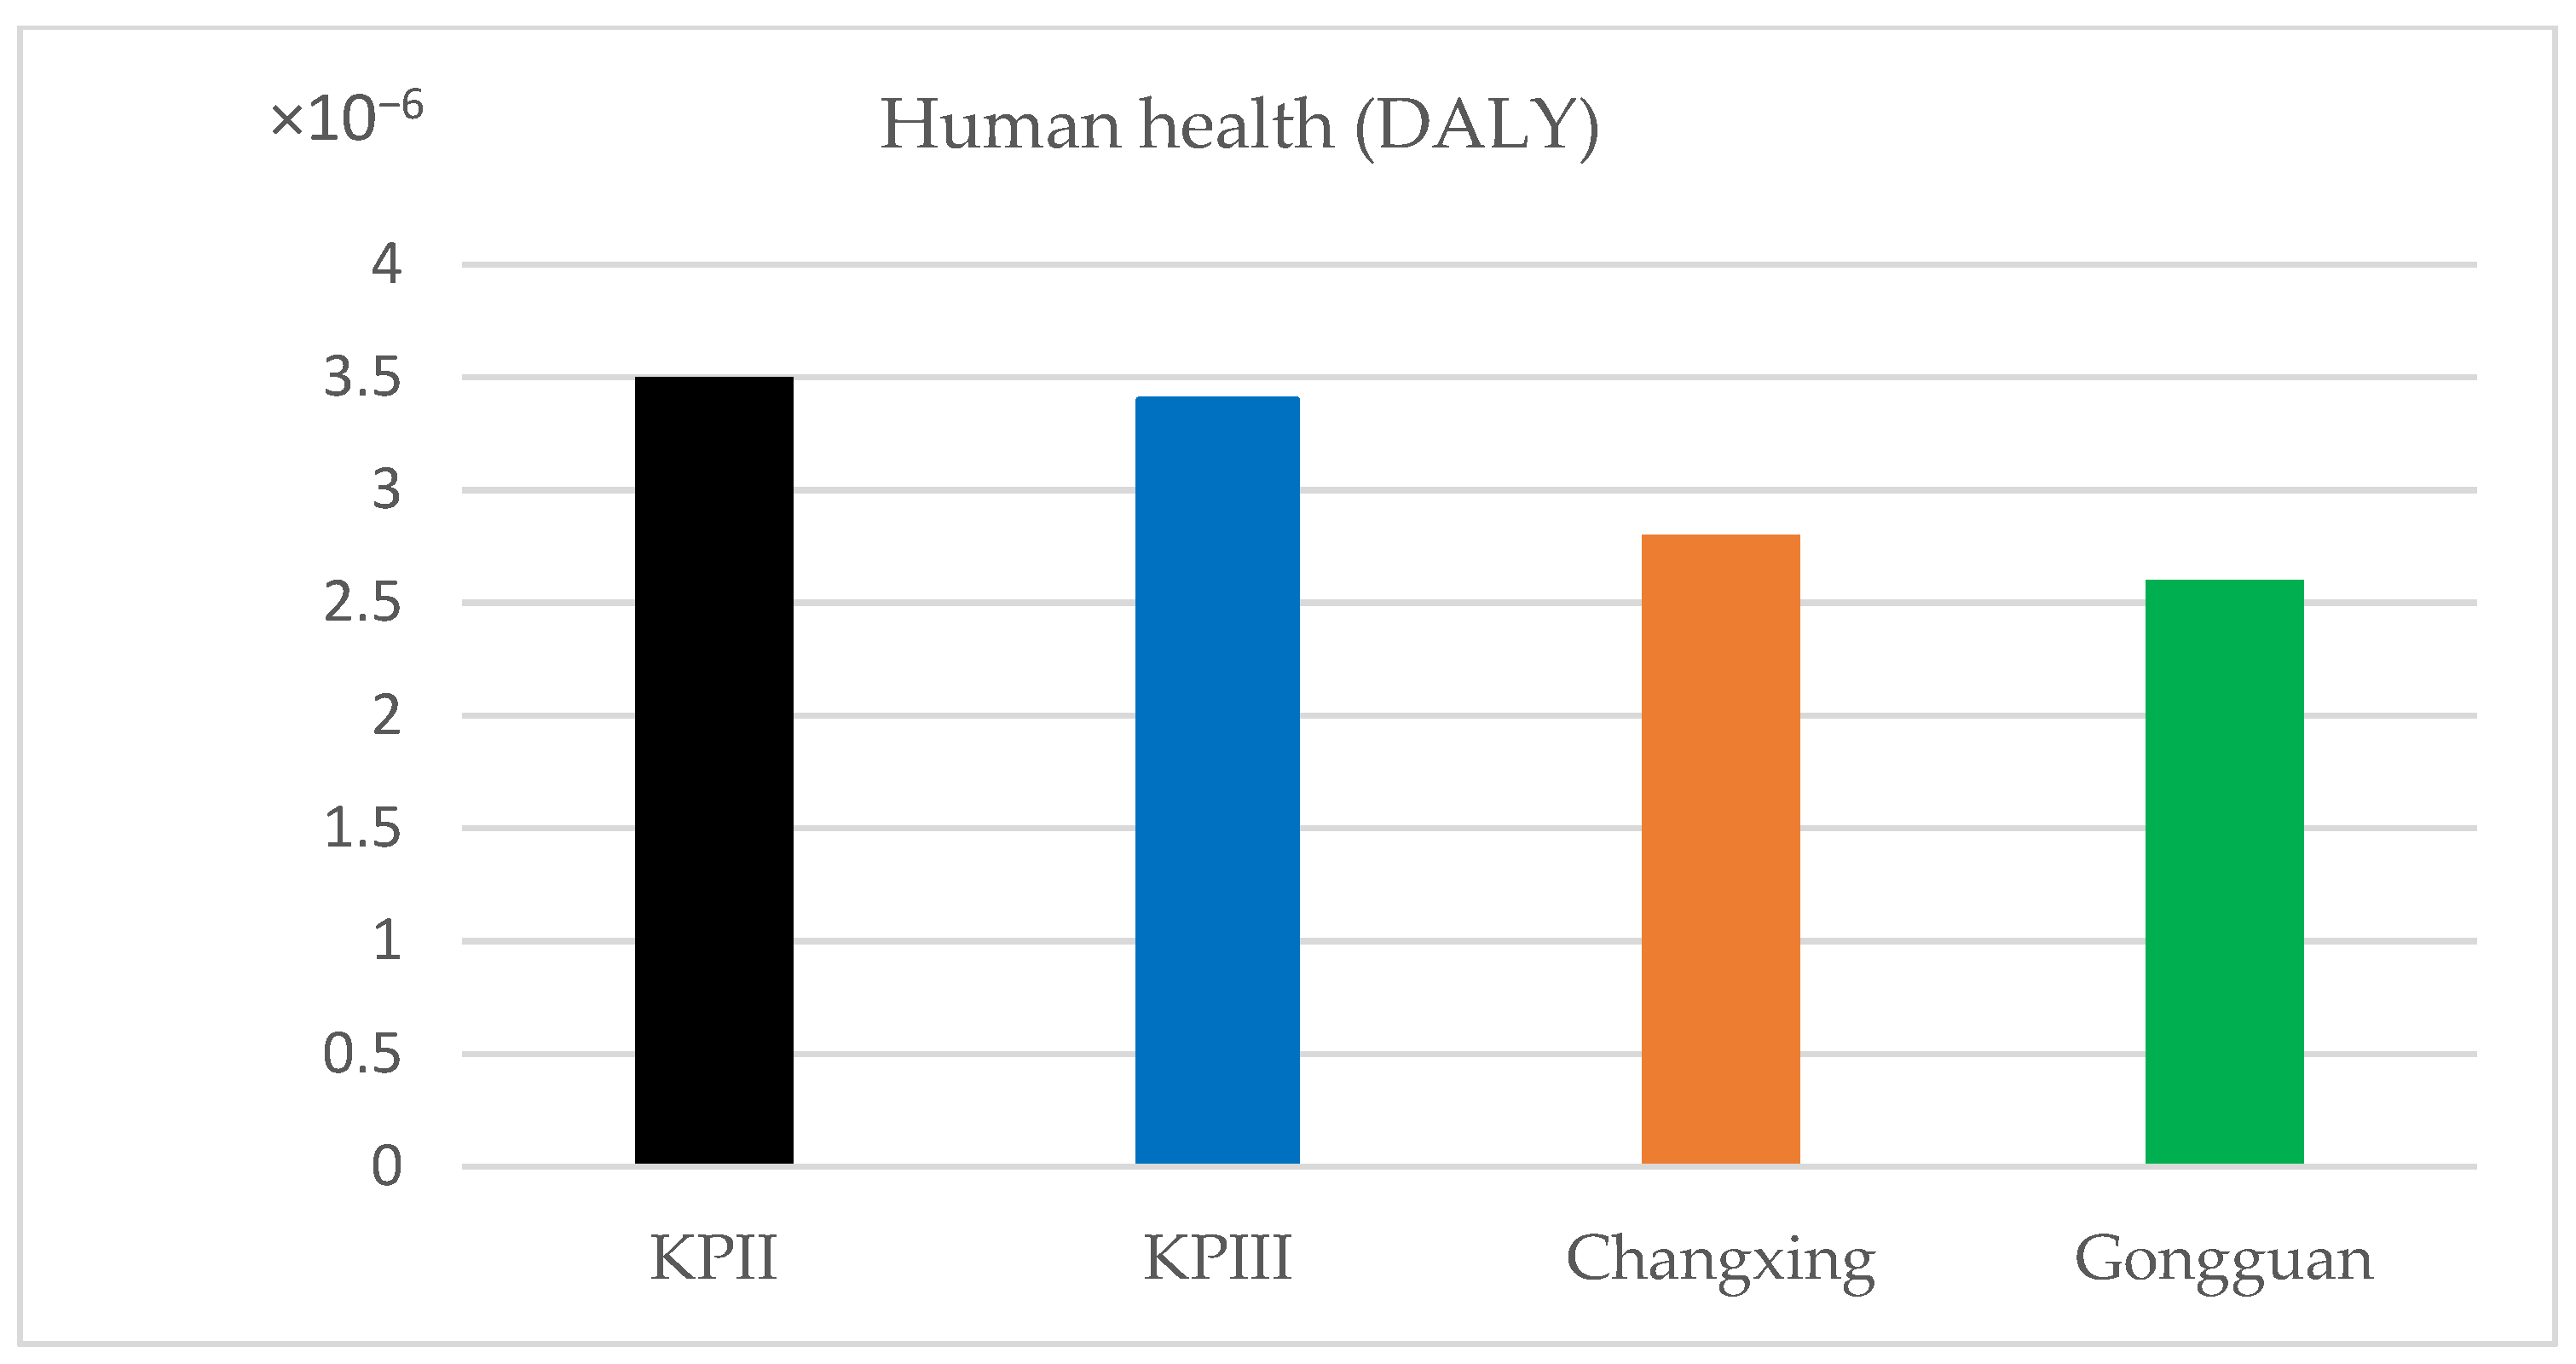
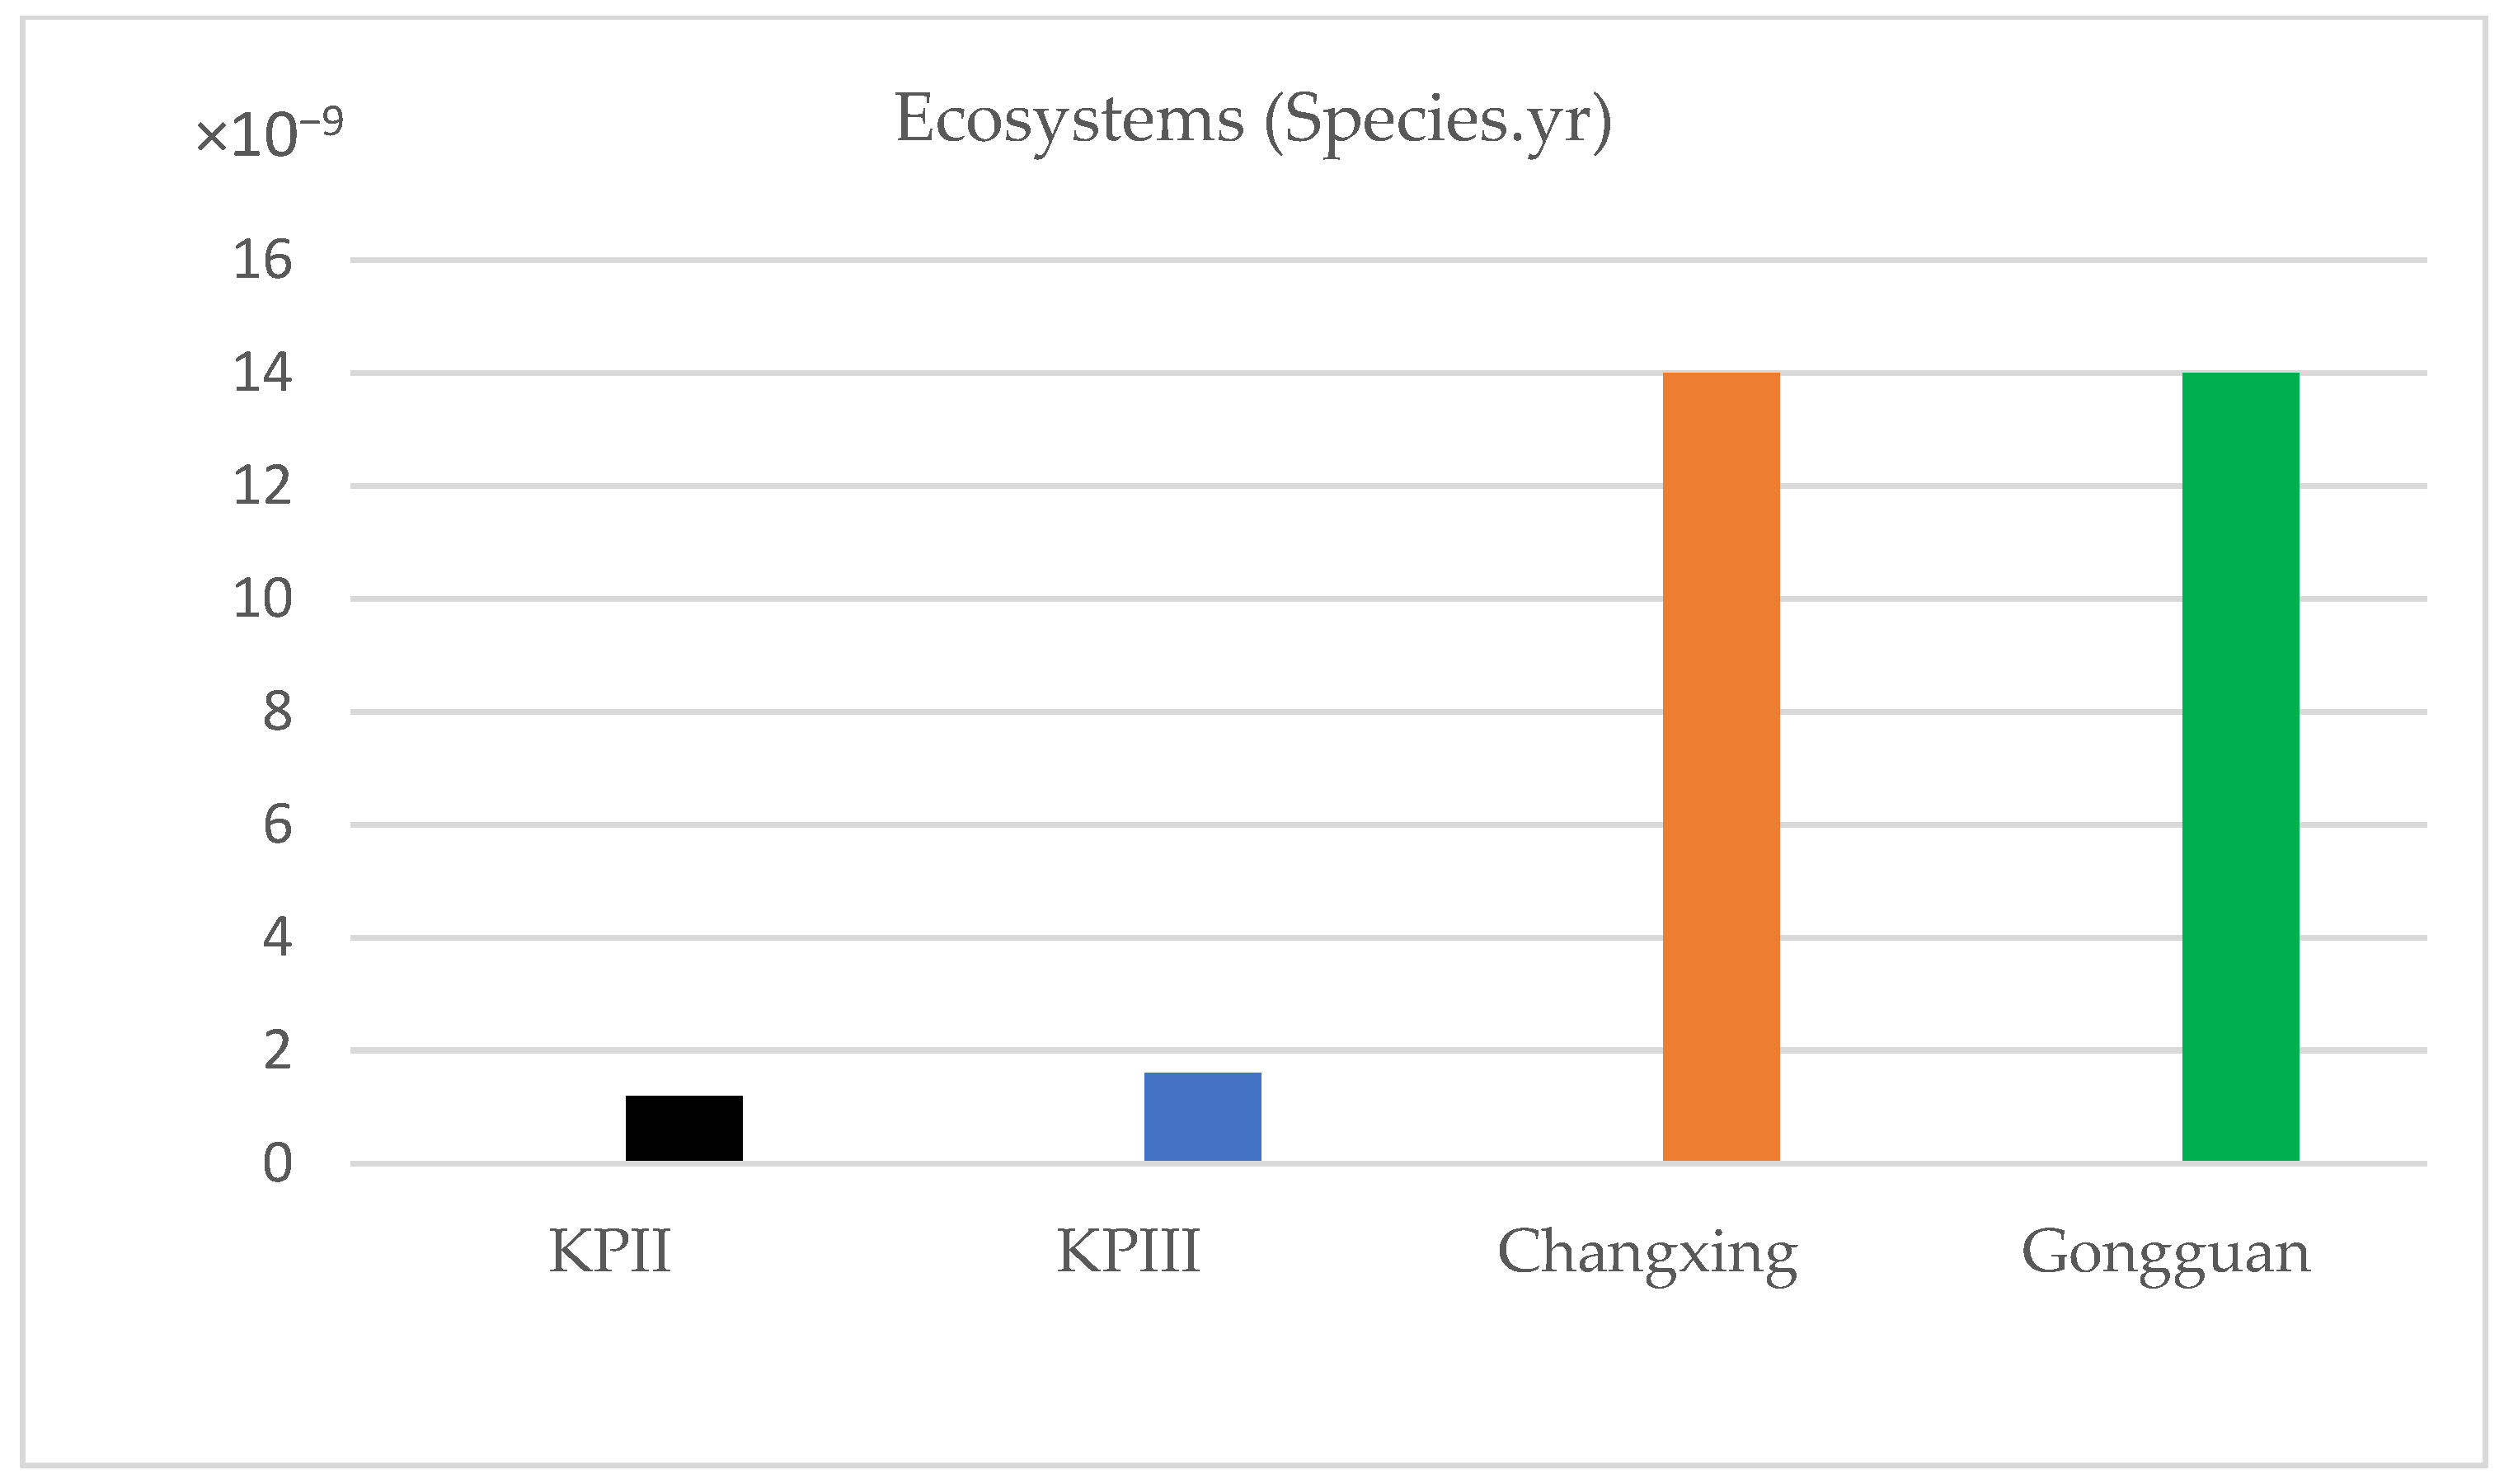
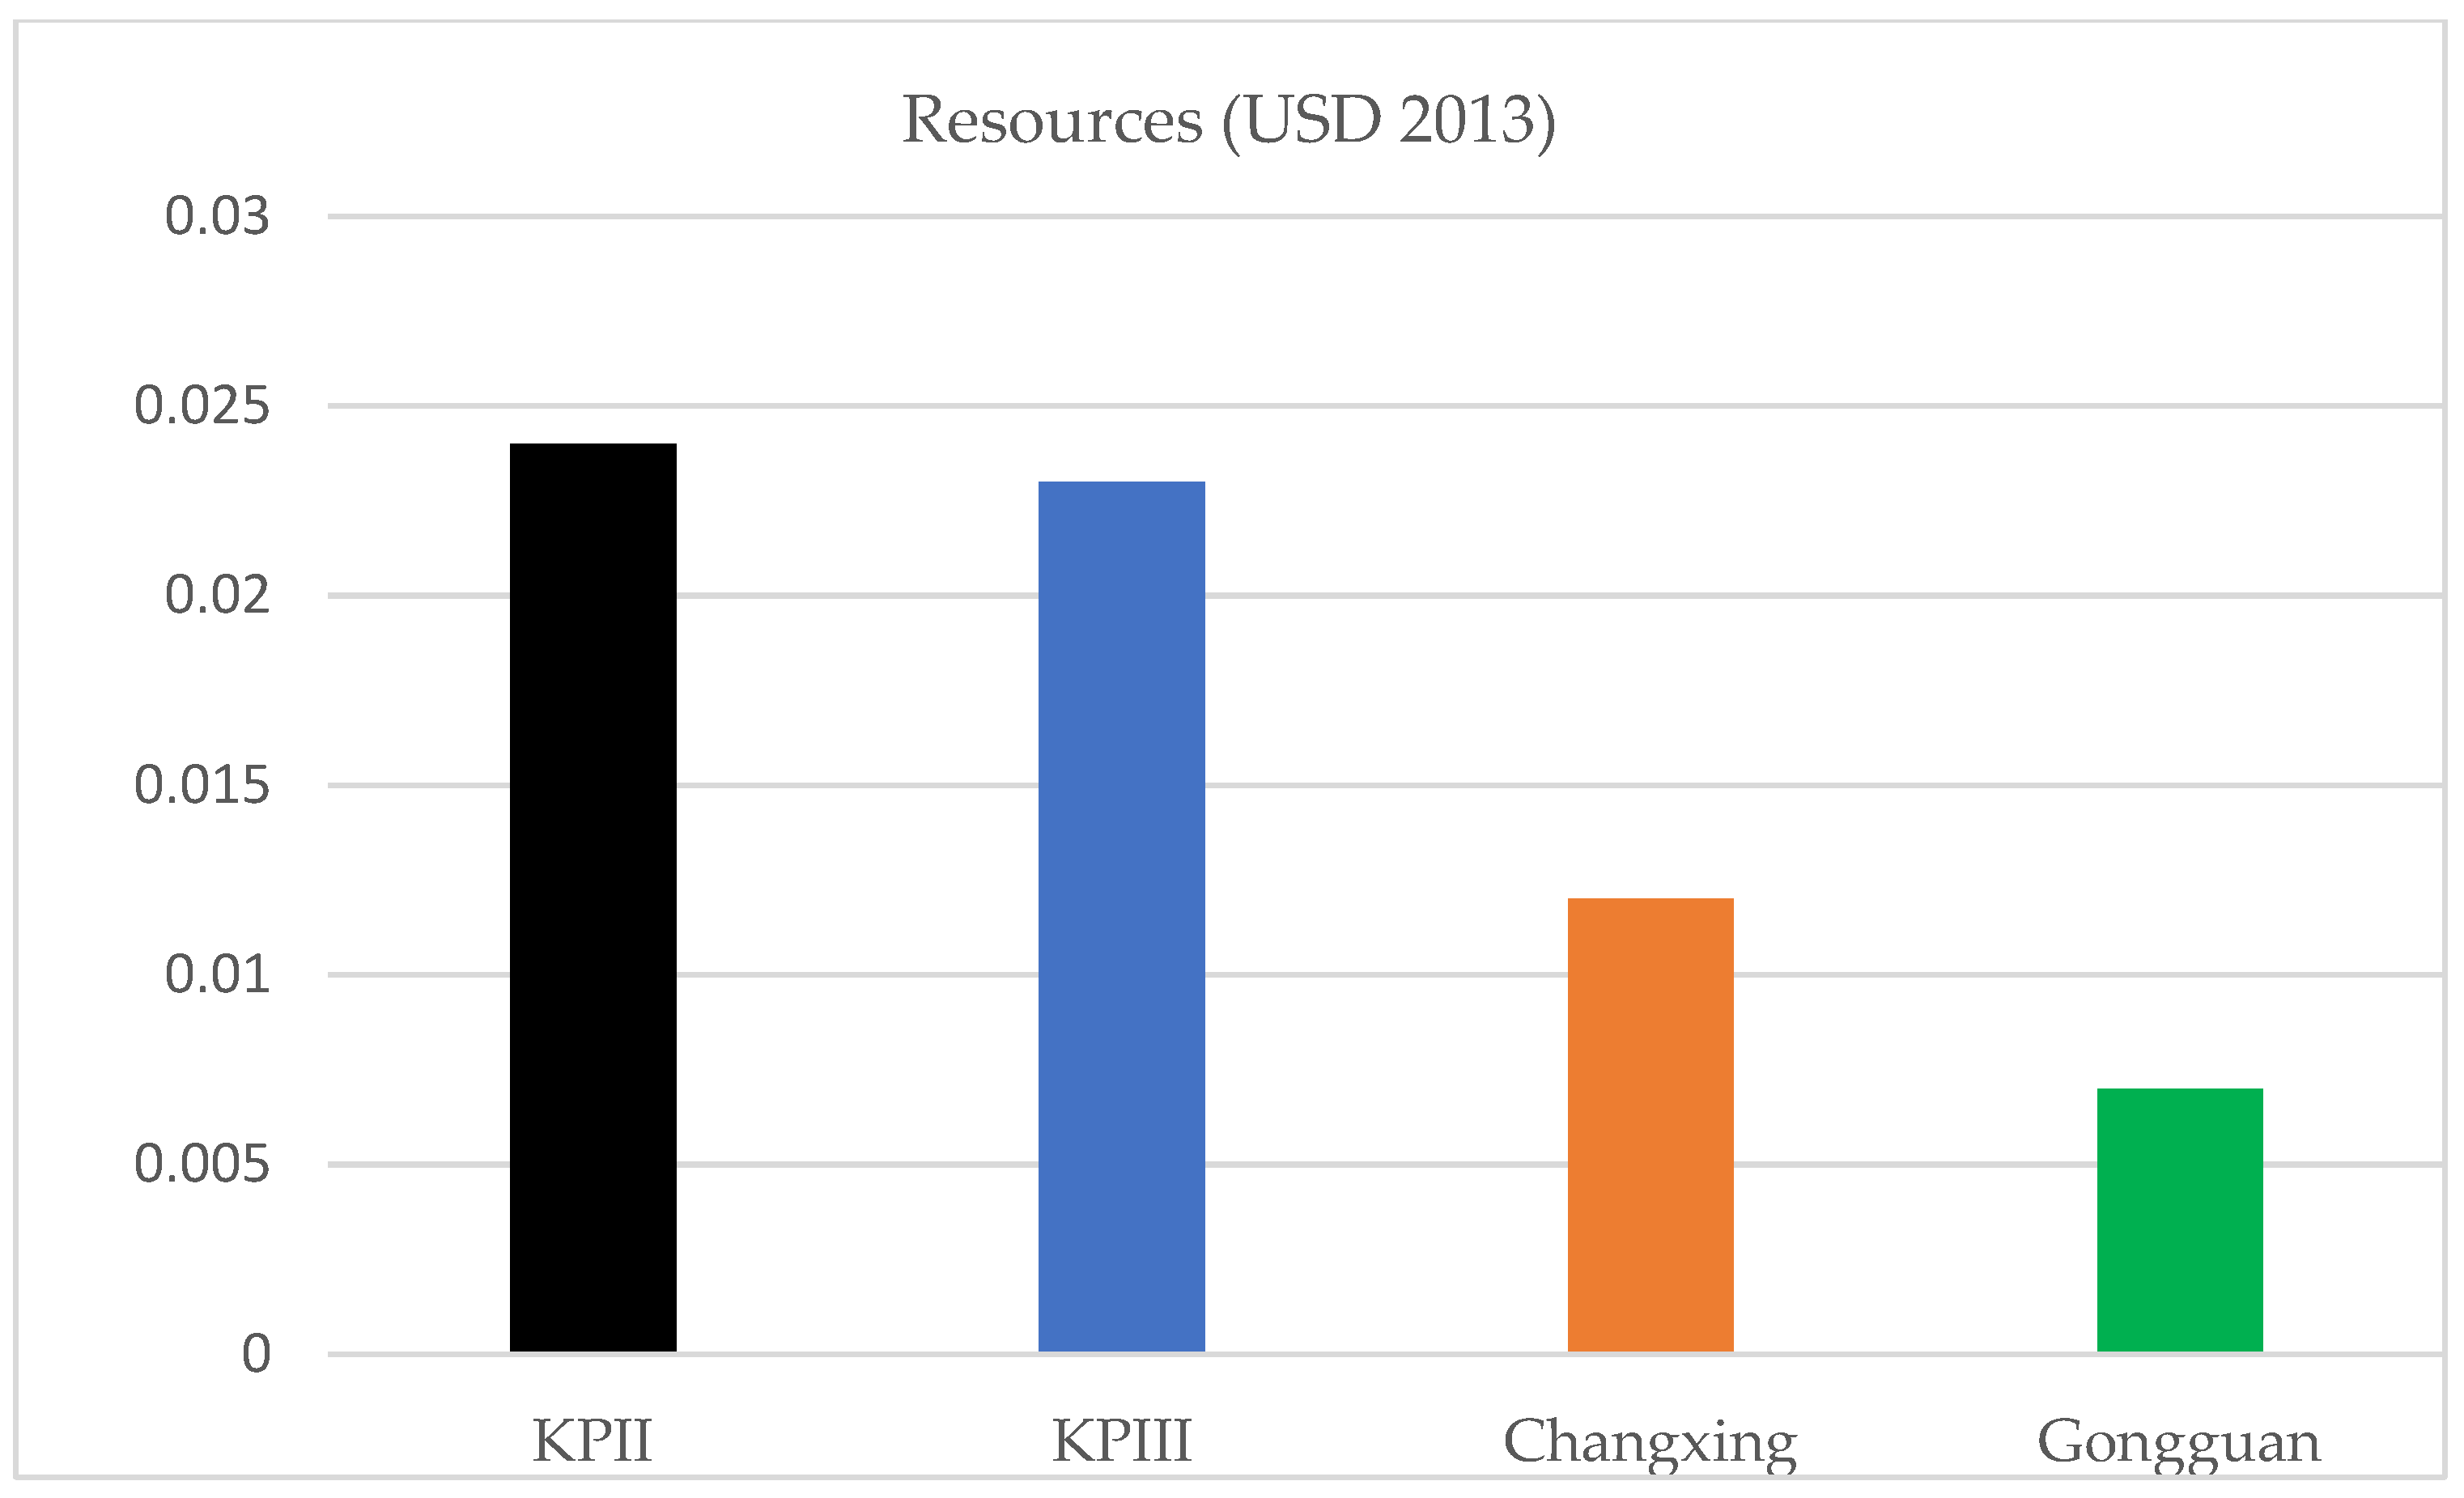
The endpoint impact on human health and the ecosystem indicates that the Taiwan WTPs performed slightly better (Figure 7 and Figure 8). Resource consumption played a significant role across all the WTPs as shown in Figure 9. The endpoint impact of the resource consumption category shows that the Karang Pilang II WTP used 2013 USD 0.024 to treat one cubic meter of water, representing the highest contribution. Karang Pilang III is the second regarding resource consumption. Generally, based on the actual results, the Indonesian WTPs’ resource consumption is more important than the Taiwanese WTPs (Figure 9). Resource consumption can be affected by many factors including the cost of raw materials, etc. In the Taiwan WTPs, chemicals are the second most significant environmental hotspot in water treatment, while generated waste is the second contributor in Indonesia. The results of this study highlight the need to build a sludge treatment facility and improve the waste treatment system for the Indonesian WTPs to enhance their sustainability. In Karang Pilang II, the lack of a sludge treatment facility increased the CF amount by 30% compared to the Taiwanese WTPs. Based on the defined scope, several limitations might affect the results of this study. The system boundary employed is defined to include the water treatment process, from raw water abstraction to the final step before the distribution of the clean water. However, it does not account for the transportation of chemicals, the distribution network, and the sludge treatment; factors that are significant contributors to carbon footprint emissions.

Figure 7.
Comparison of CF impact on human health for four WTPs.

Figure 8.
Comparison of CF impact on ecosystem for four WTPs.
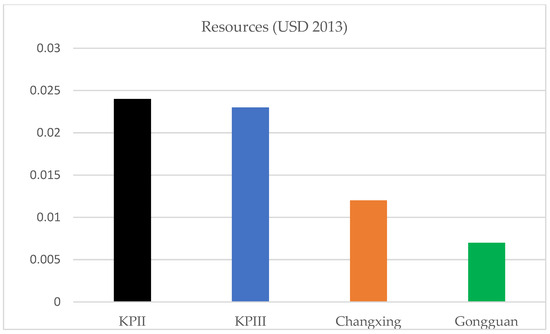
Figure 9.
Comparison of CF impact on resources for four WTPs.
The demand for high-quality drinking water, coupled with the variations in raw water quality and the absence of sludge treatment facilities in the Indonesian WTPs, results in the consumption of considerable resources and the emission of carbon footprints (CFs), adversely affecting human health and the ecosystem. This study underscores the necessity for Indonesian decision-makers to collaborate with their Taiwanese counterparts to enhance their technologies. Constructing sludge treatment facilities in Indonesia and using modern technologies would be a crucial step towards reducing CF emissions. Indonesia’s ambitious goal of achieving net-zero emissions by 2060 or sooner requires significant effort across all sectors of the economy. This study’s findings indicate that the water treatment sector is a substantial contributor to CF emissions, necessitating urgent attention. Despite setting the Taiwanese WTPs as a benchmark, Indonesia remains distant from attaining this objective, in terms of sustainability and technological innovations, as detailed in Table 2.
Many studies have been conducted on CF assessment in WTPs. Hu et al. [36] identified a value of 0.1768 kg CO2eq/m3. These results are comparable to this study, since the previous study includes infrastructure and distribution stages within their system boundary. The infrastructure and distribution system contribute significantly to the CF emissions produced during drinking water distribution. In these WTPs, electricity consumption during clean water production is the major factor, highlighting the need to use more renewable energies. In 2020, TWC realized that the CF emitted by the treatment of one cubic meter of water produced 0.152 kg CO2eq [37]. These findings comply with a previous study conducted by [38], explaining that electricity generation is the source of most GHG emissions, especially during the raw water intake phase, from three water treatment facilities in Australia. During the raw water abstraction, the intake process uses booster pumps to distribute water to the next unit, and many kinds of electrical equipment are used in this unit, such as pumps, panels, and flowmeters, making the intake process consume much more energy. From their study, the groundwater treatment plant had the smallest CF, emitting only 0.38 kg CO2eq/m3 for domestic water distribution. Sala-Garrido et al. [7], in England and Wales, analyzed the environmental burden of WTPs and found that the CF per cubic meter of clean water delivered to the end users was 0.95 kg CO2eq/m3, as computed using LCA methodology. In Italy, Sambito and Freni [39] highlighted that water supply and treatment phases produce the most constant share of CO2eq/m3 and are the most energy-intensive use stages in the clean water use cycle. The upstream process, including the raw water supply system, which comprises various pumping stations and treatment facilities, is the second-largest contributor, with a CF amount of 0.21 kg CO2eq/m3. Sari et al. [40] used mathematical modeling to evaluate the CF emissions from a WTP in Indonesia and realized that the primary sources of CO2 emissions are the energy consumed during the treatment and delivery phases, with emissions of 0.49 kg CO2eq/m3 and 0.35 kg CO2eq/m3, respectively. They concluded that switching the electricity source could reduce CF emissions. The study also highlighted that energy consumption, particularly by the pumping systems during the intake and distribution operations, is the main contributor to CO2 emissions in the clean water production and delivery industry. In that field, solar panels are a promising technology for enhancing sustainability of WTPs. In Romania, Presura and Robescu [41] studied energy consumption and carbon emissions from WTPs, emphasizing that energy consumption is the primary source of CO2 emissions. Their research, utilizing mathematical modeling, determined that a WTP in their country emits 0.137 kg CO2eq/m3. Achieving a more sustainable world requires more endeavors and efforts from all sectors, including the clean water production sector. In terms of technology development, Indonesia can still learn from Taiwan, thus the sense in conducting this study. Energy sources also differ between the two countries, with coal being the primary energy source in Indonesia, constituting 37% [33] of its energy mix, while crude oil and its products dominate in Taiwan [34]. In South Africa, urban water supply facilities use high amounts of energy, consuming up to 6% of regional power [42]. Hofs B. et al. [43] also acknowledged that drinking water treatment plants are consuming much energy and will shortly compromise the goal of sustainability. Remarkably, greening the source of energy for WTPs will enhance their ecological performance. In summary, the WTPs in Taiwan outperform those in Indonesia due to several factors, such as the lack of sludge treatment units, the electricity consumption, and the operational unit setup. For WTPs having sludge treatment facilities, electricity consumption and chemical usage are the primarily sources of CF during drinking water production as notified by [40,41]. Emphasizing the importance of improving electricity efficiency across processes in WTP facilities to achieve significant carbon footprint reductions, promote energy savings, and lower environmental impacts is necessary [44]. Quantifying and analyzing GHG emissions, increasing energy efficiency, and investing in renewable energy projects have all become objectives for water regulators and businesses while promoting net-zero policies for addressing climate change. The optimization of CF will be the key to reducing the environmental impact and enhancing sustainability of WTPs. Good management of energy and chemicals and the right choice of treatment unit based on the characteristics of the water condition can be some of the solutions to reduce the impact of CF.
4. Conclusions
This research uses the LCA method to assess and compare the total carbon footprint (CF) impacts of four WTPs in Indonesia and Taiwan. This comparison aims to improve the ecological performances of the studied WTPs by identifying the highest contributors to the CF among these WTPs. According to the analysis results, it can be seen that the CFs of Karang Pilang II and III were calculated as 0.384 kg CO2eq/m3 and 0.360 kg CO2eq/m3, respectively, while in Taiwan, they were 0.184 kg CO2eq/m3 and 0.108 kg CO2eq/m3 for Changxing and Gongguan, respectively. The analysis results revealed that the amounts of CF emitted by electricity consumption are 0.172 kg CO2eq/m3 and 0.151 kg CO2eq/m3 for Karang Pilang II and III, respectively, while in Taiwan, the electricity consumption of Changxing and Gongguan emitted 0.067 kg CO2eq/m3 and 0.065 kg CO2eq/m3 of CF, respectively. In Taiwan, chemical consumption contributed 0.101 kg CO2eq and 0.028 kg CO2eq for Changxing and Gongguan, respectively, per functional unit. In Indonesia, chemical consumption contributed 0.098 kg CO2eq/m3 and 0.087 kg CO2eq/m3 for Karang Pilang III and II, respectively. According to the findings, when the amount of CF emitted is compared, the Taiwanese WTPs have a lower carbon footprint and, therefore, are more ecological. In Indonesia, the WTPs lack sludge treatment facilities and rely on outdated technologies leading to significantly higher resource consumption and a greater impact on human health and the ecosystem. Additionally, the type of electricity source and the quality of the raw water affect the CF results. The Indonesian WTPs use coal, which significantly impacts the environment; therefore, they emit much higher amounts of CF compared to the WTPs in Taiwan using crude oil. The electricity consumption during the intake of raw water and the screening process are the primary sources of CF in most of the WTPs in both countries. Improving environmental performance in Indonesia could entail replacing the existing electrical equipment with more sustainable alternatives and transitioning to environmentally friendly or renewable energy sources. The most urgent action will be to build a sludge treatment facility for the WTPs instead of releasing the sludge emitted by the treatment process back into the river. In Taipei, good management of chemicals and renewable energy could be used as a source of electricity, which aligns with the national objective of net zero by 2030.
Supplementary Materials
The following supporting information can be downloaded at: https://www.mdpi.com/article/10.3390/su16198409/s1.
Author Contributions
Conceptualization, R.N.N.A.; methodology, A.O. and R.N.N.A.; software, R.N.N.A. and A.O.; validation, C.-H.K., H.H. and A.H.H.; formal analysis, C.-H.K.; investigation, R.N.N.A.; resources, A.H.H.; data curation, R.N.N.A. and A.O.; writing—original draft preparation, A.O. and R.N.N.A.; writing—review and editing, A.O.; visualization, A.O.; supervision, A.H.H. All authors have read and agreed to the published version of the manuscript.
Funding
This research received no external funding.
Institutional Review Board Statement
Not applicable.
Informed Consent Statement
Not applicable.
Data Availability Statement
The data supporting this study may be provided upon reasonable request to the authors of the study.
Conflicts of Interest
The authors declare no conflicts of interest. Resita Nadya Noor Azhaari is an employee of PT. Semen Indonesia (Persero) Tbk, Jakarta, Indonesia. The remaining authors declare that the research was conducted in the absence of any commercial or financial relationships that could be construed as a potential conflict of interest.
References
- Tarpani RR, Z.; Lapolli, F.R.; Recio MA, L.; Gallego-Schmid, A. Comparative Life Cycle Assessment of Three Alternative Techniques for Increasing Potable Water Supply in Cities in the Global South. J. Clean. Prod. 2021, 290, 125871. [Google Scholar] [CrossRef]
- Boretti, A.; Rosa, L. Reassessing the projections of the World Water Development Report. Npj Clean Water 2019, 2, 15. [Google Scholar] [CrossRef]
- Water.org. Indonesia. 2022. Available online: https://water.org/our-impact/where-we-work/indonesia/ (accessed on 30 April 2024).
- World Health Organization (WHO); The United Nations Children’s Fund (UNICEF). Progress on Household Drinking Water, Sanitation and Hygiene 2000–2020: Five Years into the SDGs; WHO: Geneva, Switzerland, 2021. [Google Scholar]
- Permana, A. The Urgency of Maintaining Safe and Clean Water Availability in Indonesia; Institut Teknologi Bandung: Bandung, Indonesia, 2020; Available online: https://www.itb.ac.id/news/read/57576/home/the-urgency-of-maintaining-safe-and-clean-water-availability-in-indonesia (accessed on 30 April 2024).
- Delphos, P.J.; Wesner, G.M. Water Treatment Plant Design—Chapter 6: Mixing, Coagulation, and Flocculation; Mc Graw Hill: New York, NY, USA, 2005; ISBN 0-07-141872-5. [Google Scholar] [CrossRef]
- Sala-Garrido, R.; Mocholi-Arce, M.; Molinos-Senante, M.; Maziotis, A. Marginal Abatement Cost of Carbon Dioxide Emissions in the Provision of Urban Drinking Water. Sustain. Prod. Consum. 2020, 25, 439–449. [Google Scholar] [CrossRef]
- Agthe, D.E.; Billings, R.B.; Buras, N. Managing Urban Water Supply—Chapter 1: Introduction; Springer Science-Business Media: Dordrecht, Germany, 2003; ISBN 978-94-017-0237-9. [Google Scholar] [CrossRef]
- Ahuja, S. Handbook of Water Purity and Quality; Elsevier: Amsterdam, The Netherlands, 2009. [Google Scholar] [CrossRef]
- Mekonnen, M.M.; Hoekstra, A.Y. Four billion people facing severe water scarcity. Sci. Adv. 2016, 2, e1500323. [Google Scholar] [CrossRef] [PubMed]
- United Nations Water. The United Nations World Water Development Report 2019: Leaving No One Behind; UNESCO: Paris, Italy, 2019. [Google Scholar]
- Gerba, C.P. Drinking Water Treatment. In Environmental Microbiology; Academic Press: Cambridge, MA, USA, 2009; pp. 531–538. [Google Scholar] [CrossRef]
- Weiner, R.F.; Matthews, R.A. Environmental Engineering—Chapter 6: Water Supply; Chapter 7: Water Treatment; Elsevier: Philadelphia, PA, USA, 2003. [Google Scholar]
- Pizzi, N.G. Principles and Practices of Water Supply Operations Water Treatment, 4th ed.; American Water Works Association (AWWA): Denver, CO, USA, 2010; ISBN 978-1-58321-777-1. [Google Scholar]
- Marhaba, T.F. Monitoring Disinfectants. In Handbook of Water Purity and Quality; Academic Press: Cambridge, MA, USA, 2008; pp. 259–288. [Google Scholar] [CrossRef]
- Guinée, J.B. Handbook on life cycle assessment operational guide to the ISO standards. Int. J. Life Cycle Assess. 2002, 7, 311–313. [Google Scholar] [CrossRef]
- Hischier, R.; Weidema, B.P.; Althaus, H.-J.; Bauer, C.; Doka, G.; Dones, R.; Frischknecht, R.; Hellweg, S.; Humbert, S.; Jungbluth, N.; et al. Implementation of Life Cycle Impact Assessment Methods Data, v2.2. Eco-Invent Report No. 3; Swiss Centre for Life Cycle Inventories: Geneva, Switzerland, 2010. [Google Scholar]
- ISO 14040; Environmental Management—Life Cycle Assessment—Principles and Framework. ISO: Geneva, Switzerland, 2006.
- ISO 14044; Environmental Management Life Cycle Assessment Requirements and Guidelines. ISO: Geneva, Switzerland, 2006.
- Lakho, F.H.; Qureshi, A.; Igodt, W.; Le, H.Q.; Depuydt, V.; Rousseau DP, L.; van Hulle SW, H. Life cycle assessment of two decentralized water treatment systems combining a constructed wetland and a membrane based drinking water production system. Resour. Conserv. Recycl. 2022, 178, 106104. [Google Scholar] [CrossRef]
- Meron, N.; Blass, V.; Thoma, G. A national-level LCA of a water supply system in a Mediterranean semi-arid climate—Israel as a case study. Int. J. Life Cycle Assess. 2020, 25, 1133–1144. [Google Scholar] [CrossRef]
- Li, Y.; Xiong, W.; Zhang, W.; Wang, C.; Wang, P. Life cycle assessment of water supply alternatives in water-receiving areas of the South-to-North Water Diversion Project in China. Water Res. 2016, 89, 9–19. [Google Scholar] [CrossRef] [PubMed]
- Bonoli, A.; di Fusco, E.; Zanni, S.; Lauriola, I.; Ciriello, V.; di Federico, V. Green smart technology for water (GST4Water): Life cycle analysis of urban water consumption. Water 2019, 11, 389. [Google Scholar] [CrossRef]
- Godskesen, B.; Meron, N.; Rygaard, M. LCA of drinking water supply. In Life Cycle Assessment; Springer: Berlin/Heidelberg, Germany, 2018; pp. 835–860. [Google Scholar] [CrossRef]
- Zijp, M.C.; van der Laan, H. Life Cycle Assessment of Two Drinking Water Production Schemes; National Institute for Public Health and the Environment RIVM: Utrecht, The Netherlands, 2015. [Google Scholar]
- Ghimire, S.R.; Johnston, J.M.; Ingwersen, W.W.; Sojka, S. Life cycle assessment of a commercial rainwater harvesting system compared with a municipal water supply system. J. Clean. Prod. 2017, 151, 74–86. [Google Scholar] [CrossRef] [PubMed]
- Hsien, C.; Choong Low, J.S.; Chan Fuchen, S.; Han, T.W. Life cycle assessment of water supply in Singapore—A water-scarce urban city with multiple water sources. Resour. Conserv. Recycl. 2019, 151, 104476. [Google Scholar] [CrossRef]
- Calvin, K.; Lee, H.; Dasgupta, D.; Krinner, G.; Mukherji, A.; Thorne, P.; Trisos, C.; Romero, J.; Aldunce, P.; Barett, K.; et al. IPCC, 2023: Climate Change 2023: Synthesis Report. Contribution of Working Groups I, II and III to the Sixth Assessment Report of the Intergovernmental Panel on Climate Change; Core Writing Team, Lee, H., Romero, J., Eds.; Intergovernmental Panel on Climate Change (IPCC): Geneva, Switzerland, 2023. [Google Scholar] [CrossRef]
- BPS Statistics of Surabaya Municipality. Surabaya Municipality in Figures 2021; Badan Pusat Statistik Kota Surabaya: Surabaya, Indonesia, 2021. [Google Scholar]
- Surabaya City Water Supply Company. Surabaya City Water Supply Company 2021 Report; Surabaya City Water Supply Company: Surabaya, Indonesia, 2021. [Google Scholar]
- Taipei City Government. Taipei City Statistical Yearbook 2020; Taipei City Government: Taipei, Taiwan, 2021. [Google Scholar]
- Taipei Water Department. Taipei Water Department Statistical Yearbook 2020; Taipei Water Department: Taipei, Taiwan, 2021; ISSN 1812-3104. [Google Scholar]
- Ministry of Energy and Mineral Resources Republic of Indonesia. Handbook of Energy & Economic Statistic of Indonesia 2020; Ministry of Energy and Mineral Resources Republic of Indonesia: Jakarta, Indonesia, 2021; ISSN 2528-3464. [Google Scholar]
- Ministry of Economic Affairs Energy Administration. 2022 Electricity Carbon Emission Factor; Energy Administration; Ministry of Economic Affairs Energy Administration: Taiwan, China, 2022. Available online: https://www.moeaea.gov.tw/ECW/english/content/Content.aspx?menu_id=24200 (accessed on 6 August 2024).
- DatabaseManualMethods.pdf. Available online: https://simapro.com/wp-content/uploads/2020/10/DatabaseManualMethods.pdf (accessed on 15 September 2024).
- Hu, A.H.; Wang, L.H.; Fan, C.W.; Lin, Y.Z.; Lin, J.H.; Yao, K.F.; Nien, P.F.; Feng, Y.T.; Kuo, W.M. Carbon Footprint Assessment of Water Supply Systems in Taiwan. In Design for Innovative Value towards a Sustainable Society; Springer: Berlin/Heidelberg, Germany, 2012; pp. 318–322. [Google Scholar] [CrossRef]
- Ministry of Digital Affairs. The Taiwan Water Corporation CO2 emissions per unit of water consumed|政府資料開放平臺. Available online: https://data.gov.tw/en/datasets/25681 (accessed on 15 September 2024).
- Biswas, W.K.; Yek, P. Improving the carbon footprint of water treatment with renewable energy: A Western Australian case study. Renew. Wind. Water Sol. 2016, 3, 14. [Google Scholar] [CrossRef]
- Sambito, M.; Freni, G. LCA Methodology for the Quantification of the Carbon Footprint of the Integrated Urban Water System. Water 2017, 9, 395. [Google Scholar] [CrossRef]
- Sari, E.; Kristanto, G.A.; Pratama, M.A. Green House Gasses Estimation from Clean Water Production and Supply Sector in Depok City, Indonesia. AIP Conf. Proc. 2020, 2230, 040015. [Google Scholar] [CrossRef]
- Presura, E.; Robescu, L.D. Energy use and carbon footprint for potable water and wastewater treatment. Proc. Int. Conf. Bus. Excell. 2017, 11, 191–198. [Google Scholar] [CrossRef]
- Modolo, S.D.; Telukdarie, A.; Kumar, A. Energy-water and GHG Nexus: A South African Water Industry Case. Water Pract. Technol. 2018, 13, 673–691. [Google Scholar] [CrossRef]
- Hofs, B.; van den Broek, W.; van Eckeveld, A.; van der Wal, A. Carbon Footprint of Drinking Water Over Treatment Plant Life Span (2025–2075) is Probably Dominated by Construction Phase. Clean. Environ. Syst. 2022, 5, 100079. [Google Scholar] [CrossRef]
- Borzooei, S.; Campo, G.; Cerutti, A.; Meucci, L.; Panepinto, D.; Ravina, M.; Riggio, V.; Ruffino, B.; Scibilia, G.; Zanetti, M. Feasibility Analysis for Reduction of Carbon Footprint in a Wastewater Treatment Plant. J. Clean. Prod. 2020, 271, 122526. [Google Scholar] [CrossRef]
Disclaimer/Publisher’s Note: The statements, opinions and data contained in all publications are solely those of the individual author(s) and contributor(s) and not of MDPI and/or the editor(s). MDPI and/or the editor(s) disclaim responsibility for any injury to people or property resulting from any ideas, methods, instructions or products referred to in the content. |
© 2024 by the authors. Licensee MDPI, Basel, Switzerland. This article is an open access article distributed under the terms and conditions of the Creative Commons Attribution (CC BY) license (https://creativecommons.org/licenses/by/4.0/).