Abstract
Agricultural productivity in China is a fundamental driver of food security and economic growth. Yet, the sector faces profound challenges due to environmental degradation and climate change, which threaten sustainable agricultural practices. This research examines the effects of technological innovations on agricultural Total Factor Productivity and environmental sustainability in China from 2012 to 2022. The study seeks to understand how technological advancements, when considered alongside socioeconomic variables, impact agricultural output while balancing ecological integrity. Employing a comprehensive methodological framework, this research integrates fixed-effects, random-effects, and multilevel mixed-effects models to analyze crucial factors including rural education, technological capability, and environmental conservation initiatives. The study further utilizes structural equation modeling to evaluate both the direct and indirect effects of these determinants on productivity. The results demonstrate that technological innovations substantially enhance agricultural productivity, particularly in provinces with higher socioeconomic development. Additionally, sustainable farming practices and tailored policy interventions are identified as vital in addressing regional productivity imbalances. The research concludes by underscoring the necessity for the continued integration of environmental considerations and emerging technologies to ensure the sustainability of agricultural growth in the long term.
1. Introduction
Agricultural productivity is essential for global food security, economic development, and rural sustainability [1,2,3]. However, environmental degradation and resource depletion now pose significant challenges. Climate change, with rising temperatures and extreme weather, increasingly undermines agricultural output [3,4,5,6,7]. Atchadé and Nougbodé [4] demonstrated a positive link between agricultural value addition and economic growth in Benin, highlighting agriculture’s central role in economic progress. Similarly, Mugabe et al. [8] forecast that Tanzania’s Bagamoyo District will suffer from increased heat and reduced rainfall, adversely affecting both productivity and food security. Omotoso et al. [6] noted that South African farmers employing Climate-Smart Agriculture techniques saw reductions in household food insecurity, underlining the importance of such strategies in ensuring food security.
Ding et al. [9] reported a 65% decline in vegetation productivity in the Yellow River Basin during severe droughts, highlighting the region’s agricultural vulnerability to drought stress. Hassan and Mohamed [10] stressed the negative impact of carbon dioxide emissions on productivity, emphasizing the necessity for climate change mitigation and better water resource management. Ortiz-Bobea et al. [11] found that anthropogenic climate change has reduced global Total Factor Productivity (TFP) growth by 21% over the past six decades, with Africa and Latin America experiencing up to 34% declines due to higher temperatures. This productivity gap highlights the need for innovative approaches to enhance agricultural productivity while addressing environmental challenges.
Regions vulnerable to food insecurity, including Sub-Saharan Africa and Southeast Asia, are experiencing intensified impacts from climate change, with substantial reductions in TFP driven by rising temperatures, unpredictable weather, and resource scarcity [12,13]. Alhassan [14] highlighted a paradox in agricultural development: increasing productivity fosters economic growth but risks worsening environmental degradation through land expansion and deforestation.
The motivation behind this research is driven by the need to address the pressing challenges of AP in the face of environmental degradation and socioeconomic disparities, especially in China. Given the increasing global demand for food and the detrimental effects of climate change, there is a critical need to explore how technological innovations can enhance AP while ensuring environmental sustainability. This study seeks to fill gaps left by past research by integrating technological advancements, socioeconomic factors, and environmental sustainability into a comprehensive analytical framework, aiming to provide a nuanced understanding of how these elements interact to shape agricultural productivity in a sustainable way. Key research questions guiding this study include the following: How do technological innovations influence agricultural productivity across different regions? What roles do socioeconomic and environmental factors play in optimizing these technological advancements for sustainable development? How can policy interventions support the adoption of such technologies while maintaining environmental integrity?
Technological advancements are pivotal for enhancing agricultural productivity (AP). Innovations in precision agriculture, mechanization, and biotechnology offer significant potential to boost productivity while reducing environmental harm [15,16,17]. Luan et al. [18] identified energy efficiency improvements in China’s agricultural sector, with an average energy efficiency score of 0.8492, suggesting a 15.08% growth potential. Huang et al. [19] emphasized the critical role of technology in driving sustainable agricultural productivity, particularly in China’s modernization efforts. A primary challenge is ensuring equitable access to these technologies for smallholder farmers in developing regions, as the accessibility of advanced agricultural innovations is essential for productivity and sustainability.
The increasing focus on environmental sustainability has elevated Green Total Factor Productivity (GTFP), which integrates agricultural output with environmental considerations such as carbon emissions and resource depletion [20]. GTFP provides a comprehensive measure, assessing both economic performance and ecological impact. Policies supporting green practices, including crop insurance and carbon trading systems, significantly improve GTFP [21,22]. This approach underscores the necessity of aligning agricultural productivity with sustainability goals to ensure growth while maintaining environmental integrity.
AP is influenced by the complex interaction of social, economic, and technological factors [15,23,24]. Key determinants include educational attainment, income levels, and rural infrastructure, which significantly affect farmers’ ability to adopt new technologies. Larger agricultural enterprises and cash crops gain more from productivity-enhancing policies than smaller farms and staple crops [21]. Furthermore, rural labor mobility, agricultural cooperatives’ structures, and government policy frameworks heavily impact productivity across regions.
Policy interventions play a critical role in shaping AP. Government strategies focused on infrastructure, financial support, and regulatory frameworks enable farmers to adopt sustainable practices [25]. Li et al. [24] reported that command-based regulations have the most significant effect on AP, followed by market-incentive and public-voluntary regulations, creating positive spillovers for local productivity. Rehman et al. [26,27] highlighted that policies reducing energy-intensive farming and encouraging low-input agriculture both increase productivity and reduce environmental harm. These policies are vital for balancing agricultural output with environmental sustainability.
This study investigates the relationships between technology, environmental sustainability, and agricultural productivity. Prior research often examines technological innovation or policy measures in isolation, leaving a gap in understanding how these factors integrate within a unified framework. As global food demand increases and environmental degradation intensifies, it is essential to analyze how these elements interact to promote sustainable agricultural productivity. Sethi et al. [28] suggest that integrating renewable energy, ICT, and agricultural credit promotes sustainable agricultural practices, enhancing environmental quality and productivity, particularly in developing countries.
The primary goal of this research is to assess the impact of technology-driven sustainable productivity on AP. The study examines the interplay between technological innovation, environmental conservation, and resource optimization in boosting agricultural output. Using provincial data from China (2012–2022), the research identifies key productivity determinants and provides policy recommendations that harmonize economic development with sustainability objectives. Schmutz and Schoeb [29] propose that selecting plant species familiar to local communities can effectively enhance agricultural productivity while maintaining ecosystem sustainability.
This study is anchored in the TFP framework, extending its focus to environmental and social dimensions. Traditional TFP models emphasize inputs like labor, capital, and land, but this research adopts a broader approach, incorporating technological innovation, environmental sustainability, and socioeconomic development. This multi-dimensional framework allows for a comprehensive evaluation of productivity within the context of sustainable development. Despite considerable research on AP, key gaps persist in integrating technology, environmental factors, and policy within TFP analysis. Existing studies tend to isolate these elements, neglecting their complex interactions. This study addresses these gaps by providing a comprehensive assessment of agricultural productivity determinants and introducing a new framework that explores how sustainability-driven, technology-enabled practices can improve agricultural outcomes.
This research employs fixed-effects, random-effects, and multilevel mixed-effects models, as well as structural equation modeling (SEM), to rigorously analyze the determinants of agricultural productivity. The fixed-effects model isolates the impact of key variables by controlling for unobserved, time-invariant factors, such as region-specific characteristics. The random-effects model captures both within-group and between-group variations, offering insights into how regional diversity affects productivity. By comparing these models, the analysis explores how individual and regional disparities influence productivity outcomes. The multilevel mixed-effects model addresses hierarchical data structures, accounting for provincial and temporal differences and analyzing interactions between macro-level policies and micro-level factors, such as rural education, technological training, and environmental conservation.
SEM is employed to explore the complex relationships between latent variables and observed factors, enabling the analysis of both direct and indirect effects on agricultural productivity. SEM allows for the modeling of multiple interdependencies and mediating pathways, particularly valuable in understanding how technological innovation, socioeconomic variables, and environmental factors jointly influence productivity outcomes. This method is chosen for its capacity to handle complex theoretical constructs and offer a comprehensive, systems-level view of productivity dynamics. The use of SEM provides a deeper insight into how various determinants interact to drive agricultural performance across regions and time.
In this paper, China provides a compelling case study for validating general models due to its vast and diverse landscape, rapid economic development, and complex sociopolitical structure. The country’s agricultural sector, in particular, offers a rich context for testing models related to technological innovation, agricultural productivity, and environmental sustainability. China’s implementation of policies like the 14th Five-Year Plan and the Action Plan for Seed Industry Revitalization highlights its focus on balancing food security with technological advancement and sustainability. By examining how these policies impact different regions within China—ranging from highly developed coastal areas to less-developed inland provinces—researchers can validate general models of economic development, policy efficacy, and technological diffusion. China’s unique mix of regional disparities, large-scale industrialization, and government intervention provides a robust framework for testing the applicability of global models in a localized context.
The significance of this study lies in its ability to address critical gaps in existing research by offering a comprehensive framework that integrates technological innovations, socioeconomic dynamics, and environmental sustainability into the analysis of agricultural productivity. Prior studies have often adopted a narrow focus—isolating technological advancements or policy interventions—without sufficiently exploring the intricate interactions between these elements. This study fills that void by thoroughly examining how these factors collectively influence agricultural productivity, especially within the broader context of sustainable development. Moreover, this research highlights the necessity of region-specific strategies tailored to address distinct socioeconomic and environmental contexts—an aspect that has been largely overlooked in previous research efforts [2,3,4,5,6,7,8,9,10,11,12].
This paper begins with an Introduction that outlines the research background, objectives, and significance. The Literature Review establishes the theoretical foundation by examining studies on agricultural productivity, technological innovations, and environmental sustainability. The Methods section details the variables and measurements, along with the model specification used. The Case Study section presents the data sources and descriptive statistics, explaining key variables and their relevance. In the Results section, findings are discussed through various models: panel data fixed- and random-effects models, the multilevel mixed-effects model, and structural equation modeling. The Discussion compares the four models, interprets the results, contrasts them with existing research, and provides policy implications. Finally, the Conclusion summarizes the key findings and suggests directions for future research.
2. Literature Review
The historical evolution of AP underscores its strong linkage with technological innovations, policy reforms, and environmental adaptations. (see Figure 1) Shifts in AP have been driven by advancements in agricultural technology, new policy frameworks, and responses to environmental challenges. Jelliffe et al. [30] report a near fourfold increase in agricultural output from 1961 to 2020, primarily due to AP improvements, particularly after the 1990s. During this time, developing countries expanded their global agricultural output share from 44% to 73%, with only a 7.6% increase in global land use.
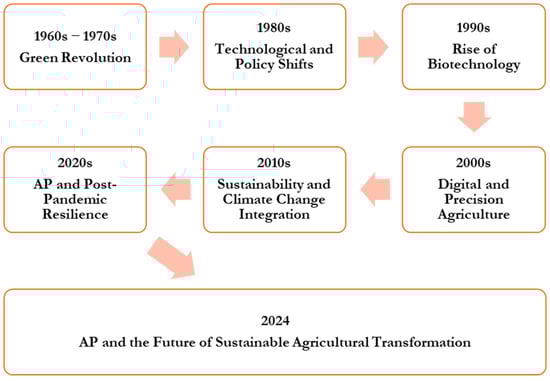
Figure 1.
The historical overview traces the evolution of AP across key periods.
Major technological advancements, including the Green Revolution of the 1960s–1970s, biotechnology in the 1990s, and digital and precision agriculture in the 2000s, have driven significant growth in AP by improving resource efficiency and yields. These innovations allowed for higher output with reduced inputs, directly influencing AP. The Green Revolution’s adoption of high-yield crops and irrigation systems, for example, led to a major increase in output without proportional input increases, marking a pivotal shift in AP. Hu et al. [31] emphasize that digital rural development has further enhanced AP, particularly in regions with strong infrastructure and human capital.
Policy reforms have also played a key role in shaping AP. In the 1980s, regions like the European Union and the United States implemented subsidies and regulations to promote sustainable practices. More recent policies, such as carbon trading and net-zero carbon agriculture, outlined by Rehman et al. [26,27], have aligned agricultural productivity with sustainability goals, fostering AP growth. Initiatives like the European Green Deal and China’s National Agriculture Modernization Plan underscore the importance of government intervention in promoting AP by encouraging the adoption of green technologies.
Environmental challenges, especially climate-related disasters, have forced the agricultural sector to adopt more resilient and sustainable practices, significantly impacting AP. Chen et al. [32] highlight the increasing relevance of GTFP, which incorporates carbon emissions and resource conservation into AP measurement. Yu et al. [22] note that carbon-trading pilot policies have positively influenced AP by promoting sustainability without compromising productivity. The 2020s’ focus on carbon neutrality, agroecology, and regenerative agriculture further demonstrates the ongoing influence of environmental factors on AP.
The 2024 trajectory of AP illustrates the significant influence of technological, policy, and environmental advancements. Technologies like AI-driven precision agriculture, blockchain for traceability, and renewable energy applications are transforming resource efficiency and sustainability, driving AP growth [16]. Wen et al. [33] show that integrating digital tools and fuzzy systems has significantly boosted AP in China by alleviating labor shortages and resource constraints. The alignment of technological, policy, and environmental frameworks is essential for sustaining future AP growth.
The dynamic interaction between technological, policy, and environmental shifts highlights the evolving nature of AP. Integrating these elements has enabled productivity gains while promoting resource management and environmental stewardship, ensuring long-term resilience and sustainability. Omotoso et al. [6] emphasize that expanding Climate-Smart Agriculture among South African farmers is vital for enhancing productivity and food security, advancing the FAO’s sustainable agriculture objectives.
China’s strategy in shaping its agri-food sectors has been comprehensively laid out through a series of key policy documents. These include the “14th Five-Year Plan for National Economic and Social Development and Long-Range Objectives Through the Year 2035” (14th Five-Year Plan 2021–2025)”, the “Opinions of the Central Committee of the Communist Party of China and the State Council on Strengthening Reform and Innovation to Accelerate Agricultural Modernization” (OSRI), and the “Action Plan for Seed Industry Revitalization” (APSI) [34,35].
The OSRI has been pivotal in guiding agricultural policy. In 2024, it reinforced the importance of food security and rural revitalization as national priorities, focusing on increasing crop yields, advancing agricultural modernization, and improving rural governance. These policies emphasize not only the enhancement of agricultural productivity but also the development of rural infrastructure and governance capacities.
In concrete terms, the Chinese government set a goal to achieve a 65% mechanization rate in major crop cultivation by 2025. This target is clearly outlined in the 14th Five-Year Plan 2021–2025. Alongside this, green agriculture and sustainable development have become focal points of national initiatives. The APSI exemplifies the government’s support for technological innovation in agriculture, particularly in seed technology, digital agriculture, and precision agriculture. This plan seeks to enhance China’s global agricultural competitiveness by fostering innovation in seed research and biotechnology [36].
To support technological innovation in agricultural productivity, the government has implemented several funding programs. These include initiatives to promote precision agriculture and mechanization, utilizing technological advancements to improve production efficiency and push the agricultural sector towards modernization.
China’s agri-food policies have been strategically designed to balance the needs for food security, productivity growth, and technological innovation. Clear goals have been established to achieve long-term agricultural modernization and sustainable development, laying a solid foundation for the transformation and sustained growth of the sector.
The provided information underscores the European Union’s comprehensive efforts to transform its agri-food system through key policy frameworks, notably the European Green Deal and the Common Agricultural Policy (CAP). The Farm to Fork strategy, a central pillar of the European Green Deal, seeks to establish a sustainable, resilient food system by advocating for environmentally conscious agricultural practices. Despite its ambitious goals, the strategy has faced implementation challenges, preventing its progression to later phases [37].
Conversely, the updated CAP has taken on a crucial role in shaping agricultural policy across the EU, focusing on fostering sustainable agricultural growth, securing equitable income for farmers, and supporting rural development. The CAP’s recent iterations include targeted financial instruments designed to encourage innovation, strengthen sustainability, and enhance the sector’s resilience [38].
Moreover, a strategic dialogue with key stakeholders has resulted in a high-level report, which offers forward-looking recommendations for reforming the food system, aiming to address shortcomings and challenges identified during earlier stages of policy execution. This dialogue reflects the EU’s ongoing commitment to improving sustainability across the agricultural sector [39].
These EU initiatives reflect a broader commitment to sustainable agriculture, mirroring China’s policy emphasis on modernizing its agricultural system. While the EU is deeply invested in promoting sustainability through policies such as the Green Deal and CAP, China’s agricultural strategies—outlined in documents like the 14th Five-Year Plan and the Action Plan for Seed Industry Revitalization—focus on technological innovation and ensuring national food security. This parallel yet distinct approach highlights the unique policy priorities of each region, driven by their respective agricultural and economic contexts.
AP is a comprehensive measure of resource efficiency, encompassing labor, capital, and land (see Table 1). It is crucial for assessing the effectiveness of resource allocation, especially in areas with environmental and resource constraints [11]. Wen et al. [33] emphasize the significant impact of labor dynamics on China’s AP, suggesting that digital and technological solutions can alleviate these challenges. Rehman et al. [26,27] highlight agriculture’s critical role in promoting sustainability and reducing carbon emissions, demonstrating that sustainable practices enhance both productivity and ecological health. Li et al. [40] find that agricultural insurance and pollution control policies greatly improve AP, establishing insurance as a key tool for managing agricultural risks.

Table 1.
Agricultural productivity metrics: AP, TFP, and GTFP.
Fang et al. [21] show that crop insurance significantly improves AP, especially in larger operations, with stronger effects on cash crops compared to staple crops. Huang et al. [19] argue that technological advancements are key to AP growth, supported by energy conservation and emissions reduction. Hu et al. [41] emphasize financial inclusion’s role in enhancing AP by promoting specialized and cooperative production models. Yu et al. [22] underscore the importance of carbon trading policies in boosting AP by reducing emissions without compromising output. Chena et al. [42] find that land certification and efficient leasing can raise regional productivity by 43%, while Sun [43] argues that environmental regulations influence AP more than technological innovation. Hong et al. [44] demonstrate that digital financial inclusion drives AP, with structural agricultural optimization yielding significant growth.
TFP is a crucial indicator for assessing input efficiency, such as labor and capital, across sectors, especially agriculture (see Table 1). TFP evaluates how sectors optimize input use to promote economic growth without increasing resource consumption. In agriculture, TFP analyzes the effects of technology and capital investments on output, addressing regional productivity disparities and the role of institutional and socioeconomic frameworks [19]. GTFP expands traditional metrics by incorporating environmental sustainability elements like carbon emissions, water use, and resource depletion (see Table 1). GTFP aligns productivity with global sustainability goals, balancing productivity growth with environmental impact, particularly in climate-affected regions [21,22].
AP, TFP, and GTFP differ in focus and methodology (see Table 1). AP is specific to agriculture, measuring input efficiency such as labor and technology. TFP applies across various sectors, while GTFP incorporates environmental factors, offering a more comprehensive assessment of productivity with sustainability considerations. As environmental preservation gains importance, GTFP becomes increasingly essential for evaluating productivity [45].
Methodological rigor is critical in productivity evaluation. Fixed- and random-effects models control for unobserved, time-invariant factors, while multilevel mixed-effects models capture the hierarchical structure of data. These models facilitate an in-depth analysis of how technological innovations, environmental policies, and socioeconomic factors influence agricultural productivity. By addressing regional and temporal variations, they enhance the robustness of the assessment [19,26].
Technological advancements, such as precision farming, biotechnology, and mechanization, are pivotal in boosting productivity by improving resource efficiency and reducing waste. However, financial constraints and infrastructure challenges limit technology adoption in developing regions. Policy interventions play a key role in overcoming these barriers, ensuring equitable access to productivity-enhancing technologies [19].
Incorporating environmental sustainability into productivity metrics is crucial for balancing output with ecological preservation. GTFP provides a framework for assessing productivity while minimizing environmental impact, particularly through strategies like carbon management, water conservation, and sustainable land use. This integration ensures agricultural resilience in the face of climate change, making GTFP indispensable for policymakers aiming to meet both economic and environmental objectives [45].
Socioeconomic factors, such as education, infrastructure, and rural labor mobility, are crucial in shaping AP. Regions with higher education levels and better infrastructure are more capable of adopting new technologies and practices. Labor mobility facilitates the dissemination of agricultural innovations, boosting productivity. However, socioeconomic disparities lead to uneven productivity gains, particularly in areas with limited access to resources and technology. Addressing these disparities is essential for achieving equitable productivity growth across sectors [21]. Boahen et al. [46] report that female cereal growers in Ghana experience 46% lower productivity than males due to unequal access to land and inputs.
Government policies play a crucial role in shaping AP. Infrastructure development, financial support, and regulatory frameworks are key to promoting sustainable practices. Policies that integrate green technologies and reduce energy-intensive farming support both productivity growth and environmental conservation. Tailored interventions, addressing the specific needs of regions, are essential for overcoming challenges unique to each agricultural sector, ensuring alignment with broader economic and environmental sustainability goals [26,27,45]. Espoir et al. [47] emphasize that intra-African agricultural trade and governance affect AP differently across regional economic communities, highlighting the need for region-specific policies.
Despite progress in agricultural productivity research, gaps persist, particularly in integrating AP, TFP, and GTFP into a cohesive framework. Many studies focus on individual factors, such as technology or environmental impact, without fully exploring their interactions. Future research should adopt a holistic approach, accounting for the multi-dimensional nature of agricultural productivity. Longitudinal studies on the long-term effects of policy interventions and technological advancements on AFTP, TFP, and GTFP would offer valuable insights into how these measures can be harmonized to foster sustainable agricultural growth [11].
3. Methods
3.1. Variables and Measurements
This section outlines the variables used in the study, offering detailed analysis regarding their significance to agricultural productivity, especially within the AP framework (see Table 2). The selection process for the 14 variables in this study was grounded in an extensive review of the existing literature on AP, focusing on technological, socioeconomic, and environmental factors. These variables were chosen through a combination of theoretical relevance and empirical validation. The researchers considered factors critical to agricultural innovation and sustainability, such as technological advancements (e.g., rural education, technological training), environmental considerations (e.g., forest coverage rate, ammonia nitrogen emissions), and socioeconomic factors (e.g., rural labor mobility, agricultural investment). Provincial-level data spanning from 2012 to 2022, sourced from official statistical publications, were used to ensure a comprehensive and regionally specific analysis. Key government policy documents, such as the 14th Five-Year Plan, were also instrumental in identifying these variables as crucial determinants of AP in China’s diverse regions.
Table 2.
The variables and measures of the lens of AP.
(1) Per Capita Output of the Primary Industry (PCOPI): This key indicator measures AP by dividing the total output of the primary agricultural sector by the number of workers in it, directly assessing labor productivity and reflecting how efficiently labor inputs are converted into outputs. This metric is crucial for analyzing the effects of technological advancements, environmental conditions, and socioeconomic variables on regional agricultural productivity.
Technological and Skill Capacity Building (TSCB) comprises both educational foundations and specialized technical training, essential for enhancing AP. Rural Education Evaluation (REE) assesses the formal education and specialized knowledge of rural laborers, forming the basis for skill development and advanced agricultural practices. Agricultural Technical Training (ATT) provides structured programs aimed at improving proficiency in modern agricultural technologies, directly enhancing operational efficiency and innovation. These elements emphasize the critical role of human capital and technology adoption in boosting AP, ensuring that laborers possess both knowledge and technical skills for implementing innovative solutions, improving output and sustainability.
(2) Rural Education Evaluation (REE): This variable, measured by the average years of schooling among rural laborers, reflects their skill and knowledge level. It directly influences the ability to adopt new technologies. As a key component of human capital, education improves labor productivity. In the econometric model, rural education is treated as a continuous variable, hypothesizing a positive impact on AP due to better labor quality and increased adoption of advanced farming techniques.
(3) Agricultural Technical Training (ATT): This independent variable is measured by the proportion of farmers who have received technical training relative to the rural population. It reflects the ability of rural labor to engage with modern technologies. In the econometric framework, ATT is treated as a continuous variable, with an expected positive impact on AP due to improved technical skills.
Socioeconomic dynamics (SED) includes factors that shape economic conditions and labor structures in rural areas, significantly influencing AP. Rural Disposable Income (RDI) represents rural households’ financial capacity, affecting their ability to invest in inputs and technologies. Rural Population (RP) indicates the available labor and potential strain on natural resources, while Rural Employment (RE) measures the proportion of the rural workforce in agriculture, highlighting the role of human capital in agricultural output. These variables are crucial for understanding how economic well-being and labor availability influence AP.
(4) Rural Disposable Income (RDI): This variable measures the income of rural households, reflecting their economic capacity and purchasing power. Higher income levels facilitate investment in superior agricultural inputs, such as seeds, fertilizers, and equipment, which can lead to increased productivity. RDI also indicates farmers’ ability to adopt new technologies and improve their farming practices.
(5) Rural Population (RP): This variable represents the total population in rural areas, influencing agricultural productivity. A larger rural population implies greater labor availability for agricultural activities, but it may also suggest increased pressure on land and resources, potentially resulting in lower per capita productivity if resources are not managed effectively.
(6) Rural Employment (RE): This variable measures the number of individuals employed in agriculture within rural areas. A higher employment rate might indicate labor-intensive agricultural practices, while a lower rate could suggest mechanization or a shift towards more efficient production methods. The relationship between labor and productivity varies depending on the level of mechanization and technology adoption. Akram-Lodhi [48] highlights the need to consider the intersection of reproductive and productive labor to develop more inclusive agricultural policies.
Agricultural Development Resources (ADRs) encompass key elements that drive agricultural productivity, focusing on infrastructure, financial investments, and labor dynamics. Rural Labor Mobility (RLM) refers to the movement of labor between rural and urban areas or across sectors, impacting the availability of agricultural labor. While migration can reduce the farming workforce, it also generates remittances that may be reinvested in rural economies, contributing to productivity enhancement. Agricultural Investment (AI) underscores the role of financial capital in infrastructure, machinery, and technology, which are essential for modernizing agricultural practices and improving output efficiency. Rural Roads (RRs) assess the quality and scope of transportation infrastructure, crucial for lowering logistical costs and enhancing access to markets, agricultural inputs, and services. An efficient road network facilitates faster, more reliable transportation, thereby supporting higher productivity levels. Public Spending on Agriculture (PSA) represents the government’s fiscal commitment to the agricultural sector, including subsidies, research, and infrastructure development. Public investment fosters innovation, the adoption of technology, and sustainable practices, all of which are critical for increasing AP.
Patel [49] suggests that while public works programs and rural–urban migration are widely used strategies, raising agricultural productivity is more effective for poverty alleviation in rural India. Investments in agricultural infrastructure are critical to productivity gains. Hassan and Mohamed [10] highlight that increasing domestic investment, particularly when combined with infrastructure and human capital development, plays a substantial role in boosting long-term agricultural output.
(7) Rural Labor Mobility (RLM): This variable measures the percentage of rural workers migrating for employment, reflecting labor shifts from rural areas to urban centers or other sectors. While reducing the available agricultural workforce, labor mobility increases remittances that can be reinvested in farming improvements. Ramzan et al. [50] show that labor force, land use, and fertilizer inputs significantly influence agricultural productivity.
(8) Agricultural Investment (AI): This variable represents financial investments in agriculture, including machinery, irrigation systems, and capital inputs. Investment in agriculture enhances productivity by modernizing practices and infrastructure, improving output efficiency. Li et al. [51] emphasize reducing machinery costs and promoting land leasing to further boost productivity.
(9) Rural Roads (RRs): Measuring the total length of rural roads, this variable indicates infrastructure quality. Well-developed road networks are essential for transporting agricultural goods, reducing input costs, and improving access to technology and training. Enhanced infrastructure improves productivity by facilitating market access and minimizing logistical barriers.
(10) Public Spending on Agriculture (PSA): This variable captures government expenditure on agriculture, including subsidies, infrastructure, and research. Public investment supports farmers, enhances productivity, and promotes sustainable practices. Increased spending is expected to boost productivity by providing resources for adopting modern techniques.
Environmental Impact and Resource Sustainability (EIRS) focuses on managing the ecological effects of agriculture while promoting sustainability. Ammonia Nitrogen Emissions from Agricultural Wastewater (ANEAW) measure the amount of ammonia nitrogen released, which degrades water and soil quality, posing risks to ecosystems and crop health. Chemical Oxygen Demand in the Primary Industry (CODPI) tracks organic pollutants from agricultural activities, indicating environmental impact. High COD levels can contaminate water, harming ecosystems and agricultural sustainability. Proportion of Environmental Protection Spending (PEPS) reflects government efforts to mitigate agricultural pollution and support sustainability initiatives. This investment is vital for reducing ecological damage and ensuring sustainable productivity growth. Forest Coverage Rate (FCR) underscores forests’ role in preserving biodiversity, regulating water cycles, and preventing soil erosion—key factors for sustaining productivity.
(11) Ammonia Nitrogen Emissions from Agricultural Wastewater (ANEAW): This variable measures ammonia nitrogen pollution in agricultural wastewater, a key indicator of water contamination from farming. High ammonia nitrogen levels harm aquatic ecosystems, reduce soil fertility, and negatively affect crop yields. Sohail et al. [52] highlight the health risks of using industrial wastewater for irrigation, especially in water-scarce regions.
(12) Chemical Oxygen Demand in the Primary Industry (CODPI): COD measures organic pollutants from agricultural production. High COD levels in irrigation water degrade soil health and reduce crop yields, lowering agricultural productivity. Sohail et al. [52] discuss the risks of using industrial wastewater for irrigation, noting the potential damage to crops and soil from harmful chemicals, despite its lower cost.
(13) Proportion of Environmental Protection Spending (PEPS): This variable tracks the share of government spending on environmental protection, reflecting investment in pollution control and sustainability. Efforts like soil erosion control and water resource management are vital for maintaining long-term productivity. Increased spending on environmental protection is expected to positively impact sustainable agricultural output.
(14) Forest Coverage Rate (FCR): This variable measures the percentage of rural land covered by forests, indicating ecological health and environmental quality. Forests support biodiversity, improve soil quality, and regulate water cycles, all contributing to sustainable agricultural practices. Healthy forests enhance productivity by improving environmental conditions.
3.2. Model Specification
This study employs a comprehensive approach to assess the factors affecting AP by integrating a panel data fixed-effects model (FEM), a random-effects model (REM), a multilevel mixed-effects model (MLM), and SEM. The models and mathematical expressions used in this study represent a combination of original development by this paper and adaptations from existing research. Specifically, while the MLM and SEM were customized to fit the unique socioeconomic and environmental variables relevant to Chinese agricultural productivity, the foundational frameworks, such as FEMs and REMs, are well-established in previous academic works.
These methodologies enable the analysis of socioeconomic, environmental, and technological variables, accounting for regional and temporal variations. FEMs control for unobserved, time-invariant characteristics like geography or policy history, assuming these factors are correlated with independent variables. This model is particularly useful for isolating within-region variations and aligns with Human Capital Theory, which links education, training, and labor mobility to productivity gains. REMs, in contrast, assume province-specific factors are uncorrelated with the independent variables, making it well-suited for exploring both within- and between-region variations, offering insights into cross-regional disparities in resource allocation and economic development [53].
The MLM captures interactions between macro-level and micro-level variables, making it ideal for studying how socioeconomic, environmental, and technological factors impact productivity across regions and over time. By accounting for individual and group-level variations, the MLM effectively examines the role of infrastructure, policies, and labor mobility in shaping outcomes. SEM provides a comprehensive approach to examining causal relationships between latent constructs, such as technological skill capacity and socioeconomic dynamics, while capturing the indirect effects of environmental and socioeconomic factors on agricultural productivity. Together, these models provide a nuanced analysis of how technological, socioeconomic, and environmental factors interact across regions, offering key insights for optimizing productivity while maintaining sustainability.
The FEM controls for unobserved, time-invariant characteristics that may influence the dependent variable, such as the PCOPI. It assumes these unobserved factors are correlated with the independent variables, allowing for an analysis of within-region variations by controlling for region-specific constant characteristics. The model is mathematically represented as
where is the dependent variable (PCOPI for province i at time t), represents the province-specific fixed effect, and is the matrix of independent variables. β is the coefficient that measures the effect of the independent variable on the dependent variable . represents the random error term.
In an FEM, the hypotheses (–) test the relationship between each variable and PCOPI, while accounting for constant, unobserved characteristics across provinces.
–: REE, ATT, RDI, RP, RE, RLM, AI, RRs, PSA, FCR, PEPS, CODPI, and ANEAW are each hypothesized to significantly impact PCOPI.
The REM, by contrast, assumes that the individual effects are not correlated with the independent variables, considering both within-region and between-region variations. Its mathematical representation is as follows:
where captures the random effect for each province, reflecting between-province variation.
In an REM, the hypotheses () test the relationship between each variable and PCOPI, while accounting for constant, unobserved characteristics across provinces.
: REE, ATT, RDI, RP, RE, RLM, AI, RRs, PSA, FCR, PEPS, CODPI, and ANEAW are each hypothesized to significantly impact PCOPI.
Both models examine variables such as ATT and RDI but differ in how they treat unobserved province-specific factors. The FEM assumes a correlation between these factors and independent variables, while the REM assumes no correlation.
The MLM is used to analyze hierarchical data structures, accounting for variations across provinces and time periods while controlling for both individual and group-level effects. This model is ideal for examining complex interactions among factors such as rural labor dynamics, environmental variables, and technological adoption, all of which influence AP. The MLM captures these variable interactions across regions and over time. Its mathematical representation is as follows:
where represents time-specific random effects, capturing time-related factors like policy changes and national economic conditions.
The hypotheses () outlined above connect the independent variables with their expected effects on AP, which means
: REE, ATT, RDI, RP, RE, RLM, AI, RRs, PSA, FCR, PEPS, CODPI, and ANEAW are each hypothesized to significantly impact PCOPI.
These hypotheses aim to understand how socioeconomic, technological, and environmental factors interact across multiple levels to shape AP. The MLM allows for a detailed investigation of these relationships, identifying key drivers of productivity and sustainability in agriculture.
The previous section explored the varying influences of different factors on agricultural productivity at individual and temporal levels. However, the mechanisms by which these factors exert their influence remain unclear. To clarify this, a PLS-SEM approach is used to analyze the pathways affecting productivity.
PLS-SEM is chosen due to the nature of the variables—only three are reflective indicators, while the rest are formative. The complexity of the model, involving chain mediation, makes PLS-SEM suitable for handling both formative indicators and complex models. Before the PLS-SEM analysis, latent variables and their observed variables are defined, as shown in Table 3.
Table 3.
Variable definitions.
SED is a reflective variable because its indicators overlap conceptually and are interchangeable. Other latent variables have distinct, non-interchangeable components and are classified as formative.
SEM (see Figure 2) is used to analyze relationships between multiple variables and latent constructs affecting AP, represented by PCOPI. SEM enables the examination of complex multivariate interactions, offering insights into how various factors influence agricultural efficiency.
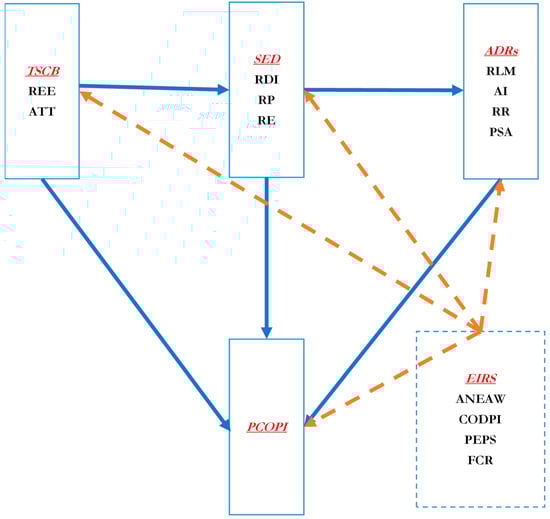
Figure 2.
Structural equation modeling.
Figure 2 shows that SED mediates the relationship between TSCB and PCOPI by shaping key drivers such as economic conditions, labor structure, and rural activities. SED improves human capital, positively impacting income, employment, and rural economic stability—critical for AP. Lu et al. [16] found that rural digitalization fosters entrepreneurship, accounting for 3.34% of AP’s total effect, emphasizing the role of entrepreneurship in leveraging digitalization. Bocean [53] combined SEM and cluster analysis to assess digital technology’s impact on agricultural productivity.
ADRs mediate the relationships between SED, TSCB, and PCOPI. ADRs represent infrastructure, financial investments, and labor dynamics, translating socioeconomic improvements into practical resource allocations, such as enhanced infrastructure and financial support, which are critical for boosting agricultural productivity.
The link between TSCB and PCOPI is first mediated by SED, which improves the socioeconomic environment, and then by ADRs, which turn these socioeconomic gains into tangible agricultural outcomes. Investments in education and skills development enhance human capital, creating a more stable rural economy, while ADRs provide the necessary resources to support increased agricultural efficiency. This layered mediation highlights the interconnectedness of education, socioeconomic conditions, and resource development in fostering sustainable agricultural growth. Hu et al. [31] note that rural inclusive finance and human capital also mediate the relationship between digital development and AP, advocating for targeted policies to strengthen these factors and promote sustainable growth.
Moderating variables like ANEAW, CODPI, PEPS, and FCR affect the relationships between TSCB, SED, ADRs, and PCOPI. ANEAW reduces farmers’ ability to translate economic gains into productivity due to pollution. Elevated CODPI levels lower the effectiveness of SED and ADRs by contaminating natural resources. PEPS ensures socioeconomic improvements and resource investments lead to long-term productivity without depleting natural resources, while FCR provides ecological stability, supporting sustainable agricultural practices and fostering long-term growth.
Its mathematical representation is as follows:
PCOPI = + + + + + + + + + + + + + + + (SED×ANEAW) + + + + + + + +.
are the coefficients measuring the impact of each latent variable on PCOPI. is residual error term.
Since SED is the only reflective latent variable, tests for internal consistency (Cronbach’s α), composite reliability (CR), and average variance extracted (AVE) are performed only for this variable. For formative variables, external loadings (OL) and variance inflation factors (VIF) are reported. Table 4 presents the results of these assessments.
Table 4.
Reliability and validity testing.
From Table 4, Cronbach’s alpha for SED is 0.36, indicating low internal consistency. However, the CR of 0.90 suggests sufficient reliability for the latent variable. The AVE of 0.54 indicates that slightly over half of the variance in the observed variables is explained by the latent variable. RDI shows a strong OL of 0.87, while RP and RE exhibit negative outer loadings (−0.65), indicating poor representation of the human capital construct. High VIF values for RP (5.66) and RE (5.65) suggest multicollinearity, inflating variance and complicating estimation.
For PCOPI, both OL and VIF are ideal at 1.00, indicating perfect representation and no multicollinearity issues. Within TSCB, REE has a strong OL of 0.88, showing effective representation of education efficiency, while ATT has a weaker OL of 0.62, though both variables show low VIF values, indicating no significant multicollinearity.
For ADRs, the results are mixed. RLM has a weak OL of 0.26, contributing little to the economic environment construct, while AI has a strong OL of 0.92, highlighting agricultural investment as a key indicator. RRs and PSA show negative outer loadings (−0.33 and 0.35), with PSA also showing a high VIF (1.98), indicating some multicollinearity and potentially affecting model accuracy.
The EIRS variable has perfect OLs and VIFs (1.00) for ANEAW, CODPI, PEPS, and FCR, showing strong representation of the environmental effectiveness construct with no multicollinearity issues.
Regarding model fit, the value for PCOPI is 0.65, meaning 65% of the variance in agricultural productivity is explained by the independent variables, with an adjusted of 0.64. For SED, the is 0.38 and the adjusted is 0.37, reflecting an acceptable fit in social science models. ADRs’ and adjusted are both 0.66, indicating a strong fit, explaining 66% of the variance in the economic environment construct.
The following hypotheses outline the relationships among key variables (TSCB, SED, ADRs, PCOPI) and the effects of moderating variables (ANEAW, CODPI, PEPS, FCR) on these relationships.
(1) Direct Effects Hypotheses:
: TSCB has a positive and significant effect on PCOPI.
: SED has a positive and significant effect on PCOPI.
: ADRs have a positive and significant effect on PCOPI.
The rationale of is that investments in technological training and skill development enhance the efficiency of the agricultural workforce, resulting in increased productivity. The rationale of is that improvements in socioeconomic conditions, such as higher income, employment, and enhanced rural economic activities, increase agricultural productivity by facilitating better access to resources and markets. The rationale of is that investments in agricultural infrastructure, financial resources, and technology directly improve agricultural efficiency and output.
(2) Mediation Effects Hypotheses:
: SED mediates the relationship between TSCB and PCOPI.
: ADRs mediate the relationship between SED and PCOPI.
: ADRs mediate the relationship between TSCB and PCOPI.
The rationale of is that enhanced human capital through technological and skill development leads to improved socioeconomic conditions, which subsequently drive agricultural productivity. The rationale of is that socioeconomic advancements lead to greater investments in agricultural resources, which directly result in productivity improvements. The rationale of is that investments in technological and skill capacity not only improve human capital but also lead to resource allocation in agriculture, which further enhances productivity.
(3) Moderation Effects Hypotheses:
: ANEAW negatively moderates the relationships between TSCB, SED, ADRs, and PCOPI.
: CODPI negatively moderates the relationships between TSCB, SED, ADRs, and PCOPI.
: PEPS positively moderates the relationships between TSCB, SED, ADRs, and PCOPI.
: FC positively moderates the relationships between TSCB, SED, ADRs, and PCOPI.
The rationale of is that high levels of ammonia nitrogen emissions reduce the ability of farmers to translate training, socioeconomic gains, and resource investments into productivity gains due to environmental degradation. The rationale of is that elevated CODPI levels signal pollution that damages essential agricultural resources such as water and soil, diminishing the positive impacts of socioeconomic dynamics and resource investments on productivity. The rationale of is that higher spending on environmental protection ensures that socioeconomic gains and resource investments contribute to sustainable long-term productivity without depleting natural resources. The rationale of is that greater forest coverage provides ecological stability, supporting sustainable agricultural practices and enhancing the long-term effects of training, socioeconomic improvements, and resource investments on productivity.
(4). Case Study: Data Source and Descriptive Statistics
The data used in this study spans from 2012 to 2022, sourced from official statistical publications, including the China Statistical Yearbook, China Rural Statistical Yearbook, China Environmental Statistical Yearbook, and China Education Statistical Yearbook, with additional data from the China Rural Policy and Reform Statistical Yearbook. Provincial yearbooks supplement these sources, creating a comprehensive dataset that includes agricultural productivity indicators, environmental metrics, and socioeconomic variables across provinces [45,54]. The wide range of data ensures an accurate reflection of key agricultural and environmental factors necessary for analyzing AP.
This multi-dimensional dataset captures the main drivers of productivity, including ecological impacts of agricultural practices and socioeconomic conditions influencing rural labor dynamics. By accounting for region-specific characteristics, it provides detailed insights into the relationship between agricultural inputs and environmental outcomes. Additionally, the data from the Pipixia Database, curated by the Pixia Team, adds a reliable empirical foundation to the analysis [55]. This thorough data compilation is critical for understanding the factors influencing AP across Chinese provinces during the study period.
The descriptive statistics in Table 5 and Figure 3 reveal the following trends: (1) PCOPI: The mean value of 0.0003 with a standard deviation of 0.0002 indicates limited variability across regions and time. The minimum of 0.00007 and maximum of 0.001 show some regional and temporal differences, but overall, per capita productivity in the agricultural sector remains constrained, likely reflecting the slower modernization compared to industrial sectors. (2) REE: The mean of 7.81 years, with a standard deviation of 0.61 and a range of 5.85 to 9.91, reflects progress in rural education. However, some regions lag behind. This improvement is due to government investments in human capital, crucial for boosting productivity and diversifying the rural economy.
Table 5.
The descriptive statistics of the lens of AP.
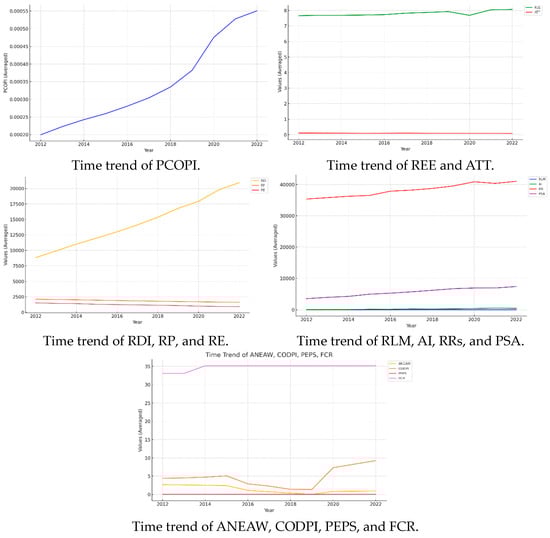
Figure 3.
Time trend of the lens of AP.
(3) ATT: The average of 0.09, with a larger standard deviation of 0.12 and values ranging from −0.13 to 0.51, highlights significant regional disparities in technology adoption, likely due to uneven access to training and infrastructure. (4) RDI: The mean income is RMB 14,519.42, with a standard deviation of 6256.13 and values ranging from RMB 4931.12 to 39,729.42, indicating significant economic disparities across rural areas.
(5) RP: The average rural population is 1857.08, with a standard deviation of 1253.79 and a range from 203 to 5530. Population declines in some areas reflect urban migration for better employment opportunities. (6) RE: The mean rural employment is 1199.82, with a standard deviation of 836.31 and values ranging from 99 to 3507.49, showing variation based on local economic structures and reliance on agriculture.
(7) RLM: The mean labor mobility is 0.67, with a standard deviation of 0.29 and a range from 0.04 to 1.60, suggesting a dynamic labor market where workers frequently move across regions and industries for better opportunities. (8) AI: The average agricultural investment is RMB 231.15, with a high standard deviation of 181.25, and values ranging from RMB 0.06 to 758.68. This significant variation reflects differences in regional investment levels, essential for modernizing agriculture and improving productivity. The disparities suggest varying degrees of government support, private investment, and financial access.
(9) RRs: The average length of rural roads is 38,222.5 km, with a standard deviation of 28,600.28, ranging from 3585.27 to 114,187 km. This wide variation highlights disparities in infrastructure development, which is crucial for market access, transportation, and labor mobility. (10) PSA: The mean public spending on agriculture is RMB 5634.67, with a standard deviation of 3111.47 and values from RMB 864.36 to 18,533.10. These differences reflect uneven resource allocation across regions, with wealthier areas likely receiving more funding, leading to greater productivity.
(11) ANEAW: The average ammonia nitrogen emissions from agricultural wastewater is 1.38, with a standard deviation of 1.62 and values from 0 to 7.41. Higher emissions typically correspond to more intensive farming practices, especially in livestock farming. (12) CODPI: The mean chemical oxygen demand in the primary industry is 4.69, with a large standard deviation of 6.91 and values ranging from 0 to 52.29, indicating significant regional pollution due to intensive agricultural and industrial activities.
(13) PEPS: The average environmental protection spending is 0.03%, with a standard deviation of 0.009, ranging from 0.01% to 0.07%. This low range suggests limited prioritization of environmental policies in some regions, highlighting the need for greater investment in sustainability. (14) FCR: The mean forest coverage rate is 34.77%, with a standard deviation of 18.16%. Coverage ranges from 4.2% to 66.8%, showing considerable differences in environmental focus and forest management, influenced by local climate and geographical conditions.
Z-score normalization was used to standardize data across variables with differing units. Missing data was imputed through linear interpolation, preserving dataset integrity and ensuring robust, consistent analysis across variables.
4. Results
4.1. Panel Data Fixed- and Random-Effects Models
The results in Table 6 compare the random-effects (Column 1) and fixed-effects (Column 2) models, analyzing the determinants of PCOPI. Coefficients reflect the relationships between independent variables and PCOPI, with standard errors in parentheses.
Table 6.
Comparison of random-effects and fixed-effects results.
Both models show a significant negative effect of REE on PCOPI, with coefficients of −0.18 and −0.21, suggesting that as rural education levels rise, per capita output in the primary industry declines. This may be due to higher education driving a shift away from agricultural employment to non-agricultural sectors.
RDI has a highly significant and positive relationship with PCOPI in both models, with a coefficient of 0.67, indicating that higher Rural Disposable Income boosts agricultural productivity by increasing demand and enabling greater investment. RP is significant only in the random-effects model (coefficient −0.34), implying that a larger rural population negatively affects per capita output, likely due to resource constraints or dilution. The lack of significance in the fixed-effects model suggests region-specific factors diminish this relationship.
The REM has a significant positive effect in both models (coefficients of 0.29 and 0.40), indicating that increased rural employment enhances agricultural productivity. RLM also shows a strong positive effect, with coefficients of 0.48 and 0.59, suggesting that greater labor mobility improves productivity, as workers seek better opportunities or adapt to economic shifts.
Variables such as ATT, AI, RRs, PSA, ANEAW, CODPI, and PEPS do not show statistically significant effects on PCOPI in either model, suggesting they may not directly impact productivity or require further study. FCR is significant in the fixed-effects model with a negative coefficient (−1.14), indicating that higher forest coverage may reduce per capita output by limiting land available for agriculture.
The values reveal the random-effects model explains 49% of PCOPI variation, while the fixed-effects model explains 84%, showing the fixed-effects model provides a better fit, accounting for unobserved regional differences.
Hypotheses (, , , , and ) for REE, RDI, RE, RLM, and FCR are supported in the fixed-effects model, while hypotheses (, , , , and ) for REE, RDI, RP, RE, and RLM are supported in the random-effects model. Both models do not support the hypotheses for ATT, AI, RRs, PSA, PEPS, CODPI, and ANEAW.
4.2. Multilevel Mixed-Effects Model
The FEM highlights provincial differences in PCOPI, though controlling only for individual factors proves insufficient given the complexity of productivity mechanisms. Subgroup regression can explore differences but often suffers from reduced statistical power. Therefore, a MME model is employed to examine variations across provinces and time.
The MME model captures group-level differences through random effect coefficients, as shown in Table 7. Significant coefficients indicate distinct impacts across groups. Column (3) organizes data by provinces, and column (4) organizes data by years. Variables such as RDI, RLM, FCR, PEPS, ANEAW, and PSA are included for each province, reflecting variations in economic conditions, natural resources, and environmental policies. S.D. for RRs and REE is excluded due to minimal variability or limited influence on agricultural productivity.
Table 7.
Multilevel mixed-effects model estimation results.
AI and CODPI are included to account for time-related factors, influenced by macroeconomic conditions and environmental regulations. Table 7 results highlight factors affecting PCOPI through both fixed and random effects across provinces and time.
In FEMs, REE shows a significant negative effect on PCOPI (−0.11), suggesting that higher rural education levels may lead to reduced agricultural output as individuals shift to non-agricultural sectors. RDI shows a strong positive effect (0.94), indicating that higher rural income drives productivity. RP negatively impacts PCOPI (−0.31), likely due to resource constraints from population growth.
RE and RLM positively influence PCOPI (0.34), showing that higher rural employment and labor mobility enhance productivity. PSA has a negative impact (−0.22), indicating potential inefficiencies in public sector resource allocation. ANEAW and CODPI show positive effects, suggesting that higher agricultural activity correlates with increased productivity, though at an environmental cost. ATT, AI, RRs, PEPS, and FCR show no significant effect, indicating they may not consistently impact productivity across provinces and time.
The REM shows variation in variables such as ATT, RDI, RLM, PSA, PEPS, FCR, AI, and CODPI, reflecting regional differences in economic conditions and environmental policies. PEPS varies across provinces, while ANEAW and FCR do not show significant variation.
These results reveal the complexity and regional variability of factors influencing PCOPI. RDI consistently shows a positive effect, but its magnitude varies significantly, suggesting that in some regions, income boosts agriculture, while in others, it is diverted elsewhere. RLM and RE also show varying effects, depending on regional infrastructure and labor market dynamics.
The negative impact of RP reflects population pressure on resources, especially in areas with limited agricultural land. Environmental factors like CODPI and ANEAW positively affect productivity, reflecting gains from intensive practices, though they may undermine long-term sustainability.
PSA’s negative effect suggests inefficiencies in public sector resource allocation, with variation across provinces indicating differing priorities. Hypotheses (, , , , , , and ) for REE, RDI, RP, RE, RLM, PSA, ANEAW, and CODPI are supported, while ATT, AI, RRs, PEPS, and FCR lack statistical significance.
4.3. Structural Equation Modeling
The path coefficients in Table 8 further illustrate the relationships between TSCB, SED, ADRs, and agricultural productivity, shedding light on their collective impact on agricultural outcomes.
Table 8.
Path coefficients without moderating effects.
The positive path coefficient of 0.61 between TSCB and SED highlights the crucial role of technological and skill capacity building in improving socioeconomic conditions in rural areas. As education and technical training are strengthened, the workforce becomes more skilled, directly influencing labor structure and the agricultural economy. This underscores the need to invest in TSCB to lay the socioeconomic foundation for rural development.
The 0.56 path coefficient for SED → PCOPI shows that improving socioeconomic dynamics enhances agricultural productivity. By optimizing labor structures and economic conditions, SED drives more efficient production processes, boosting output. This emphasizes the role of human capital, where an educated and capable workforce is key to agricultural efficiency and growth. Investment in education and training becomes vital for advancing productivity.
A path coefficient of 0.69 for SED → ADRs reveals that socioeconomic improvements positively influence ADRs development. As socioeconomic conditions improve, infrastructure, financial investments, and labor management are strengthened, supporting agricultural productivity. This shows that a strong socioeconomic base fosters agricultural development, marked by economic stability and better resource access.
The 0.35 path coefficient for ADRs → PCOPI highlights ADRs’ importance in increasing productivity. Improved infrastructure, financial resources, and labor management directly contribute to growth in agriculture, creating conditions for enhanced production and value creation.
These results suggest that TSCB indirectly drives agricultural productivity by improving SED, which in turn positively impacts ADRs and PCOPI. While direct TSCB investment may not yield immediate results, it strengthens human capital and fosters socioeconomic and agricultural development. SED emerges as a key driver of productivity, enhancing both PCOPI and ADRs, amplifying gains. Balanced investments in technology, skills, and infrastructure are critical for sustainable agricultural growth. Policies should focus on human capital and creating a supportive socioeconomic environment for long-term success.
Table 9 reinforces the significant role of SED and ADRs in mediating the relationship between TSCB and PCOPI, showing how investments in education, skills, and infrastructure contribute to long-term agricultural outcomes.
Table 9.
Mediation effects.
The path TSCB → SED → PCOPI, with a coefficient of 0.35, illustrates that TSCB influences agricultural productivity primarily by enhancing SED. This indirect effect constitutes 116.67% of the total effect, highlighting the crucial role of socioeconomic improvements, such as labor structure and rural development, in driving productivity. Human capital development, through investment in education and training, creates a skilled workforce, directly impacting agricultural output.
The path TSCB → SED → ADRs → PCOPI, with a coefficient of 0.15, further supports this. Socioeconomic improvements not only boost productivity but also strengthen ADRs, which in turn contributes to agricultural output. The indirect effect represents 50% of the total effect, emphasizing the role of human capital in creating an economic environment that provides essential infrastructure, financial investments, and labor dynamics for higher productivity.
The total indirect effect of 0.49, combined with a total effect of 0.29, shows that TSCB’s impact on PCOPI largely operates through these indirect channels. Education and skills development not only result in a more capable workforce but also foster conditions for sustained productivity, creating a supportive economic framework for long-term growth in agriculture.
The path TSCB → SED → ADRs, with a coefficient of 0.43, demonstrates that the influence of education and training on the economic environment is fully mediated through SED, highlighting human capital as a key driver of economic improvements. Without a skilled workforce, efforts to enhance infrastructure and financial investments are less effective.
In the path SED → ADRs → PCOPI, the coefficient of 0.24 shows that while human capital directly impacts productivity, its full potential is realized when supported by a conducive economic environment. Infrastructure and financial resources complement human capital, enabling it to drive agricultural output more effectively.
The total effect of 0.81 for SED → PCOPI underscores the significant impact of socioeconomic dynamics on agricultural productivity. Human capital not only boosts productivity directly but also fosters a development environment that amplifies productivity gains over time.
These results emphasize the central role of education and skills in driving agricultural productivity. A skilled workforce enhances the adoption of new technologies and modern practices while fostering an economic environment that amplifies these gains through infrastructure and investment. Investments in education and human capital yield compounding benefits, strengthening both productivity and the broader economic conditions necessary for sustainable growth. Policies to increase agricultural productivity should focus on education and human capital, alongside economic improvements.
A key finding from Table 10 is the significant moderating effect of Ammonia Nitrogen Emissions from Agricultural Wastewater (ANEAW) on the relationship between TSCB and agricultural productivity. The interaction term ANEAW × TSCB → PCOPI has a significant positive coefficient of 0.21, indicating that ANEAW enhances the effect of TSCB on PCOPI.
Table 10.
Moderating effect of ammonia nitrogen emissions from agricultural wastewater (ANEAW) and chemical oxygen demand in the primary industry (CODPI).
The findings indicate that in regions with higher levels of ANEAW, a marker of intensive agricultural activity, investments in TSCB have a stronger positive effect on productivity. This suggests that as agricultural intensity increases, reflected by higher emissions, the benefits of technological advancements and skilled labor become more pronounced. TSCB is particularly effective in high-intensity farming environments, where efficiency and skill are crucial for managing complex operations [50].
The moderating effects of CODPI are evident in its impact on ADRs, with a path coefficient of −0.25. Higher pollution, indicated by increased chemical oxygen demand, weakens the effectiveness of resource allocation, infrastructure, and financial investments—key factors for agricultural productivity. While CODPI does not significantly moderate pathways such as TSCB → PCOPI, its direct negative impact on ADRs highlights how pollution hampers the efficient use of infrastructure and resources, essential for sustaining higher output.
Table 11 shows the moderating role of PEPS on agricultural productivity (PCOPI). The significant interaction effect, with a path coefficient of −0.11 for PEPS × TSCB → SED, suggests that increased environmental protection spending reduces the positive impact of TSCB on SED. This implies that while environmental protection is necessary, it may divert resources from technology and skills investments, weakening socioeconomic benefits in rural areas. Balancing environmental spending with investments in technological advancement is crucial for maintaining the positive effects of TSCB on rural development.
Table 11.
Moderating effect of proportion of environmental protection spending (PEPS) and chemical oxygen demand in the primary industry (CODPI).
The direct path PEPS → PCOPI, with a negative coefficient of −0.09, indicates that higher spending on environmental protection temporarily reduces agricultural productivity, likely by diverting resources away from activities directly tied to output. While essential for long-term sustainability, this may cause short-term declines in productivity.
Key findings from Table 11 highlight the moderating effect of forest coverage (FCR) on the relationships between TSCB, SED, ADRs, and agricultural productivity (PCOPI).
The interaction term FCR × TSCB → PCOPI has a negative coefficient of −0.15, indicating that in regions with higher forest coverage, the effectiveness of technological and skill investments on productivity is reduced. Extensive forests may impose environmental constraints like land-use regulations, limiting the direct impact of these advancements on output.
In contrast, FCR × TSCB → SED has a positive coefficient of 0.13, suggesting that forest coverage enhances the relationship between TSCB and SED. In areas with more forests, technology and skills more effectively drive socioeconomic development. Forests likely support sustainable development, amplifying the benefits of investments in technology and skills for rural economies.
FCR × SED → PCOPI shows a strong positive coefficient of 0.37, indicating that in regions with greater forest coverage, the positive effects of socioeconomic improvements on agricultural productivity are strengthened. Forests may provide ecosystem services that complement socioeconomic drivers of agricultural growth.
The term FCR × ADRs → PCOPI has a negative coefficient of −0.12, suggesting that higher forest coverage limits the positive impact of ADRs on productivity, likely due to environmental priorities that restrict resource-intensive development.
FCR moderates the relationship between conservation and agricultural development. While forests limit the direct effect of technological investments and resources on productivity, they enhance the positive impact of socioeconomic development, promoting sustainable agricultural practices in forested regions. This suggests that high-forest regions should focus on balancing environmental conservation with socioeconomic growth, fostering sustainable practices while leveraging human capital to drive productivity.
The analysis supports several hypotheses. and are confirmed, as SED and ADRs enhance PCOPI by improving income, employment, and resource management. and are also supported, showing that SED and ADRs mediate the relationship between TSCB and PCOPI, with technological investments improving socioeconomic conditions and resource use, boosting productivity. However, and are not supported, as TSCB’s direct impact on PCOPI is negative, indicating that technology disrupts practices without adequate socioeconomic integration. Regarding moderation hypotheses, is partially supported, as FCR positively moderates the effect of SED on productivity but negatively moderates TSCB’s impact, reflecting environmental constraints. is partially supported, with PEPS negatively moderating TSCB’s effect on SED, possibly due to resource diversion from technological investments.
5. Discussion
5.1. The Comparisons between Four Models
The comparisons between the four models—FEM, REM, MLM, and SEM—lie in their economic foundations, theoretical frameworks, and practical applications, which shape their distinct outcomes. (See Table 12) Each model offers a unique view of the relationships between technological development, socioeconomic dynamics, and agricultural productivity, particularly when addressing regional disparities in China. Methodological distinctions aside, these models uncover the economic mechanisms driving agricultural outcomes. For instance, Hu et al. [31] show that eastern China achieves higher agricultural productivity due to advanced digital rural development, while the central and western regions lag behind.
Table 12.
The hypotheses between four models.
The FEM assumes that unobserved province-specific factors—such as geography, historical legacy, policy, and infrastructure—significantly influence agricultural productivity and correlate with independent variables. By controlling for these time-invariant factors, the FEM isolates the effects of variables like REE, RDI, and RLM on productivity. This aligns with Human Capital Theory, which suggests that education and training boost productivity by enhancing workers’ capacity to adopt new technologies.
The FEM shows that higher rural education levels significantly improve agricultural productivity. Educated farmers are better equipped to implement advanced techniques, leading to efficient resource use and higher yields. This supports China’s rural modernization efforts, such as the New-Type Professional Farmer Training Plan, which has enhanced productivity in provinces prioritizing rural education.
RDI’s positive impact on productivity in the FEM highlights the role of economic empowerment in technological adoption. Higher rural incomes allow for investment in inputs like fertilizers, seeds, and machinery, driving productivity gains, particularly in economically advanced regions like Jiangsu and Zhejiang.
The REM, by contrast, assumes that province-specific factors are uncorrelated with independent variables and considers both within- and between-province variations. REMs are effective for exploring regional heterogeneity and how geographical and economic differences affect productivity. While rural education and income still show positive effects, the Rural Population (RP) negatively impacts productivity, explained by the Theory of Diminishing Returns. As populations grow, resources like land become scarcer, reducing per capita productivity, a phenomenon evident in densely populated provinces like Henan and Anhui.
The REM also underscores the importance of RLM in driving productivity. In provinces with high rural-to-urban migration, such as Guangdong and Fujian, remittances from migrant workers enable rural households to invest in agricultural improvements, aligning with New Economic Geography Theory. Remittances allow for investment in modern equipment, leading to productivity gains.
Overall, the FEM highlights the long-term effects of education and income on productivity, while the REM reveals cross-regional differences in resource allocation, labor mobility, and population dynamics. The FEM is best for analyzing the impacts within regions, while the REM captures broader regional disparities in productivity [18].
The MLM expands on the fixed- and random-effects models by incorporating the hierarchical structure of data, analyzing macro-level (province) and micro-level (individual) interactions. This approach is ideal for examining how socioeconomic factors, technological adoption, and agricultural productivity interact across regions and over time. By accounting for regional and temporal variations, the MLM offers a nuanced understanding of how policies and economic conditions shape agricultural outcomes.
In the MLM, variables like REE, RDI, and RLM remain significant drivers of productivity, but their effects vary by region. This aligns with Diffusion of Innovation Theory, which suggests that local factors—such as infrastructure, market access, and government policy—affect technology adoption. In economically advanced provinces like Shandong and Jiangsu, innovations in agriculture spread quickly due to strong infrastructure, higher income levels, and government support.
In contrast, less-developed provinces like Guizhou and Yunnan face obstacles like lower education, poor infrastructure, and limited financial resources, slowing technological diffusion. The MLM captures these disparities, showing how education, income, and labor mobility’s effects on productivity differ based on regional development.
The MLM also emphasizes the importance of RLM in driving productivity. Labor mobility facilitates knowledge and resource transfer across regions. In high-mobility provinces like Zhejiang and Guangdong, migrant workers bring innovative practices from urban centers back to rural areas, boosting productivity. This transfer of knowledge and innovation is key in regions with high labor mobility.
Additionally, the MLM highlights the role of PSA and PEPS in shaping productivity differences. Provinces with substantial public investment in agriculture and environmental protection, like Beijing and Shanghai, show higher productivity, as farmers can adopt sustainable practices and modern technologies. In contrast, provinces with lower government support, such as Ningxia and Gansu, face more challenges in accessing necessary resources and technologies to enhance productivity.
SEM provides a framework for analyzing causal relationships between latent variables like TSCB, SED, and ADRs. By examining the indirect effects of technology, education, and economic conditions on agricultural productivity, SEM offers insights into how these factors interact. Atchadé and Nougbodé [4] note that while food production contributes to economic growth, livestock production has a bidirectional relationship with growth and agricultural value.
In SEM, TSCB shows a direct negative impact on productivity, explained by Socio-technical Systems Theory, which suggests that new technologies can disrupt existing systems, causing short-term inefficiencies. In regions lacking socioeconomic support, such as training or financial resources, farmers struggle to adapt, leading to lower productivity.
However, TSCB indirectly boosts productivity through its positive influence on SED and ADRs. Better education and training help farmers manage technological innovations, while rising incomes allow for investment in modern equipment and sustainable practices, creating a reinforcing cycle of improved resource allocation and productivity.
This dynamic is evident in regions like Zhejiang and Jiangsu, where government support has facilitated technological adoption and economic development, leading to productivity gains. In contrast, provinces like Guizhou and Yunnan, with less support, struggle to integrate technology, resulting in lower productivity.
SEM highlights the need for policy coherence in promoting sustainable agricultural growth. Technological investments alone are insufficient—broader efforts to improve education, income, and resource allocation are critical. This underscores the importance of integrated policies that address both social and technical dimensions, ensuring farmers have the knowledge and resources to leverage new technologies fully.
The FEM emphasizes the direct role of human capital and labor participation in boosting agricultural productivity within stable environments. Rising education and income levels enable farmers to adopt modern technologies and practices more effectively, translating investments in human capital into tangible productivity gains.
In contrast, the REM focuses on cross-regional disparities in resource allocation, population growth, and labor mobility. It highlights the need to manage regional differences and population pressures to prevent diminishing returns. Environmental factors, such as rainfall, are critical in regions reliant on water management for sustained agricultural growth [10].
The MME model extends these insights by incorporating spatial and temporal dimensions, demonstrating how regional policies, economic conditions, and labor mobility interact over time to shape productivity. It highlights the varied impacts of innovation diffusion and labor dynamics across regions with different levels of infrastructure and development.
SEM provides a deeper understanding of the relationships between technology, socioeconomic development, and resource allocation. It shows that technology’s impact on productivity can be both positive and negative, depending on how well it integrates into the broader socioeconomic system. SEM underscores the importance of policy coherence, emphasizing the need for technology adoption to align with socioeconomic goals.
Together, these models offer layered insights into the drivers of agricultural productivity in China. The FEM focuses on the direct effects of education and income, while the REM reveals cross-regional variations in resources and labor mobility. The MME captures the influence of regional policies over time, and SEM explores the complex interplay between technology, socioeconomic factors, and resource allocation.
By synthesizing these insights, policymakers can create targeted strategies to enhance productivity, ensuring that investments in education, technology, and infrastructure align with broader economic objectives, promoting balanced agricultural development across diverse regions.
5.2. Interpretation of Results
The empirical results presented in Section 5 reveal the intricate dynamics between technological innovations, sustainable practices, and agricultural productivity (See Table 13). These factors interact differently depending on regional characteristics, socioeconomic conditions, and environmental variables, illustrating the complexity of their impact on agricultural outcomes.
Table 13.
Analysis of factors influencing agricultural productivity.
TSCB plays a crucial role in enhancing agricultural productivity (PCOPI) by improving labor efficiency, aligning with Human Capital Theory, which emphasizes the importance of education and skill development in boosting productivity. However, TSCB’s impact varies across regions. In areas with poor socioeconomic or environmental conditions, advanced technologies can disrupt traditional practices, leading to inefficiencies, consistent with Socio-technical Systems Theory, which stresses the need for technology to integrate well with existing systems.
In regions with lower development, introducing advanced technologies without adequate training or financial support may reduce productivity. In some Chinese provinces, farmers lacking the resources to fully use modern machinery have not benefited as expected from TSCB. This underscores the need to pair technological innovations with investments in human capital and infrastructure.
SED plays a critical mediating role in converting TSCB benefits into productivity gains. Higher rural incomes, employment, and market access enable farmers to adopt and optimize new technologies. The study finds that SED directly boosts productivity and amplifies the positive effects of ADRs, such as infrastructure and financial investments.
According to the Diffusion of Innovation Theory, technology spreads more effectively in regions with higher education and income levels. These regions, like China’s coastal provinces, show greater productivity due to the better adoption of modern farming techniques. In contrast, poorer inland regions with lower education and income experience slower innovation diffusion, limiting productivity gains.
ADRs, including infrastructure, financial investments, and labor dynamics, are also key to productivity. Investments in infrastructure—irrigation, machinery, and transportation—improve resource efficiency and reduce logistical challenges. In regions with developed infrastructure, market access improves, lowering costs and increasing profitability. In areas with poor infrastructure, however, the productivity benefits from technological advances are limited.
Environmental factors play a key role in shaping how technological innovations affect agricultural productivity. FCR moderates the TSCB–productivity relationship, as forests provide vital ecosystem services like water regulation and soil preservation but also impose limits on agricultural expansion. In regions with high forest coverage, land-use regulations may hinder farmers’ ability to adopt new technologies, reducing TSCB’s direct impact on productivity.
However, FCR enhances SED’s positive effect on productivity, indicating that sustainable practices are more effective in areas prioritizing environmental conservation. This aligns with the Environmental Kuznets Curve, which suggests that wealthier societies invest more in sustainability, leading to long-term productivity improvements. In forested regions, farmers may adopt practices that balance conservation with productivity growth.
The analysis emphasizes the need for balanced policies that support both technological innovation and sustainable agricultural practices. Governments must pair technological investments with efforts to improve socioeconomic conditions and environmental sustainability. Policies like PSA, which include subsidies for agricultural equipment and training, are crucial for enabling farmers to adopt modern technologies. At the same time, environmental protection policies, such as PEPS, are essential for sustaining long-term productivity.
Gebeyehu and Bedemo [56] highlight that while short-term agricultural credit can initially challenge productivity due to repayment issues, access to credit ultimately boosts productivity by enabling long-term agricultural investments. Gelu et al. [57] show that optimized irrigation management increases both crop yields and economic returns, underscoring the economic benefits of efficient resource use.
The analysis also reveals trade-offs between short-term gains and long-term sustainability. Increased environmental protection spending, though vital for ecological balance, may reduce immediate output by diverting resources from technological investments. Balancing investments in both technology and sustainability is essential for maximizing long-term productivity.
The relationship between technological advancements and sustainable productivity is context-dependent. TSCB can significantly enhance productivity in regions with strong socioeconomic foundations, but where these conditions are weak, the benefits of technology may be limited or counterproductive. Environmental sustainability is key to maintaining long-term productivity gains. Policymakers must create integrated strategies that promote both technological adoption and environmental conservation for sustainable growth.
To ensure lasting improvements, the focus must shift from short-term subsidies to sustainable credit mechanisms that encourage long-term investment, as noted by Gebeyehu and Bedemo [56]. By integrating technological, socioeconomic, and environmental factors into a cohesive policy framework, governments can boost productivity while ensuring economic viability and environmental sustainability.
5.3. Compared with Existing Research
The findings of this study on agricultural productivity offer valuable insights and highlight both consistencies and discrepancies with the existing literature. A detailed comparison is presented below, supported by relevant theories and real-world examples to contextualize these differences. (1) Technological Innovations and Productivity. This study aligns with the existing literature on the role of TSCB in improving agricultural productivity. Consistent with Huang et al. [19], it highlights that technological skill-building enhances efficiency and output when supported by strong human capital. Human Capital Theory confirms that investments in education and skills increase workforce productivity, and this study finds that TSCB significantly boosts productivity in regions with solid socioeconomic foundations. For instance, developed areas like Zhejiang illustrate how precision agriculture, driven by TSCB, leads to higher productivity, with farmers possessing the skills and resources to implement modern techniques, aligning with Diffusion of Innovation Theory.
(2) Socioeconomic Dynamics and Human Capital. The findings reinforce research on the importance of SED in driving agricultural productivity. Like Fang et al. [21], this study shows that SED, measured through RDI and employment, facilitates technology adoption, increasing productivity. Higher-income regions like Jiangsu demonstrate how financial stability allows farmers to invest in machinery, boosting efficiency. This supports Human Capital Accumulation Theory, which suggests that rising income and education levels enhance innovation adoption. Additionally, the role of ADRs—encompassing infrastructure and financial resources—amplifies these gains, showing that socioeconomic conditions are central to productivity growth.
(3) Sustainable Practices and Green Total Factor Productivity. The study’s focus on sustainable practices aligns with research on GTFP, which integrates environmental factors like carbon emissions into productivity measures. Yu et al. [22] and Fang et al. [21] similarly stress the importance of balancing productivity with sustainability. This study’s findings on the positive role of FCR in enhancing the benefits of socioeconomic development for productivity support this trend. Regions like Fujian show how sustainable land use and agroforestry practices can maintain long-term productivity while preserving the environment.
(4) The Negative Impact of Technological Skill Capacity Building. While TSCB typically boosts productivity, this study reveals that under insufficient socioeconomic conditions, it can have negative effects. This contrasts with the largely positive findings of Huang et al. [19]. Socio-technical Systems Theory explains that technology must integrate within a region’s social and economic framework to be effective. In areas like Guizhou, where infrastructure and training are lacking, new technologies may disrupt traditional practices, reducing productivity initially before long-term benefits appear. This underscores the need for socioeconomic support alongside technological innovation.
(5) Environmental Constraints on Technology. The study highlights that a high FCR can limit TSCB’s effectiveness, diverging from research that focuses on technological benefits. In regions like Fujian, forest conservation restricts agricultural expansion and intensive technology use, reducing short-term productivity gains. This differs from studies that emphasize the positive aspects of technology without considering environmental trade-offs.
(6) Intensive Agriculture and Pollution. Unlike studies focused on the long-term environmental costs of intensive farming, such as Sun [43], this research shows that higher emissions, indicating agricultural intensity, can boost short-term productivity. Regions practicing intensive farming experience immediate gains, despite environmental costs. This suggests a trade-off between short-term productivity and long-term sustainability, differing from research focused mainly on pollution’s negative impacts.
The alignments and divergences between this study and existing research provide valuable insights into the economic and environmental factors affecting agricultural productivity. Human Capital Theory and Diffusion of Innovation Theory explain the alignment, showing how improvements in education, income, and infrastructure support technology adoption and productivity, as seen in provinces like Zhejiang and Jiangsu.
However, the divergences suggest areas where current theories may need refinement. Socio-technical Systems Theory explains the negative effects of TSCB in regions with insufficient socioeconomic support. Additionally, findings on FCR challenge the assumption that technological advancements always increase productivity, highlighting the need to consider environmental conservation when promoting innovation.
The study also shows that ANEAW can boost short-term productivity despite environmental costs, emphasizing the need for policies that balance immediate gains with long-term sustainability. In regions practicing intensive agriculture, policies should promote sustainable practices without sacrificing short-term output to maintain both productivity and environmental protection.
5.4. Technological Innovations, Socioeconomic and Environmental Factors, and Policy Interventions in Enhancing Agricultural Productivity
The responses to the key research questions, as synthesized from the previous discussions, are as follows: (1) How do technological innovations influence agricultural productivity across different regions? Technological advancements such as precision agriculture, biotechnology, and mechanization are critical drivers of agricultural productivity. However, their impact is uneven across regions due to varying socioeconomic conditions. In more-developed provinces like Zhejiang and Jiangsu, where infrastructure and resources are robust, these innovations have led to significant productivity improvements by optimizing resource use and increasing yields. In contrast, in less-developed regions like Guizhou, where socioeconomic and infrastructural support is limited, the adoption and effectiveness of these technologies have been slower, resulting in reduced productivity gains. This highlights the need for complementary investments in socioeconomic development to maximize the benefits of technological innovations.
(2) What roles do socioeconomic and environmental factors play in optimizing technological advancements for sustainable development? Socioeconomic factors, including rural education, income levels, and labor mobility, are essential in enabling the successful adoption and integration of technological advancements in agriculture. Regions with higher levels of education, income, and mobility can better absorb and utilize modern technologies, leading to improved agricultural productivity. Environmental factors, such as forest coverage and pollution control, also significantly influence the success of these innovations. In areas with high forest coverage, agricultural expansion must be balanced with environmental conservation to ensure sustainability. Therefore, technological advancements must be aligned with the specific socioeconomic and environmental conditions of each region to achieve long-term sustainable productivity.
(3) How can policy interventions support the adoption of such technologies while maintaining environmental integrity? Policy interventions must be tailored to the unique socioeconomic and environmental contexts of each region to promote the adoption of technological innovations while ensuring environmental sustainability. Governments should prioritize investments in rural infrastructure—such as roads, irrigation systems, and market access facilities—to support the integration of advanced agricultural technologies. Additionally, policies that promote environmental protection, including subsidies for sustainable agricultural practices and pollution control measures, are crucial to prevent environmental degradation. A holistic policy approach that balances immediate productivity improvements with long-term sustainability goals is necessary to ensure the successful adoption of technologies while maintaining environmental integrity.
The study’s findings on AP suggest a comprehensive policy approach, balancing investments in technology, socioeconomic development, and environmental sustainability. Below are strategic recommendations based on these insights, supported by real-world examples and relevant theories.
Human Capital Theory emphasizes the role of education and skill development in enhancing labor productivity. In agriculture, improving farmers’ technical abilities to adopt modern technologies drives productivity. Policymakers should (1) Expand Technical Training Programs (ATTs): Offer practical training in using modern machinery, digital tools, and precision agriculture to optimize resource use and improve yields. (2) Strengthen Rural Education Evaluation (REE): Invest in rural education to build a workforce capable of long-term technological integration. Jiangsu’s success in combining technical training with educational reforms illustrates the productivity gains from mechanized and digital agriculture. However, Zhu et al. [58] caution that while ICT improves labor productivity, it may shift focus from agriculture, affecting grain production.
According to Diffusion of Innovation Theory, socioeconomic conditions shape technological adoption. Policymakers should (1) Increase Rural Disposable Income (RDI): Boost incomes through subsidies, employment, and diversification programs, enabling investment in agricultural inputs like seeds and machinery. (2) Facilitate Labor Mobility (RLM): Encourage rural–urban migration to transfer skills and remittances that fuel agricultural investment. In Sichuan, rural infrastructure and labor mobility policies have driven productivity by improving access to markets, technology, and knowledge transfer.
The Environmental Kuznets Curve suggests economic growth can eventually support sustainability investments. Policymakers should (1) Promote Agroecological Practices: Support sustainable practices like agroforestry and organic farming to integrate environmental goals with productivity. (2) Implement Resource Conservation Programs: Allocate more resources to environmental protection (PEPS) for pollution control and conservation. Fujian’s focus on agroforestry and organic farming has enhanced productivity while preserving forest coverage, showing the benefits of balancing sustainability with technological growth.
Economies of Scale Theory highlights the importance of infrastructure in lowering costs and improving efficiency. Policymakers should (1) Invest in Rural Infrastructure (RRs): Build and upgrade roads, irrigation, and transportation to improve market access and reduce costs. (2) Increase Agricultural Investment (AI): Provide subsidies, loans, and grants to help farmers adopt advanced technologies and sustainable practices. In Hebei, rural road development has reduced transportation costs and increased market access, significantly boosting productivity.
Findings from MME models show that agricultural productivity is influenced by region-specific factors. Policymakers should (1) Customize Policies to Regional Needs: Tailor policies to each region’s economic and environmental conditions. Developed areas may benefit from high-tech agriculture, while less-developed regions need basic infrastructure and education. (2) Coordinate Policy Across Sectors: Foster collaboration between education, environmental protection, and economic development agencies to create integrated policies. Zhejiang exemplifies this approach, using region-specific policies to drive productivity. Advanced mechanization in developed areas and infrastructure development in underdeveloped regions have led to more equitable productivity gains. As Luan et al. [18] note, regions like Zhejiang have seen high growth in Total Factor Energy Productivity due to continued technological investment.
6. Conclusions
This research highlights the critical role of technological innovations, such as precision agriculture and biotechnology, in enhancing agricultural productivity while maintaining environmental sustainability. Using data from Chinese provinces (2012–2022), this research employed fixed-effects, random-effects, and multilevel mixed-effects models, as well as SEM, to identify key determinants of productivity growth while maintaining sustainability. Key findings indicate that these technologies are vital for increasing yields and reducing inputs, yet their effectiveness varies significantly across different regions due to socioeconomic factors.
Regions with robust infrastructure and higher income levels, such as Zhejiang and Jiangsu, experience greater benefits from technological advancements compared to less-developed areas like Guizhou. Socioeconomic conditions, including rural education and income levels, are essential in enabling farmers to adopt and effectively utilize these innovations.
This study underscores the importance of balancing technological advancement with sustainable practices, such as agroecology and organic farming. Areas with higher forest coverage and lower pollution levels demonstrate better productivity growth, emphasizing the need for policies that integrate environmental conservation with agricultural development.
In terms of contributions, this research develops a comprehensive framework that connects technological innovation, socioeconomic factors, and environmental sustainability, addressing gaps in previous studies that often examined these dimensions in isolation. The findings advocate for region-specific policies, recognizing that a one-size-fits-all approach is ineffective. Tailored interventions are necessary to promote balanced agricultural development across regions.
In this study, the research boundaries are primarily defined by the use of provincial-level data from China, which may limit the generalizability of the findings to other regions or countries with different socioeconomic, environmental, and political contexts. This focus on a specific national context allows for an in-depth analysis of how technological innovations, socioeconomic factors, and environmental sustainability interact in enhancing agricultural productivity.
While the findings provide valuable insights into the Chinese agricultural landscape, they may not fully apply to other countries with varying agricultural practices, infrastructure, and policy frameworks. Therefore, future research could benefit from comparative studies that explore how these dynamics operate in different geographic and cultural contexts, further enhancing the robustness and applicability of the research outcomes.
Future research should focus on broadening these insights by conducting comparative studies across different countries to explore how varying sociopolitical environments affect technology integration in agriculture. Additionally, incorporating more environmental variables and emerging technologies will provide a holistic understanding of the impacts of innovation on sustainability. Longitudinal studies examining farmers’ attitudes and decision-making processes in response to changing conditions will further enrich the field, ensuring that agricultural practices evolve alongside technological advancements [59,60,61,62,63,64,65,66,67,68,69].
Boahen et al. [46] highlight that the gender gap in agricultural productivity is largely due to female farmers’ limited access to inputs like land. Soni and Manogna [61] found that renewable energy consumption positively impacts agricultural productivity in BRICS countries. Valea and Noufé [62] argue that improving women’s land access can reduce productivity gaps and enhance development in Burkina Faso. Aytop and Pinar [63] emphasize the economic significance of addressing water erosion in Turkish vineyards, while Emami and Dehghanisanij [64] highlight the importance of managing water resources through government intervention and farmer education. Karthickmanoj et al. [17] developed a system integrating IoT for early plant disease detection with 98.43% accuracy. Rocha and Ferreira [65] suggest decentralizing Brazil’s extension system to improve access to services and boost productivity, aligning with national rural extension goals. Zhu et al. [58] showed that even non-ICT users in connected villages benefited from increased labor productivity, illustrating broader community benefits from digital infrastructure. Song et al. [69] demonstrated that an aging rural population has a greater negative impact on AGTFP in western China, compared to eastern and central regions, revealing regional differences in how demographics affect productivity.
Finally, assessing the long-term impacts of policy interventions on technology adoption will offer empirical evidence for developing effective strategies that promote productivity while ensuring environmental integrity [70,71] Kitole et al. [72] recommend gender-sensitive agricultural policies and rural development initiatives as essential strategies for mitigating the negative effects of abuse and improving productivity.
Author Contributions
Writing—original draft preparation, W.H.; writing—review and editing, X.W. All authors have read and agreed to the published version of the manuscript.
Funding
This research was funded by [Zhejiang Federation of Humanities and Social Sciences] grant number [2025B005]; [Department of Education of Zhejiang Province] grant number [Y202455284]; [The 2024 Zhejiang Provincial Philosophy and Social Sciences Planning “Provincial-City Cooperation” Project] grant number [24SSHZ084YB].
Institutional Review Board Statement
Not applicable.
Informed Consent Statement
Not applicable.
Data Availability Statement
The raw data supporting the conclusions of this article will be made available by the authors on request.
Conflicts of Interest
The authors declare no conflict of interest.
References
- Behera, S.; Dutta, D. Tracking Gross Primary Productivity Using Satellite Solar Induced Fluorescence: Insights across Agricultural Ecosystems of India. J. Geophys. Res. Biogeosci. 2024, 129, e2023JG007586. [Google Scholar] [CrossRef]
- Bekoe, I.K.; Abor, J.; Sekyi, S. How Do Financial Inclusion and Bank Stability Explain Agricultural Productivity in Sub-Saharan Africa? J. Econ. Stud. 2024. ahead-of-print. [Google Scholar] [CrossRef]
- Goodluck, A.; Otieno, D.J.; Oluoch-Kosura, W. The Effects of Multiple Agricultural Advisory Service Providers on Farmers’ Productivity in Tanzania. Community Dev. 2024, 1–18. [Google Scholar] [CrossRef]
- Atchadé, M.N.; Nougbodé, H. Statistical Investigation on The Relationship Between Climate Change, Food Availability, Agricultural Productivity, and Economic Expansion. Heliyon 2024, 10, e32520. [Google Scholar] [CrossRef]
- Bouteska, A.; Sharif, T.; Bhuiyan, F.; Abedin, M.Z. Impacts of the Changing Climate on Agricultural Productivity and Food Security: Evidence from Ethiopia. J. Clean. Prod. 2024, 449, 141793. [Google Scholar] [CrossRef]
- Omotoso, A.B.; Letsoalo, S.S.; Daud, S.A.; Tshwene, C.; Omotayo, A.O. Climate-Smart Agricultural Practices, Productivity, And Food-Nutrition Security in Rural South Africa: A Dataset of Smallholder Maize Farmers. Data Brief 2024, 55, 110725. [Google Scholar] [CrossRef]
- Sleiman, R.; Gerard, J.A.; Fahed, S.; Todorovic, M.; Sellami, M.H.; Albrizio, R.; Saab, M.T.A. Irrigation and Agricultural Opportunities: Evaluating Hemp (Cannabis sativa L.) Suitability and Productivity in Lebanon. Water 2024, 16, 1865. [Google Scholar] [CrossRef]
- Mugabe, P.; Kipkulei, H.; Sieber, S.; Mhache, E.; Löhr, K. Examining Climate Trends and Patterns and Their Implications for Agricultural Productivity in Bagamoyo District, Tanzania. Front. Clim. 2024, 6, 1346677. [Google Scholar] [CrossRef]
- Ding, Y.; Zhang, L.; He, Y.; Cao, S.; Gusev, A.; Guo, Y.; Ran, L.; Wei, X.; Mikalai, F. Nonlinear Effects of Agricultural Drought on Vegetation Productivity in the Yellow River Basin, China. Sci. Total Environ. 2024, 948, 174903. [Google Scholar] [CrossRef]
- Hassan, A.Y.; Mohamed, M.A. Dynamic Impacts of Economic and Environmental Performances on Agricultural Productivity in Somalia: Empirical Evidence from ARDL Technique. Cogent Food Agric. 2024, 10, 2369204. [Google Scholar] [CrossRef]
- Ortiz-Bobea, A.; Ault, T.R.; Carrillo, C.M.; Chambers, R.G.; Lobel, D.B. Anthropogenic Climate Change Has Slowed Global Agricultural Productivity Growth. Nat. Clim. Change 2021, 11, 306–312. [Google Scholar] [CrossRef]
- Donmez, C.; Sahingoz, M.; Paul, C.; Cilek, A.; Hoffmann, C.; Berberoglu, S.; Webber, H.; Helming, K. Climate Change Causes Spatial Shifts in the Productivity of Agricultural Long-Term Field Experiments. Eur. J. Agron. 2024, 155, 127121. [Google Scholar] [CrossRef]
- Rahman, N.M.F.; Malik, W.A.; Baten, M.A.; Kabir, M.S.; Rahman, M.C.; Ahmed, R.; Hossain, A.B.M.Z.; Hossain, M.M.; Halder, T.; Bhuiyan, M.K.A. Sustaining Rice Productivity through Weather-Resilient Agricultural Practices. J. Sci. Food Agric. 2024, 104, 2303–2313. [Google Scholar] [CrossRef]
- Alhassan, H. The Effect of Agricultural Total Factor Productivity on Environmental Degradation in Sub-Saharan Africa. Sci. Afr. 2021, 12, e00740. [Google Scholar] [CrossRef]
- Li, F.; Hou, J.; Yu, H.; Ren, Q.; Yang, Y. Harnessing the Digital Economy for Sustainable Agricultural Carbon Productivity: A Path to Green Innovation in China. J. Knowl. Econ. 2024, 1–27. [Google Scholar] [CrossRef]
- Lu, S.; Zhuang, J.; Sun, Z.; Huang, M. How Can Rural Digitalization Improve Agricultural Green Total Factor Productivity: Empirical Evidence from Counties in China. Heliyon 2024, 10, e35296. [Google Scholar] [CrossRef] [PubMed]
- Karthickmanoj, R.; Sasilatha, T.; Lakshmi, D.; Goyal, V.; Ali, T.T.; Nautiyal, A.; Sharma, K.K.; Kumar, R.; Singh, S. Revolutionizing Agricultural Productivity with Automated Early Leaf Disease Detection System for Smart Agriculture Applications Using IoT Platform. Environ. Dev. Sustain. 2024, 1–17. [Google Scholar] [CrossRef]
- Luan, X.; Yasmeen, R.; Shah, W.U. Assessing Energy Efficiency, Regional Disparities in Production Technology, and Factors Influencing Total Factor Energy Productivity Change in The Agricultural Sector of China. Heliyon 2024, 10, e35043. [Google Scholar] [CrossRef] [PubMed]
- Huang, X.Q.; Feng, C.; Qin, J.H.; Wang, X.; Zhang, T. Measuring China’s Agricultural Green Total Factor Productivity and Its Drivers During 1998-2019. Sci. Total Environ. 2022, 829, 154477. [Google Scholar] [CrossRef]
- Qin, L.; Zhang, Y.; Wang, Y.; Pan, X.; Xu, Z. Research on the Impact of Digital Green Finance on Agricultural Green Total Factor Productivity: Evidence from China. Agriculture 2024, 14, 1151. [Google Scholar] [CrossRef]
- Fang, L.; Hu, R.; Mao, H.; Chen, S.J. How Crop Insurance Influences Agricultural Green Total Factor Productivity: Evidence from Chinese Farmers. J. Clean. Prod. 2021, 321, 128977. [Google Scholar] [CrossRef]
- Yu, D.S.; Liu, L.X.; Gao, S.H.; Yuan, S.Y.; Shen, Q.L.; Chen, H.P. Impact of Carbon Trading on Agricultural Green Total Factor Productivity in China. J. Clean. Prod. 2022, 367, 132789. [Google Scholar] [CrossRef]
- Ashour, M.A.; Nasser, M.S.A.; Abu-Zaid, T.S. Evaluation of The Effects of Improving Tertiary Earthen Canals on Water Savings, Conveyance Efficiency, and Agricultural Productivity. Ain Shams Eng. J. 2024, 15, 102850. [Google Scholar] [CrossRef]
- Li, R.; Chen, Q.; Li, M. The Impact of Digital Finance on Enhancing the Spatial Effects of Heterogeneous Environmental Regulations in Supporting Agricultural Green Total Factor Productivity. Agriculture 2024, 14, 995. [Google Scholar] [CrossRef]
- Mamun, A. Impact of Farm Subsidies on Global Agricultural Productivity. Agric. Econ. 2024, 55, 346–364. [Google Scholar] [CrossRef]
- Rehman, A.; Alam, M.M.; Alvarado, R.; Isik, C.; Ahmad, F.; Cismas, L.M.; Pupazan, M.C.M. Carbonization and Agricultural Productivity in Bhutan: Investigating the Impact of Crops Production, Fertilizer Usage, And Employment on CO2 Emissions. J. Clean. Prod. 2022, 375, 134178. [Google Scholar] [CrossRef]
- Rehman, A.; Ma, H.Y.; Khan, M.K.; Khan, S.U.; Murshed, M.; Ahmad, F.; Mahmood, H. The Asymmetric Effects of Crops Productivity, Agricultural Land Utilization, and Fertilizer Consumption on Carbon Emissions: Revisiting the Carbonization-Agricultural Activity Nexus in Nepal. Environ. Sci. Pollut. Res. 2022, 29, 39827–39837. [Google Scholar] [CrossRef]
- Sethi, L.; Behera, P.; Behera, B.; Sethi, N. Unravelling the Role of Renewable Energy, Information and Communication Technology and Agricultural Credit for Sustainable Agricultural Productivity in Developing Countries. Int. J. Sustain. Dev. World Ecology 2024, 31, 989–1003. [Google Scholar] [CrossRef]
- Schmutz, A.; Schoeb, C. Coadaptation of Coexisting Plants Enhances Productivity in an Agricultural System. Proc. Natl. Acad. Sci. USA 2024, 121, e2305517121. [Google Scholar] [CrossRef]
- Jelliffe, J.; Fuglie, K.; Morgan, S. Productivity-Led Pathways to Sustainable Agricultural Growth: Six Decades of Progress. EuroChoices 2024. Early View. [Google Scholar] [CrossRef]
- Hu, Y.; Liu, J.; Zhang, S.; Liu, Y.; Xu, H.; Liu, P. New Mechanisms for Increasing Agricultural Total Factor Productivity: Analysis of the Regional Effects of the Digital Economy. Econ. Anal. Policy 2024, 83, 766–785. [Google Scholar] [CrossRef]
- Chen, Y.F.; Miao, J.F.; Zhu, Z.T. Measuring Green Total Factor Productivity of China’s Agricultural Sector: A Three-Stage SBM-DEA Model with Non-Point Source Pollution and CO2 Emissions. J. Clean. Prod. 2021, 318, 128543. [Google Scholar] [CrossRef]
- Wen, C.; Hu, B.; Sun, Y.; Xiao, Y. Spatio-Temporal Differentiation on China’s Green Agricultural Total Factor Productivity Guided by Digital Technology and Fuzzy Systems. Cogent Food Agric. 2024, 10, 2311962. [Google Scholar] [CrossRef]
- USDA Foreign Agricultural Service. China: Agricultural and Rural Modernization Plan Reiterates Prior Pledges. 2022. Available online: https://fas.usda.gov/data/china-agricultural-and-rural-modernization-plan-reiterates-prior-pledges (accessed on 1 September 2024).
- USDA Foreign Agricultural Service. China: Planting Seed 2023 Annual. 2023. Available online: https://fas.usda.gov/data/china-planting-seed-2023-annual (accessed on 1 September 2024).
- Han, Y.; Paudel, K.P.; Wan, J.; He, Q. Five-Year Plan and Agricultural Productivity in China. China Agric. Econ. Rev. 2022, 15, 214–237. [Google Scholar] [CrossRef]
- European Commission. A Farm to Fork Strategy for A Fair, Healthy and Environmentally-Friendly Food System. 2020. Available online: https://eur-lex.europa.eu/legal-content/EN/TXT/?uri=CELEX%3A52020DC0381 (accessed on 1 September 2024).
- uropean Commission. Financing the Common Agricultural Policy. 2024. Available online: https://agriculture.ec.europa.eu/common-agricultural-policy/financing-cap/cap-funds_en (accessed on 1 September 2024).
- European Commission. Strategic Dialogue Report on Food System Transformation. 2024. Available online: https://agriculture.ec.europa.eu/document/download/171329ff-0f50-4fa5-946f-aea11032172e_en (accessed on 1 September 2024).
- Li, H.J.; Tang, M.Q.; Cao, A.D.; Guo, L.L. Assessing the Relationship Between Air Pollution, Agricultural Insurance, and Agricultural Green Total Factor Productivity: Evidence from China. Environ. Sci. Pollut. Res. 2022, 29, 78381–78395. [Google Scholar] [CrossRef] [PubMed]
- Hu, Y.; Liu, C.; Peng, J.G. Financial Inclusion and Agricultural Total Factor Productivity Growth in China. Econ. Model. 2021, 96, 68–82. [Google Scholar] [CrossRef]
- Chena, C.; Restuccia, D.; Santaeulàlia-Llopis, R. The Effects of Land Markets on Resource Allocation and Agricultural Productivity. Rev. Econ. Dyn. 2022, 45, 41–54. [Google Scholar] [CrossRef]
- Sun, Y.C. Environmental Regulation, Agricultural Green Technology Innovation, and Agricultural Green Total Factor Productivity. Front. Environ. Sci. 2022, 10, 955954. [Google Scholar] [CrossRef]
- Hong, M.Y.; Tian, M.J.; Wang, J. Digital Inclusive Finance, Agricultural Industrial Structure Optimization and Agricultural Green Total Factor Productivity. Sustainability 2022, 14, 11450. [Google Scholar] [CrossRef]
- Xiong, C.H.; Wang, G.L.; Xu, L.T. Spatial Differentiation Identification of Influencing Factors of Agricultural Carbon Productivity at City Level in Taihu Lake Basin, China. Sci. Total Environ. 2021, 800, 149610. [Google Scholar] [CrossRef]
- Boahen, E.A.; Dankwah, J.B.; Berko, D. Understanding the Gender Gap in Productivity in Agricultural Production among Smallholder Cereal Growers in Rural Ghana. Cogent Econ. Financ. 2024, 12, 2318979. [Google Scholar] [CrossRef]
- Espoir, D.K.; Bannor, F.; Sunge, R. Intra-Africa Agricultural Trade, Governance Quality and Agricultural Total Factor Productivity: Evidence from A Panel Vector Autoregressive Model. Eur. J. Dev. Res. 2024, 36, 1299–1341. [Google Scholar] [CrossRef]
- Akram-Lodhi, A.H. ‘Women Stay Behind and Grow the Food’: Agricultural Productivity and the Interstices of Petty Commodity Production and Reproductive Labour in Tanzania. J. Agrar. Change 2024, e12588. [Google Scholar] [CrossRef]
- Patel, R.R. Addressing Rural Poverty, Efficacy of MGNREGA and Migration against Agricultural Productivity: Case of Kalahandi, India. J. Poverty 2024, 1–25. [Google Scholar] [CrossRef]
- Ramzan, M.; Iqbal, H.A.; Usman, M.; Ozturk, I. Environmental Pollution and Agricultural Productivity in Pakistan: New Insights from ARDL and Wavelet Coherence Approaches. Environ. Sci. Pollut. Res. 2022, 29, 28749–28768. [Google Scholar] [CrossRef]
- Li, X.G.; Liu, J.D.; Huo, X.X. Impacts of Tenure Security and Market-Oriented Allocation of Farmland on Agricultural Productivity: Evidence from China’s Apple Growers. Land Use Policy 2021, 102, 105233. [Google Scholar] [CrossRef]
- Sohail, M.T.; Mustafa, S.; Ali, M.M.; Riaz, S. Agricultural Communities’ Risk Assessment and the Effects of Climate Change: A Pathway Toward Green Productivity and Sustainable Development. Front. Environ. Sci. 2022, 10, 948016. [Google Scholar] [CrossRef]
- Bocean, C.G. A Cross-Sectional Analysis of the Relationship between Digital Technology Use and Agricultural Productivity in EU Countries. Agriculture 2024, 14, 519. [Google Scholar] [CrossRef]
- Zhu, Y.Y.; Zhang, Y.; Piao, H.L. Does Agricultural Mechanization Improve the Green Total Factor Productivity of China’s Planting Industry? Energies 2022, 15, 940. [Google Scholar] [CrossRef]
- Pixia Team. Database of Point of Interest. 2024. Available online: http://www.ppmandata.cn/ (accessed on 30 June 2024).
- Gebeyehu, L.; Bedemo, A. How Agricultural Credit and Subsidies Impact Agricultural Productivity in Ethiopia: Empirical Evidence Using ARDL Model. Cogent Food Agric. 2024, 10, 2329118. [Google Scholar] [CrossRef]
- Gelu, G.; Dane, C.; Ayza, A.; Habtewold, M. Optimal Agricultural Water Allocation for Enhanced Productivity of Hot Pepper (Capsicum annum L.) and Economic Gain: An Experimental Study from Southern Ethiopia. Cogent Food Agric. 2024, 10, 2313045. [Google Scholar] [CrossRef]
- Zhu, Q.; van der Voort, M.; de Mey, Y.; Bai, J. How Can Information and Communication Technologies Influence Farmers’ Agricultural Income and Labor Productivity? Micro Evidence from China. Appl. Econ. 2024, 1–14. [Google Scholar] [CrossRef]
- Raihan, A. The Dynamic Nexus Between Economic Growth, Renewable Energy Use, Urbanization, Industrialization, Tourism, Agricultural Productivity, Forest Area, and Carbon Dioxide Emissions in the Philippines. Energy Nexus 2023, 9, 100180. [Google Scholar] [CrossRef]
- Raihan, A.; Tuspekova, A. Nexus Between Economic Growth, Energy Use, Agricultural Productivity, and Carbon Dioxide Emissions: New Evidence from Nepal. Energy Nexus 2022, 7, 100113. [Google Scholar] [CrossRef]
- Soni, S.; Manogna, R.L. The Dynamic Nexus between Agricultural Productivity and Renewable Energy Consumption In BRICS: The Role of Financial Inclusion and Foreign Direct Investment. Int. J. Energy Sect. Manag. 2024. ahead-of-print. [Google Scholar] [CrossRef]
- Valea, A.B.; Noufé, T. Gender Gap in Agricultural Productivity: Evidence from Burkina Faso. Int. J. Soc. Econ. 2024. ahead-of-print. [Google Scholar] [CrossRef]
- Aytop, H.; Pinar, M.Ö. Evaluation of Agricultural Productivity Loss of Vineyards Through Water Erosion in Türkiye. Appl. Fruit Sci. 2024, 66, 667–676. [Google Scholar] [CrossRef]
- Emami, S.; Dehghanisanij, H. Fault Tree Analysis of Trade-Offs between Environmental Flows and Agricultural Water Productivity in the Lake Urmia Sub-Basin Using Agent-Based Modeling. Water 2024, 16, 844. [Google Scholar] [CrossRef]
- Rocha, A.B., Jr.; Ferreira, J.B.D. Assessing the Productivity Effects of Agricultural Extension in A Pluralistic System: An Analysis of Brazilian Family Farming in 2017. J. Agric. Educ. Ext. 2024, 1–23. [Google Scholar] [CrossRef]
- Chen, X.; Wang, L.; Cao, Q.; Sun, J.; Niu, Z.; Yang, L.; Jiang, W. Response of Global Agricultural Productivity Anomalies to Drought Stress in Irrigated and Rainfed Agriculture. Sci. China-Earth Sci. 2024, 1–15. [Google Scholar] [CrossRef]
- Hamory, J.; Kleemans, M.; Li, N.Y.; Miguel, E. Reevaluating Agricultural Productivity Gaps with Longitudinal Microdata. J. Eur. Econ. Assoc. 2021, 19, 1522–1555. [Google Scholar] [CrossRef] [PubMed]
- Özdemir, D. The Impact of Climate Change on Agricultural Productivity in Asian Countries: A Heterogeneous Panel Data Approach. Environ. Sci. Pollut. Res. 2022, 29, 8205–8217. [Google Scholar] [CrossRef] [PubMed]
- Song, M.; Wu, Q.; Zhu, H. Could The Aging of The Rural Population Boost Green Agricultural Total Factor Productivity? Evidence from China. Sustainability 2024, 16, 6117. [Google Scholar] [CrossRef]
- Liu, D.D.; Zhu, X.Y.; Wang, Y.F. China’s Agricultural Green Total Factor Productivity Based on Carbon Emission: An Analysis of Evolution Trend and Influencing Factors. J. Clean. Prod. 2021, 278, 123692. [Google Scholar] [CrossRef]
- Zhou, X.S.; Ma, W.L. Agricultural Mechanization and Land Productivity in China. Int. J. Sustain. Dev. World Ecol. 2022, 29, 530–542. [Google Scholar] [CrossRef]
- Kitole, F.A.; Ojo, T.O.; Mkuna, E.J. Unveiling the Nexus Between Maltreatment of Smallholder Youth Farmers and Agricultural Productivity in Tanzania. Sci. Afr. 2024, 25, e02270. [Google Scholar] [CrossRef]
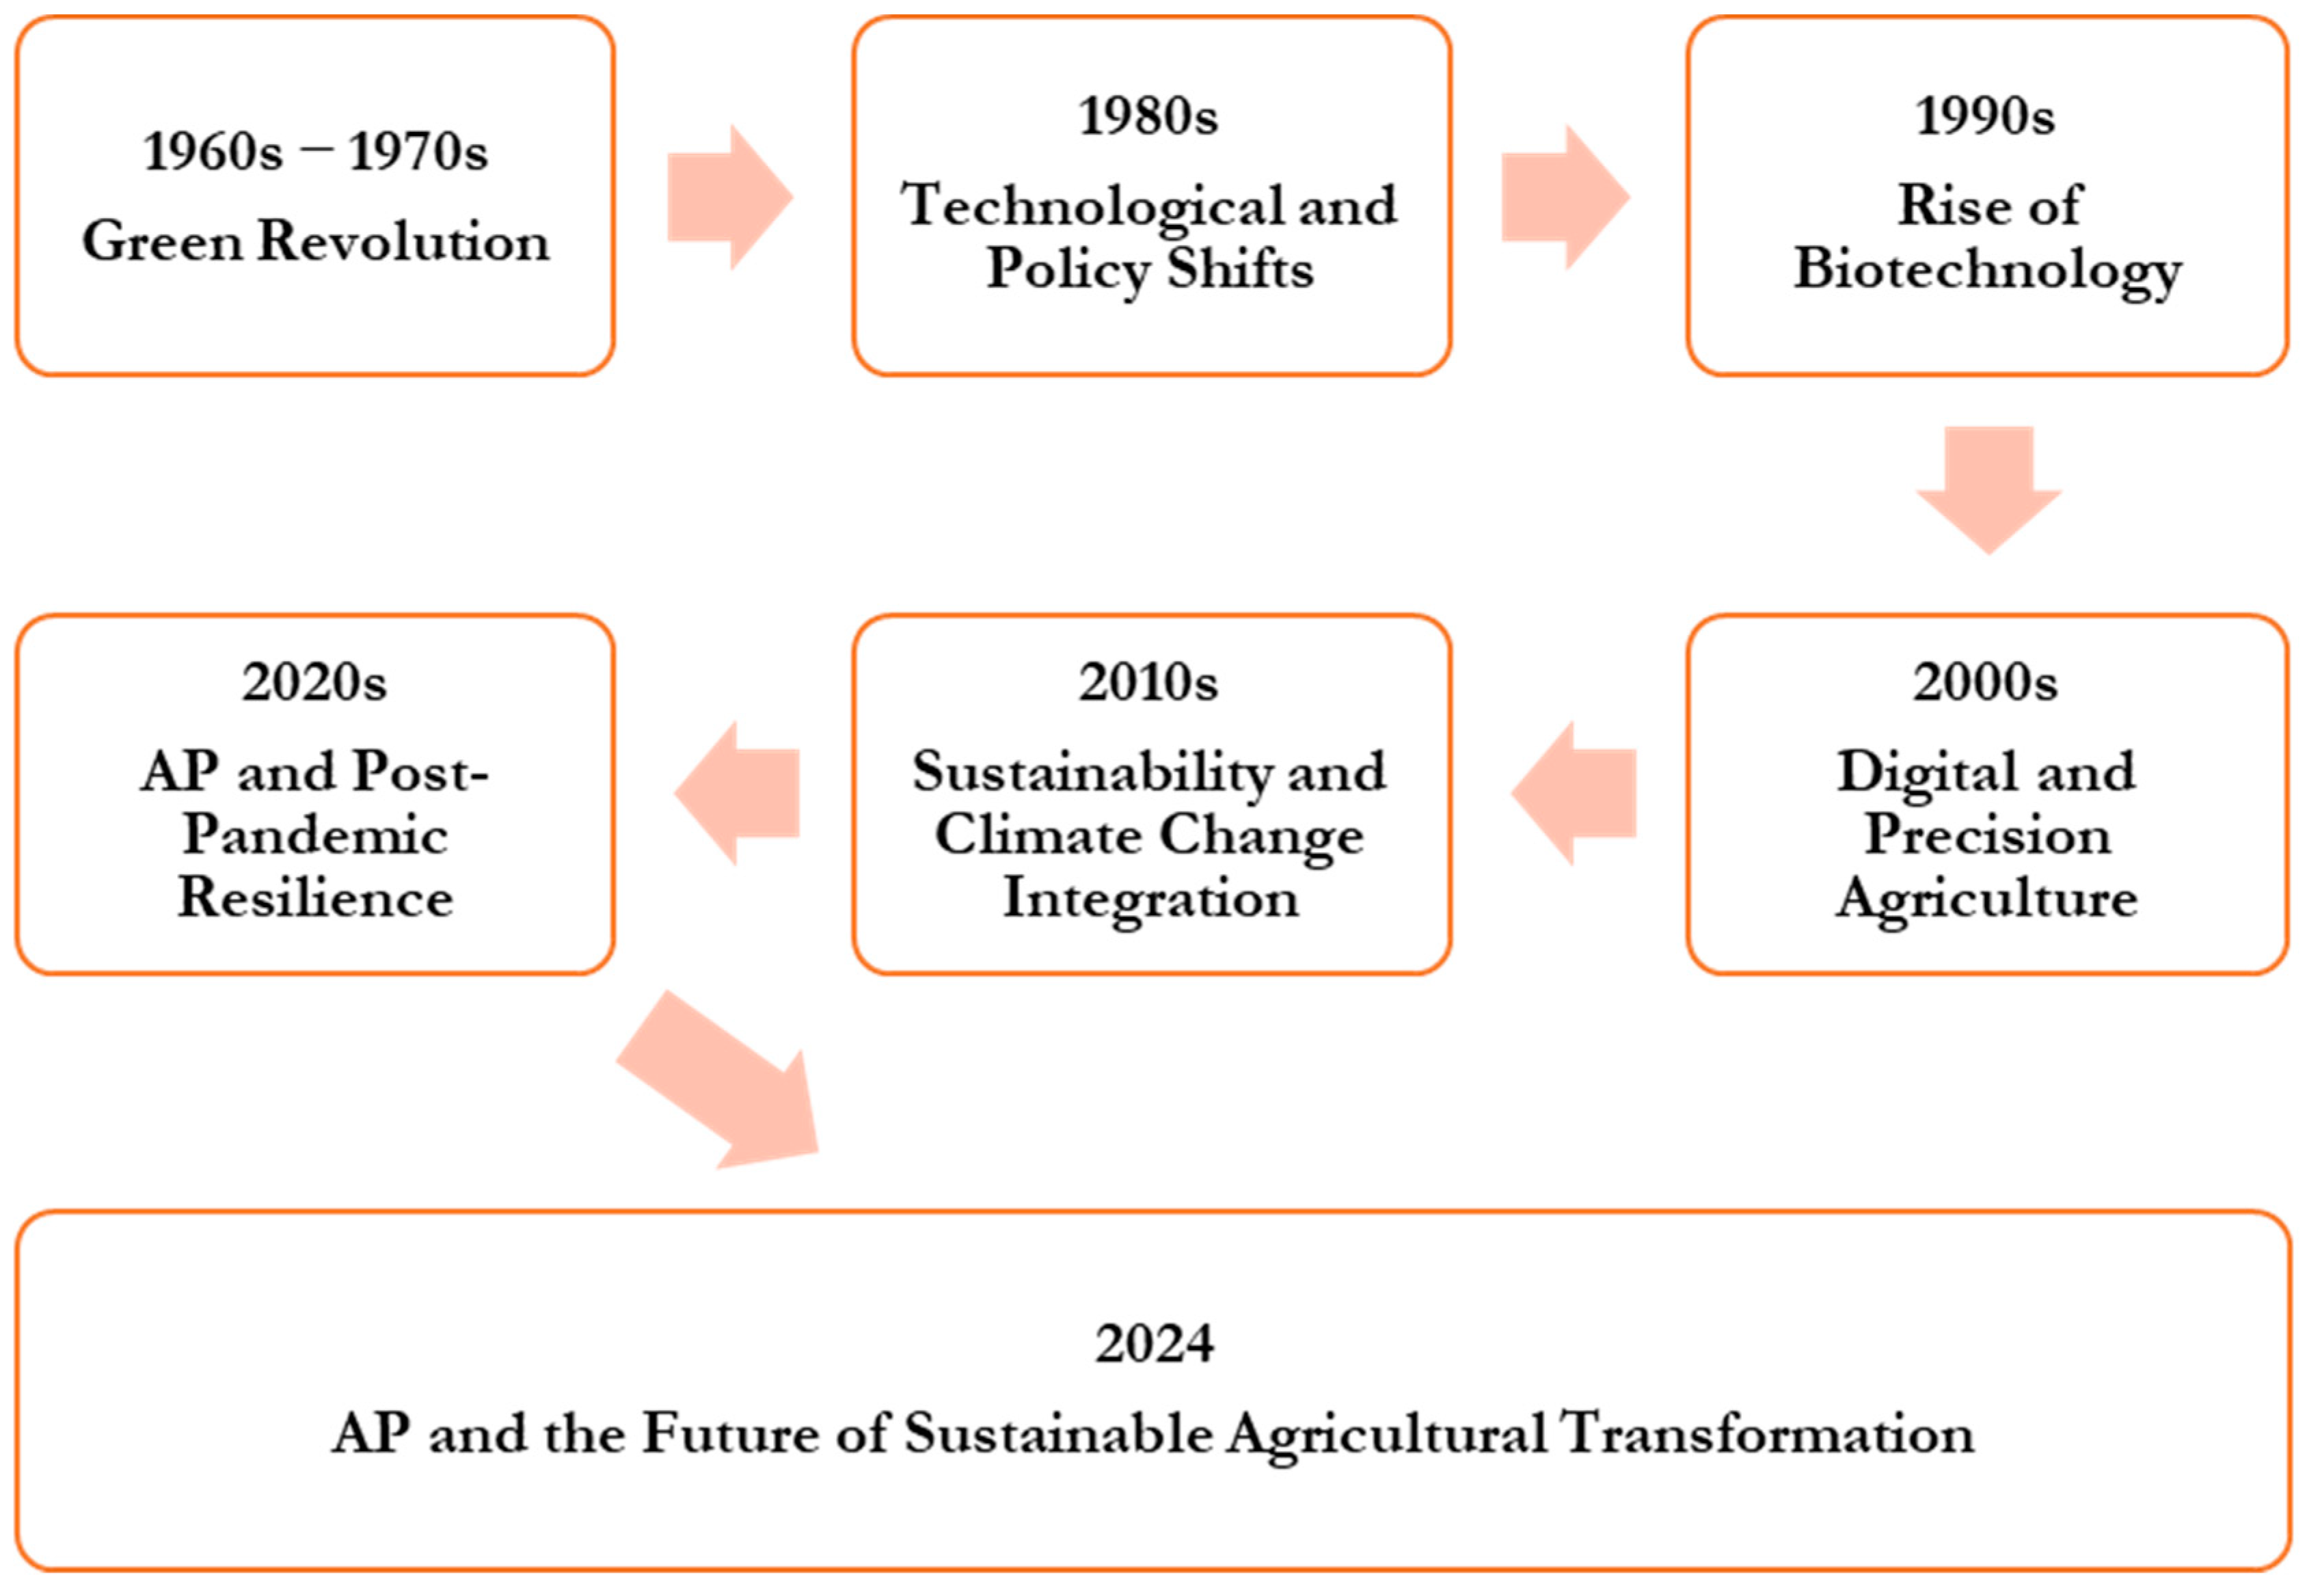
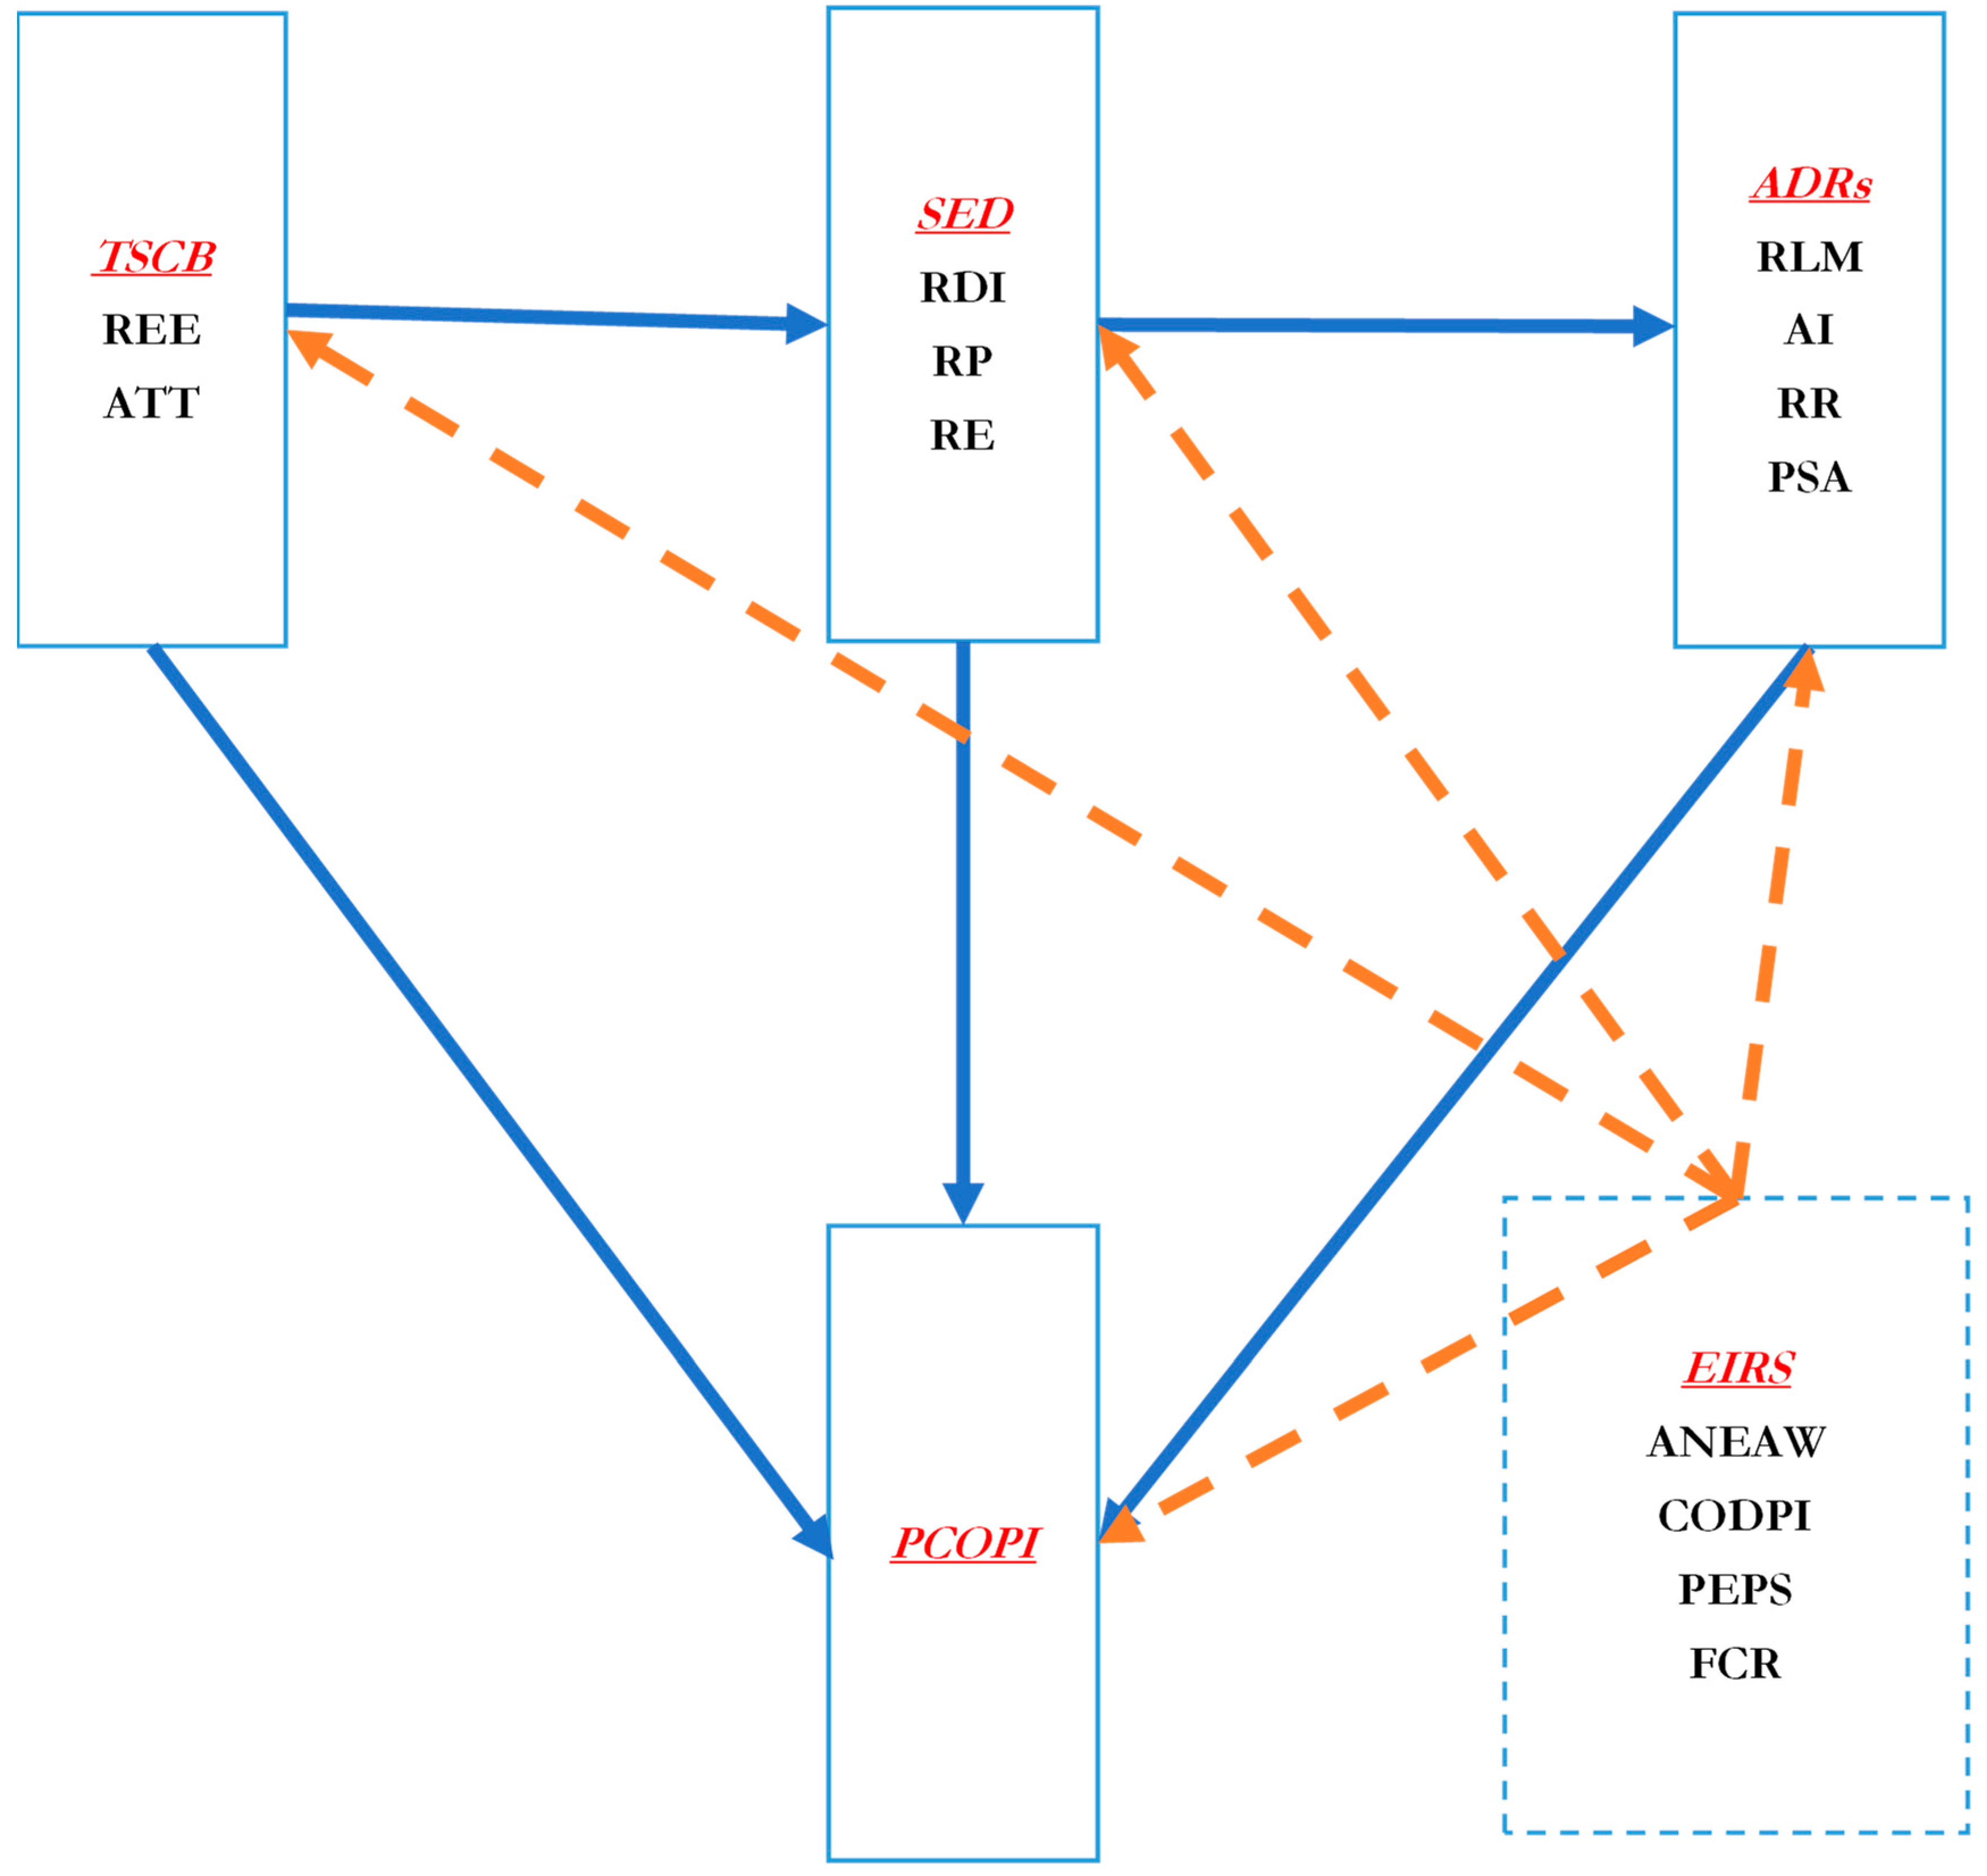
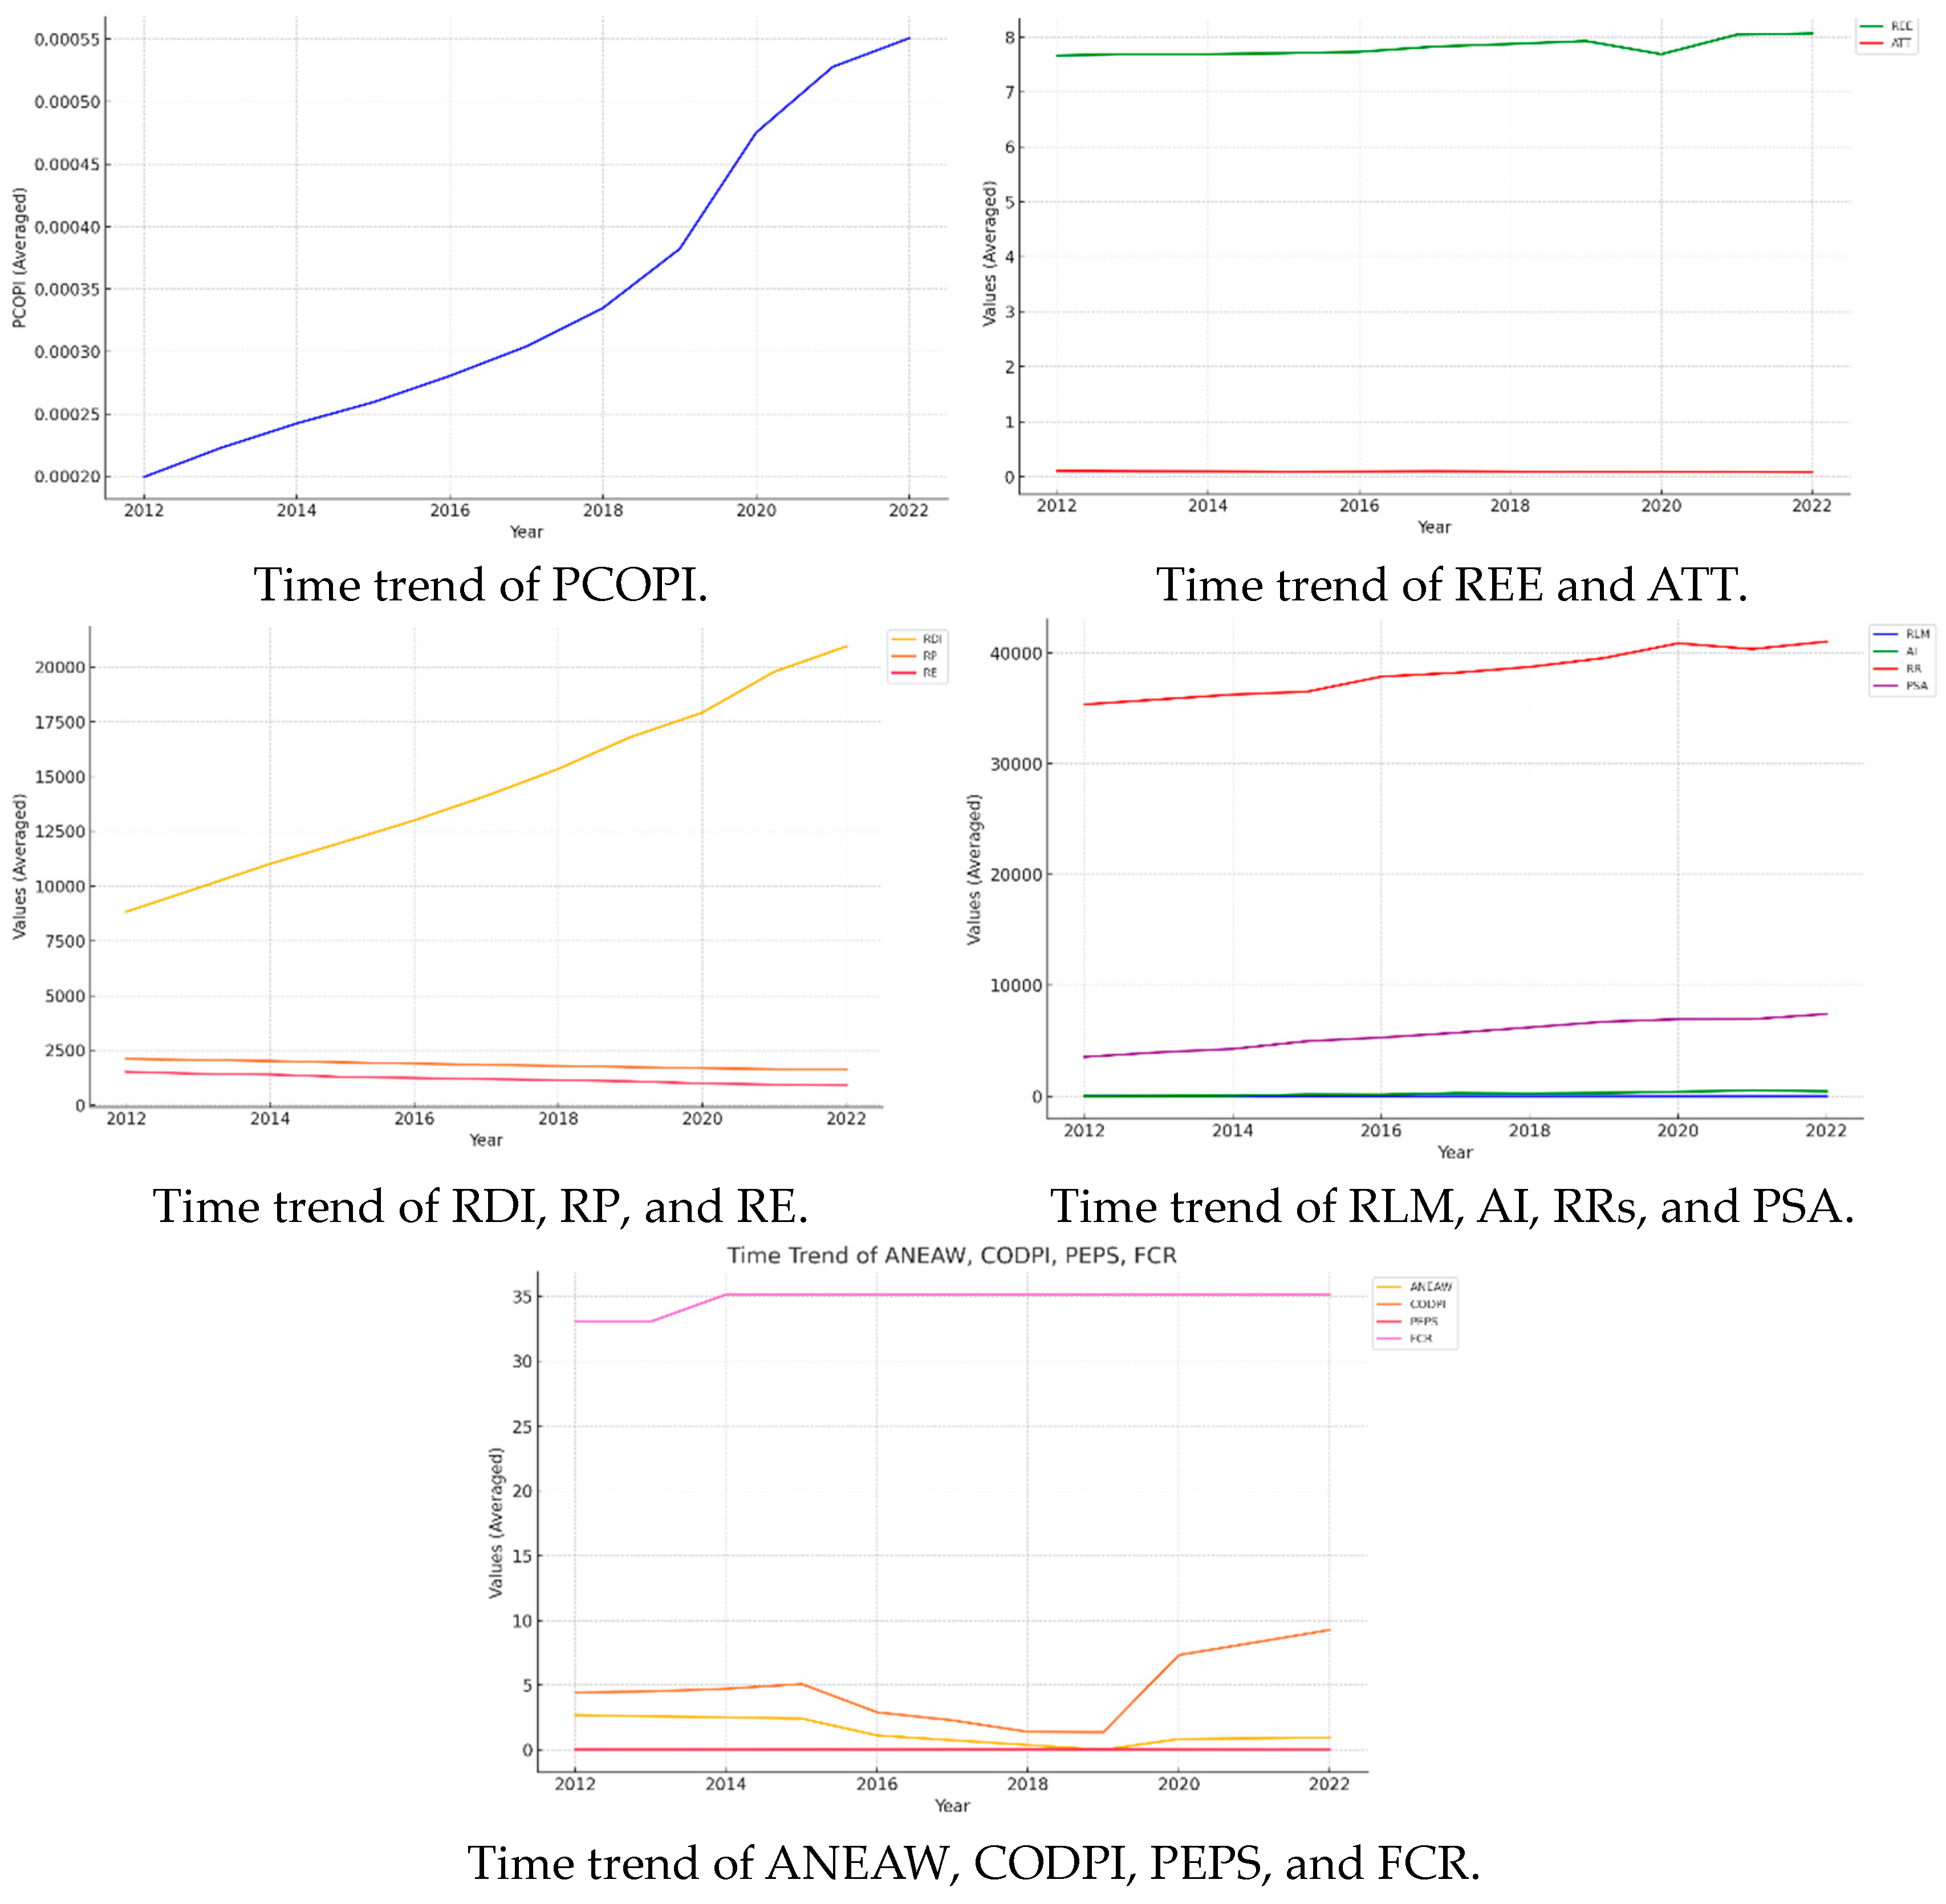
Disclaimer/Publisher’s Note: The statements, opinions and data contained in all publications are solely those of the individual author(s) and contributor(s) and not of MDPI and/or the editor(s). MDPI and/or the editor(s) disclaim responsibility for any injury to people or property resulting from any ideas, methods, instructions or products referred to in the content. |
© 2024 by the authors. Licensee MDPI, Basel, Switzerland. This article is an open access article distributed under the terms and conditions of the Creative Commons Attribution (CC BY) license (https://creativecommons.org/licenses/by/4.0/).