Article

Three-Dimensional Coupled Temporal Geomechanical Model for Fault-Reactivation and Surface-Deformation Evaluation during Reservoir Depletion and CO2 Sequestration, Securing Long-Term Reservoir Sustainability

by
Sirous Hosseinzadeh
1,*,
Reza Abdollahi
1,
Saeed Salimzadeh
2 and
Manouchehr Haghighi
1
1
School of Chemical Engineering, Discipline of Mining and Petroleum Engineering, The University of Adelaide, Adelaide, SA 5005, Australia
2
Commonwealth Scientific and Industrial Research Organization (CSIRO), Melbourne, VIC 3168, Australia
*
Author to whom correspondence should be addressed.
Sustainability 2024, 16(19), 8482; https://doi.org/10.3390/su16198482 (registering DOI)
Submission received: 20 August 2024 / Revised: 16 September 2024 / Accepted: 21 September 2024 / Published: 29 September 2024

Abstract

:
Assessing reservoir subsidence due to depletion involves understanding the geological and geophysical processes that lead to ground subsidence as a result of reservoir fluid extraction. Subsidence is a gradual sinking or settling of the Earth’s surface, and it can occur when hydrocarbons are extracted from underground reservoirs. In this study, a time-integrated 3D coupled geomechanical modeling incorporating the fourth dimension—time—into traditional 3D geomechanical models has been constructed utilizing seismic inversion volumes and a one-dimensional mechanical Earth model (1D MEM). The 3D geomechanical model was calibrated to the 1D MEM results. Geomechanical rock properties were derived from the density and sonic log data that was distributed with conditioning to the seismic inversion volumes obtained from running pre-stack inversion. The standard elastic parameter equations were used to generate estimates of the elastic moduli. These properties are dynamic but have been converted to static values using additional equations used in the 1D MEM study. This included estimating the Unconfined Compressive Strength. In situ stresses were matched using different minimum horizontal principal stress gradients and horizontal principal stress ratios. The match is good except where the weak carbonate faults are close to the wells, where the Shmin magnitudes tend to decrease. The SHmax orientations were assessed from image log data and indicated to be 110° in the reservoir section. A time-integrated 3D coupled simulation was created using the finite-element method (FEM). The effective stresses increase while there is depletion in all directions, especially in the Z direction. The predicted compaction in the reservoir and overburden was 350 mm. Most of the compaction occurs at the reservoir level and dissipates towards the surface (seabed). Furthermore, the case displayed no shear failure that might cause or fault reactivation in the reservoir interval (Kangan–Dalan Formations) located in the simulated area. In this study, we applied an integrated and comprehensive geomechanical approach to evaluate subsidence, fault reactivation and stress alteration, while reservoir depletion was assessed using seismic inversion, well logs, and experiment data. The deformation monitoring of geological reservoirs, whether for gas storage or hazardous gas disposal, is essential due to the economic value of the stored assets and the hazardous nature of the disposed materials. This monitoring is vital for ensuring the sustainability of the reservoir by maintaining operational success and detecting integrity issues.

1. Introduction

The stress changes and compaction of reservoirs serve as an additional driving force for production, contributing a substantial percentage (ranging from 50% to 80%) of the total energy [1,2,3]. This process has significant repercussions both within and beyond reservoirs. The most apparent consequence is the deformation of the surface or seafloor, known as subsidence, leading to well losses and diminished production, and causing irreparable harm to surface structures and the surrounding environment [4,5,6,7,8]. From an engineering standpoint, an imprecise assessment of the compaction impact may result in either overestimating or underestimating reserves, including in gas reservoirs [9,10,11].
Understanding the interplay between geomechanics and reservoir flow necessitates conducting combined studies involving rock mechanics and reservoir simulators [12]. As a result of this interaction, alterations in reservoir stresses significantly impact shifts in permeability and porosity, consequently affecting hydrocarbon production [12,13,14,15]. Many activities within the subsurface engineering field focus on the interaction between fluid flow, geomechanical reactions, formation fracturing, and heat transfer [16,17,18,19] Research endeavors, as highlighted by Dusseault et al. (2004) [17], David et al. (2007) [12], yuan et al. (2018) [16], Vidal-Gilbert et al. (2009) [16], and Teatini et al. (2014) [20], have predominantly focused, whether through experimental or theoretical approaches, on understanding the influence of rock formation damage caused by alterations in reservoirs properties, particularly in relation to depleted reservoirs.
Integrating rock mechanical properties with a dynamic model for real-world issues poses challenges in terms of both simulator development and computational expenses; therefore, selecting an efficient coupling approach is crucial [4]. There are different models that address the coupling between dynamic properties and geomechanical models, including the following:
  • Coupled Fluid Flow and Geomechanics Models: These models consider the simultaneous interaction between fluid flow (e.g., multiphase flow, fluid injection) and the mechanical response of the reservoir rock. They account for changes in pore pressure, stress distribution, and deformation during fluid flow processes [21,22].
  • Thermal–Hydrological–Mechanical (THM) Coupled Models: THM models integrate thermal, hydraulic, and mechanical processes to analyze the effects of temperature changes, fluid flow, and mechanical loading on reservoir behavior [23,24]. They are particularly relevant in geothermal reservoirs or applications involving thermal recovery techniques [25,26].
  • Reservoir Compaction Models: These models focus on predicting reservoir compaction due to fluid production or injection. They consider the mechanical properties of the rock, pore-pressure changes, and stress redistribution to simulate compaction-induced subsidence and its impact on reservoir performance [4,23,26].
  • This categorization depends on the complexity involved in developing a simulator and the level of consistency in results needed to solve for the primary variables [20,27]. One-way coupling simplifies the computational complexity compared to fully coupled models, making simulations more computationally efficient. This allows for faster model execution and analysis, particularly for large-scale reservoir simulations [28].
  • One-way coupled fluid flow and geomechanics models offer a balance between computational efficiency and insight into reservoir behavior, making them valuable tools for reservoir engineering studies and decision-making processes [29,30]. By adding time as the fourth dimension, these models facilitate a more accurate portrayal of reservoir dynamics, accommodating fluctuations in pressure, stress, and rock deformation throughout the production lifecycle. This temporal inclusion proves invaluable for forecasting the enduring impacts of fluid extraction on subsurface stability [26,30].
Ranjbar et al. (2017) [31] and Mahajan et al. (2018) [32] conducted a coupled geomechanical model to evaluate the value of compaction due to depletion. However, the results of seismic inversion as well as the effective and total stress alteration throughout the field due to the depletion were not considered. This study presents a comprehensive approach to assessing reservoir subsidence and associated geomechanical effects due to depletion in a gas reservoir. The primary objective was to integrate a time-integrated 3D coupled geomechanical model, incorporating time as a crucial dimension, with traditional 3D modeling techniques to accurately predict subsidence, stress alterations, and potential fault reactivation. The workflow begins with the construction of a 1D mechanical earth model (1D MEM) using well-log data to estimate static elastic properties and pore pressures. These results were then utilized to populate a 3D geomechanical model, employing kriging interpolation weighted by seismic inversion data. The model was further integrated with a dynamic hydraulic simulation to evaluate stress distribution and deformation within and around the reservoir over time. A key contribution of this study is the detailed calibration of the model against observational data, providing a validated 3D geomechanical framework that can inform future well-trajectory planning and surface-displacement predictions. This study’s findings, including the prediction of compaction primarily above the reservoir, and the absence of fault reactivation, underscore the utility of this integrated approach in mitigating risks associated with gas storage in porous media, such as methane, CO2, and hydrogen. This methodology is broadly applicable, offering valuable insights for the effective management and safe operation of subsurface storage projects.

2. Geological Setting

The studied field is a structure in the northwestern part of Farsi Block in the Iranian waters of the Persian Gulf (Figure 1). The water depth ranges from 20 to 90 m, with its southern limits at the Iran–Saudi Arabia international boundary. Farsi Block is located in the prolific hydrocarbon-rich Persian Gulf, close to a number of oil- and gas-producing fields [33]. The Kangan and Dalan Formations are prolific producers of gas in the contiguous fields on the Arabian Platform [34]. This field is an asymmetrical salt domal structure with an E–W trend, which possibly formed due to the movement of Hormuz salt [33]. Using the spill point as the lower limit of the Kangan Formation structure, this field is approximately 15.8 km long and 16 km wide on top of Kangan in Iranian territory.
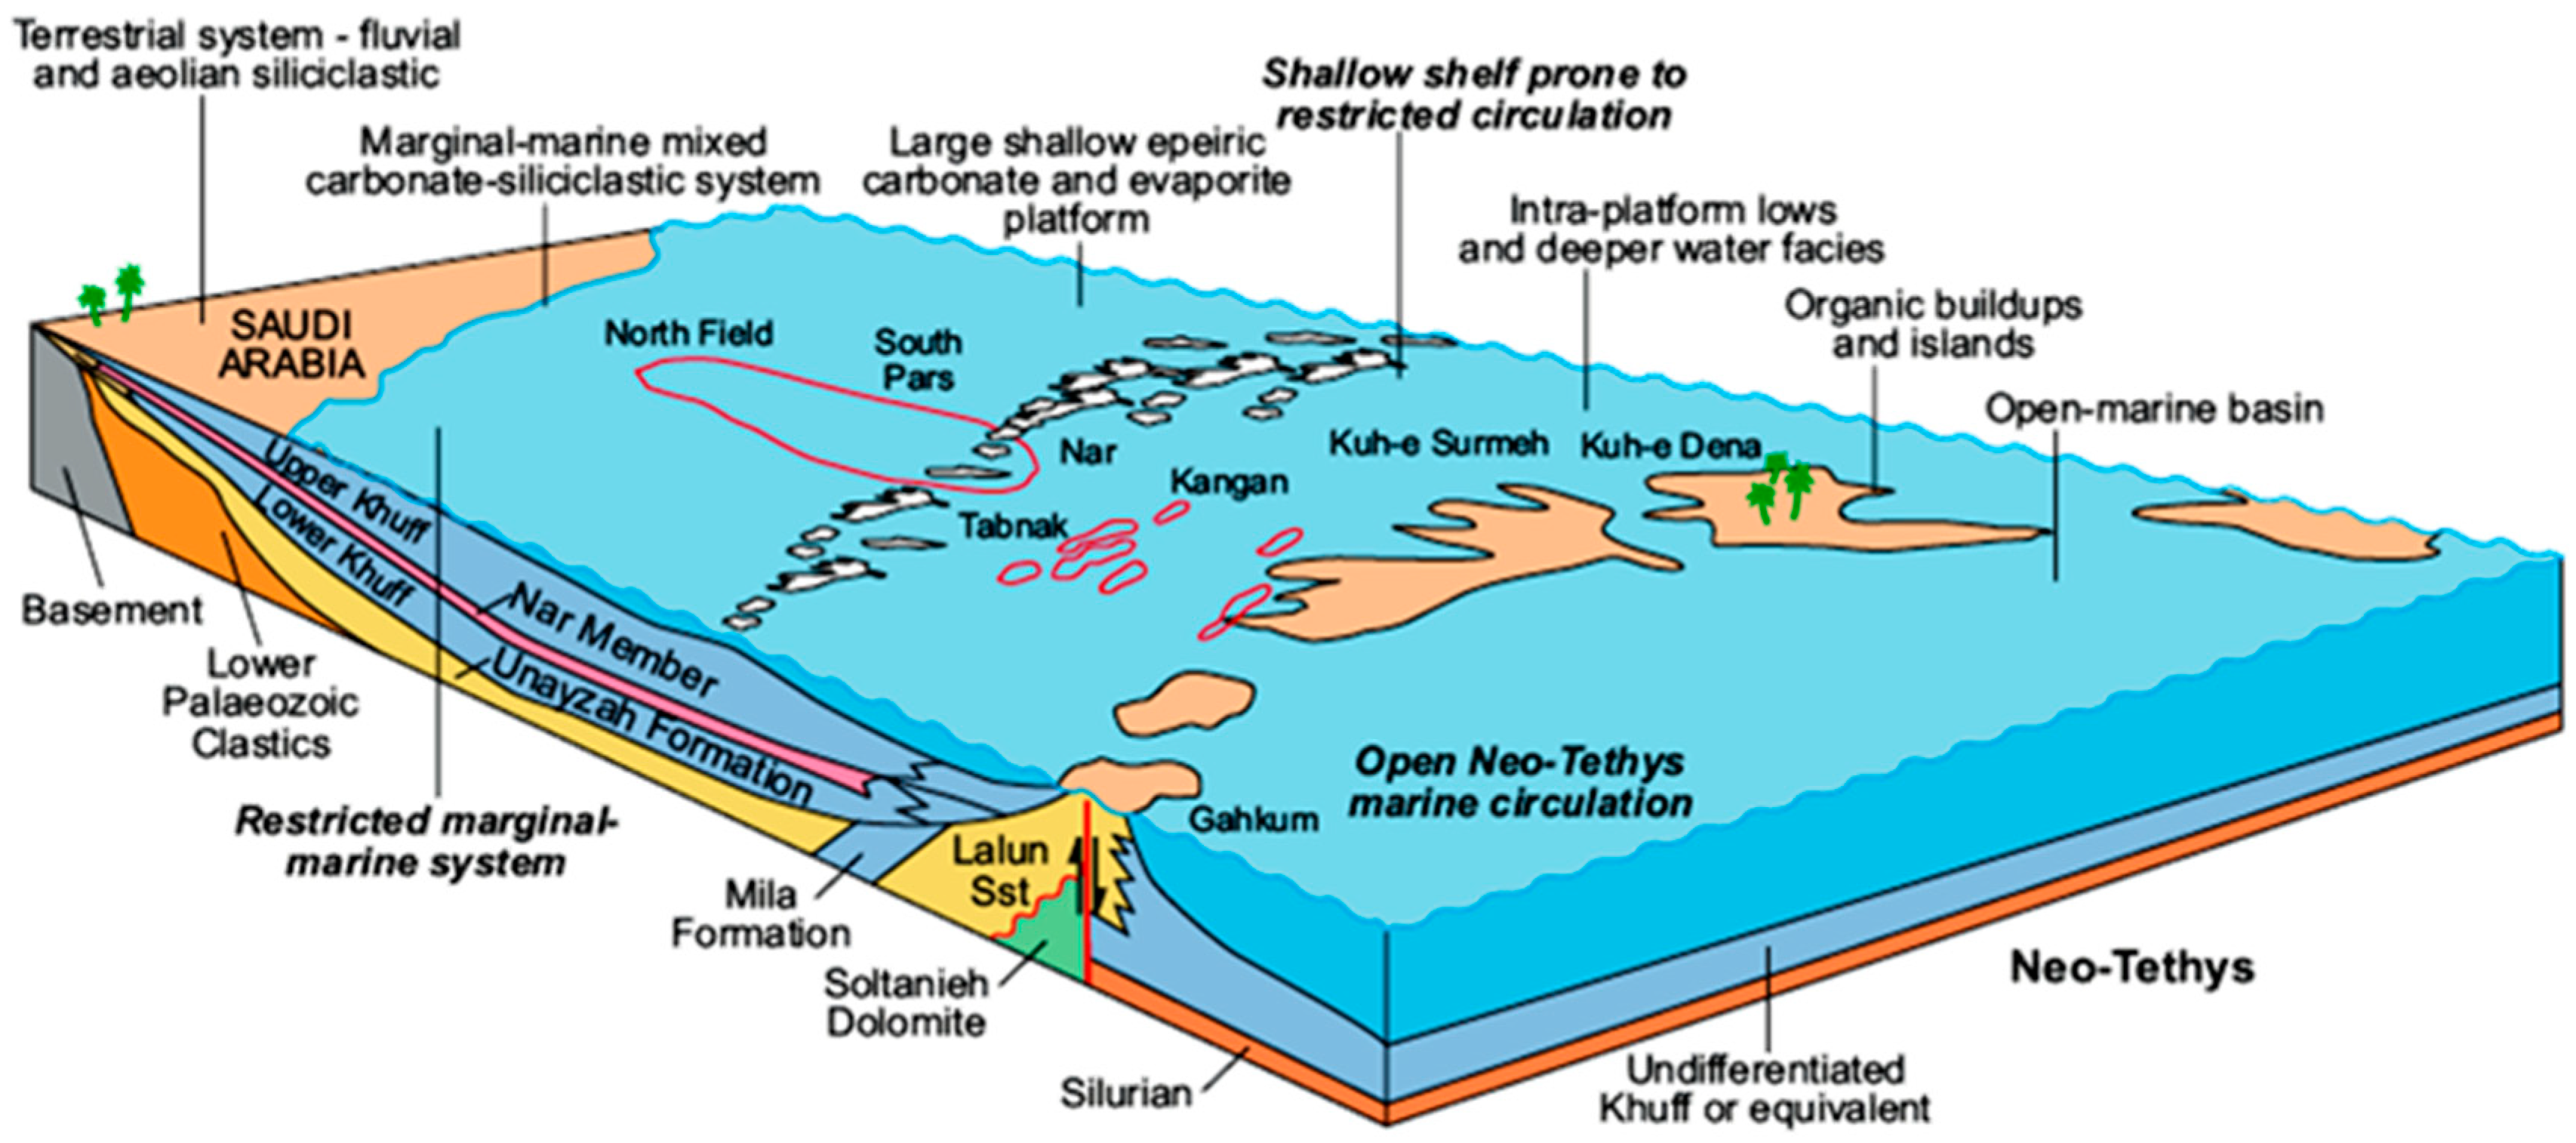
The Kangan and Dalan Formations, which deposited during the Permian-Triassic period, are commonly referred to as the Kuff Formation within the Arabian Plate [34]. In the Late Permian, due to the opening of Neo-Tethys Ocean and continental rifting along the Zagros Suture (Figure 1a) [34], a transgression occurred and a regional cyclic carbonate sedimentary environment dominated in the area (Figure 2) [36]. During this period, the thick carbonate and anhydrite sequence of the Dalan Formation were deposited [34]. The same set of sediments continued to be deposited during the Early Triassic, just under a slightly more restricted environment, producing the Kangan Formation [37]. The carbonates host oil and gas fields located in the southwest of Iran. Reservoirs overlay the anhydritic Nar Member of Dalan and are underlain by the Upper Kangan non-reservoir unit [37]. As such, the gas reservoirs (K1 to K4) include both Upper Permian and Lower Triassic carbonates and evaporites (Figure 1c) [36,38]. In the southwest region of Iran, the Dalan Formation is situated beneath the lower Triassic Kangan sediments, with a noticeable unconformity separating the two. The Dalan Formation can be subdivided into three primary intervals, known as the Lower Dalan, Nar member, and Upper Dalan, in ascending order. The Lower Dalan (K5 unit) and Upper Dalan (K3 and K4 units) sequences are predominantly composed of carbonate rocks with significant diagenesis [37]. These intervals are divided by a substantial anhydrite member, referred to as the Nar member, characterized by a calcareous section in the lower portion and a shaly section in the upper interval [39,40]. The reservoir section of these formations is segmented into four units, comprising K1 and K2 within the Kangan Formation, and K3 and K4 within the upper Dalan (Figure 2) [40,41].

3. Available Data and Methodology

To construct an MEM using Visage software (version 2023.2), it is essential to amalgamate information from diverse sources to precisely characterize the formations in relation to their geomechanical attributes. Therefore, the initial phase of the geomechanics investigation is data collection. The data accessible for the present investigation consist of the following:
  • Formation markers.
  • Drilling and completion report.
  • Graphic well logs.
  • Final geological reports.
  • Compressional and shear velocity.
  • Conventional full-suit logs.
  • Static formation pressure data.
  • Caliper logs.
  • Geomechanical and petrophysical core data.
  • Seismic inversion results (Table 1).
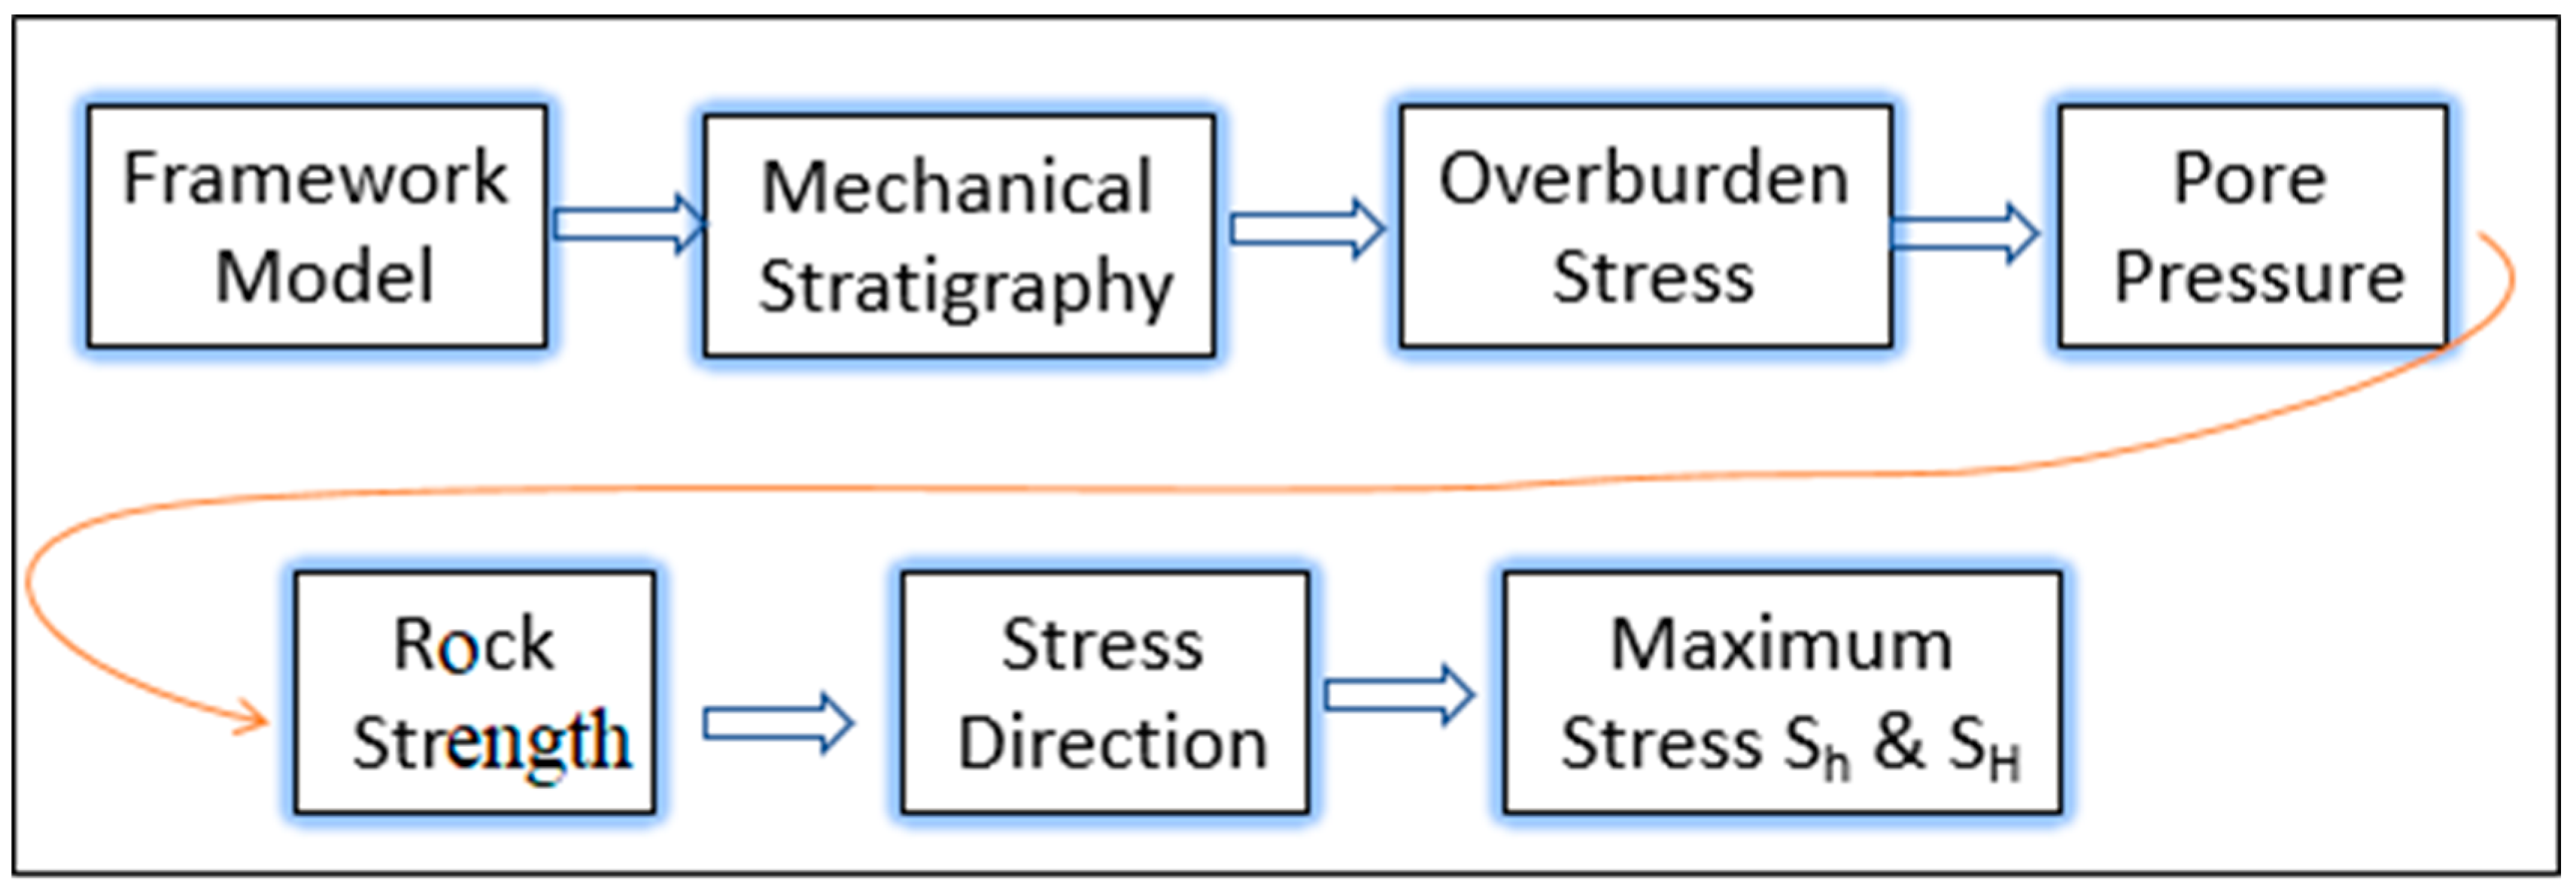
It is necessary to construction an MEM to better define a reservoir’s geomechanics data. The MEM provides an expression of the formations’ geomechanical properties based on depth and referenced to the stratigraphic column. When an MEM is established, it can be applied to predict and consider the best probable approaches for wellbore stability and field development. The steps involved in the MEM workflow applied in this study are summarized in Figure 3.
For estimating in situ stresses, the measurement and calculation of the elastic parameters of rocks is a crucial primary step [44]. The fundamental inputs for estimating rock strength and in situ stresses are provided by the elastic properties of rocks, which can subsequently undergo refinement and calibration based on additional available data [44].
Under the assumption of elastic isotropy, sonic measurements such as compressional slowness ( Δ t c ), shear slowness ( Δ t s ), and bulk density ( ρ b ) were employed alongside the following equations to compute the dynamic elastic moduli (Equations (1)–(4)) [45]:
G = ρ b ( Δ t s ) 2
K d y n = ρ b 1 Δ t c 2 4 3 G d y n
E d y n = 2 G ( 1 + ν )
ν d y n = 1 2 Δ t s Δ t c 2 1 Δ t s Δ t c 2 1
where ρ b is the formation bulk density (g/cm3); Δ t c is the compressional slowness; and Δ t s is the shear slowness.
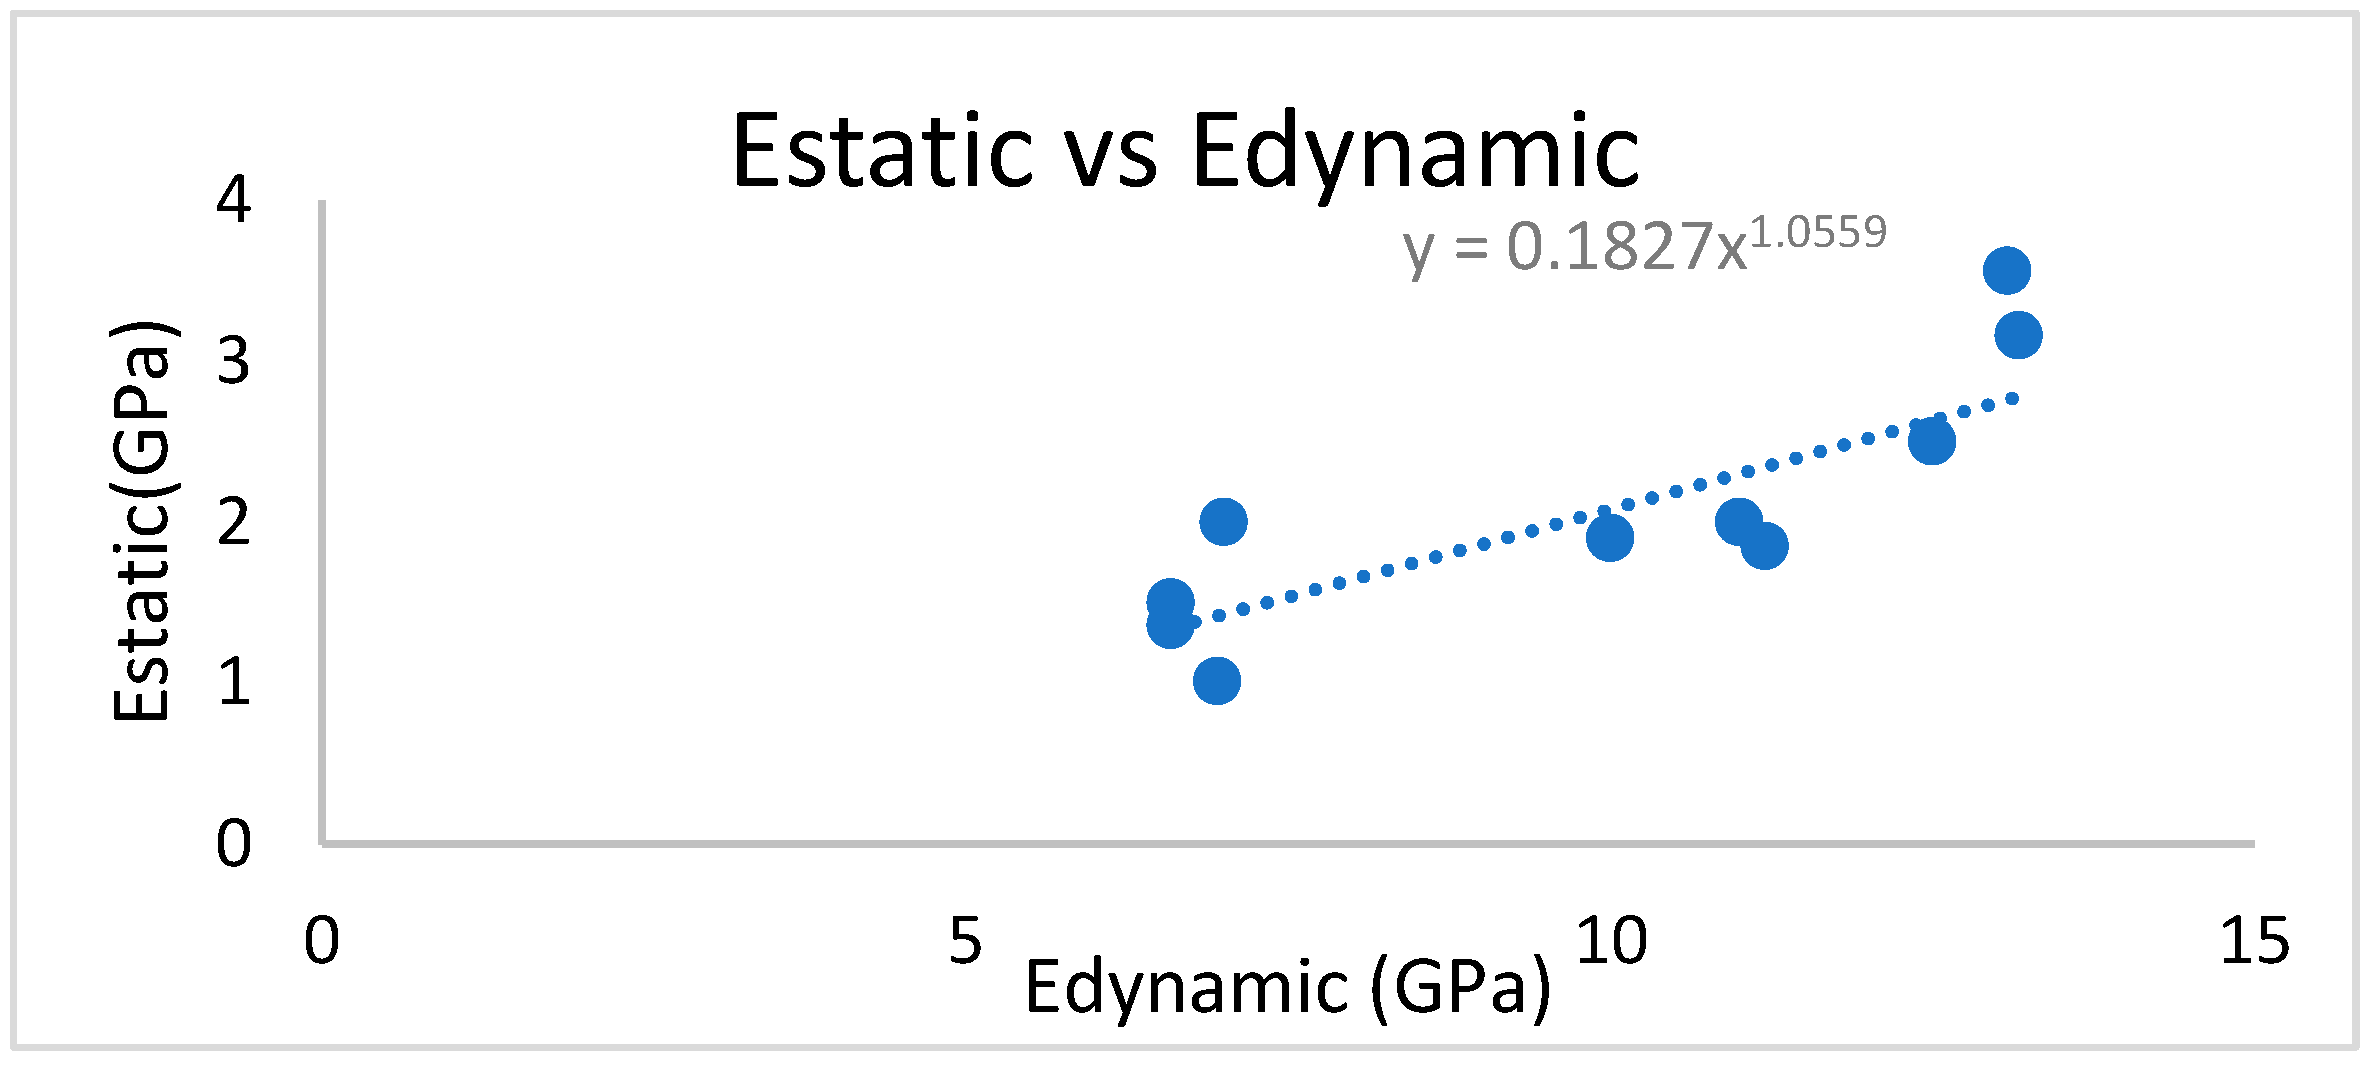
Nevertheless, these dynamic characteristics notably differ from the equivalent static values required for subsequent geomechanical modeling and stress analysis. Specifically, dynamic Young’s moduli often exhibit magnitudes two to three times greater than their equivalent static counterparts [46,47]. As rock mechanical test results are accessible for Well C, this study involved the conversion of Young’s moduli ( E ) from dynamic to static utilizing correlations extracted from the test results (Figure 4). Furthermore, for Poisson’s ratios ( ν ), values obtained from logs were calibrated using results from triaxial compression tests (Equations (5) and (6)).
ν S t a t i c = 0.94 ν D y n a m i c
E S t a t i c = 0.1827 E D y n a m i c 1.056
Unconfined compressive strength ( U C S ) is one of the most commonly used rock strength parameters and is typically determined through the laboratory testing of core samples retrieved from the subsurface. However, well logs can provide valuable information that may be used indirectly to estimate UCS or infer the mechanical properties of the rock formations [48,49]. In this study, UCS was calculated based on proprietary empirical correlations for shale and carbonates and calibrated using the results of the triaxial compression test (Equation (7)). The tensile strength (TSTR) of a formation refers to the maximum stress that the rock or soil can withstand before it fractures or fails under tensile loading [50]. In the current study, the calculated rock TSTR was calibrated using the TSTR (Brazilian) test’s results [51].
U C S = 0.05 V p 4.47
where UCS is expressed in MPa, and Vp is expressed in km/s
The friction angle ( ϕ ) was also derived by applying Equation (9).
ϕ = 0.085 V p 3.8
where Vp is in km/s, and ϕ is the friction angle.
The UCS values (C0) can then be combined with ϕ to calculate cohesion (S0) by applying Equation (9).
S o = C O 1 S I N 2 C O S
The vertical stress σ v was calculated by integrating the bulk density ρ b of the formation from the surface to the total depth (TD) using the following equation [45].
σ v = a z ρ b z . g . d z
For the intervals of missing or poor log quality, rock density is extrapolated using Equation (11) [45]:
ρ b = ρ s u r + A 0 ( T V D W D A G ) a
ρ b : formation density, ρ s u r : formation density at surface or seabed, TVD: true vertical depth, m, WD: water depth, m, AG: air gap, m, A 0 , a : extrapolation parameters.
Pore pressure plays a vital role in a mechanical earth model, especially in the analysis of stresses and the stability of wellbores [52,53].
In this study, both Eaton [54] and Bowers’ [55] methods were used to obtain the pore-pressure profile in the clay-rich intervals of the overburden. Since the Eaton method shows the better consistency with the used mud weight and drilling events, this method was chosen for calculating the pore-pressure profile [54]. MDT data were applied to obtain pressure gradient data for the reservoir section.
P p g = S g ( S g P n g ) ( Δ t n Δ t o ) x
where P p g is the pore-pressure gradient, S g is the overburden-stress gradient, P n g is the hydrostatic pore-pressure gradient, Δ t n is the compressional sonic transit time in shales, and x is the exponent component.
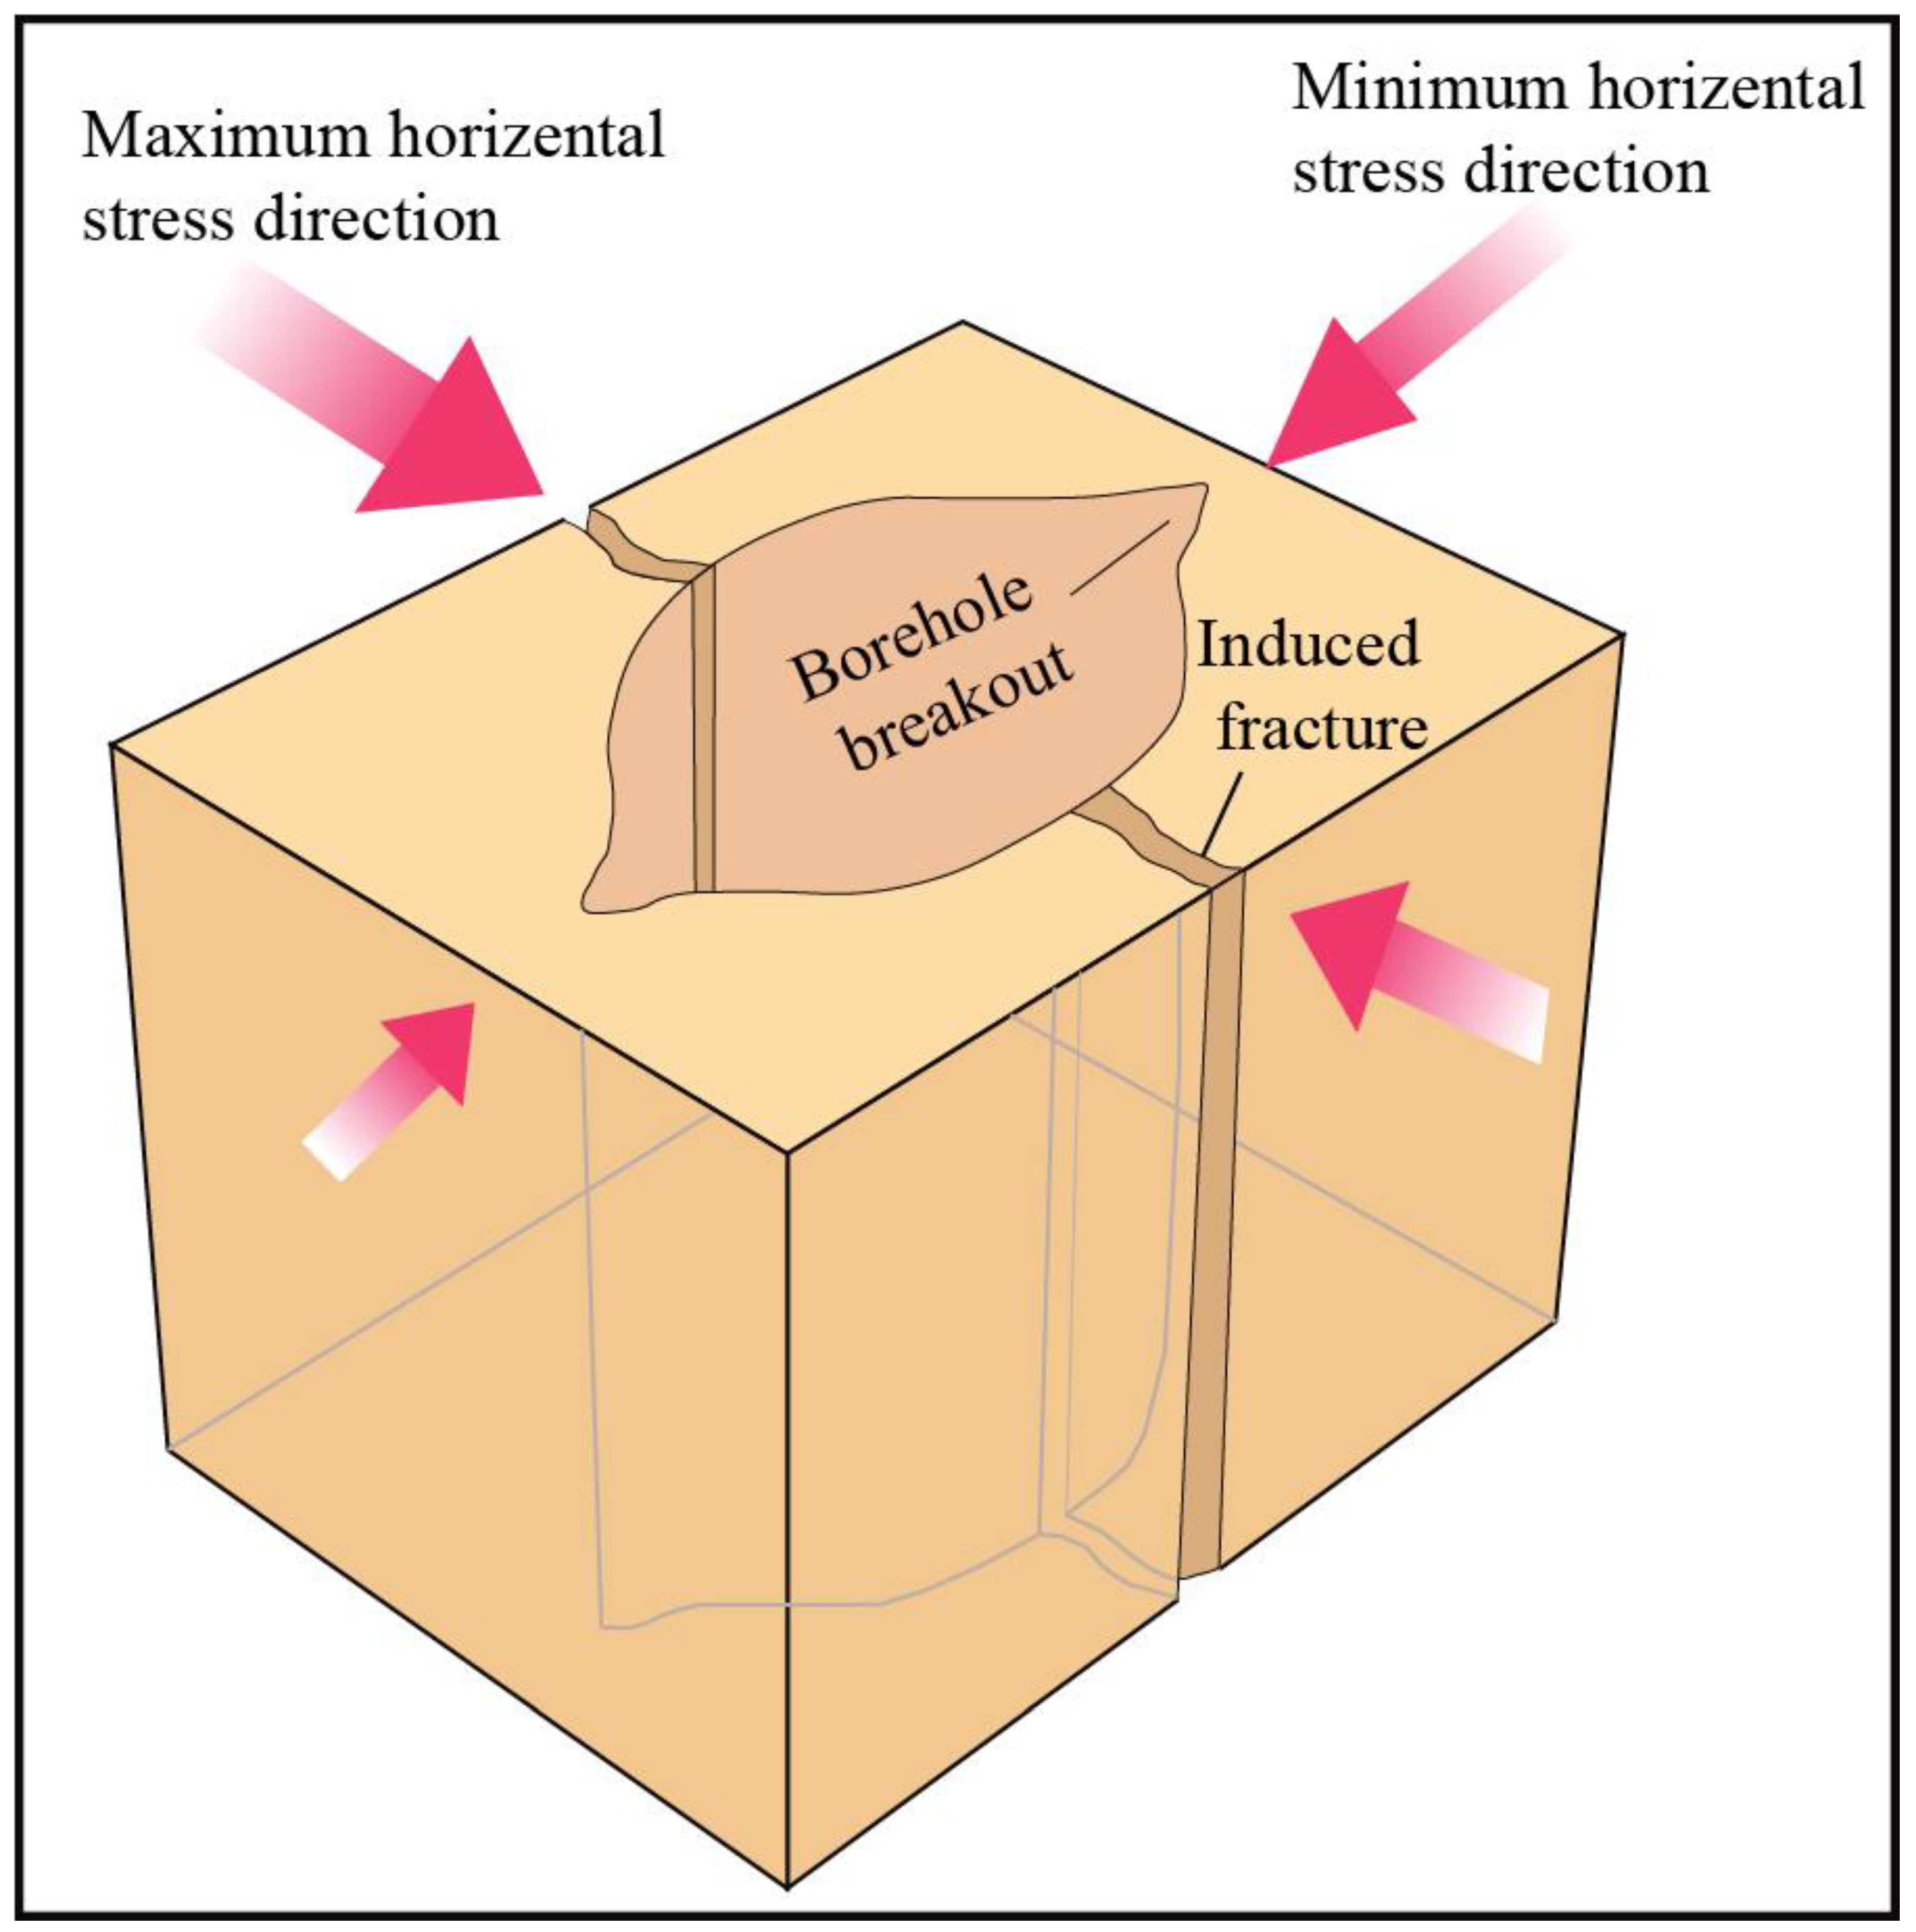
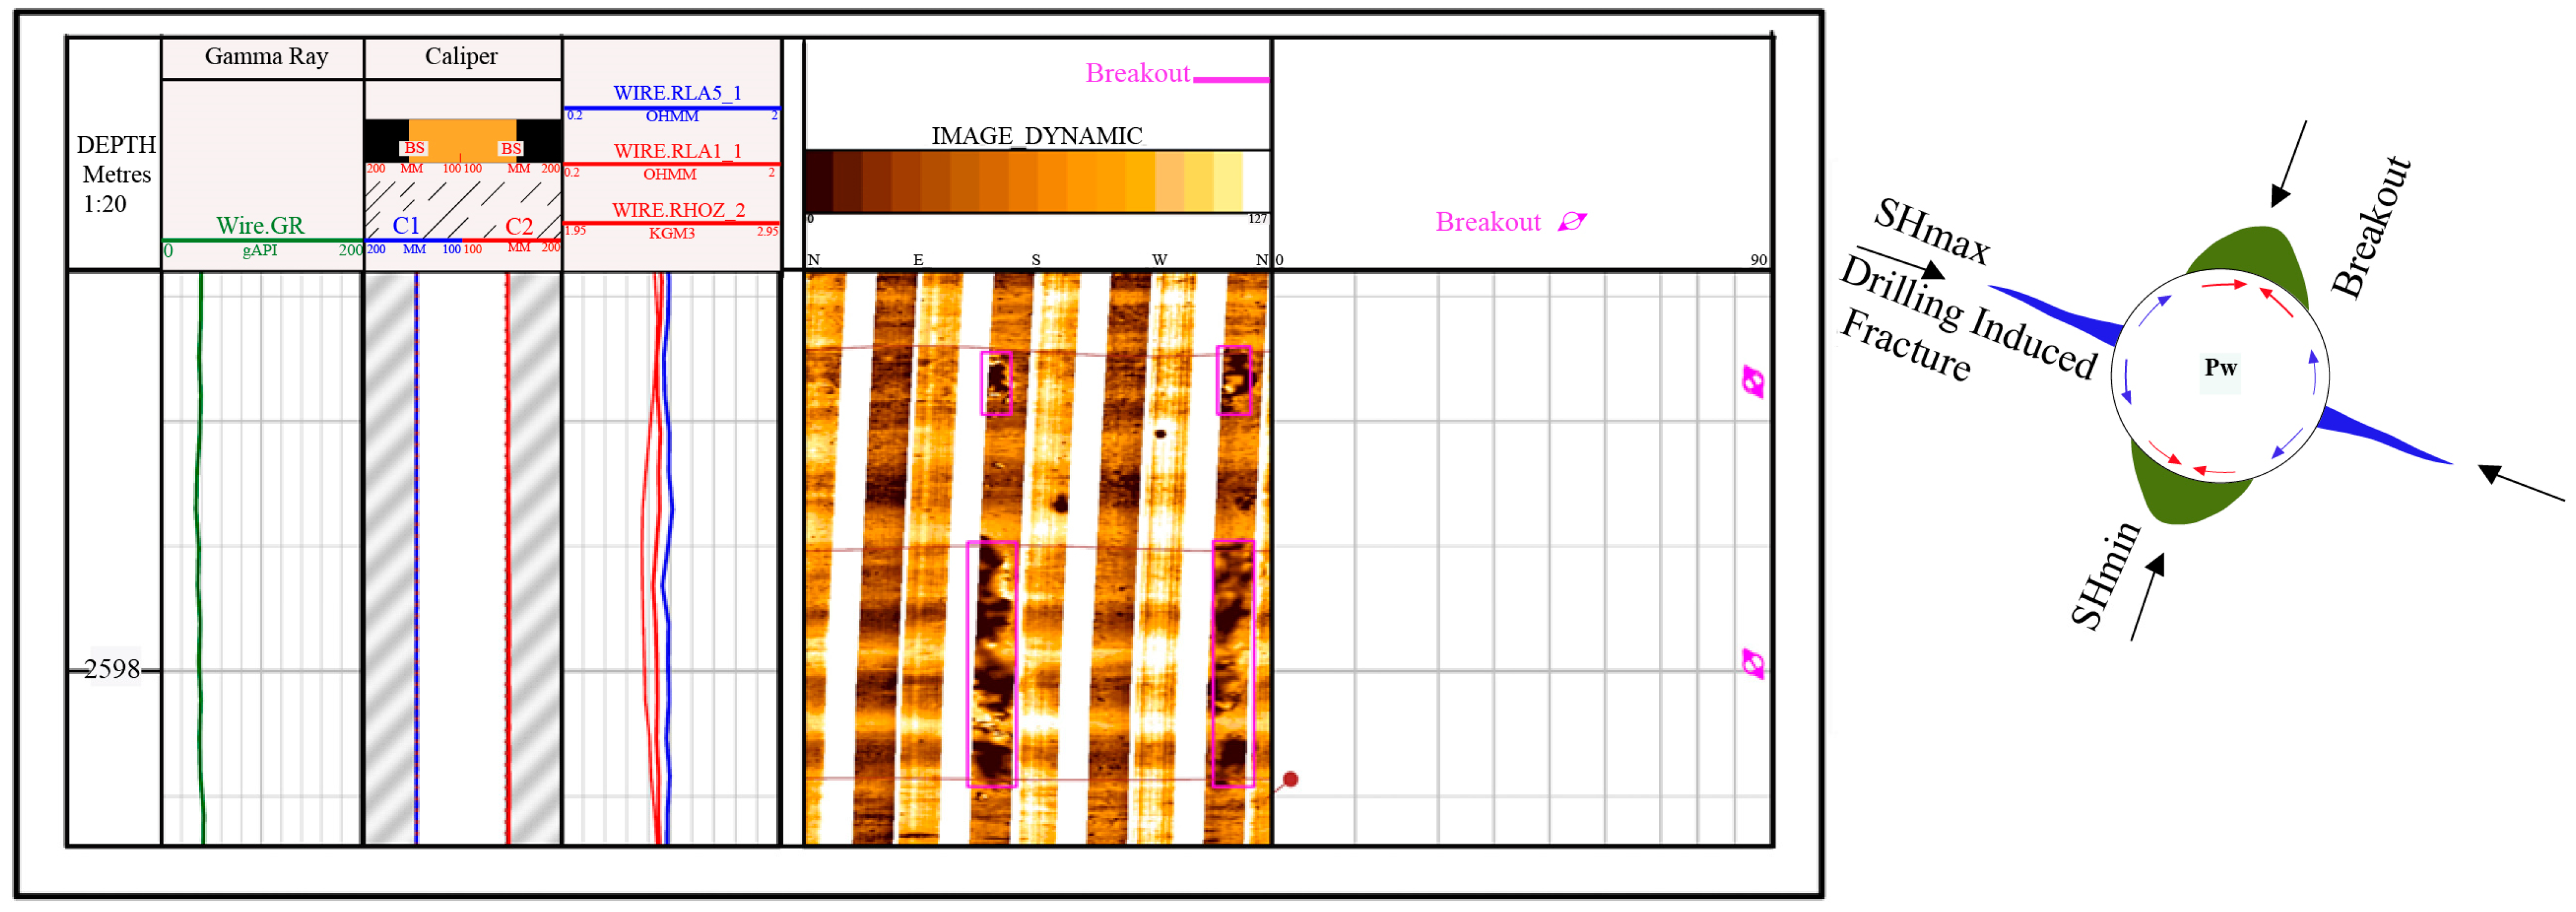
When assessing the horizontal stress, the initial step involves identifying its orientation. Multiple techniques exist for determining stress direction, such as wellbore breakout orientation, hydraulic fracture orientation, shear sonic anisotropy, and three-component vertical seismic profiling (VSP) [56,57]. In a vertical well, the direction of the minimum principal stress aligns with the direction of the minimum horizontal stress (Figure 5) [58]. Hence, the orientation of a wellbore breakout in a vertical wellbore signifies the direction of the minimum horizontal stress [58]. In the current study, FMI (for reservoir section) data were processed in order to obtain the stress direction.
Different approaches have been proposed to predict minimum horizontal in situ stress values. In an actively tectonic basin, the movement of tectonic plates generates tectonic stresses and strains [59]. When these strains affect rock formations, they introduce an additional stress component in the elastic rock. The poroelastic horizontal-strain model considers these tectonic strains, thus accommodating anisotropic horizontal stresses [60,61,62]. Therefore, the poroelastic approach was also applied to calculate the SH and Sh magnitudes using Equations (13) and (14).
S h = v 1 v S v v 1 v α P p + α P p + E 1 v 2 ε x + v E 1 v 2 ε y
S H = v 1 v S v v 1 v α P p + α P p + E 1 v 2 ε x + E 1 v 2 ε y
where E is Young’s modulus, S v is vertical in situ stress, v is Poisson’s ratio, P p is pore pressure, α is the Biot’s coefficient, and ε x and ε y are tectonic strains.
Given that the spatial limitation of the geomechanical model was greater than the simulated reservoir interval, the normal displacements used for sideburden modeling were defined with reference to five lateral grids. The vertical displacement at the base of the geomechanical model was also limited to five grids. A computed initialization was applied to achieve a mechanical balance between these applied boundary conditions and the initial distribution of stresses in the studied area [31].
The material modeling step allows for access to the material library to set up default or customized material parameters for use as constant properties when no user-controlled grid-based properties are available. The materials can be categorized as either linear or non-linear (such as plastic), incorporating linear-elastic properties as well as failure criteria derived from various methods (such as Mohr–Coulomb, Drucker–Prager, Tresca, etc.) [63,64]. The applied materials modeled in the studied field are listed below (Table 2):
There are various techniques available to couple reservoir dynamic data with geomechanical models. A partly coupled method can be established by coupling the functionality of standard reservoir and geomechanical simulators [65,66]. In such a method, stress and fluid flow equations are applied distinctly at each phase, and data are then exchanged between the reservoir and geomechanical simulators [65,67]. This approach tends to be flexible and fast to execute in terms of CPU time. It can also benefit by readily incorporating up-to-date developments in mathematical methods, as they materialize, into either reservoir or geomechanical simulations [65]. Several coupling steps are involved in the partly coupled approach. If the approach is only completed once for each step, the partial coupling is described as being “explicit” [68,69]. On the other hand, if the approach is frequently reiterated until convergence is achieved in relation to the stress distributions and fluid flows in relation to the same pore volume, then the partial coupling is described as “iterative” [70].
This study focuses on the impacts of production on a reservoir and overburn subsidence. When the pore-pressure profile remains relatively low, the influence of deformation on reservoir properties, such as porosity, will most likely be trivial, and a coupled geomechanical model is typically not essential in such situations [67,69]. However, since production scenarios are gradually in several stages, it is beneficial to apply a one-way coupling approach to evaluate the compaction of the studied field while in production. In this study, the influence of thermal energy on the reservoir has been ignored.
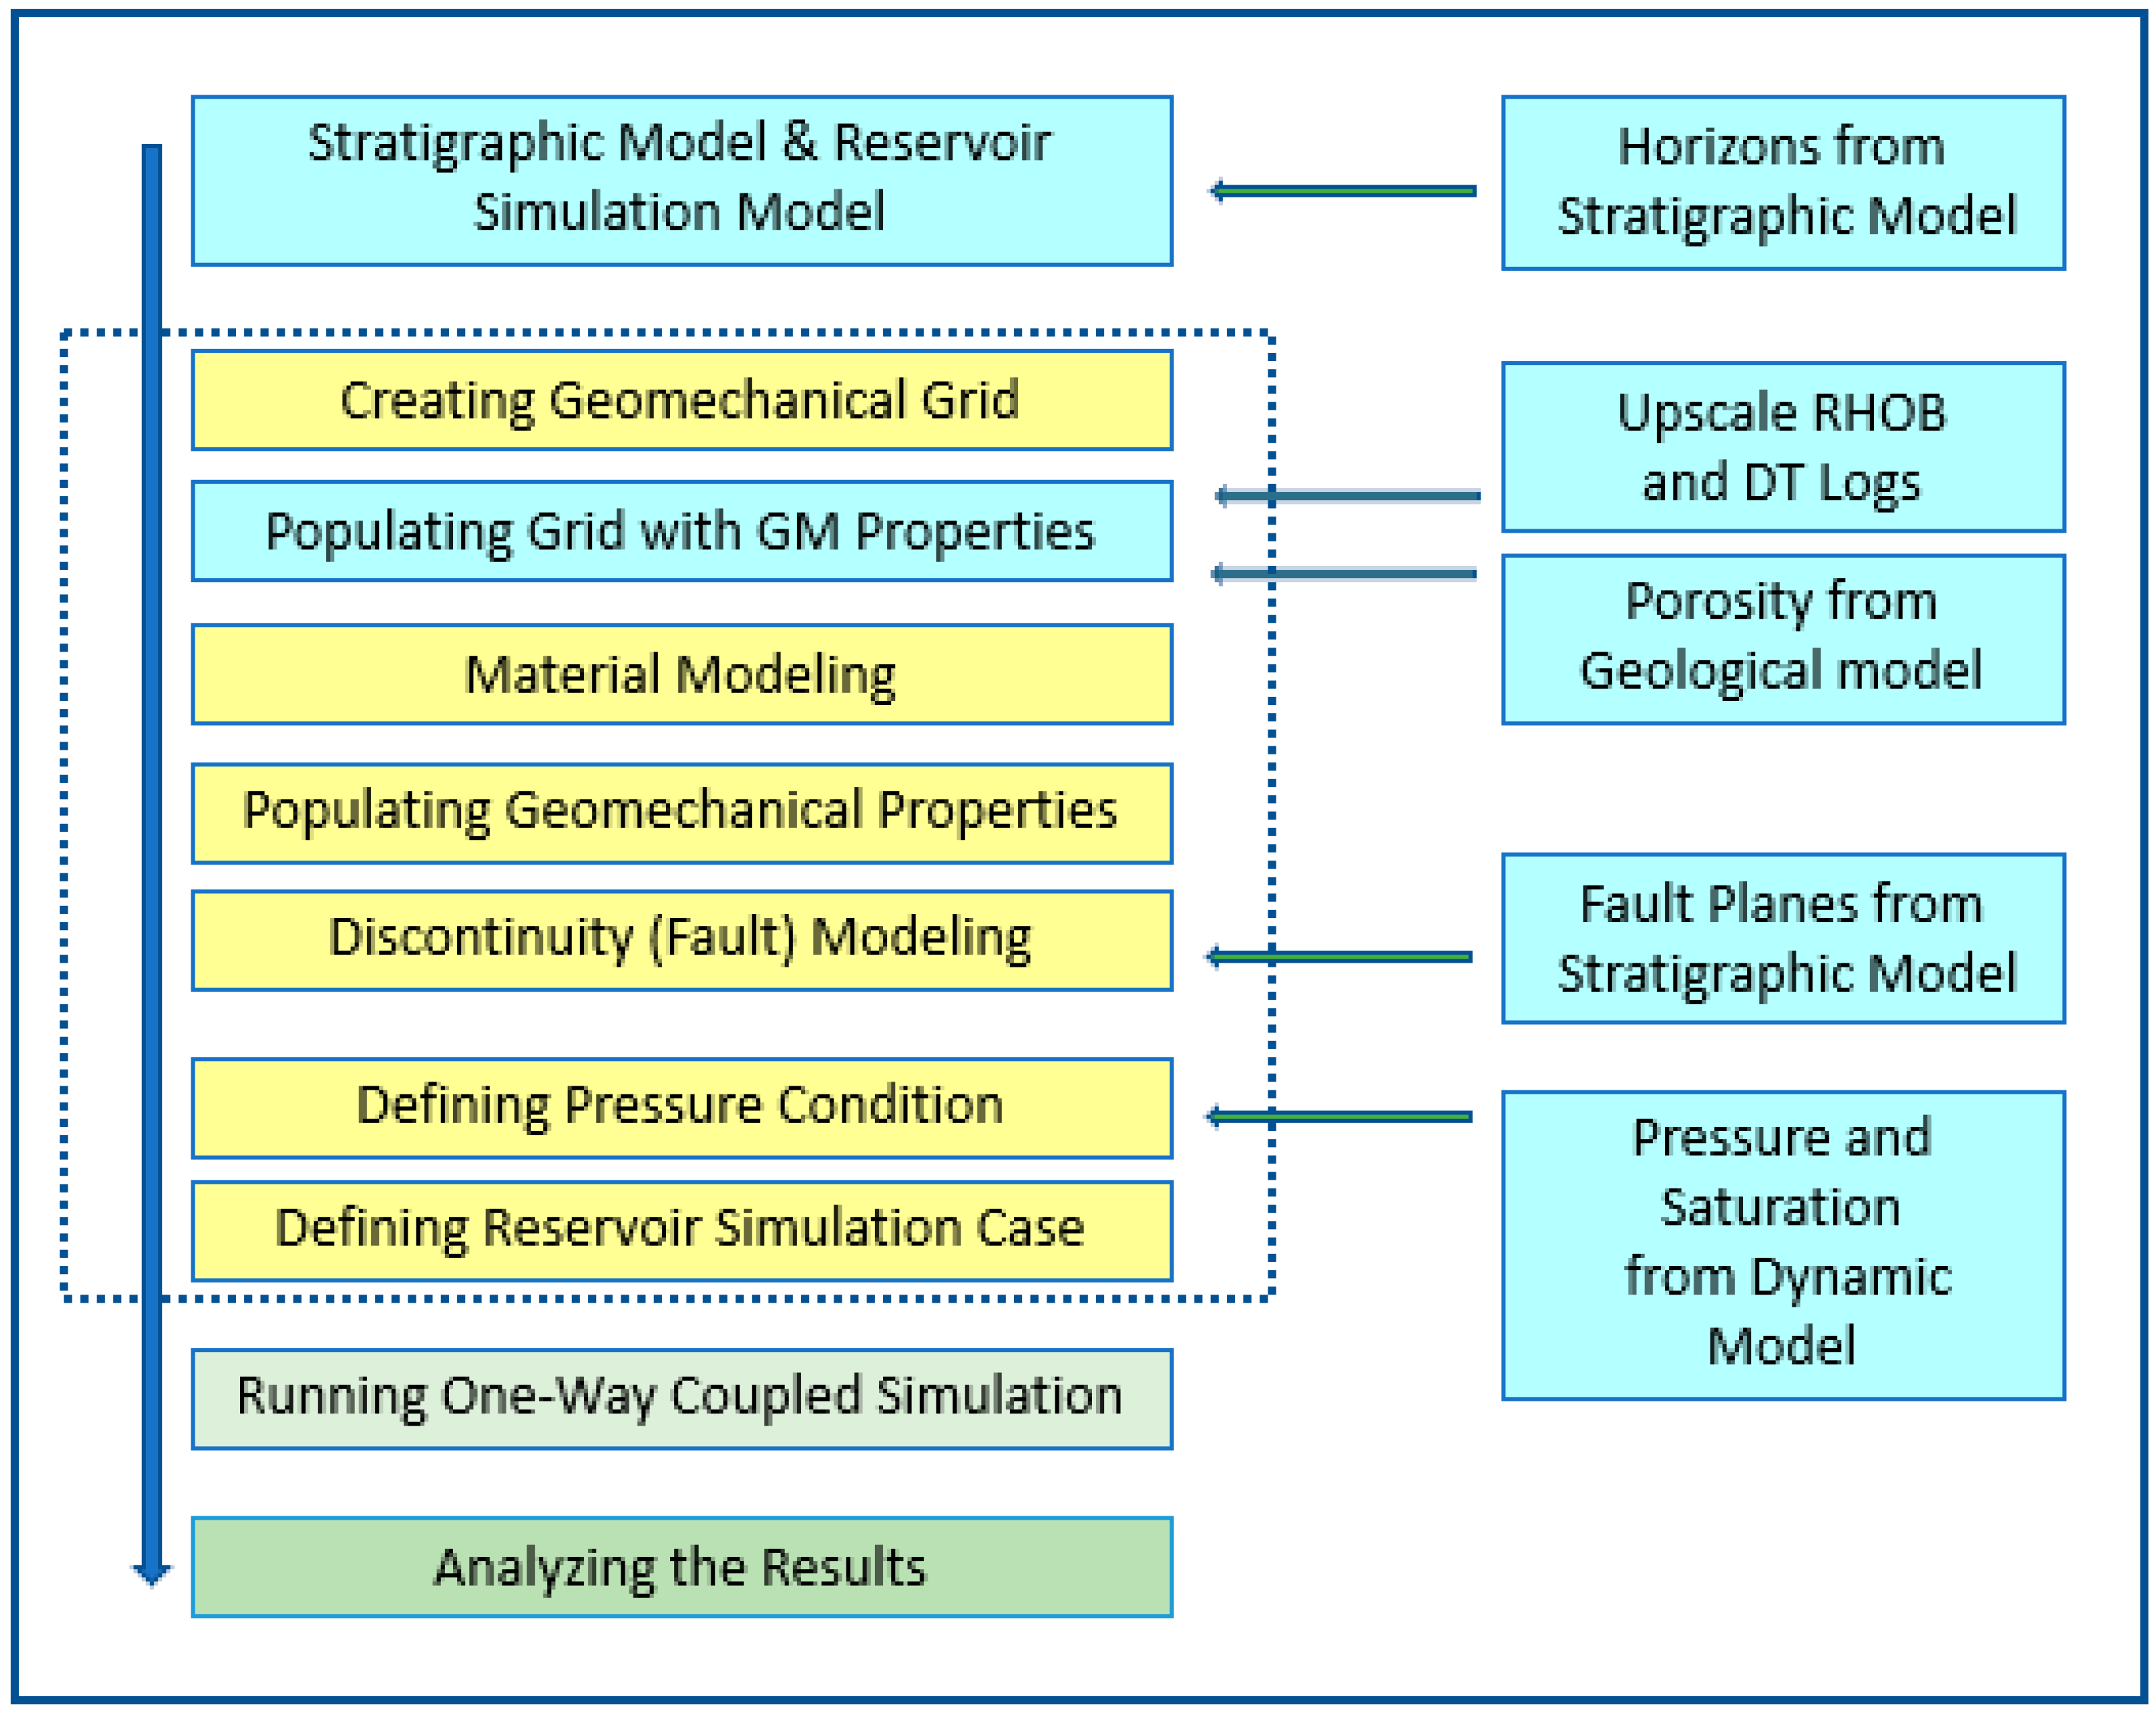
The finite-element-based Visage software (version 2023.2) was used to build a 3D MEM for the studied reservoir stress field. The evolving reservoir properties are progressively transferred and updated to establish the strain resulting from the changing stress magnitudes at each element. The modeling procedures required to take into account tectonic stresses require the following steps: (1) The identification of the tectonic events and features, such as faults, and the structure and stratification of the reservoir and cap rock formation throughout the studied area. (2) The assessment of the lateral distributions of the elastic moduli of the formations throughout the studied area. (3) The identification of the initial stress regimes and appropriate boundary-condition assumptions. The geomechanical modeling workflow applied in this study is highlighted (within the dashed blue polygon) in Figure 6.
Reservoir compaction due to pressure depletion can produce adverse effects, including reduced porosity and permeability, pore volume collapse, solids production, and wellbore deformation/failure [29,71]. Some of these effects can be verified from sources other than finite-element modeling, such as time-lapse seismic modeling, log measurements from wellbores drilled after production, and pressure transient analysis [1,4].
The main driver of formation compaction is the effective stress (σ′), which is based on the relationship between total stress (σT) and formation pore pressure (Po), expressed by
σ′ = σTαPoδ
α is Biot’s coefficient; it was found to be close to one for soft sediment.
δ is the Kronecker delta.
σ′ is the effective stress magnitude and mainly controls the compaction processes, where σHmin′, which is the minimum horizontal stress, mainly impacts permeability changes.

4. Results and Discussion

4.1. 1D Geomechanical Modeling

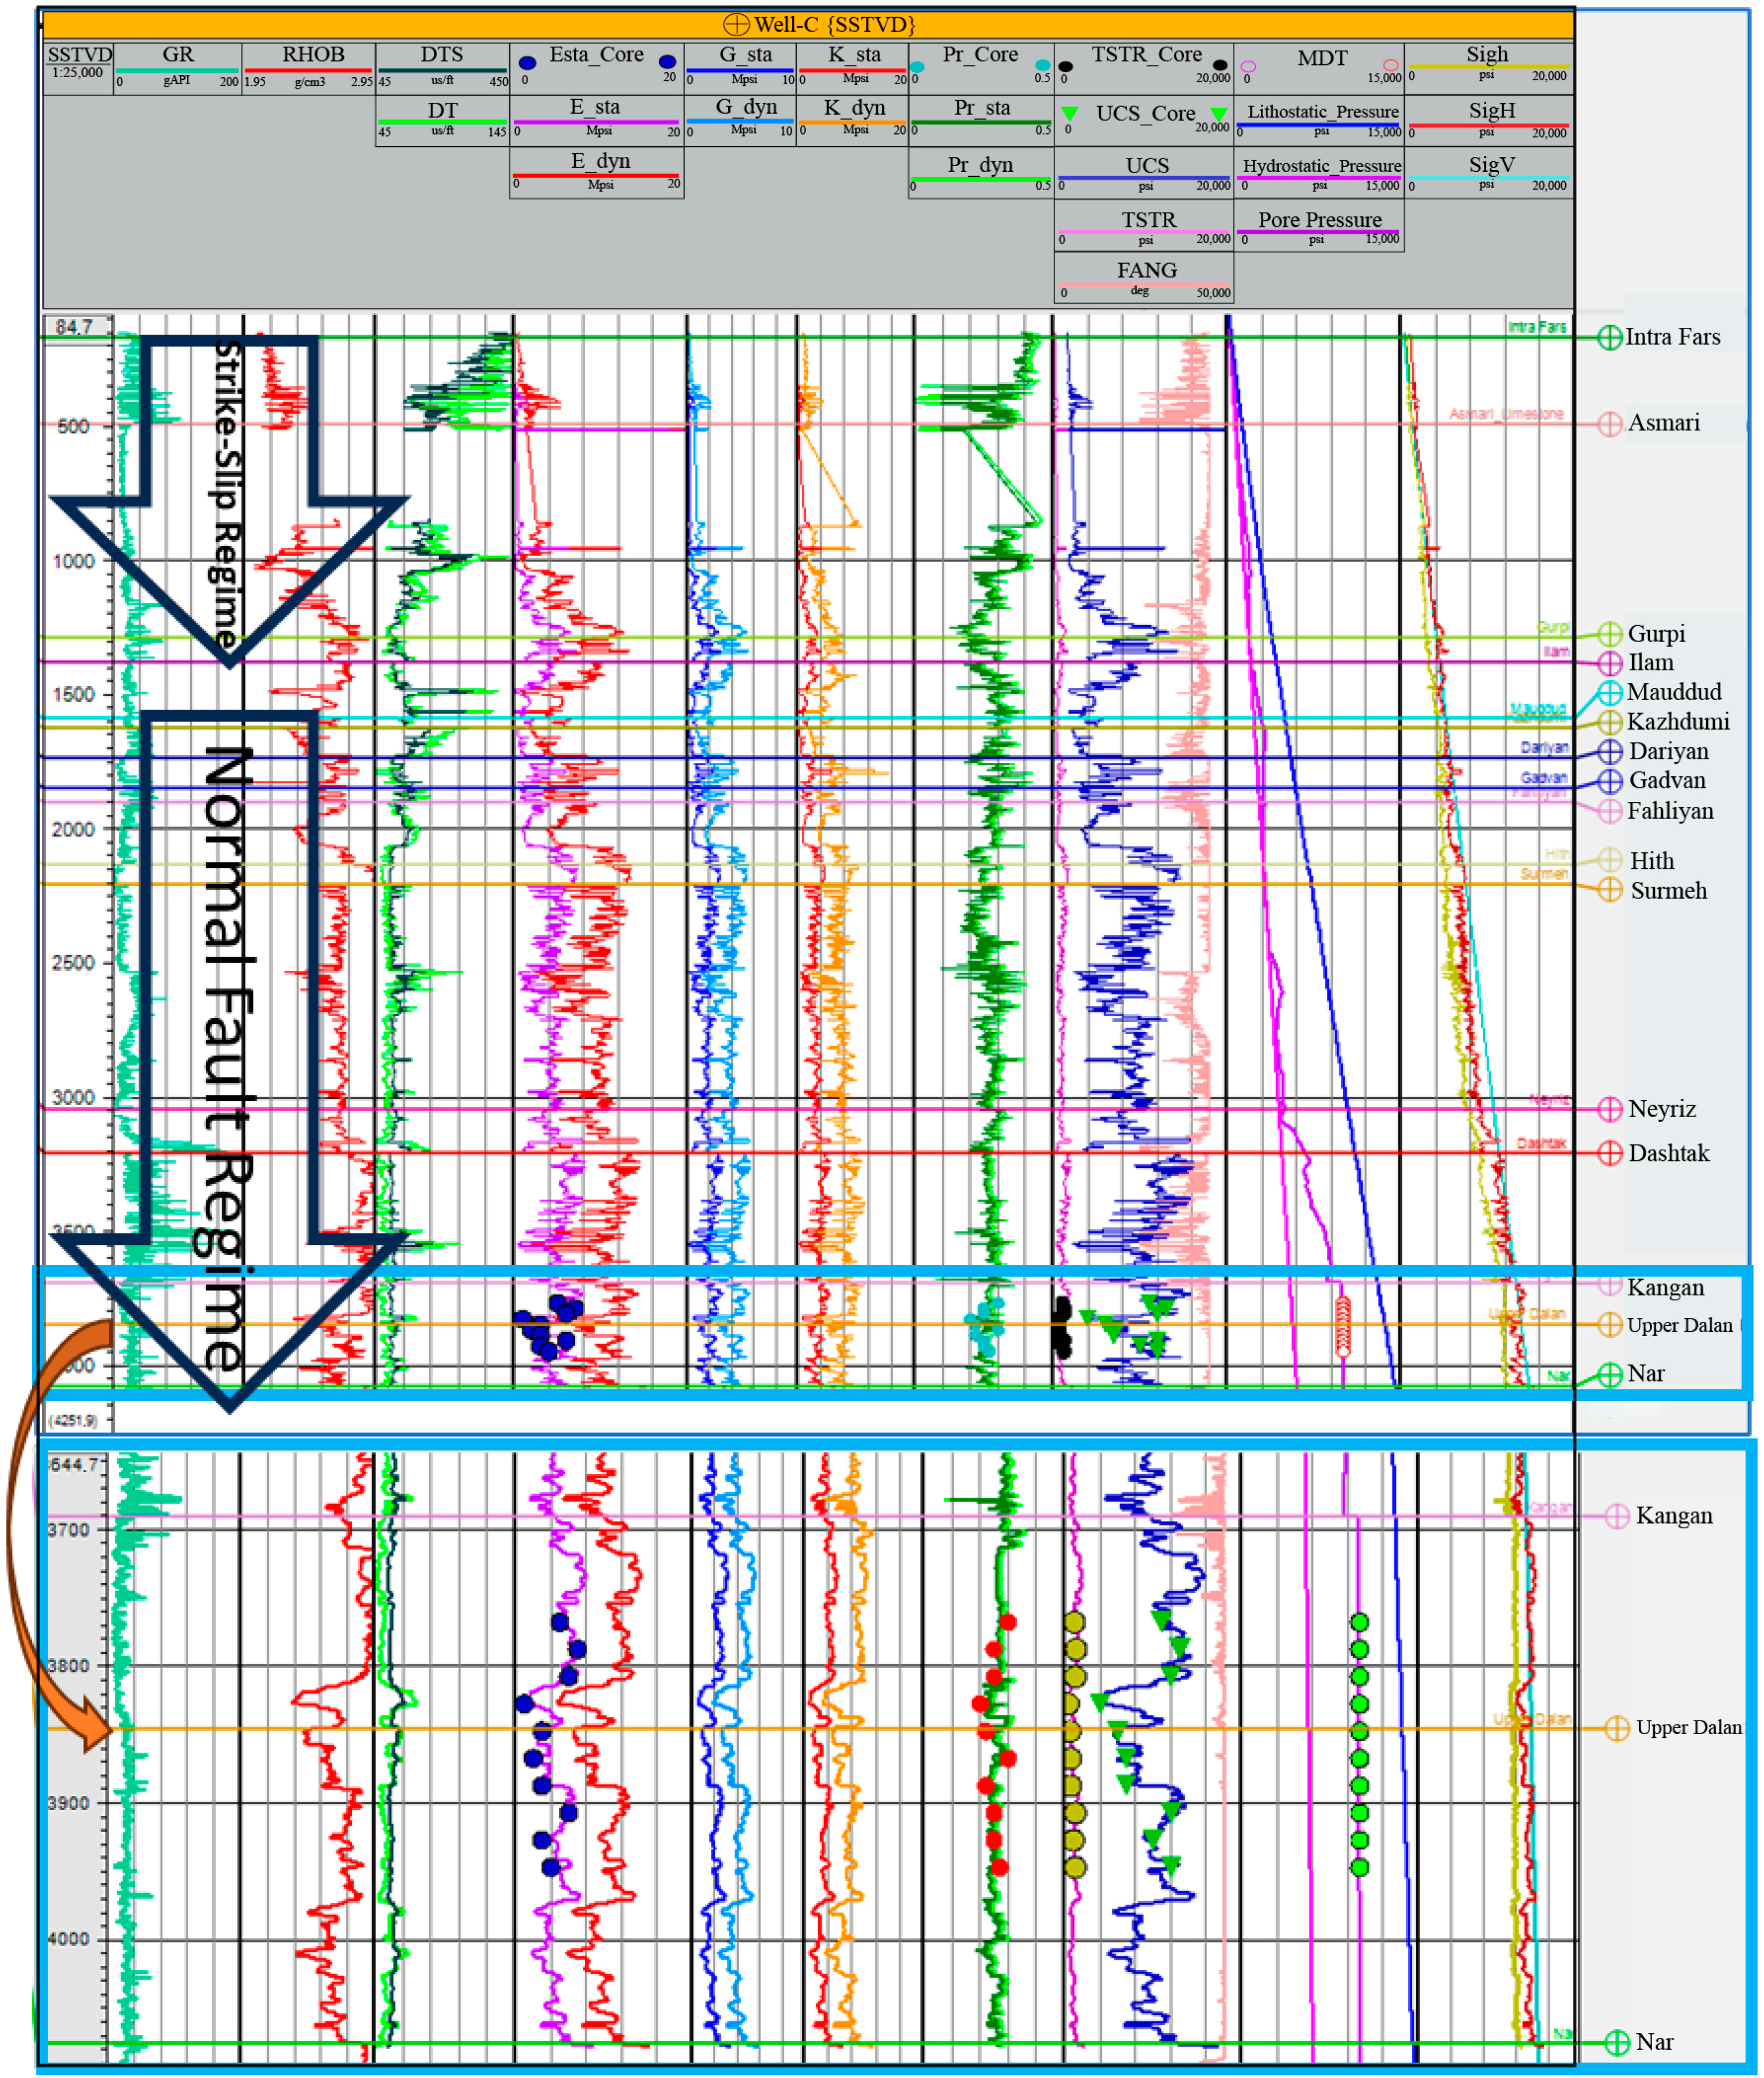
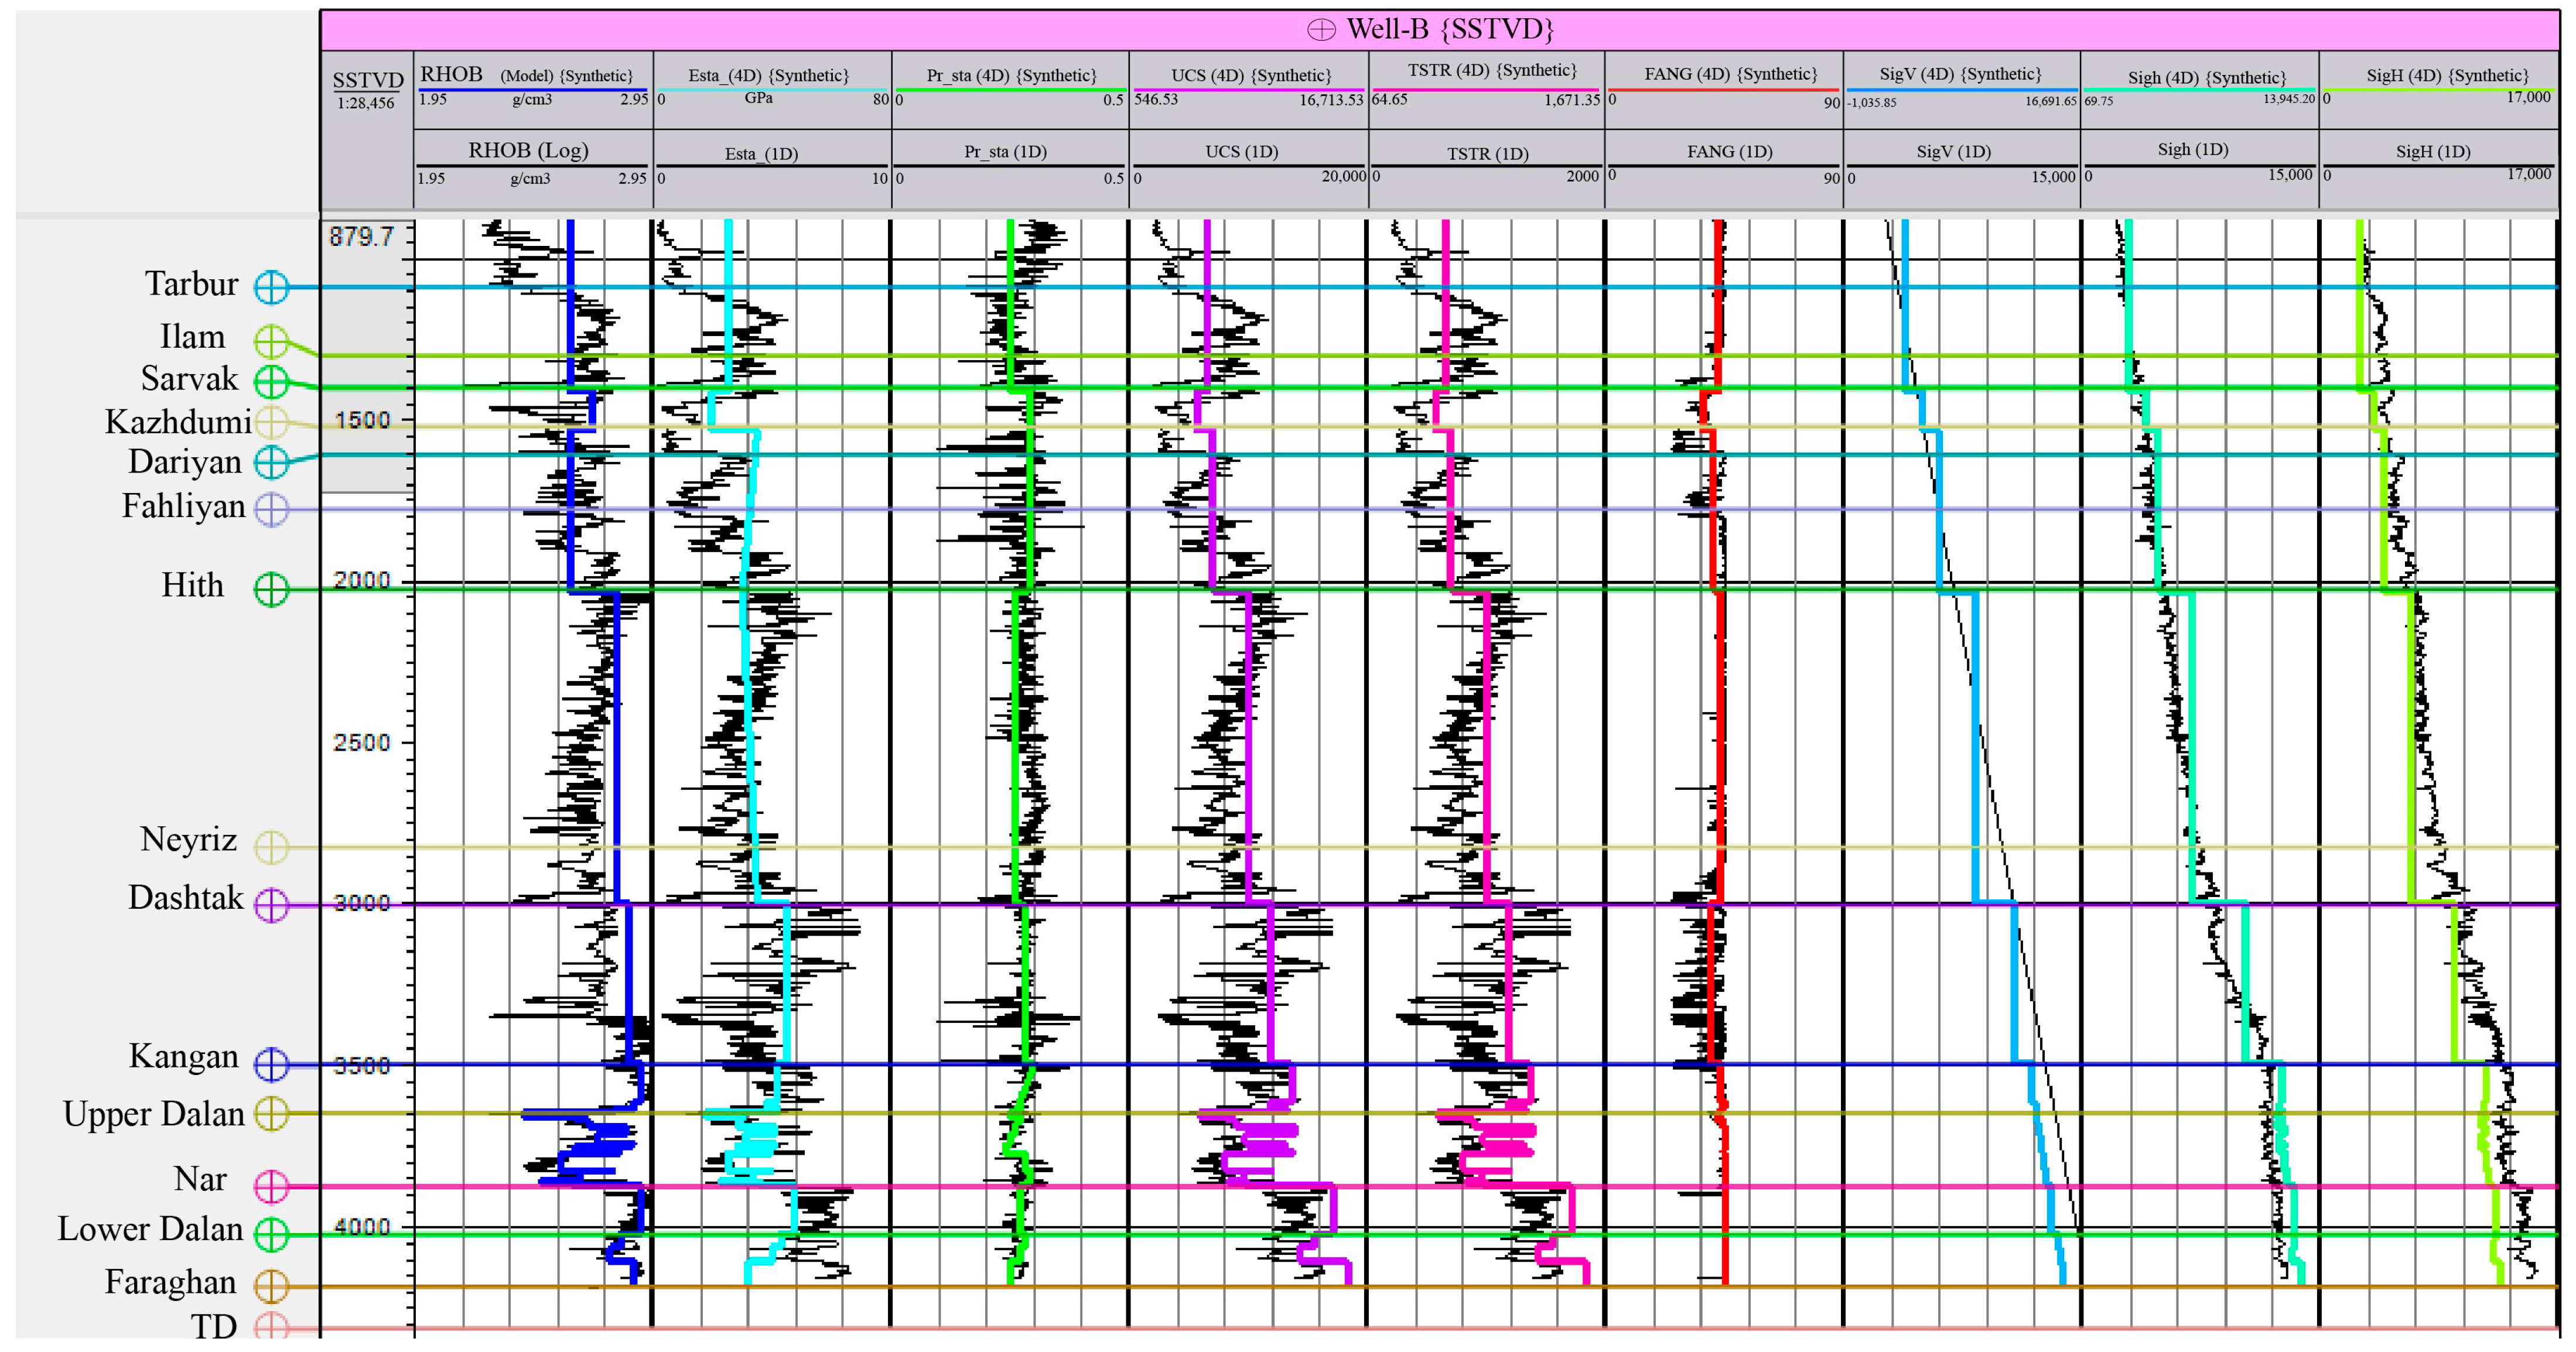
One-dimensional geomechanical modeling was conducted for three wells within the investigated field, as illustrated in Figure 7. The calibration process for the 1D model was performed sequentially for pore pressure, mechanical properties, and local stress magnitudes. Initially, the calculated pore pressures were adjusted to match the measured data, specifically MDT results. Then, the static mechanical properties modeled were calibrated against laboratory measurements. Horizontal-stress calibration involved adjusting the strain increments (x and y) in Equations (13) and (14) until a satisfactory match between calculated and measured stresses was attained. The resulting strain increments for x and y determined through this process are 0.001 and 0.003, respectively. Figure 7 displays some selected 1D MEM outcomes, including calibration data for Well C. It illustrates the density (RHOB) as well as the compressional and shear slowness (DTC and DTS) log data utilized for calculating the dynamic elastic properties following Equations (1)–(4), which are then transformed into static values. The averaged values for Well C include a static Young’s modulus of approximately 35 GPa and a Poisson’s ratio of 0.24 within the reservoir section. The mechanical parameters obtained from the logs at the calibration points are consistent with the rock mechanical properties determined in the laboratory from core samples.
Nevertheless, these dynamic characteristics differ significantly from the corresponding static values needed for geomechanical modeling and stress analysis. Specifically, dynamic Young’s moduli are often found to be two to three times higher than their static equivalents. Dynamic moduli are obtained from high-frequency wave propagation (such as seismic waves), where the material is subjected to rapid, small deformations. At these high strain rates, rocks tend to behave more elastic, leading to higher stiffness measurements and, consequently, higher Young’s moduli. However, static moduli are measured under slow or quasi-static loading conditions, typically in laboratory tests where the rock is subjected to gradual deformation. Under these conditions, the material may exhibit more plastic deformation, microcracking, or other inelastic behaviors, resulting in lower stiffness and, thus, lower Young’s moduli. This difference in behavior under varying strain rates explains why dynamic Young’s moduli are typically higher than their static counterparts. Since rock mechanical test results are available for Well C, this study included the conversion of dynamic to static Young’s moduli (E) using correlations derived from the test results (Equations (5) and (6)) (Figure 4). Additionally, Poisson’s ratios (ν) obtained from logs were calibrated using triaxial compression test results (Figure 7, Track 8).
The pore pressure and stress profiles of Well C from the corresponding 1D MEM are depicted in Figure 7. While pore pressures conform to the hydrostatic pressure gradient, some overpressure is evident at greater depths, particularly within the Dashtak Formation and reservoir intervals (Figure 7, Track 9).
At the reservoir level, specifically in Well C, pore pressures are approximately 3000 Psi higher than the hydrostatic pressure. This aligns with the calibration data obtained from MDT. The stress magnitude profiles reveal that the vertical stress is nearly equivalent to the largest principal stress, suggesting a normal faulting regime within the reservoir section (refer to Figure 7, Track 10, lower part, for a more detailed resolution). The horizontal-stress ratio (SH/Sh) exhibits values of 1.2. Similar observations are noted in most other 1D MEMs across the surveyed region. However, the Ilam Formation stands out, displaying a strike/slip regime instead (refer to Figure 7, Track 10).

4.2. Mechanical Earth Model (MEM)

The MEM represents the formations’ mechanical properties throughout the study area. When a well-calibrated MEM is developed, it is possible to deploy it to identify the most applicable approaches for stress alteration and subsidence prediction during field development. To achieve this, geomechanical properties are distributed in a 3D grid to facilitate the 3D geomechanical modeling process. The model uses elastic stress–strain equations to calculate the stresses at any point within a volume of interest. For the output accuracy, these rock properties require calibrating to available well data. In this study, seismic-derived elastic properties are used as a trending attribute for 3D volumetric property in the reservoir section, and then well log-derived properties are upscaled and distributed with conditioning to the seismic properties to preserve the value ranges in the wells. To achieve this, we developed an MEM by calculating key elastic properties, including shear wave velocity (Vs), compressional wave velocity (Vp), density, Young’s modulus, and Poisson’s ratio, using seismic inversion results and well logs. These properties are essential for evaluating the mechanical stability of the reservoir and surrounding rock formations. The average values of these parameters are summarized in Table 3, providing a foundation for assessing rock strength, deformation, and the potential for fault reactivation or subsidence during extraction activities.

4.2.1. Geometry of the Model and 3D Finite-Element Mesh

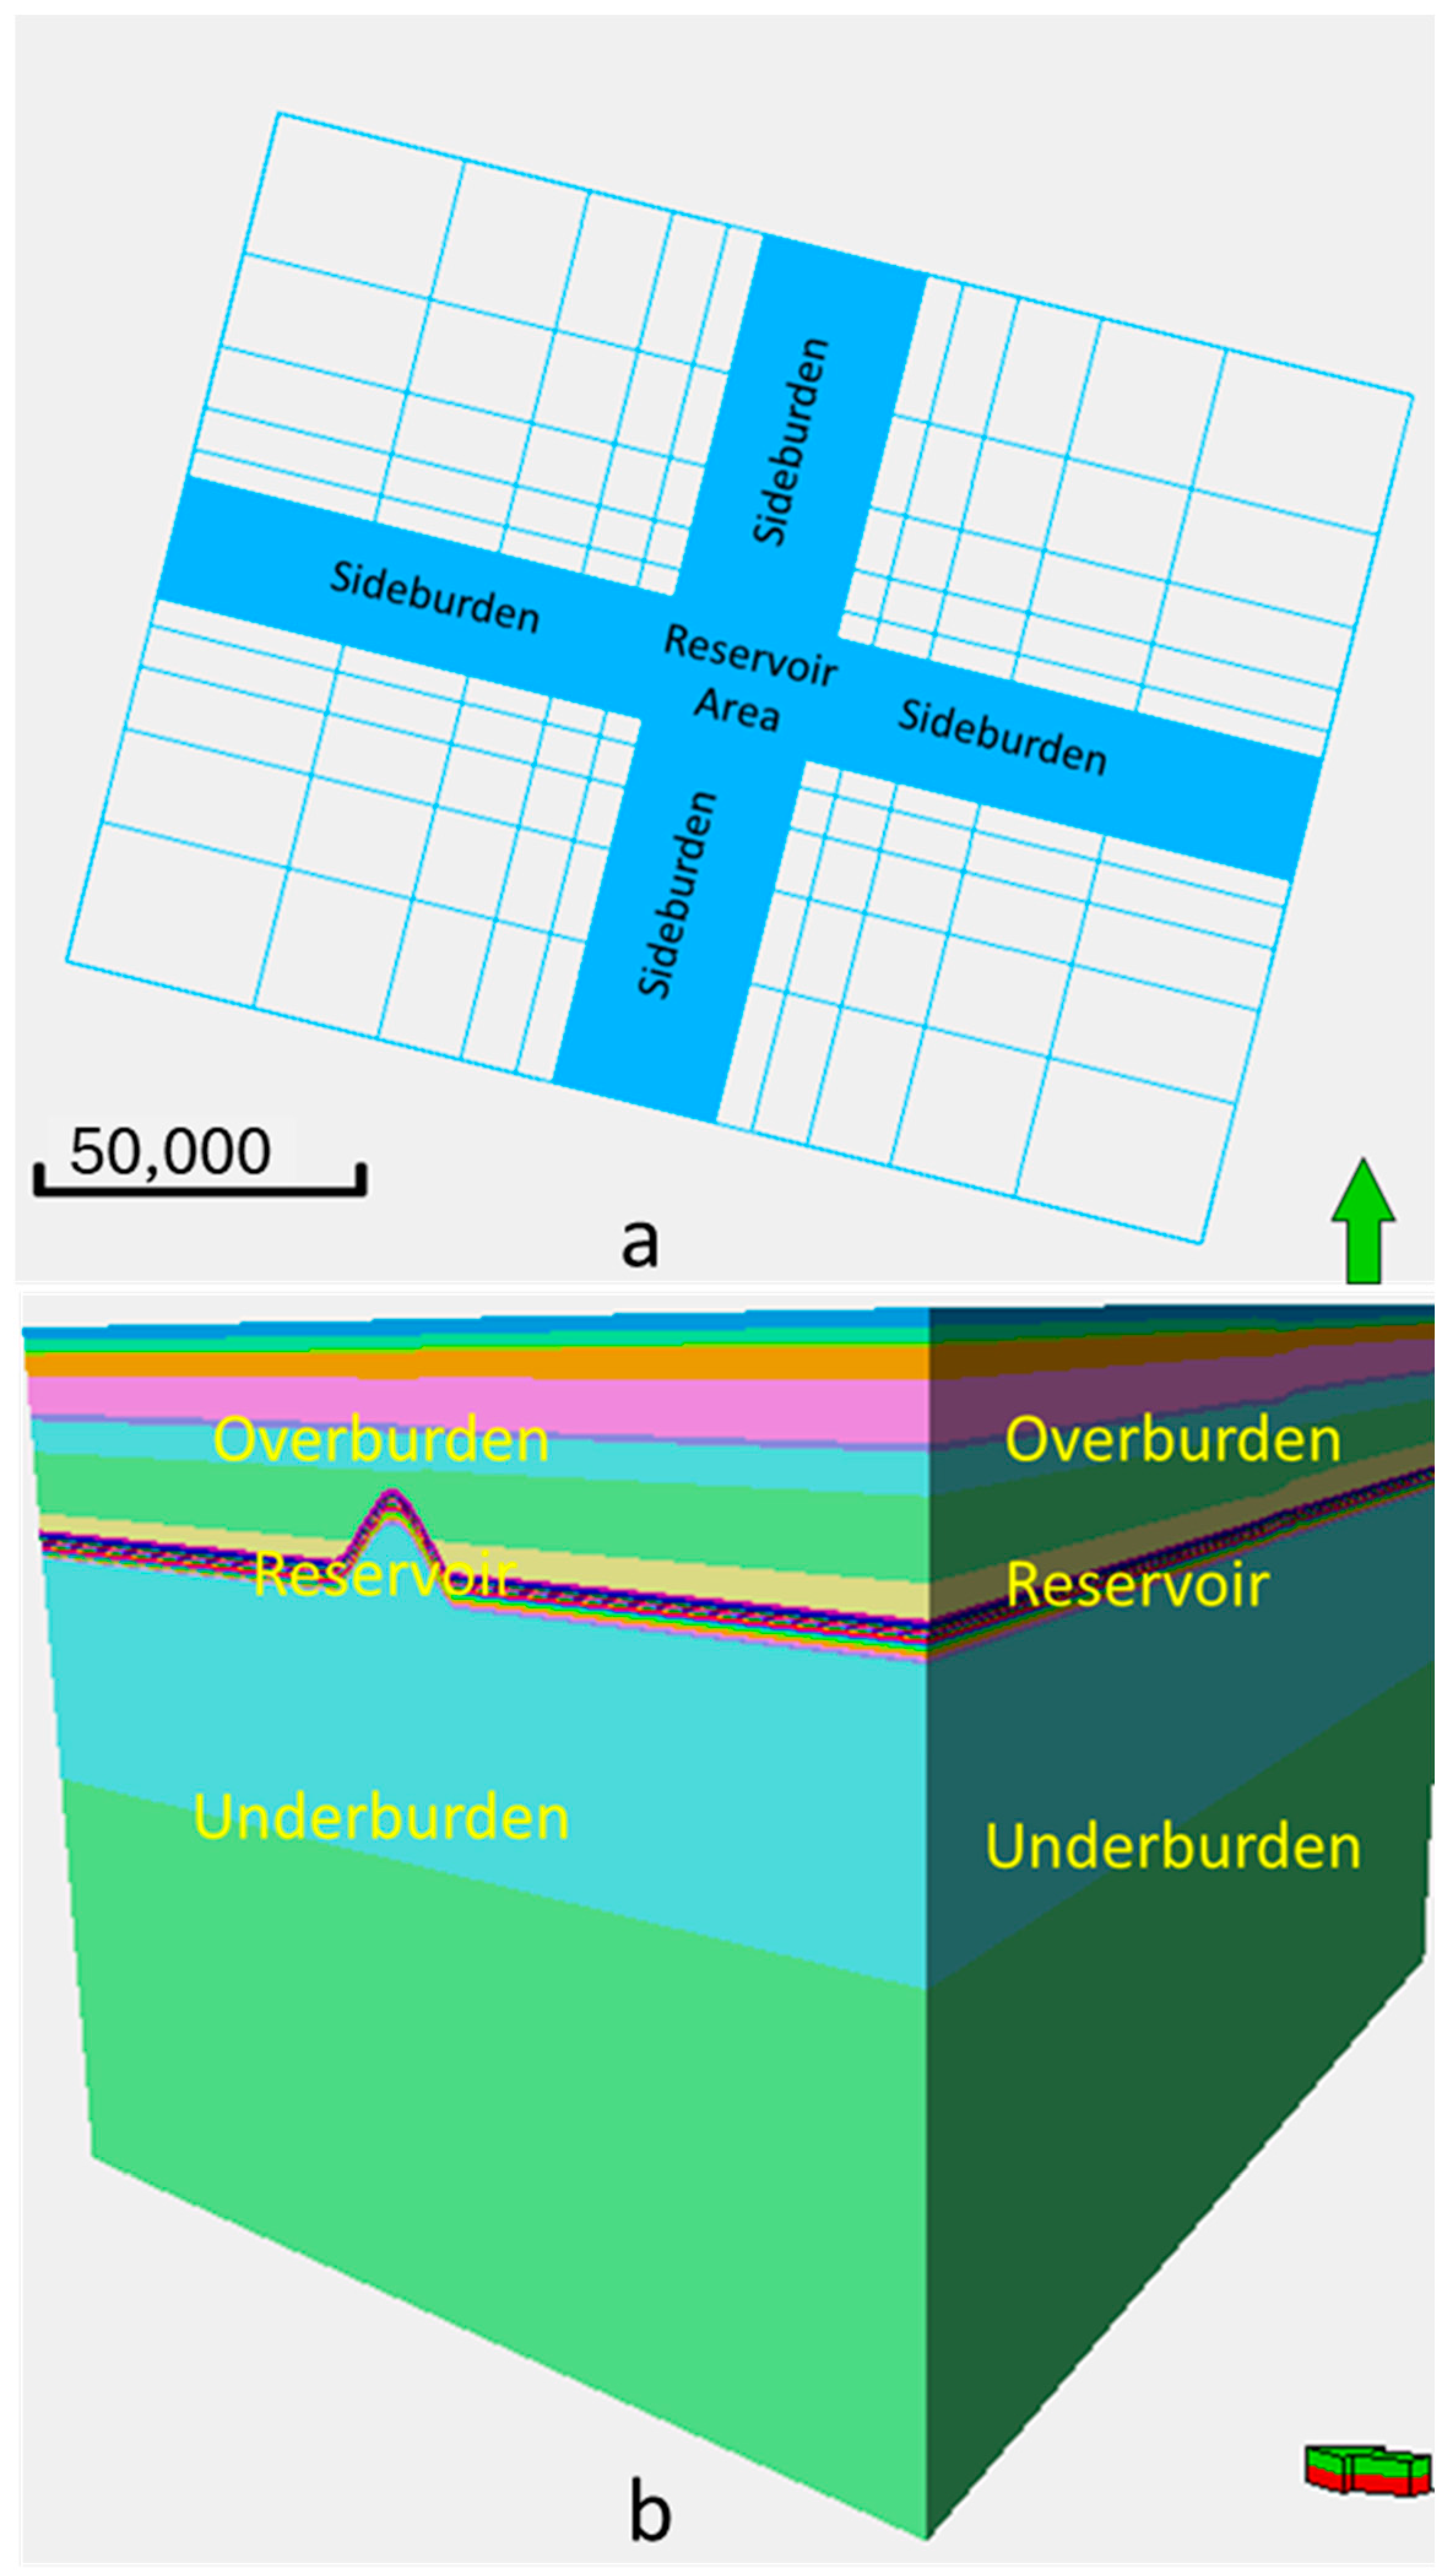
The most time-consuming stage in constructing a geomechanical finite-element method (FEM)-based model is defining the reservoir boundary conditions [72]. Formation surfaces and fault polygons are usually generated based on seismic interpretation and are preferably accessible for constraining stratigraphic and structural models for the studied areas. An upscaled geological grid can be beneficially employed for geomechanical modeling. The FE grids need to rigorously cover the boundaries of the reservoir (Figure 8). Sideburdens (i.e., limiting boundaries) were built on the sides of the studied reservoir area parallel to the direction of the reservoir’s grids. The top boundary condition applied to the model involves a lithostatic load relating to the sedimentary overburden. The cap rock is considered to be part of the overburden and is therefore not included in the modeling. The underburden was extended from the base of the constructed grids to enhance the aspect ratio and provide a logical transfer of stress from the boundaries to the reservoir and overburden throughout the stress modeling. For the stress alteration and the sideburden, an additional five cells, whose sizes increase geometrically by a factor of 1.5 towards the model boundaries, were added to the model (Figure 8a). These external volumes could be modeled in detail considering all horizons and layers as and when sufficient structural and material data become available (Figure 8b).

4.2.2. Elastic Properties

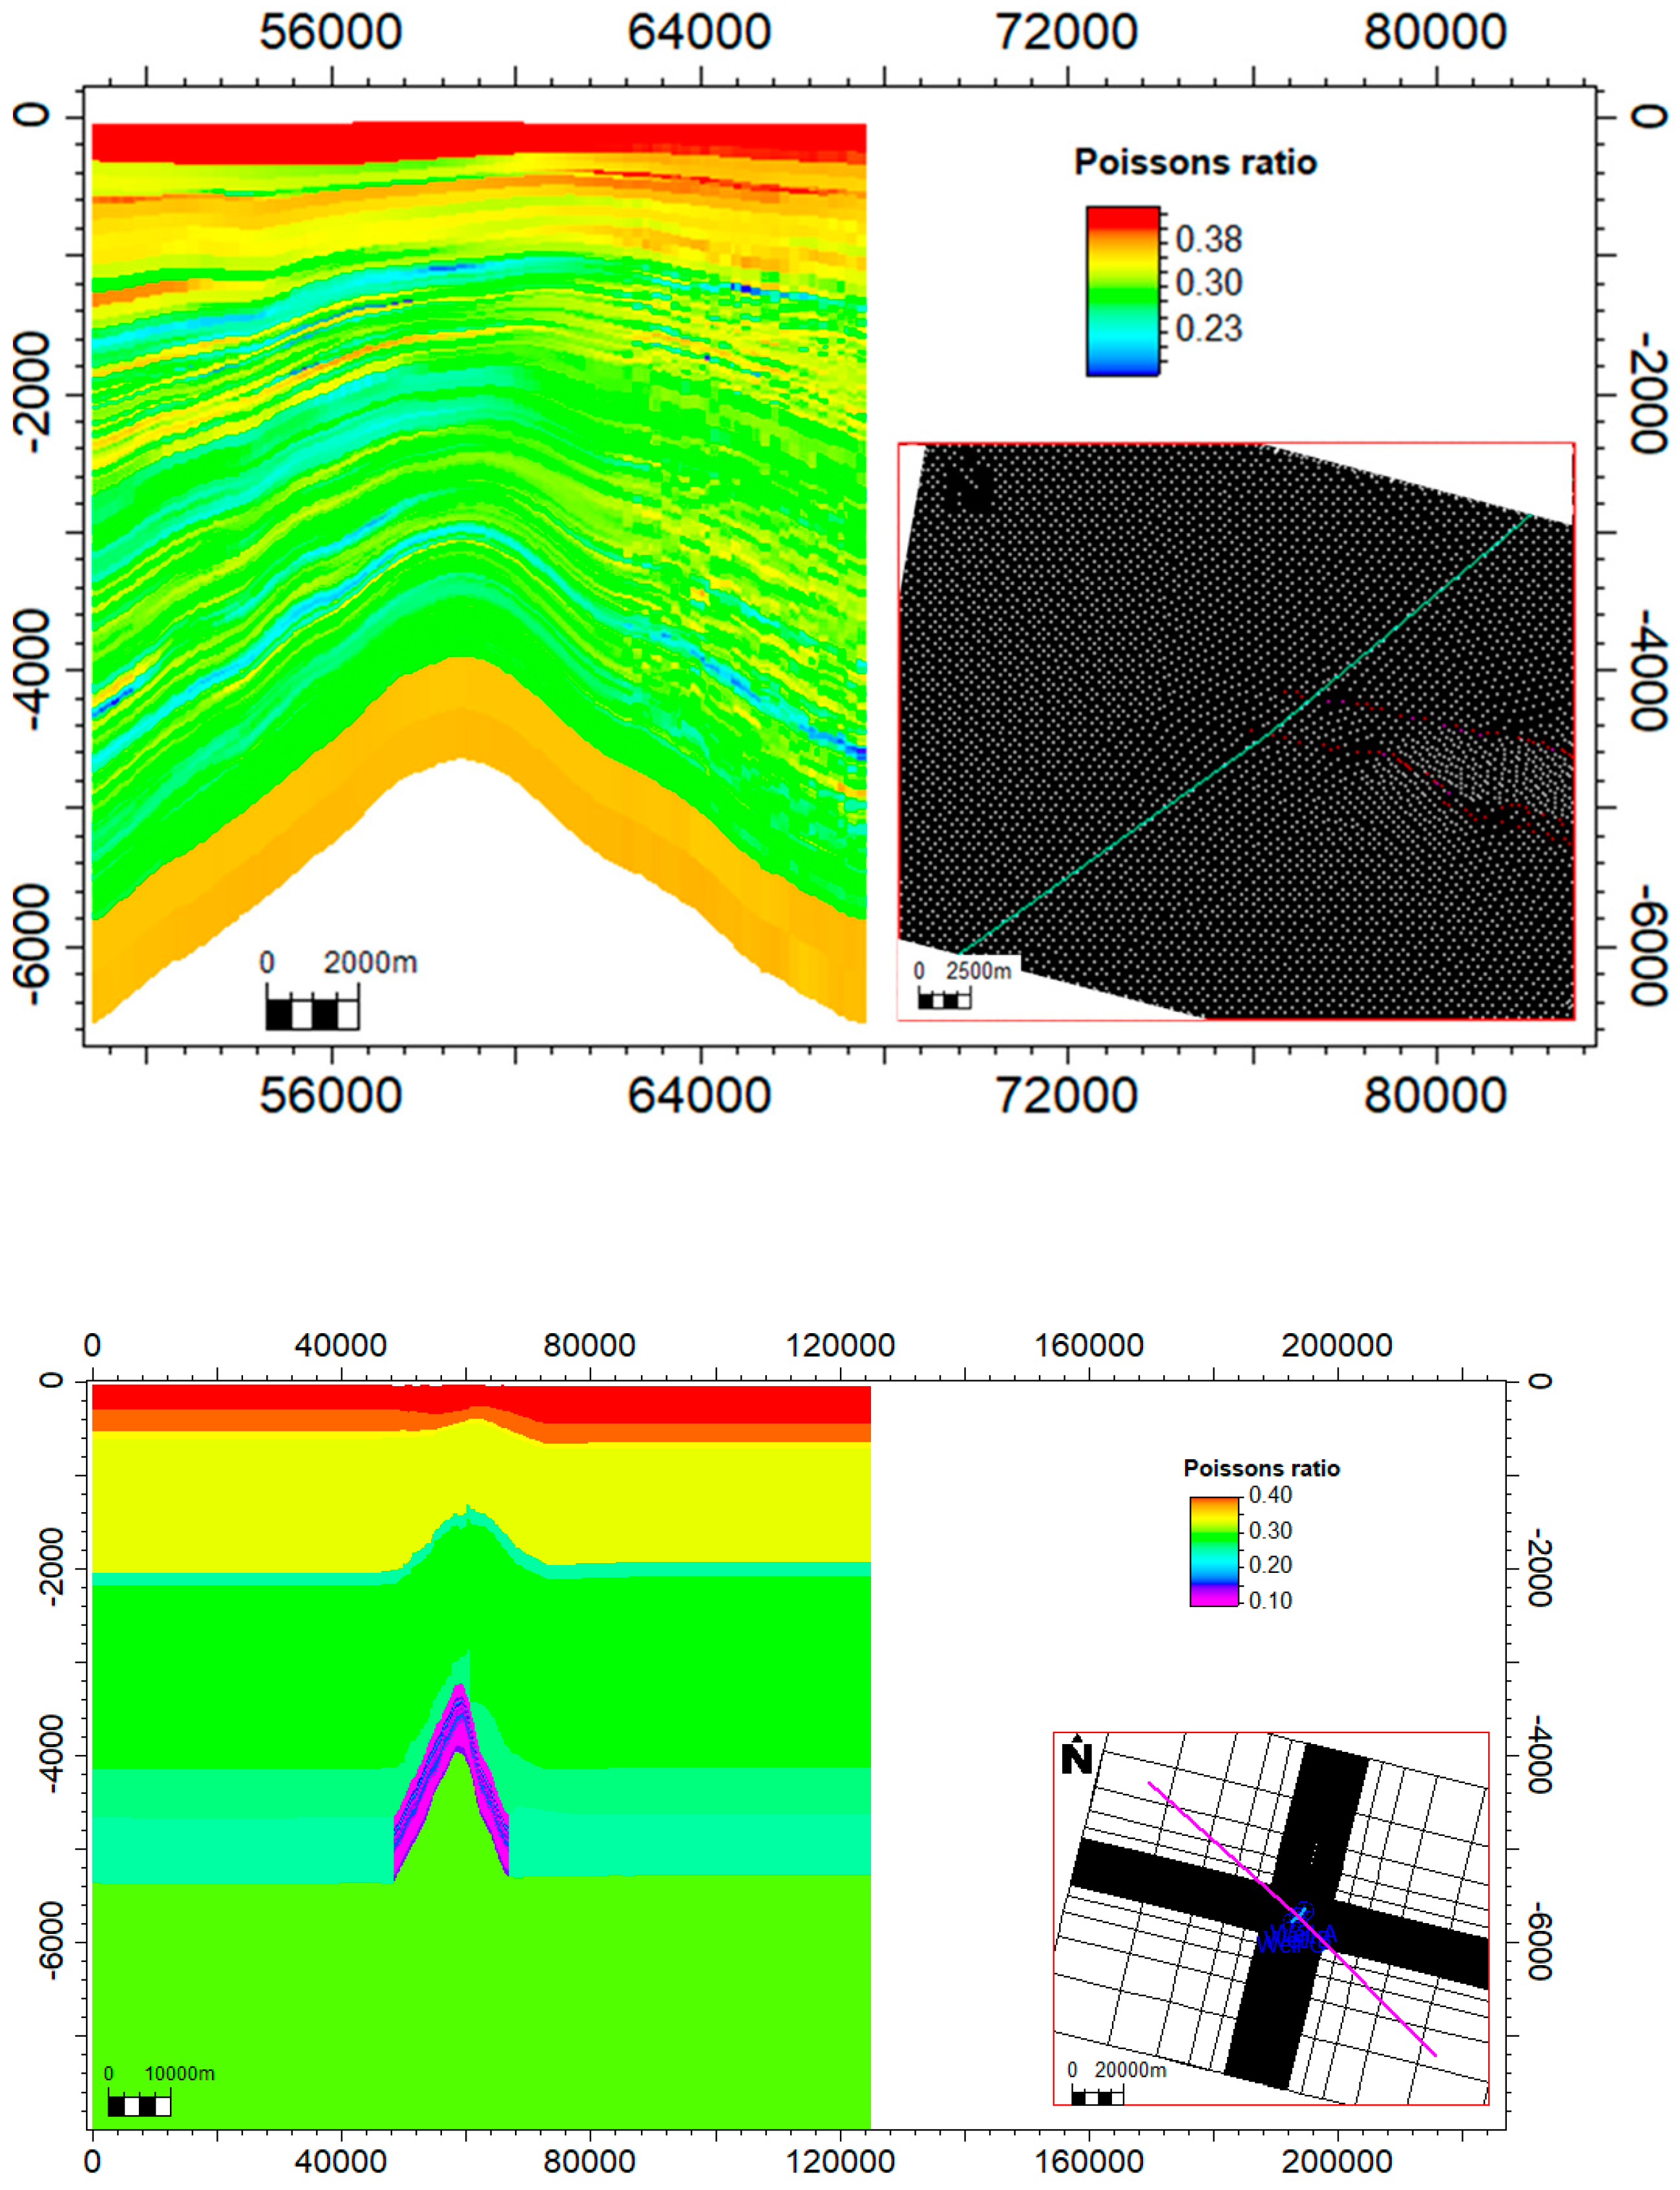
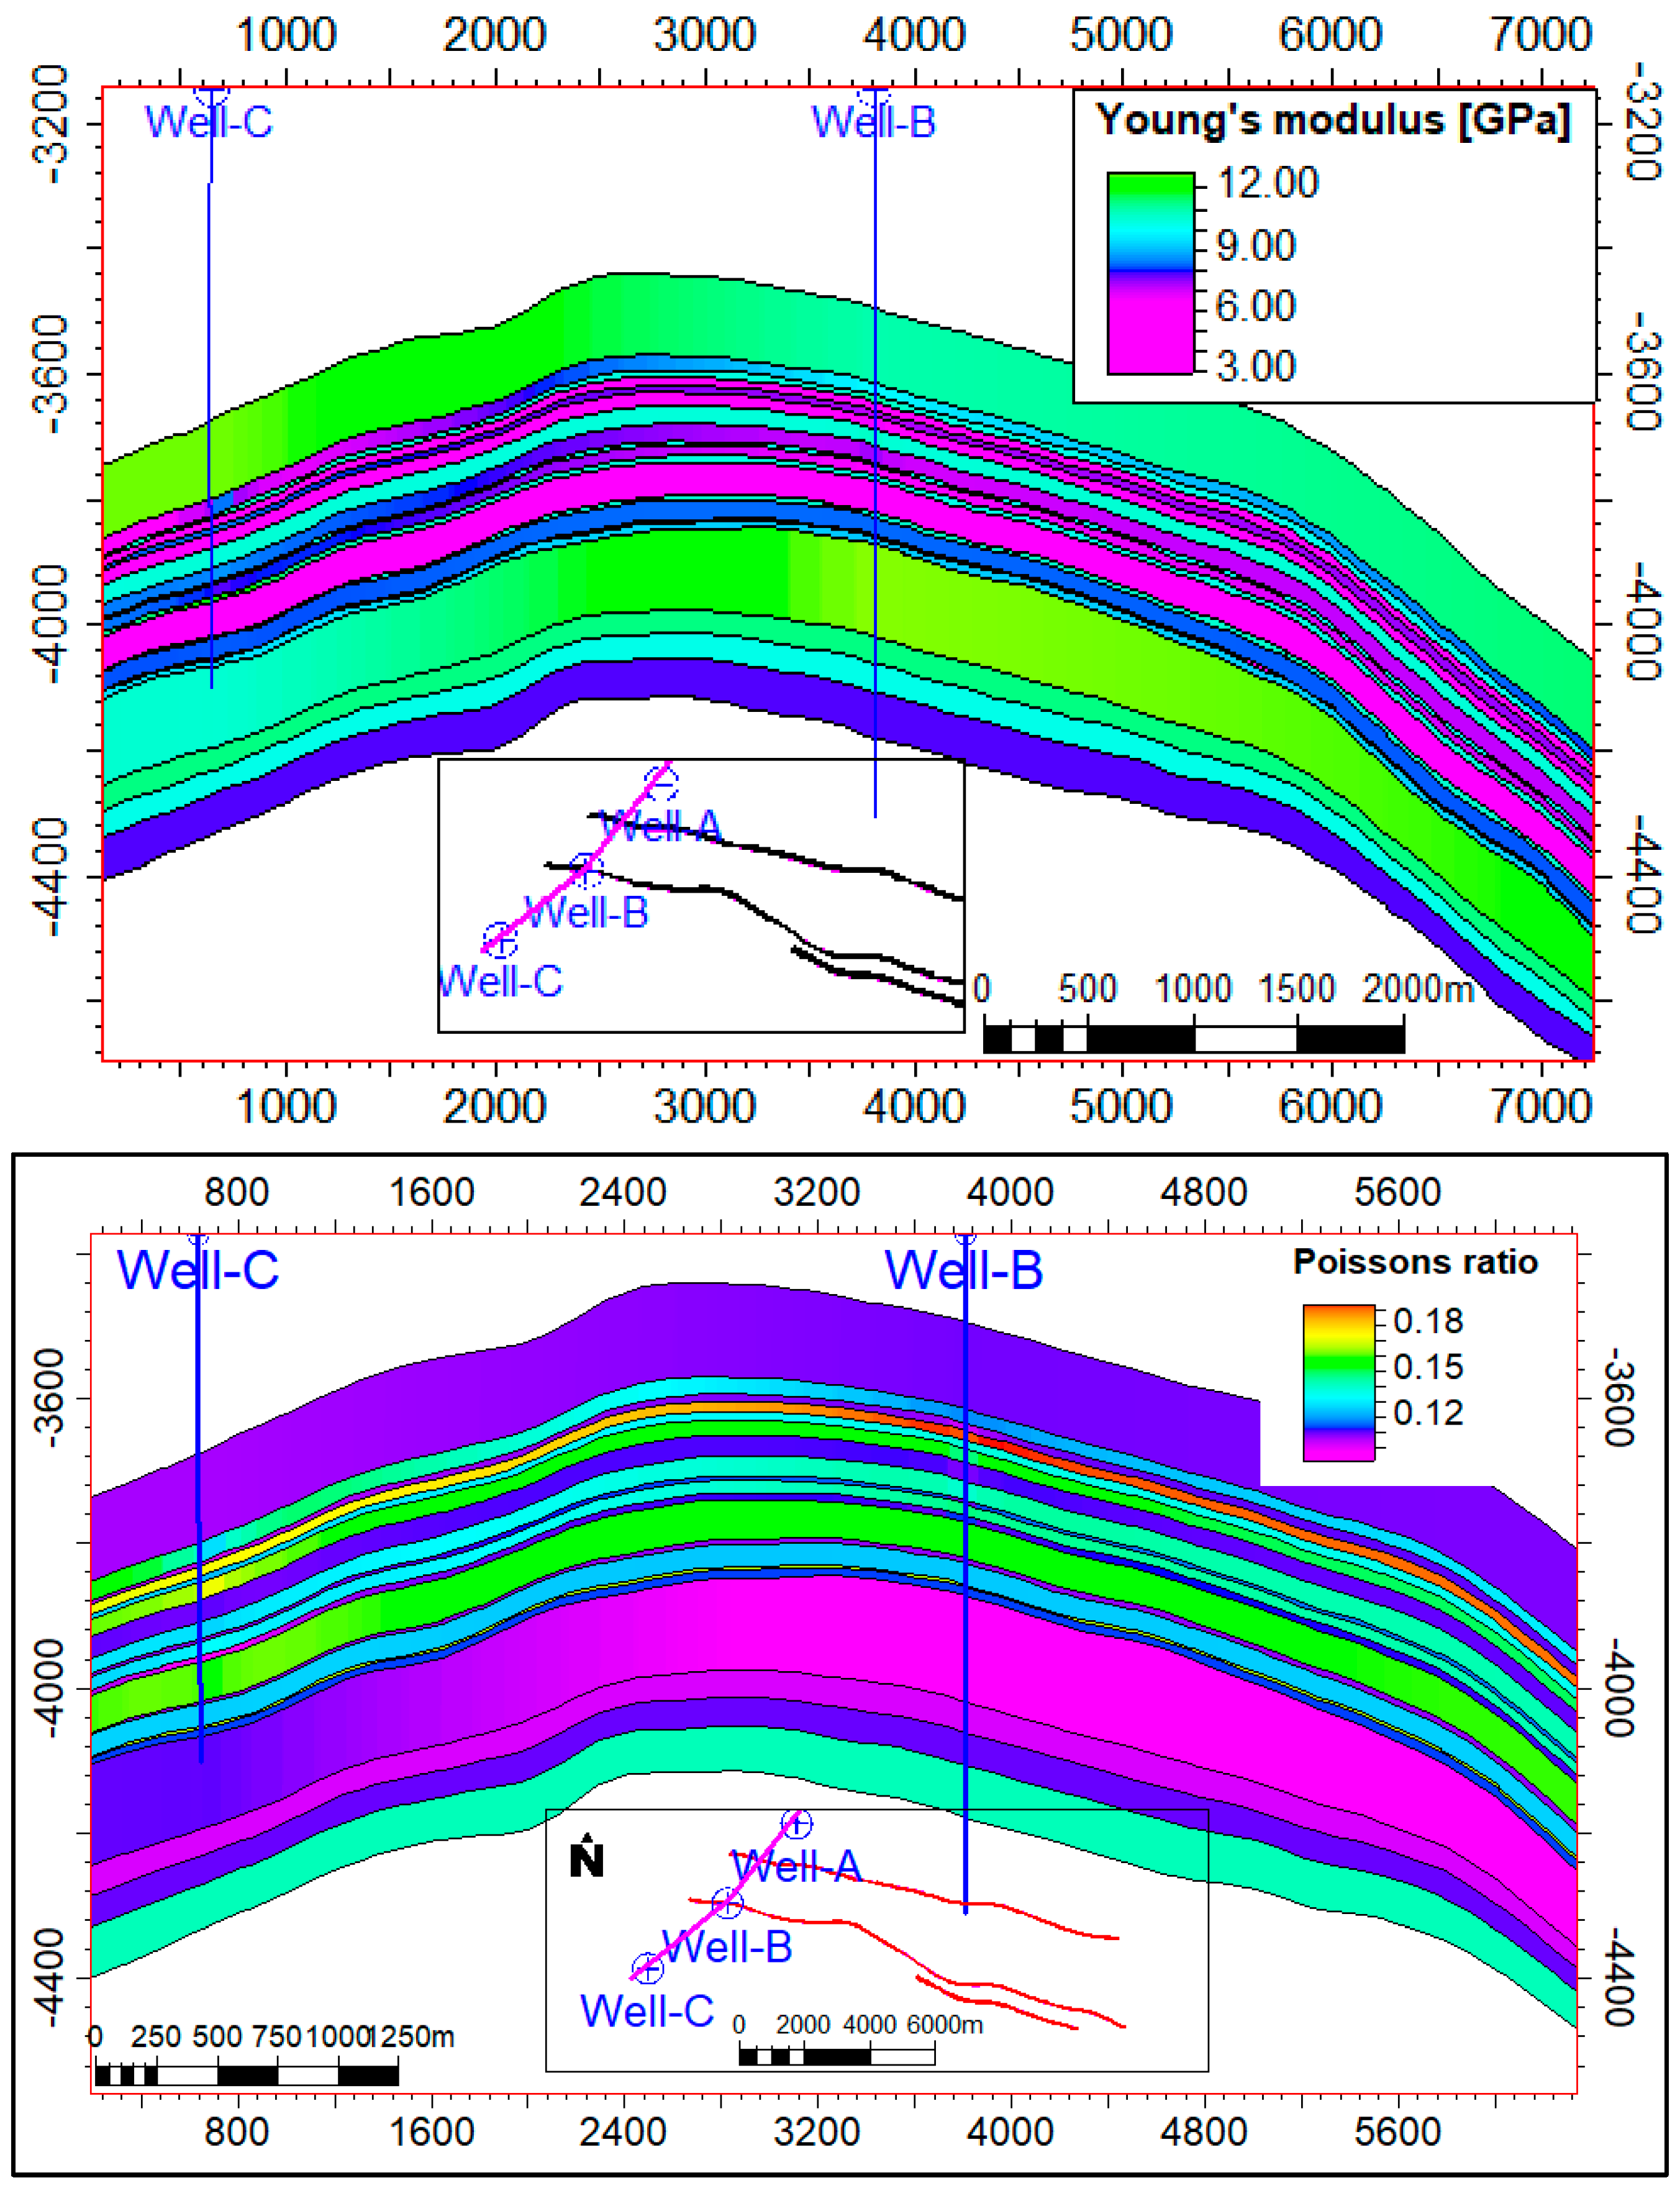
To ensure accurate geomechanical modeling, we integrated seismic inversion results with finite-element method (FEM) calculations. Specifically, we calculated dynamic elastic properties, such as Young’s modulus and Poisson’s ratio, from the seismic inversion data and subsequently populated these properties within the FEM grid. Figure 9 and Figure 10 illustrate this process: Figure 9 presents the Young’s modulus, with the upper panel showing values derived from seismic inversion and the lower panel depicting these values populated in the FEM grid. Similarly, Figure 10 displays the Poisson’s ratio, where the upper panel reflects the inversion results, and the lower panel demonstrates the populated values within the FEM grid. This integration of seismic inversion and FEM allows for a comprehensive evaluation of the geomechanical behavior under reservoir depletion, ensuring that both geometric and mechanical properties are accurately represented in the simulation.
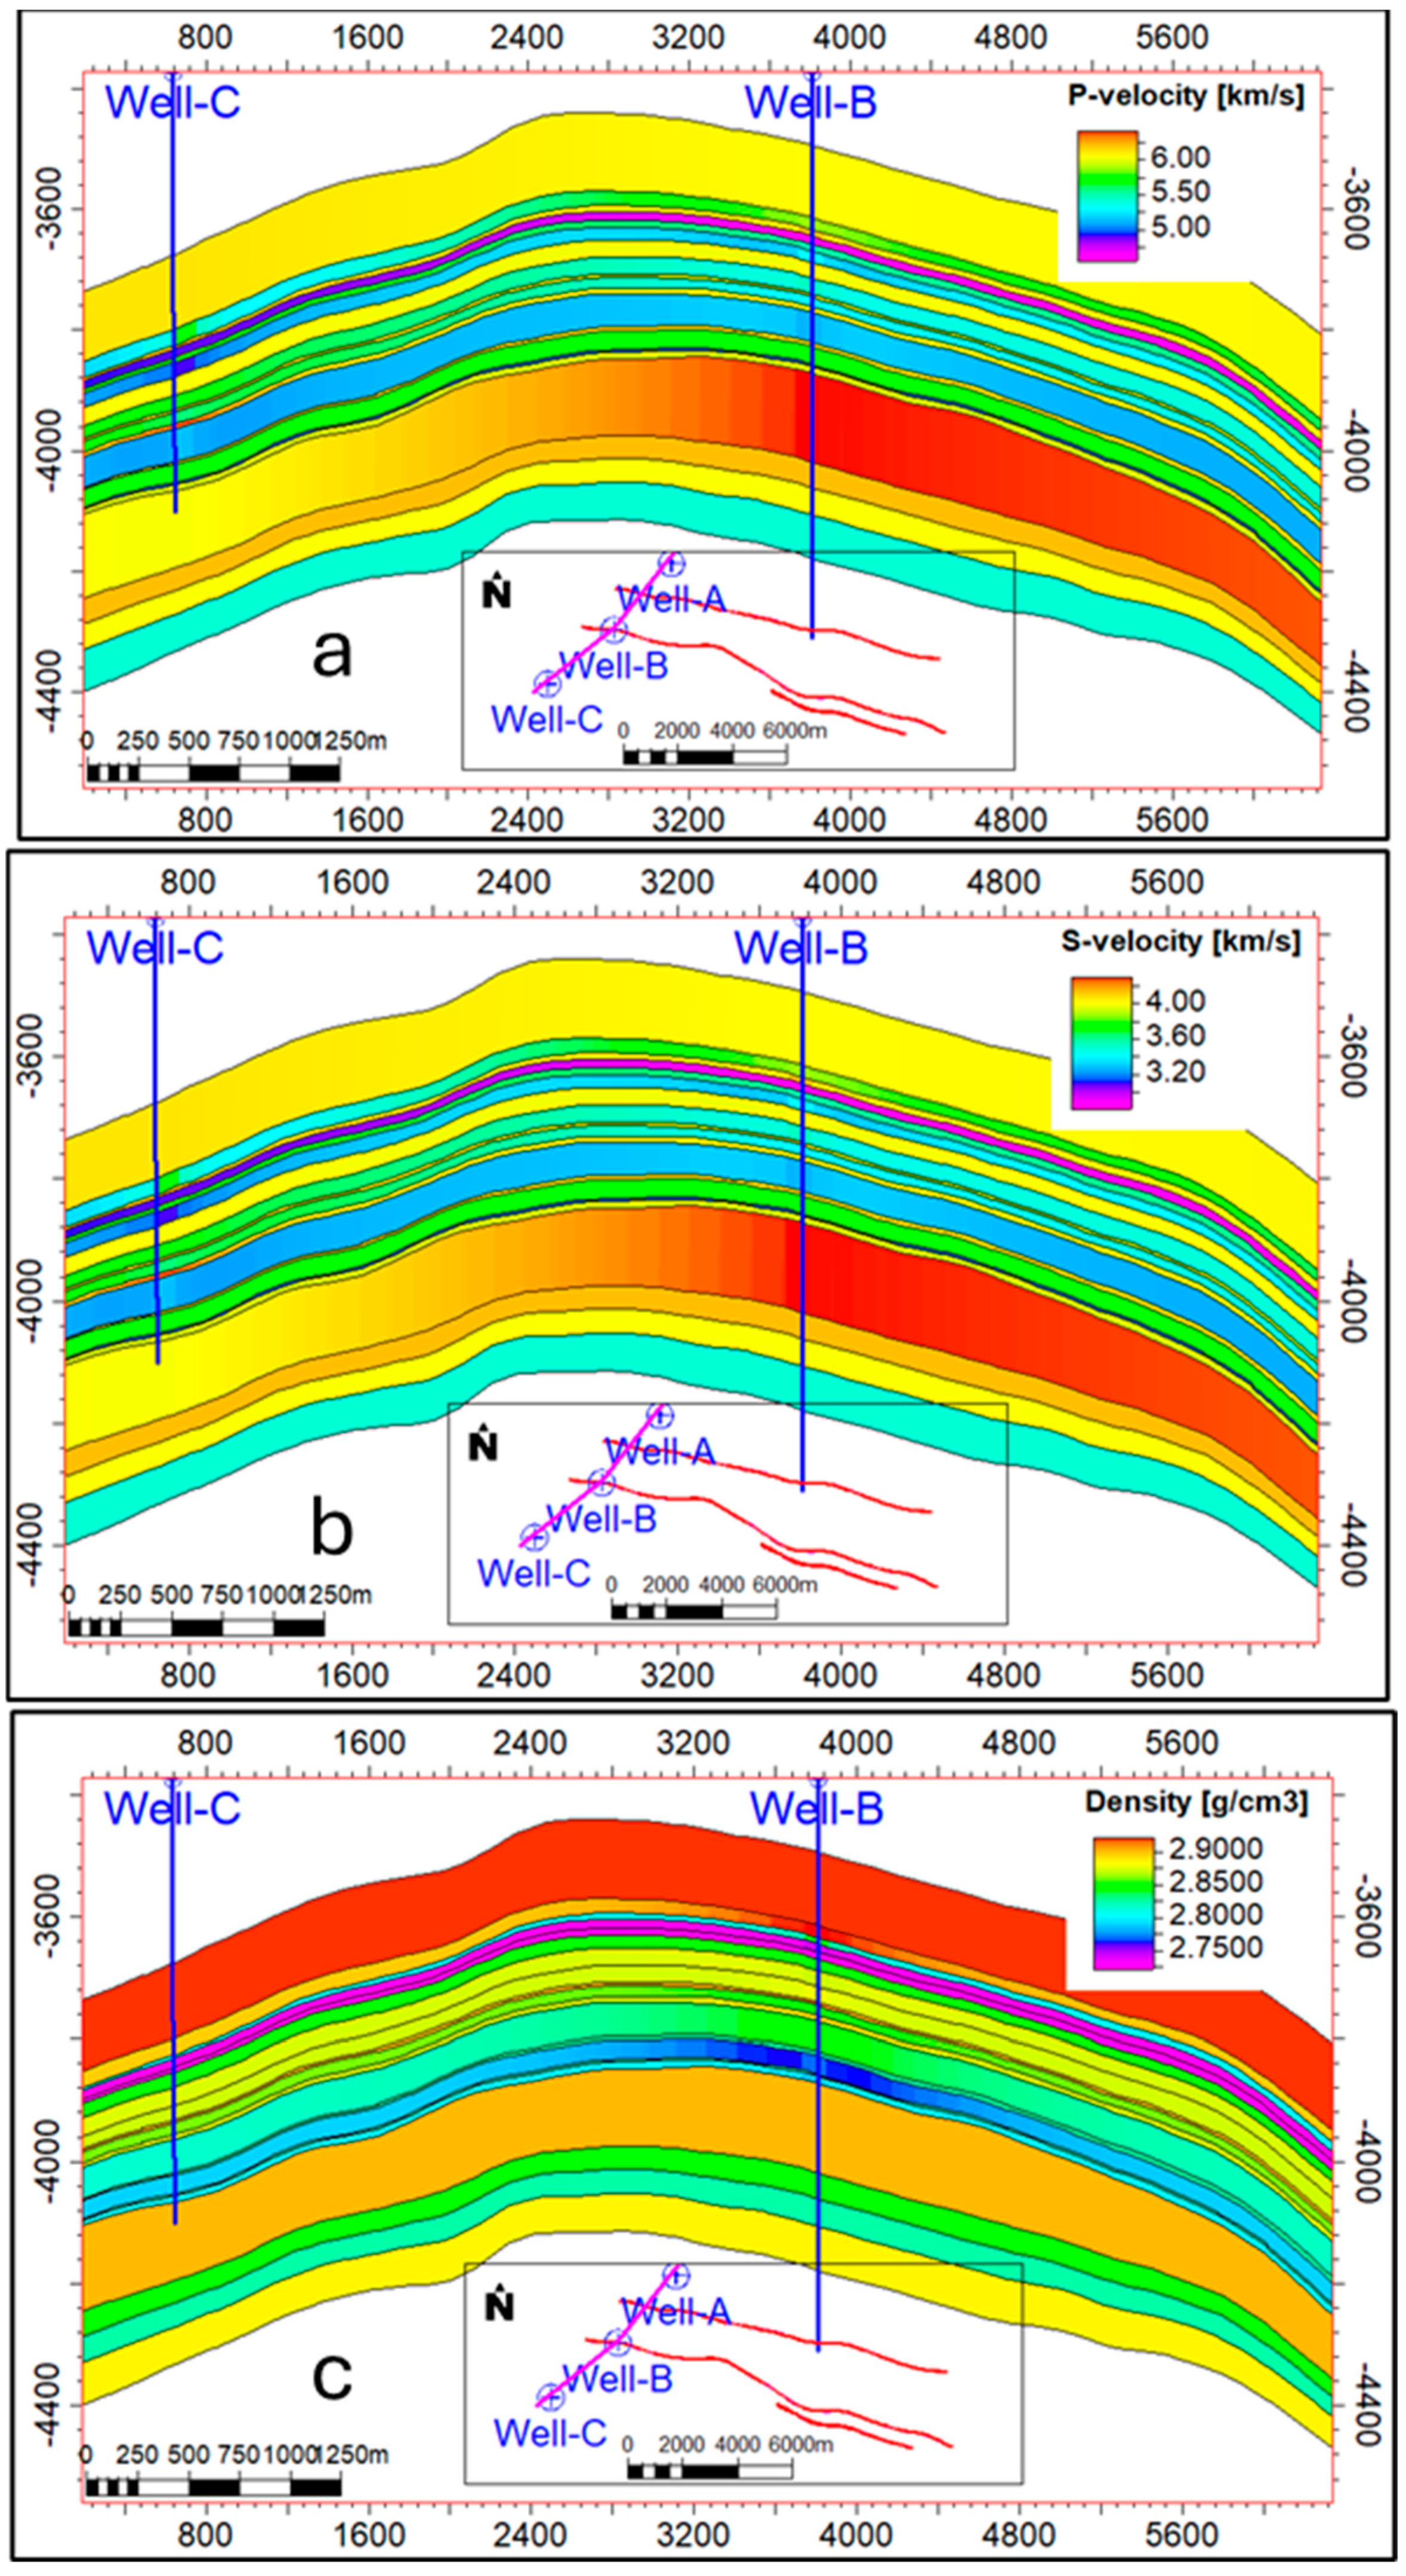
Rock mechanical parameters are essential to establish accurate predictions of UCS and earth stresses, which can later be refined and adjusted as additional information becomes available [72]. Figure 11 and Figure 12 illustrate the distribution of the velocity, density and mechanical properties throughout the studied area. The Vp, Vs, ρ, v, and E values are 4.6–6.35 km/s, 2.8–4.3 km/s, 2.4–2.95 g/cm, 0.12, and 10 GPa for the Kangan Formation, respectively. For the Upper Dalan Formation, these average values are 5.4 km/s, 3.4 km/s, 2.5 g/cm, 0.16, and 8 GPa, respectively (Table 4).
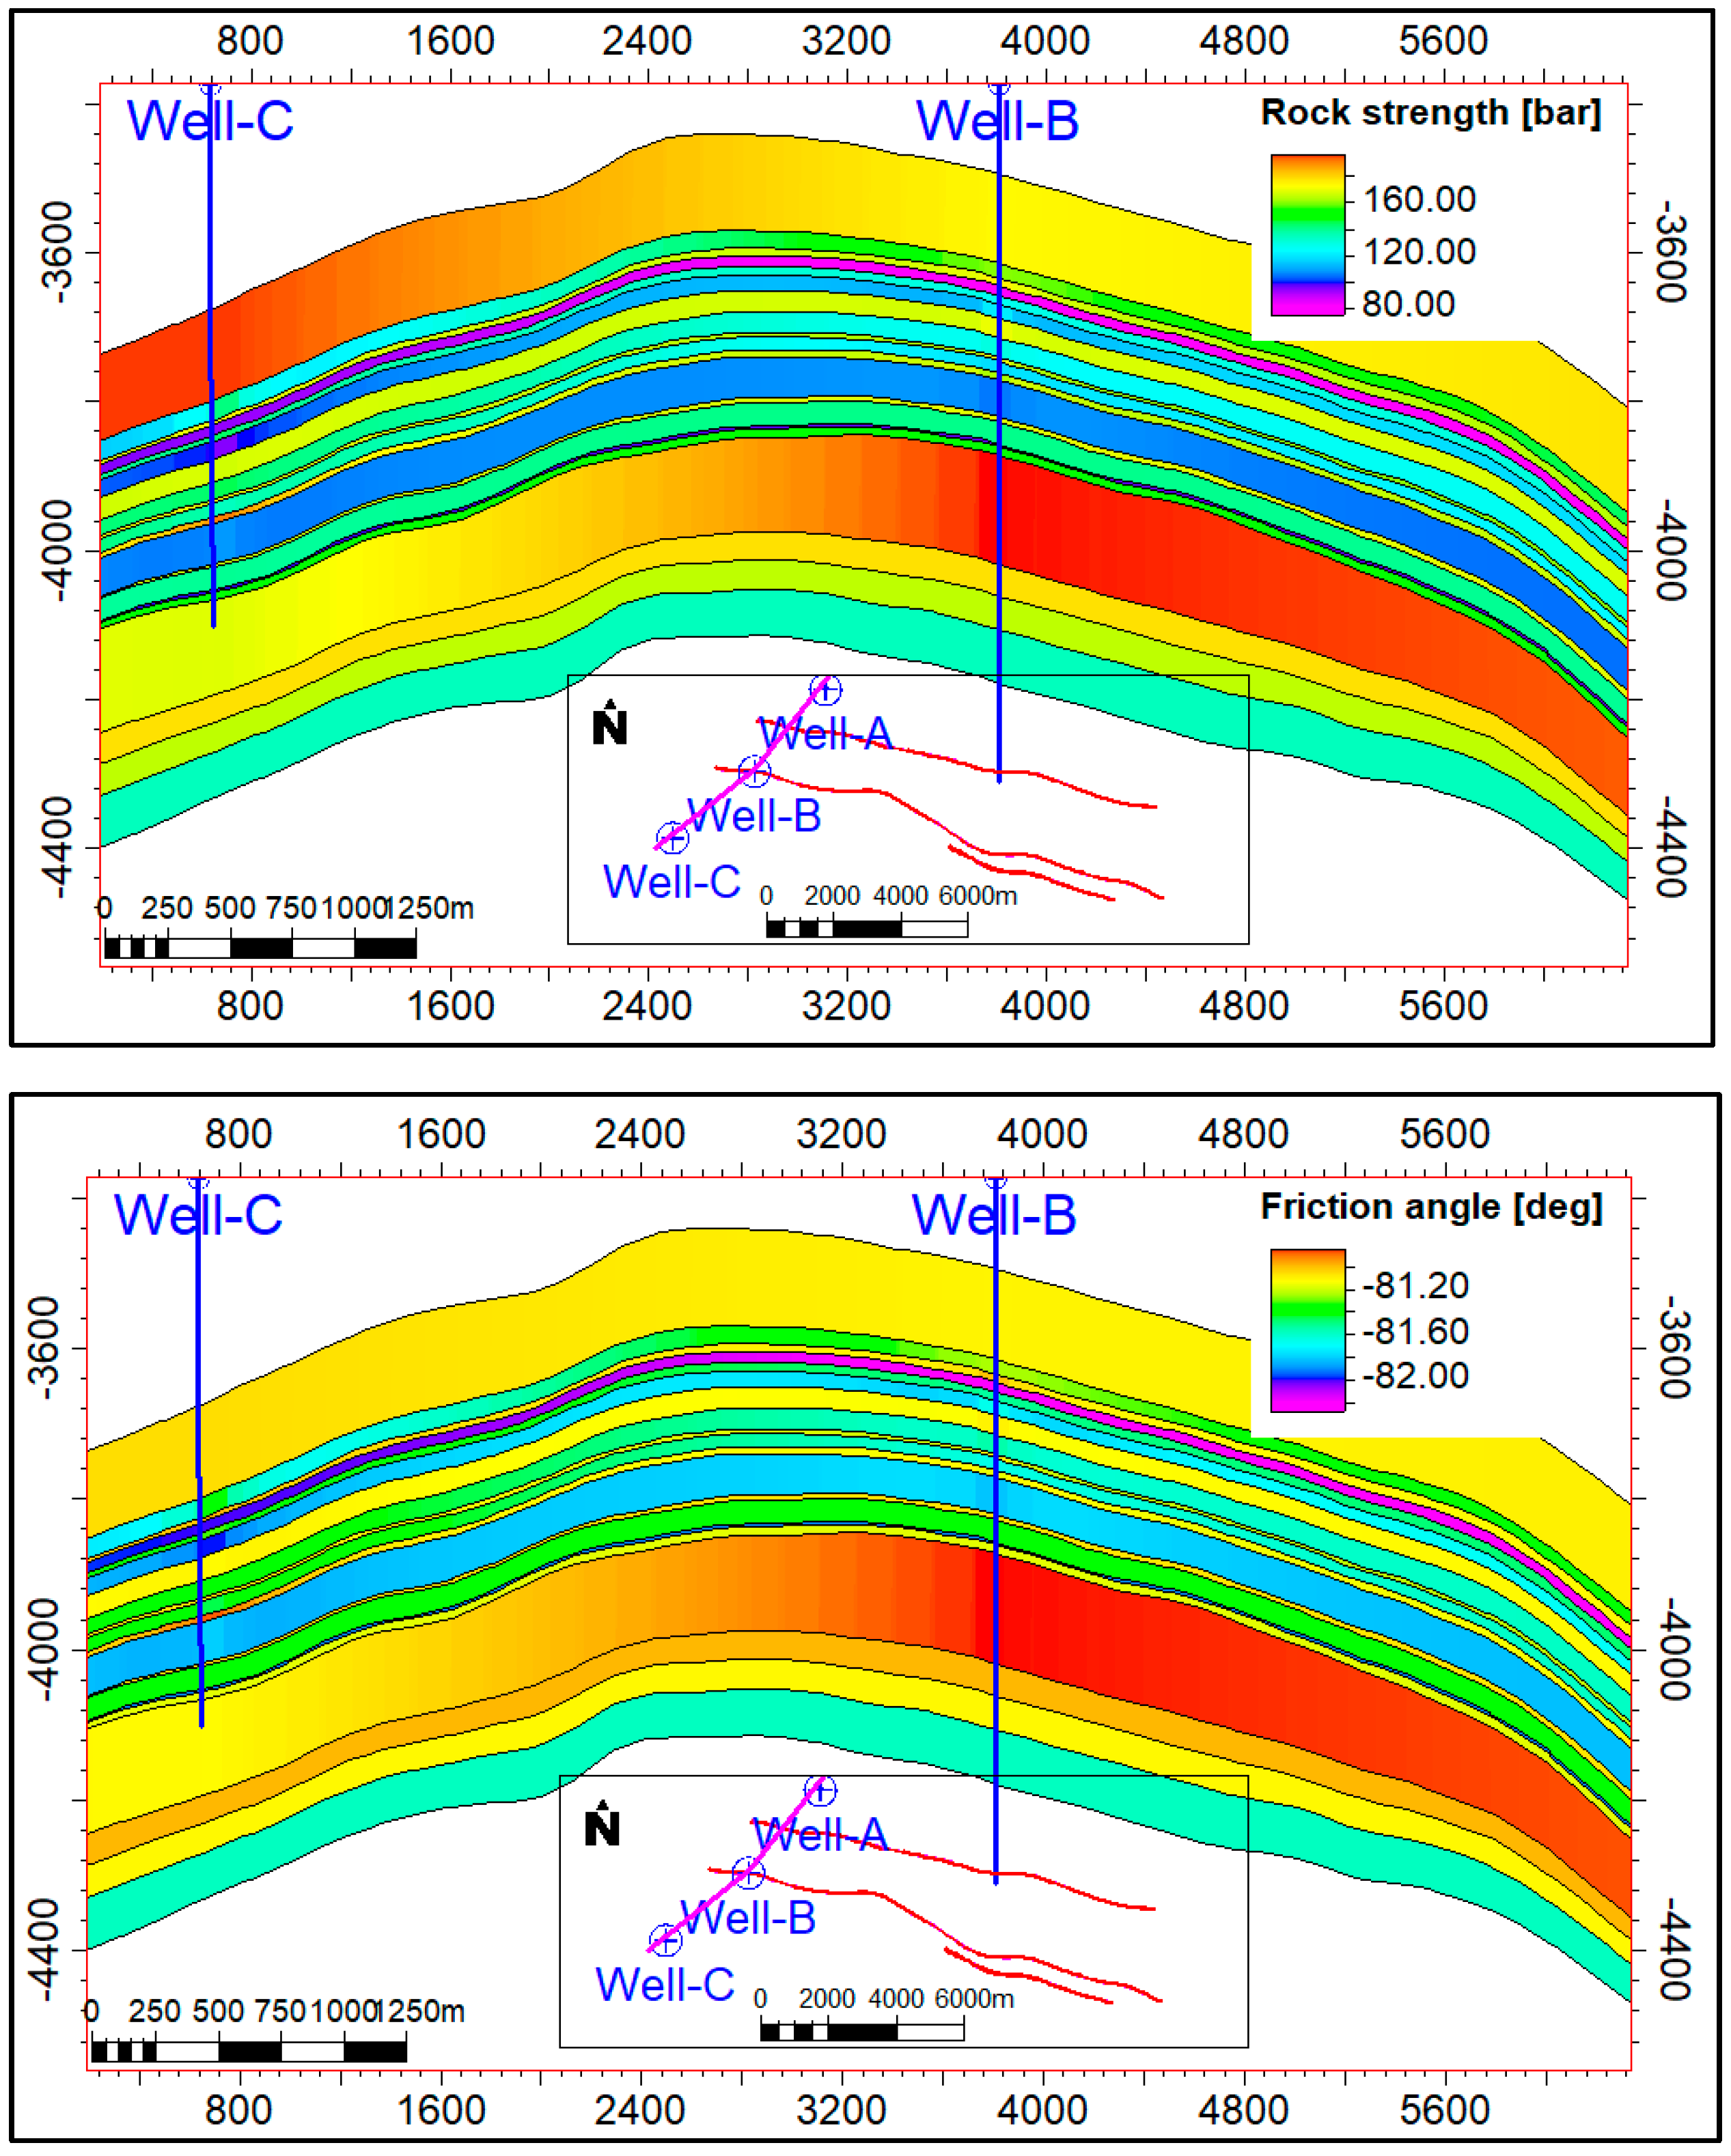
The capacity of formations to endure a prevailing earth-stress setting is determined by its rock-strength variable values. Unconfined compressive strength (UCS) is usually used to estimate rock strength. Equation (7) was used to estimate UCS from well-log data, through the derivation of Young’s and shear modulus, porosity, and additional rock properties. As illustrated in Figure 13, the average values of UCS are 140 bar for reservoir formations. TSTR is the maximum stress that a material can endure while being stretched or pulled before it breaks, and it is considered to be one-tenth of UCS in this study.
For friction-angle (ϕ) determinations, high values of this parameter suggested by rock mechanical tests were ignored. Instead, the friction angle was calculated using available Vp data. The results reveal average ϕ values of about 80 deg for reservoir formations (Figure 13).

4.2.3. Pore Pressure

There are different approaches available for determining pore pressure from well-log data, most of which are efficient stress-dependent methodologies. In the current study, both Eaton and Bowers’ methods were employed to estimate the pore-pressure profiles of the clay-rich intervals of the overburden. Since the Eaton method generated better consistency with the drilling-fluid densities used and the drilling events observed, this method was chosen for calculating the pore-pressure profile in the non-reservoir intervals (Figure 7). Figure 14 shows, in the vertical profile, the modeled pore-pressure distribution at the start of production in the reservoir section.

4.3. Discontinuity Modeling

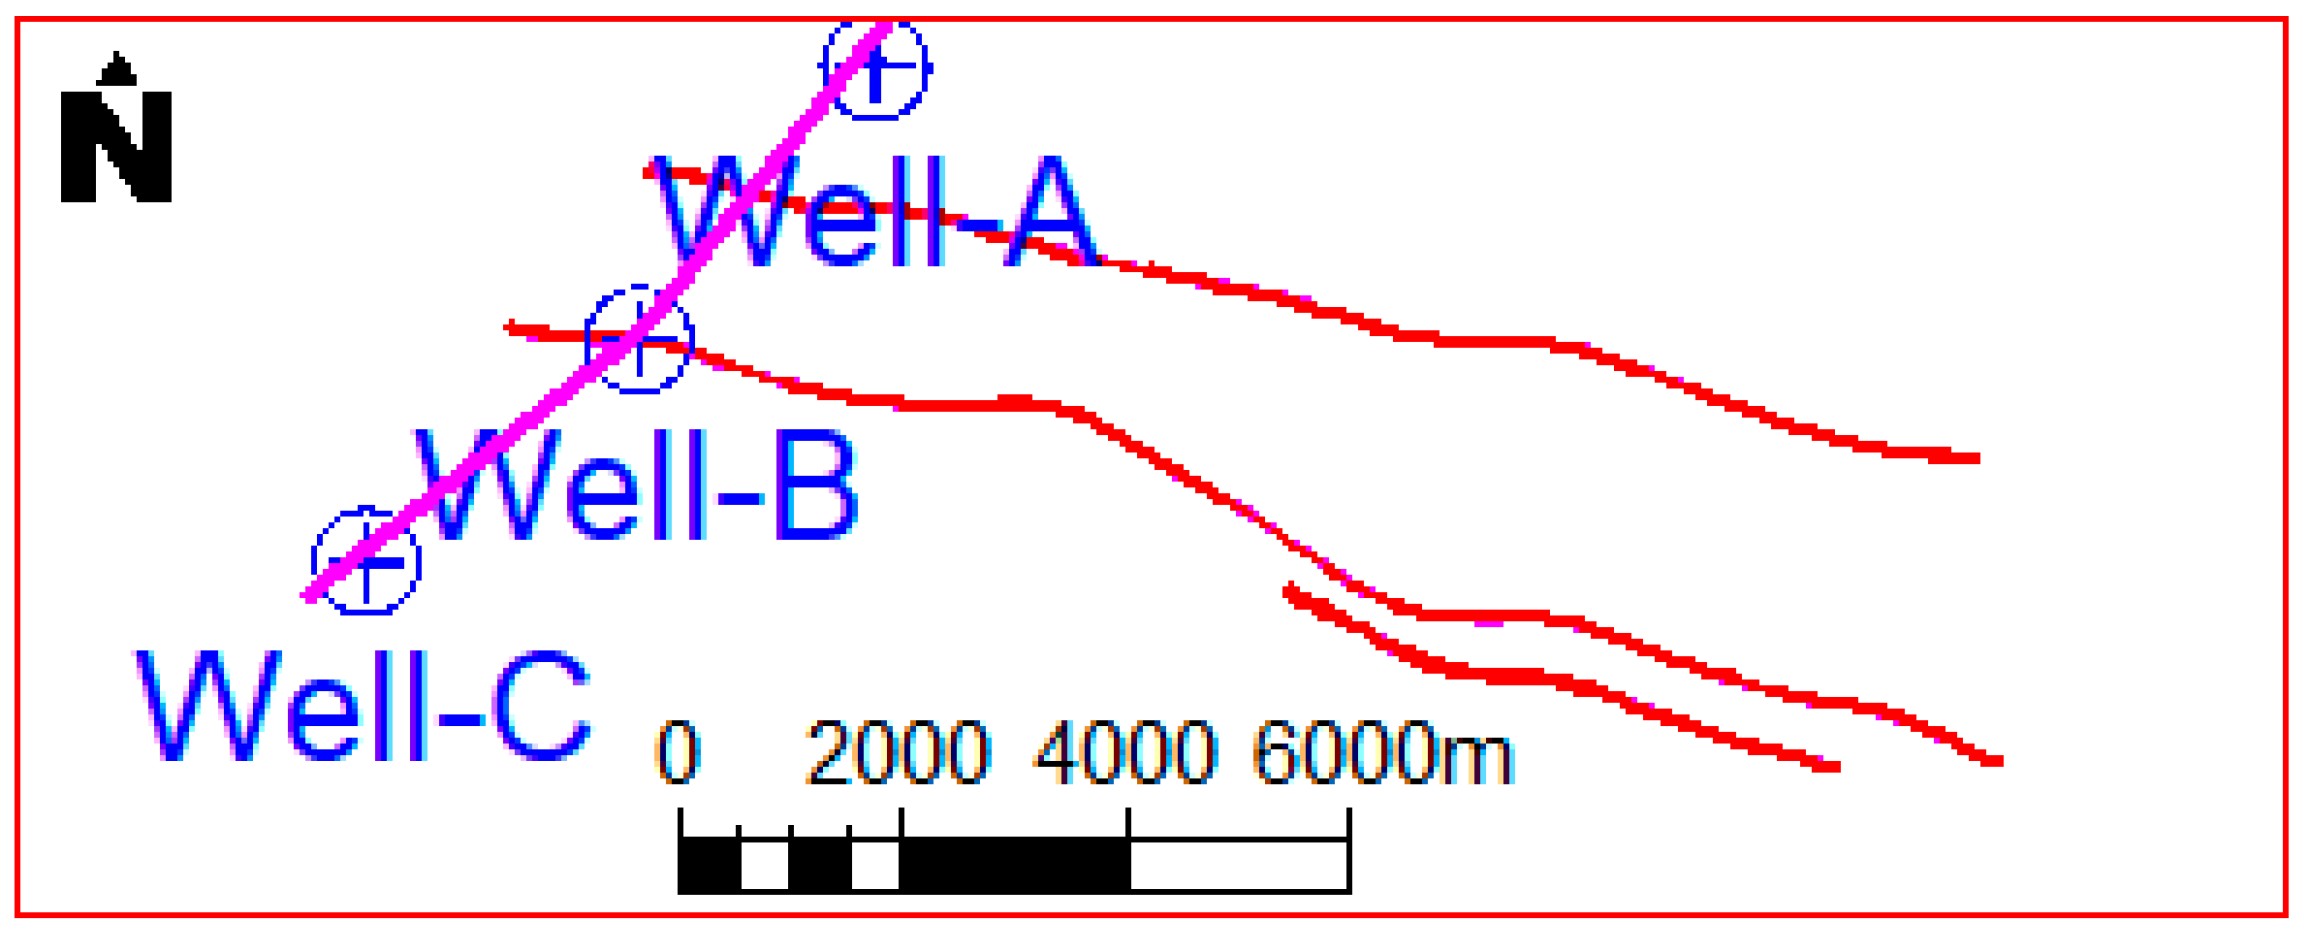
In this step, minor and major faults were identified and introduced into the model (Figure 15). For comparative analysis, common bases are required among different models. The fault parameters matched with the initial and current reservoir condition and were applied in cases where improved matches between certain parameters could be established, as shown in Table 5.

4.4. Boundary Condition

4.4.1. Horizontal-Stress Direction

The determination of the horizontal-stress orientation is a primary step in stress characterization and modeling, and stress direction analysis is typically a critical objective of any geomechanical study [65]. Wellbore breakouts commonly tend to extend from a borehole with orientations aligned with the minimum horizontal-stress (Sh) direction, because the stress concentration tends to be greatest in that direction. Therefore, wellbore breakout azimuth analysis, in a vertical wellbore, helps to identify the Sh orientation [27]. In this study, FMI data were interpreted to identify the Sh direction. Wellbore breakout directions were interpreted using FMI image data from Well C to be about 20 degrees in the study area (Figure 16). In the current study, the azimuth of the maximum horizontal stress was considered to be at 110 degrees (perpendicular) to the minimum horizontal-stress direction (i.e., at an orientation of 90 degrees).

4.4.2. Vertical- and Horizontal-Stress Magnitudes

In situ stress magnitudes are difficult to explicitly measure. It is, therefore, necessary to estimate those magnitudes from other available measured variables, such as from deformation (strain) and pressure regimes. Nevertheless, there are factors that constrain both the magnitude and orientation of the principal stresses (Sv, Sh, and SH) in a formation. As formation density can easily be obtained from most available suites of recorded well-log data, formation bulk density logs (pb) have been employed in this study to determine Sv. Vertical stress (Sv) was predicted by applying pb from the surface to the total depth of the well using Equation (11). Figure 17a shows the distribution of SV through the field.
Measuring tectonic strain values is an essential requirement of poroelastic horizontal-strain modeling. The two horizontal tectonic-strain factors (εx and εy), which may be compressional or extensional, can be effectively used as calibration parameters that can be adjusted to better fit the stress estimates derived from Sh calculations. Initial stress-field estimates are required to provide a starting point from which ranges of possible stress magnitudes (particularly SH) are estimated. These estimates are subsequently refined by varying εx and εy to provide more accurate predictions that are consistent with all the regionally available stress-field indicators. The εx and εy values found to provide the best fits were 0.001 and 0.009, respectively.
Model outputs were generated that provided the stress magnitudes in any direction throughout the studied area. Figure 17 displays the estimated magnitudes of Sv, SH and Sh for the reservoir section. Sv values range between 16,500 and 17,000 psi, whereas SH magnitudes range between 16,000 and 17,000 psi, and Sh values range between 15,000 and 16,000 psi.
The simulated stress regime can also be applied to further describe the geomechanical characterization of the underground formations evaluated by the model. Empirical stress ratios were applied to model potential stress anisotropies throughout the studied formations using Equations (13) and (14).
Boundary conditions have a substantial impact in finite-element modeling. Such assumptions apply regional constraints, impacting the model’s behavior. These constraints are incorporated either as loads (tectonic stresses) or deformations (tectonic strains) that are applied to the whole model, including the sideburdens. As such, their effects are routinely converted to the finite elements at the start of each simulation. Based on boundary-condition assumptions and the data integration performed by the model, the resulting determination of the average azimuth of SH is 110°, which is in line with regional expectations.
The horizontal-stress magnitudes involve their own uncertainties. Consequently, averages of the generated stress values are used to provide estimated stress gradients. These calculated values imply that the Sh gradient is about 0.21 bar/m (Table 6). However, the range of horizontal stresses for the studied area should be in agreement according to the calculated stress values.

4.5. Coupling of Geomechanical and Dynamic Models

At first, a plateau rate of 1 BSCF/d was considered, and eight wells with 125 MMSCF/d capacity are required in order to meet this plateau. Based on these considerations, two platforms (four producer + two spares) are required, and production on these platforms will start in two stages in 2023 and 2024, respectively. At each stage, four wells start production, with a total rate of 500 MMSCF/d (Figure 18).
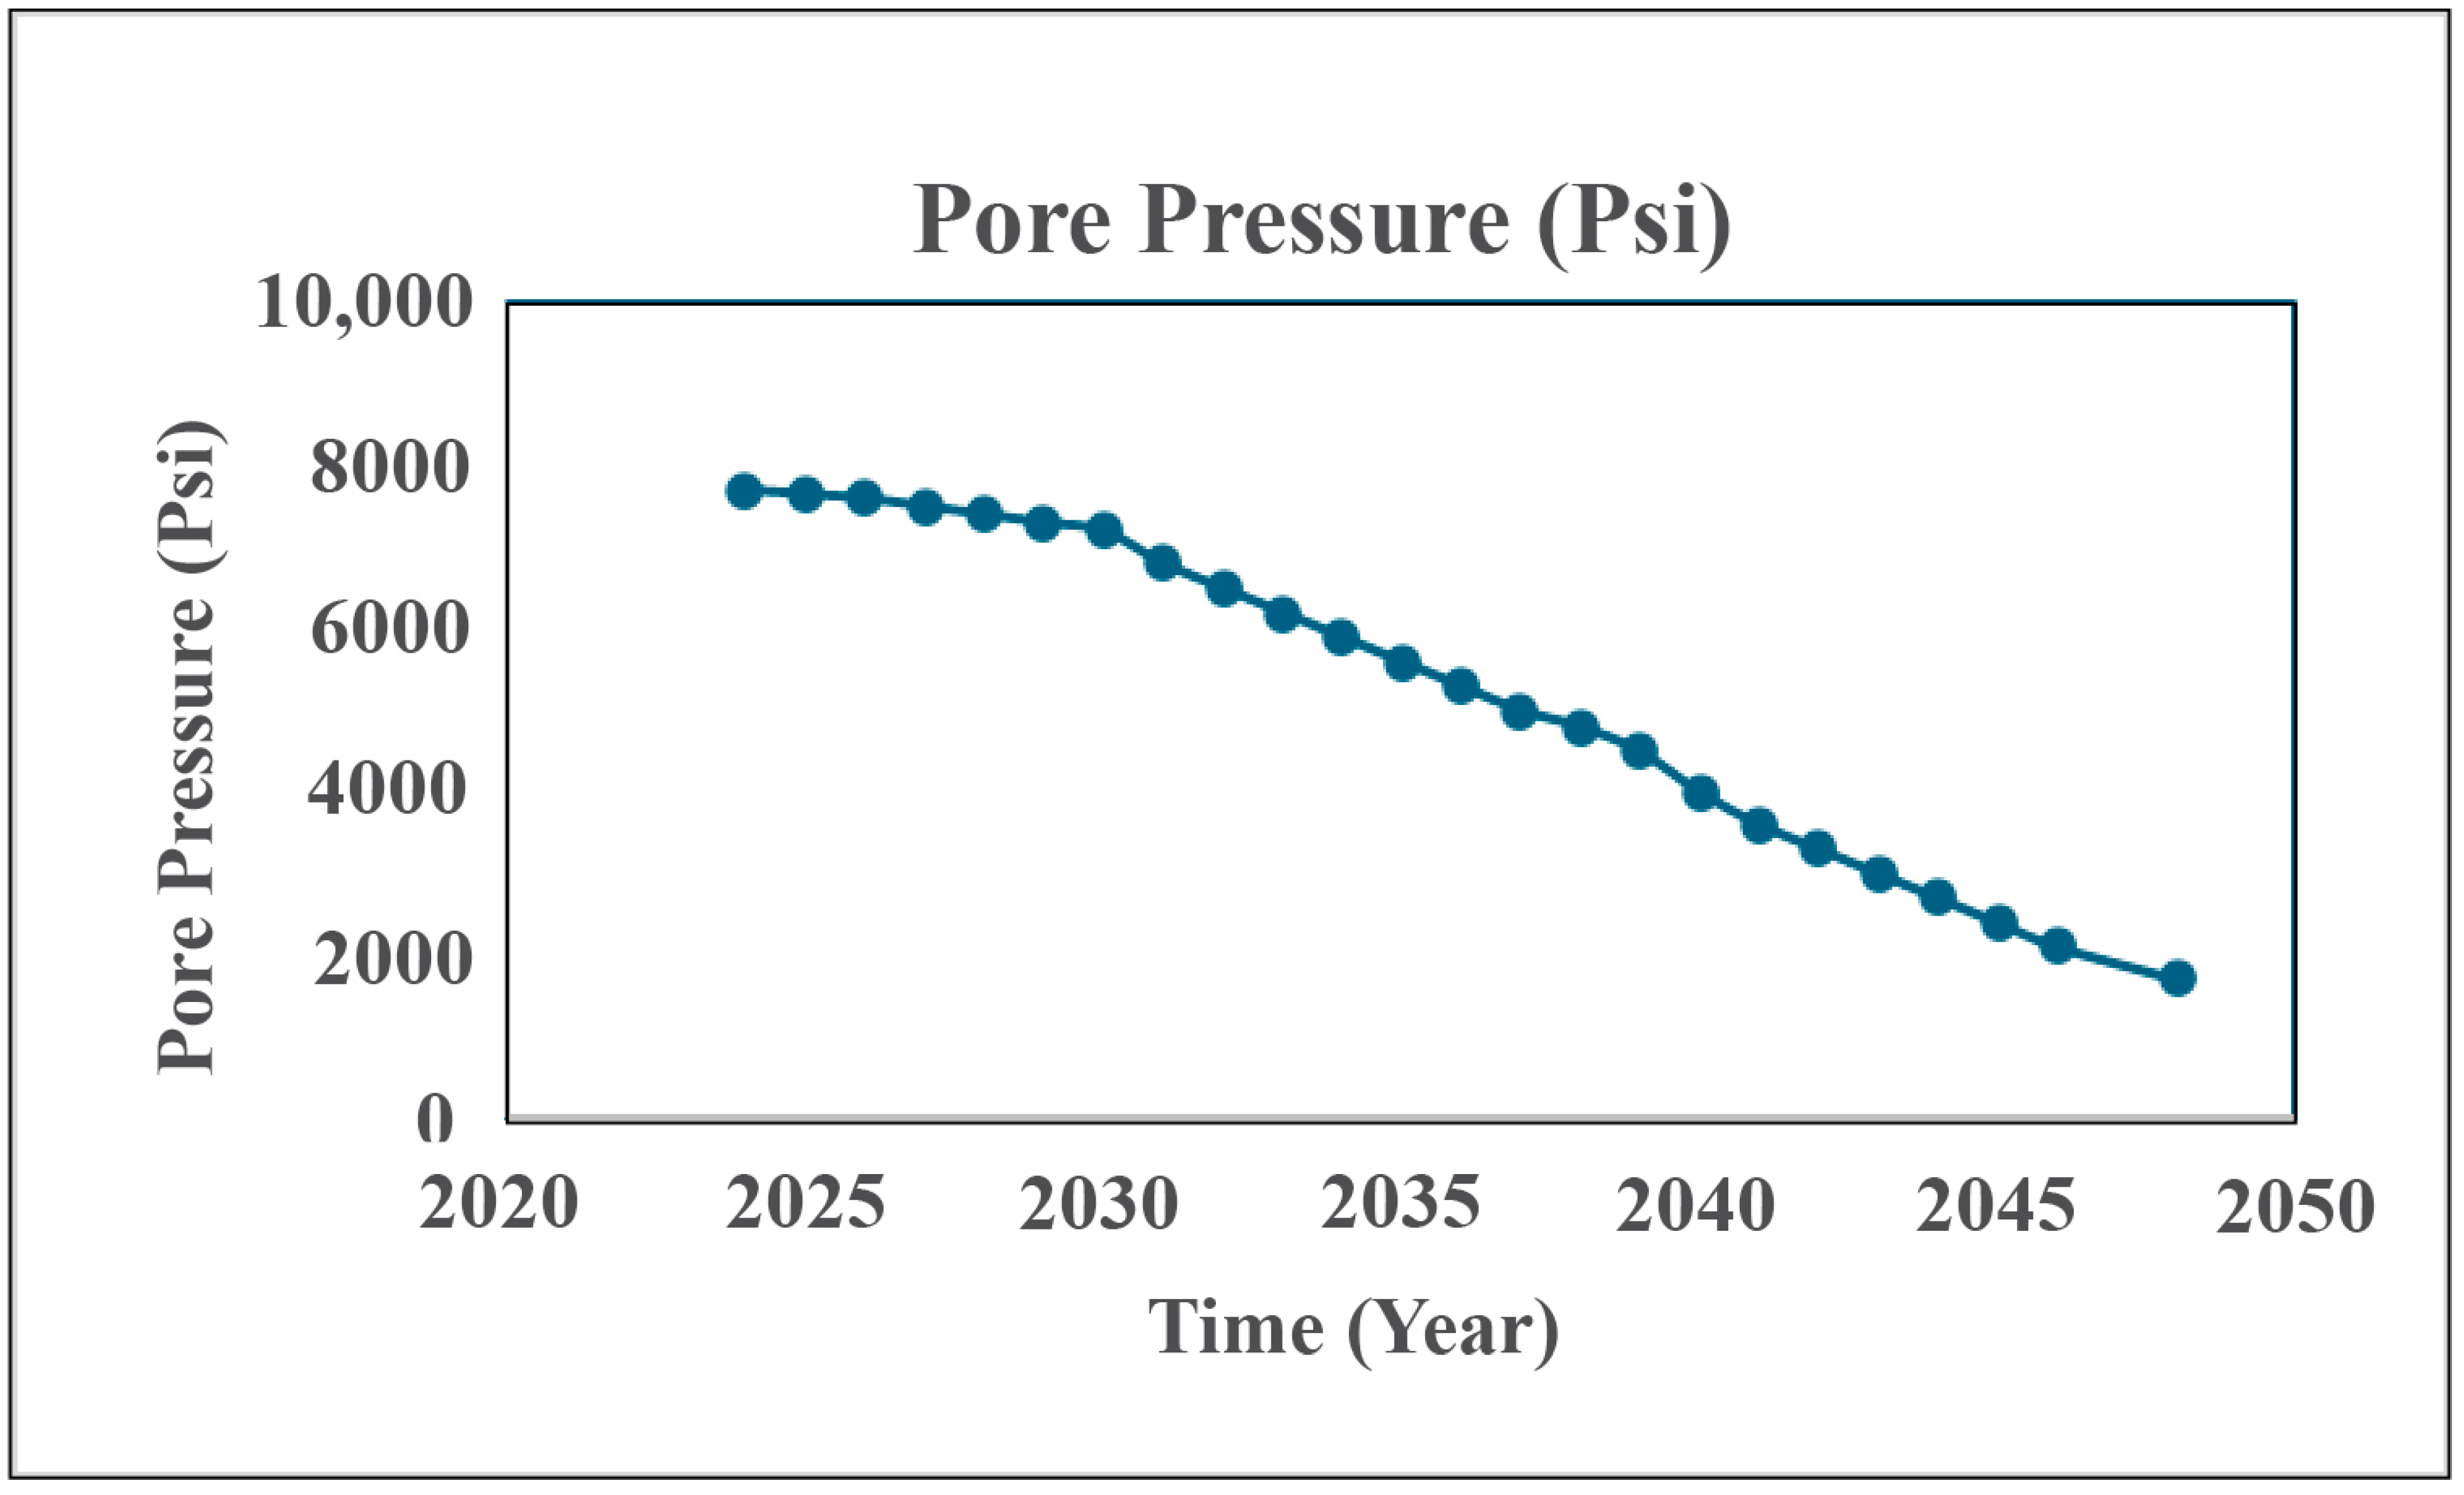
The pore-pressure alteration was calculated by dynamic reservoir simulation with the following projection. Gas production commences in the simulation in 2024 and continues through to 2048. For this study, 10 pore-pressure and water-saturation profiles were evaluated and coupled with the geomechanical model. The constructed GM model was then run multiple times in order to optimize the stress-field outputs for the reservoir volume and calibrate them with the available 1D geomechanical model in the initial condition.

4.6. Simulation Validation

Through multiple iterations, the simulation model eventually converges based on feasible grid characteristics that are consistent with the recorded/calculated geomechanical properties and boundary-condition assumptions. Hence, the final converged iteration of the GM is the most relevant of the early GM iterations in facilitating the calibration of the model by displaying Sh values with 1D geomechanical modeling results. After adjusting the initial condition of the GM model to the calibrated conditions, the analysis of the production of the Kangan–Dalan reservoir volume studied was then evaluated in detail. As hydrostatic conditions were applied for the overburden pore-pressure calculations, the model could then be run to calibrate the predicted pore pressure with the in situ stress results. The GM model generates a substantial amount of calculated variable information associated with each simulation run (Figure 19).

4.7. Stress and Strain Analyses, Shear Failure, Fault Reactivation and Subsidence

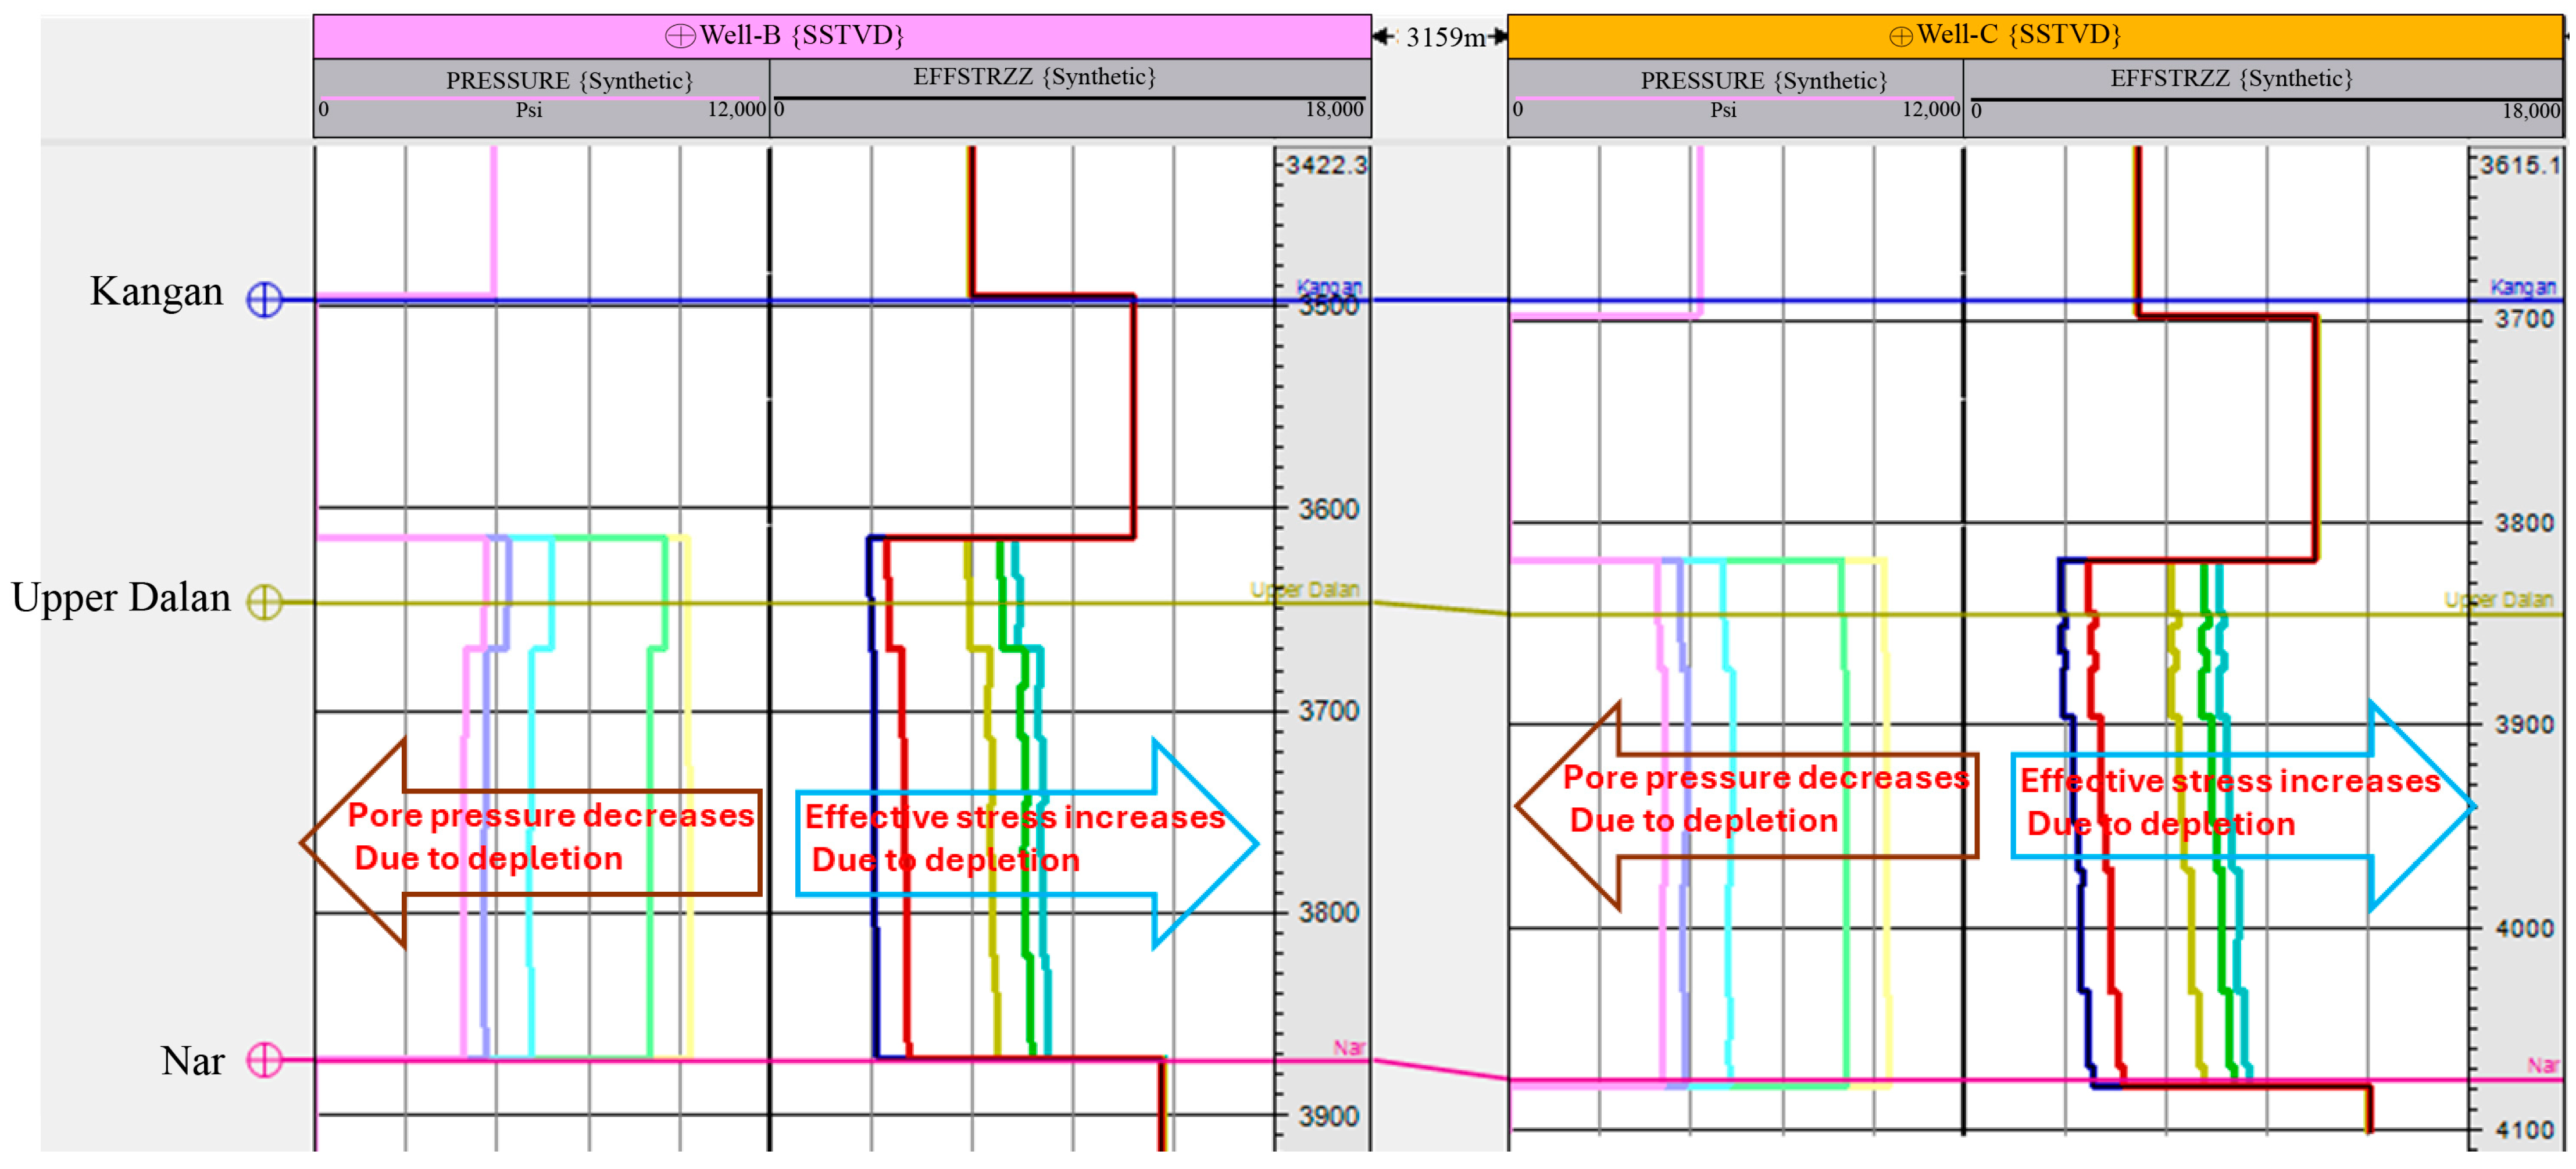
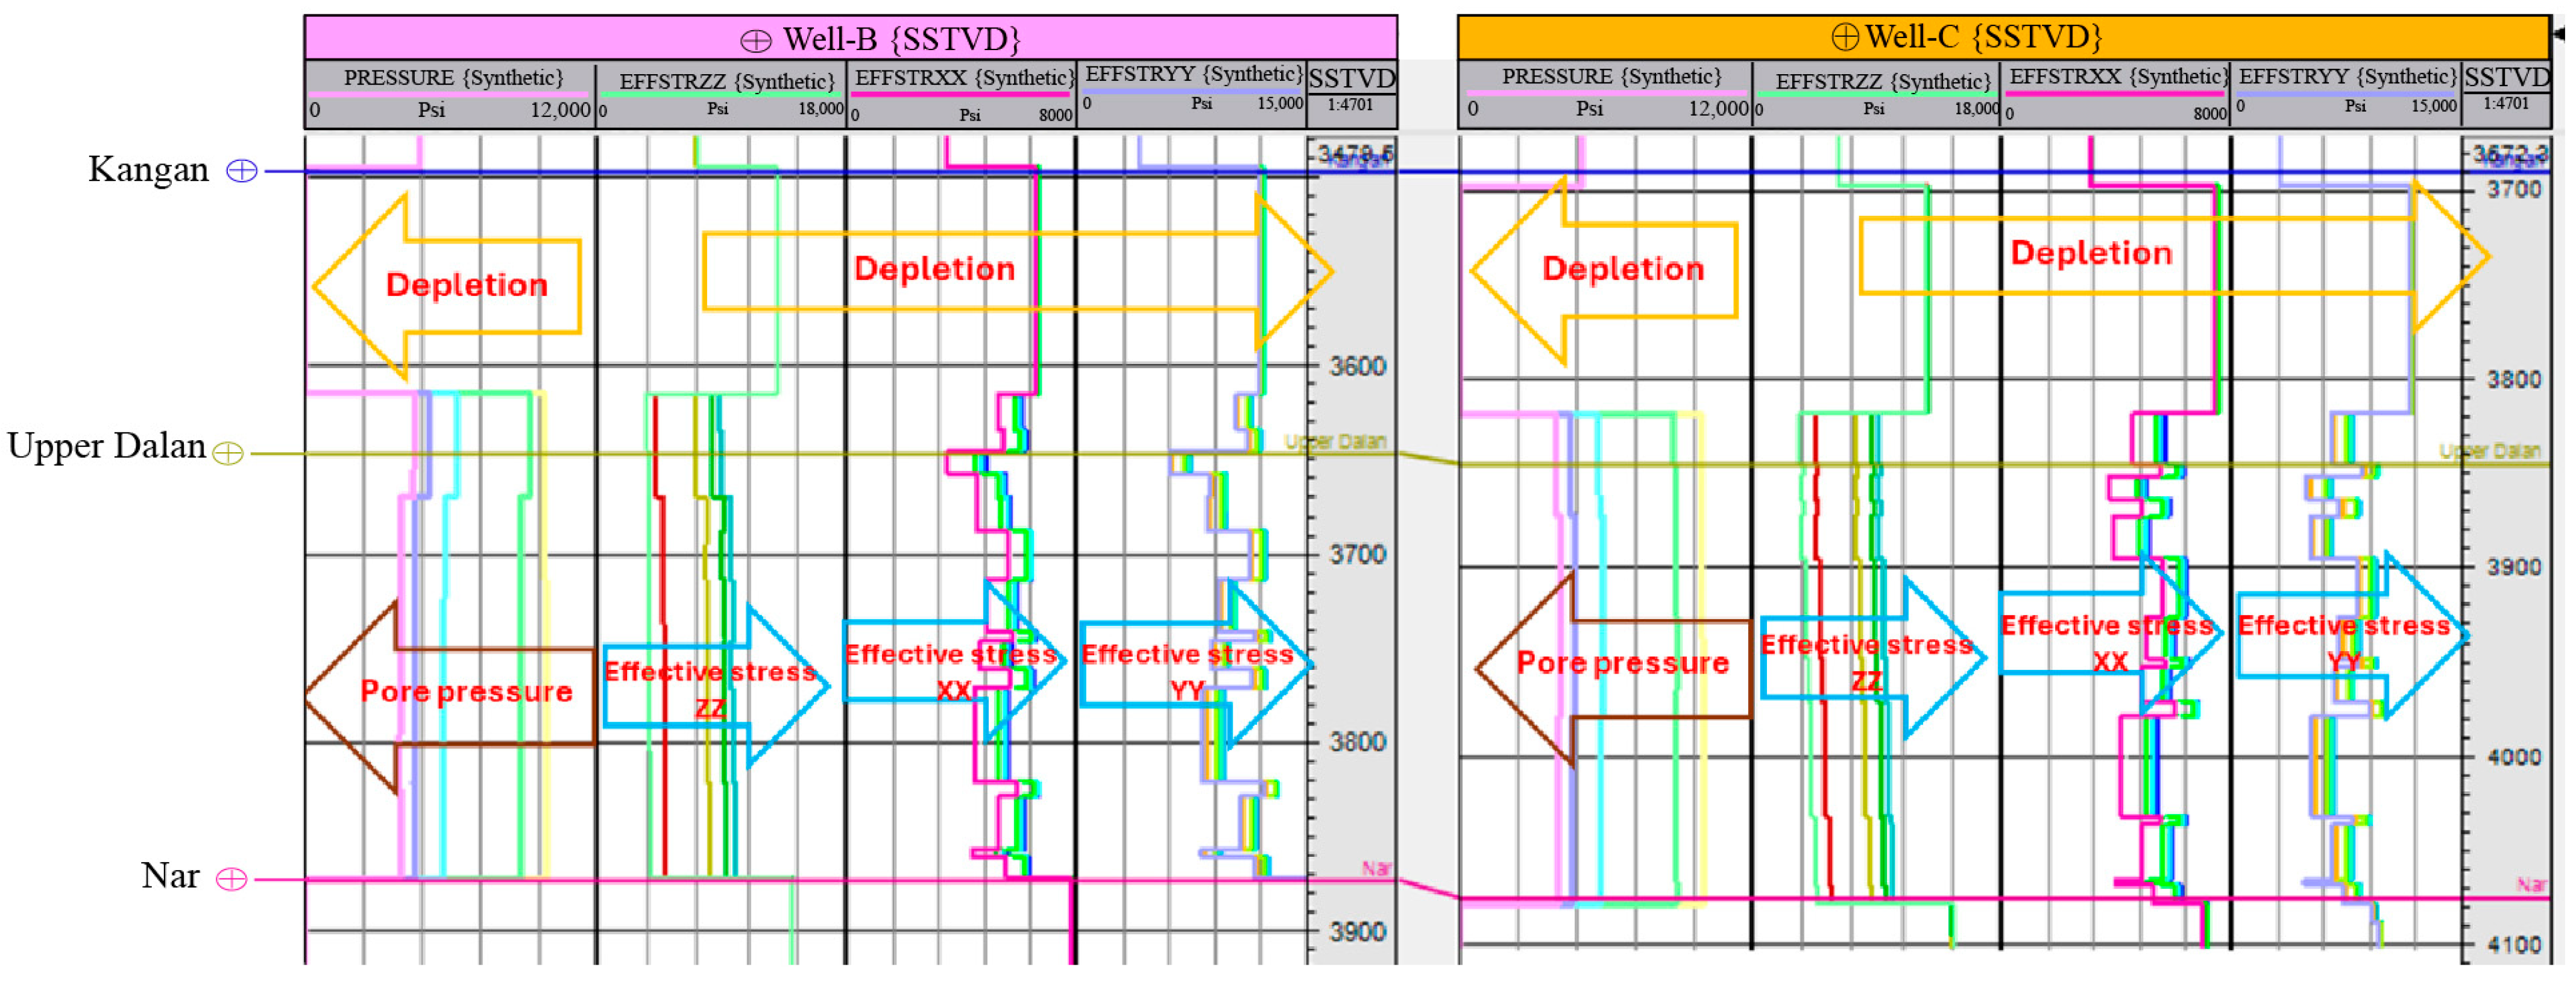
The simulation period covers 25 years, ending in December 2048, and involves a thorough analysis of the reservoir’s geomechanical behavior over time. To accurately assess the effects of reservoir depletion on surface subsidence, a stepwise approach was employed, wherein geomechanical and fluid flow models were iteratively coupled. This coupling allows for a more precise representation of the interplay between fluid extraction and the resulting geomechanical responses. The selected years for detailed geomechanical analysis—2024, 2030, 2035, 2040, and 2048—serve as key intervals, where significant changes in reservoir conditions are expected. At each of these intervals, the output from the reservoir simulation model, particularly pore-pressure data, is fed into the geomechanical model. This integration enables the generation of geomechanical outputs, such as stress and strain distributions, which are crucial for predicting subsidence and potential surface impacts. As hydrocarbon extraction progresses, the pore pressure within the reservoir declines (Figure 20). This reduction in pore pressure leads to an increase in effective stress within the rock matrix surrounding the reservoir (Figure 20). Essentially, as the supporting fluid pressure decreases, the burden of the overlying rock layers becomes more pronounced, resulting in higher effective stresses. The simulation results indicate a significant increase in effective stress in various directions: approximately 6000 psi in the ZZ direction (Figure 21, Track 2), 2000 psi in the YY direction (Figure 21, Track 4), and 1000 psi in the XX direction (Figure 21, Track 3), from 2024 to 2048. These changes in effective stress are indicative of the subsurface compaction that occurs during depletion, contributing to surface subsidence and potentially affecting the structural integrity of the overburden.
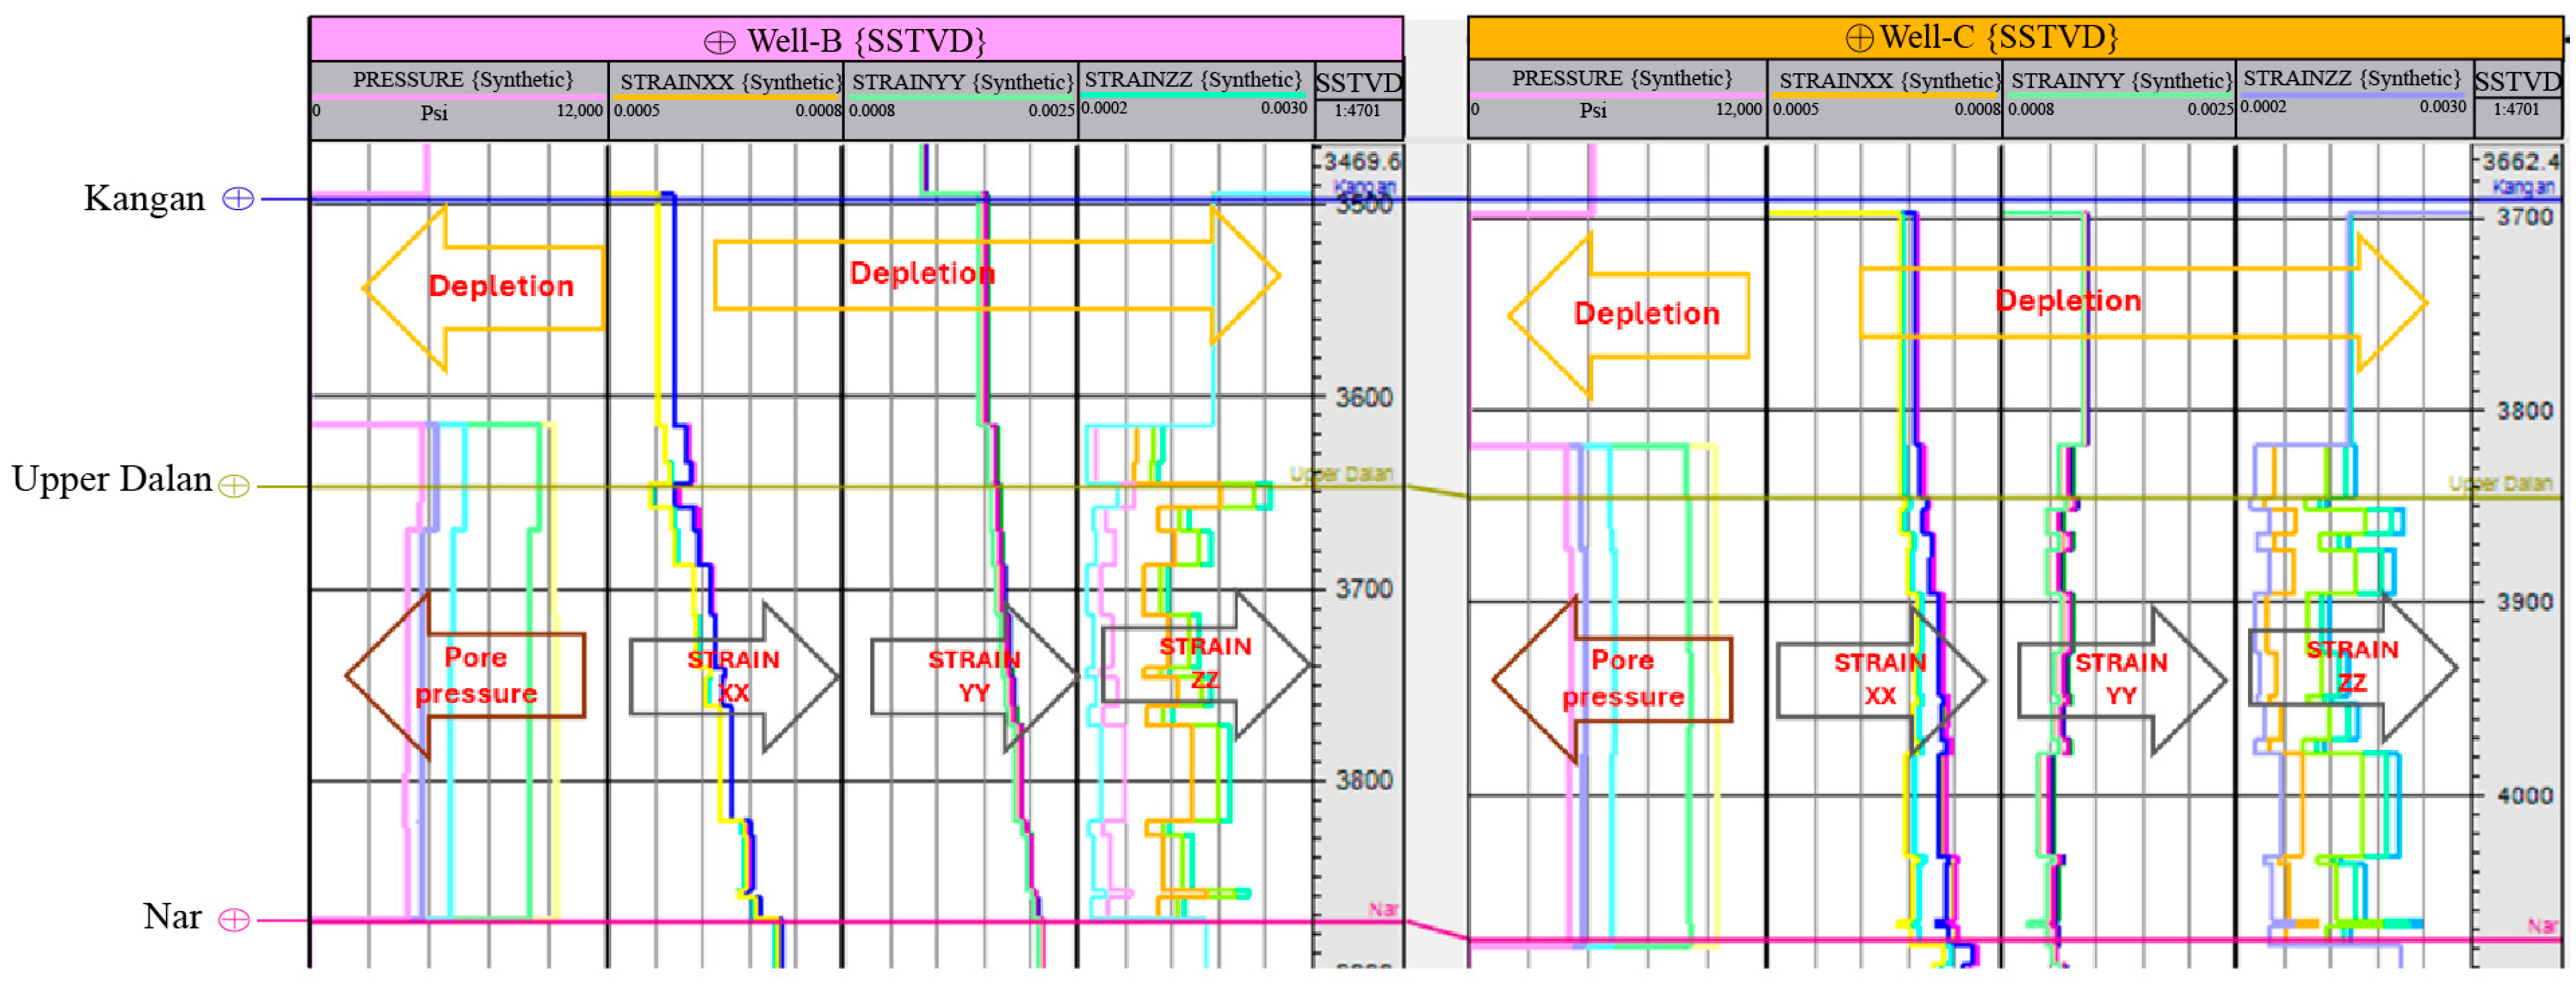
As fluids are extracted from the reservoir, the associated pore pressure within the reservoir declines. This reduction in pore pressure is a key factor contributing to the increase in strain observed within the reservoir rock. Strain, in this context, refers to the deformation or distortion of the rock matrix as it adjusts to the changing stress conditions brought about by fluid extraction. The simulation results highlight a significant increase in strain in various directions over the 25-year production period. Specifically, the strain in the ZZ direction, which corresponds to the vertical axis, shows a marked increase from 0.0003 to 0.0025 between 2024 and 2048 (Figure 22, Track 4). This substantial rise in vertical strain suggests considerable compaction within the reservoir as the rock layers compress due to the decreasing pore pressure. Similarly, the strain in the XX direction, representing the horizontal axis, increases from 0.0006 to 0.0008 during the same period (Figure 22, Track 2). Although the change in horizontal strain is less pronounced than in the vertical direction, it still indicates significant deformation within the reservoir rock. The YY direction, another horizontal axis, shows an increase in strain from 0.001 to 0.0022 (Figure 22, Track 3), further illustrating the multi-directional nature of the deformation occurring within the reservoir. These increases in strain reflect the reservoir’s response to the altered stress conditions induced by fluid extraction. As the rock compacts and deforms, it may influence subsidence at the surface and affect the mechanical stability of the surrounding formations. Understanding these strain developments is crucial for predicting potential geomechanical risks associated with long-term reservoir depletion.
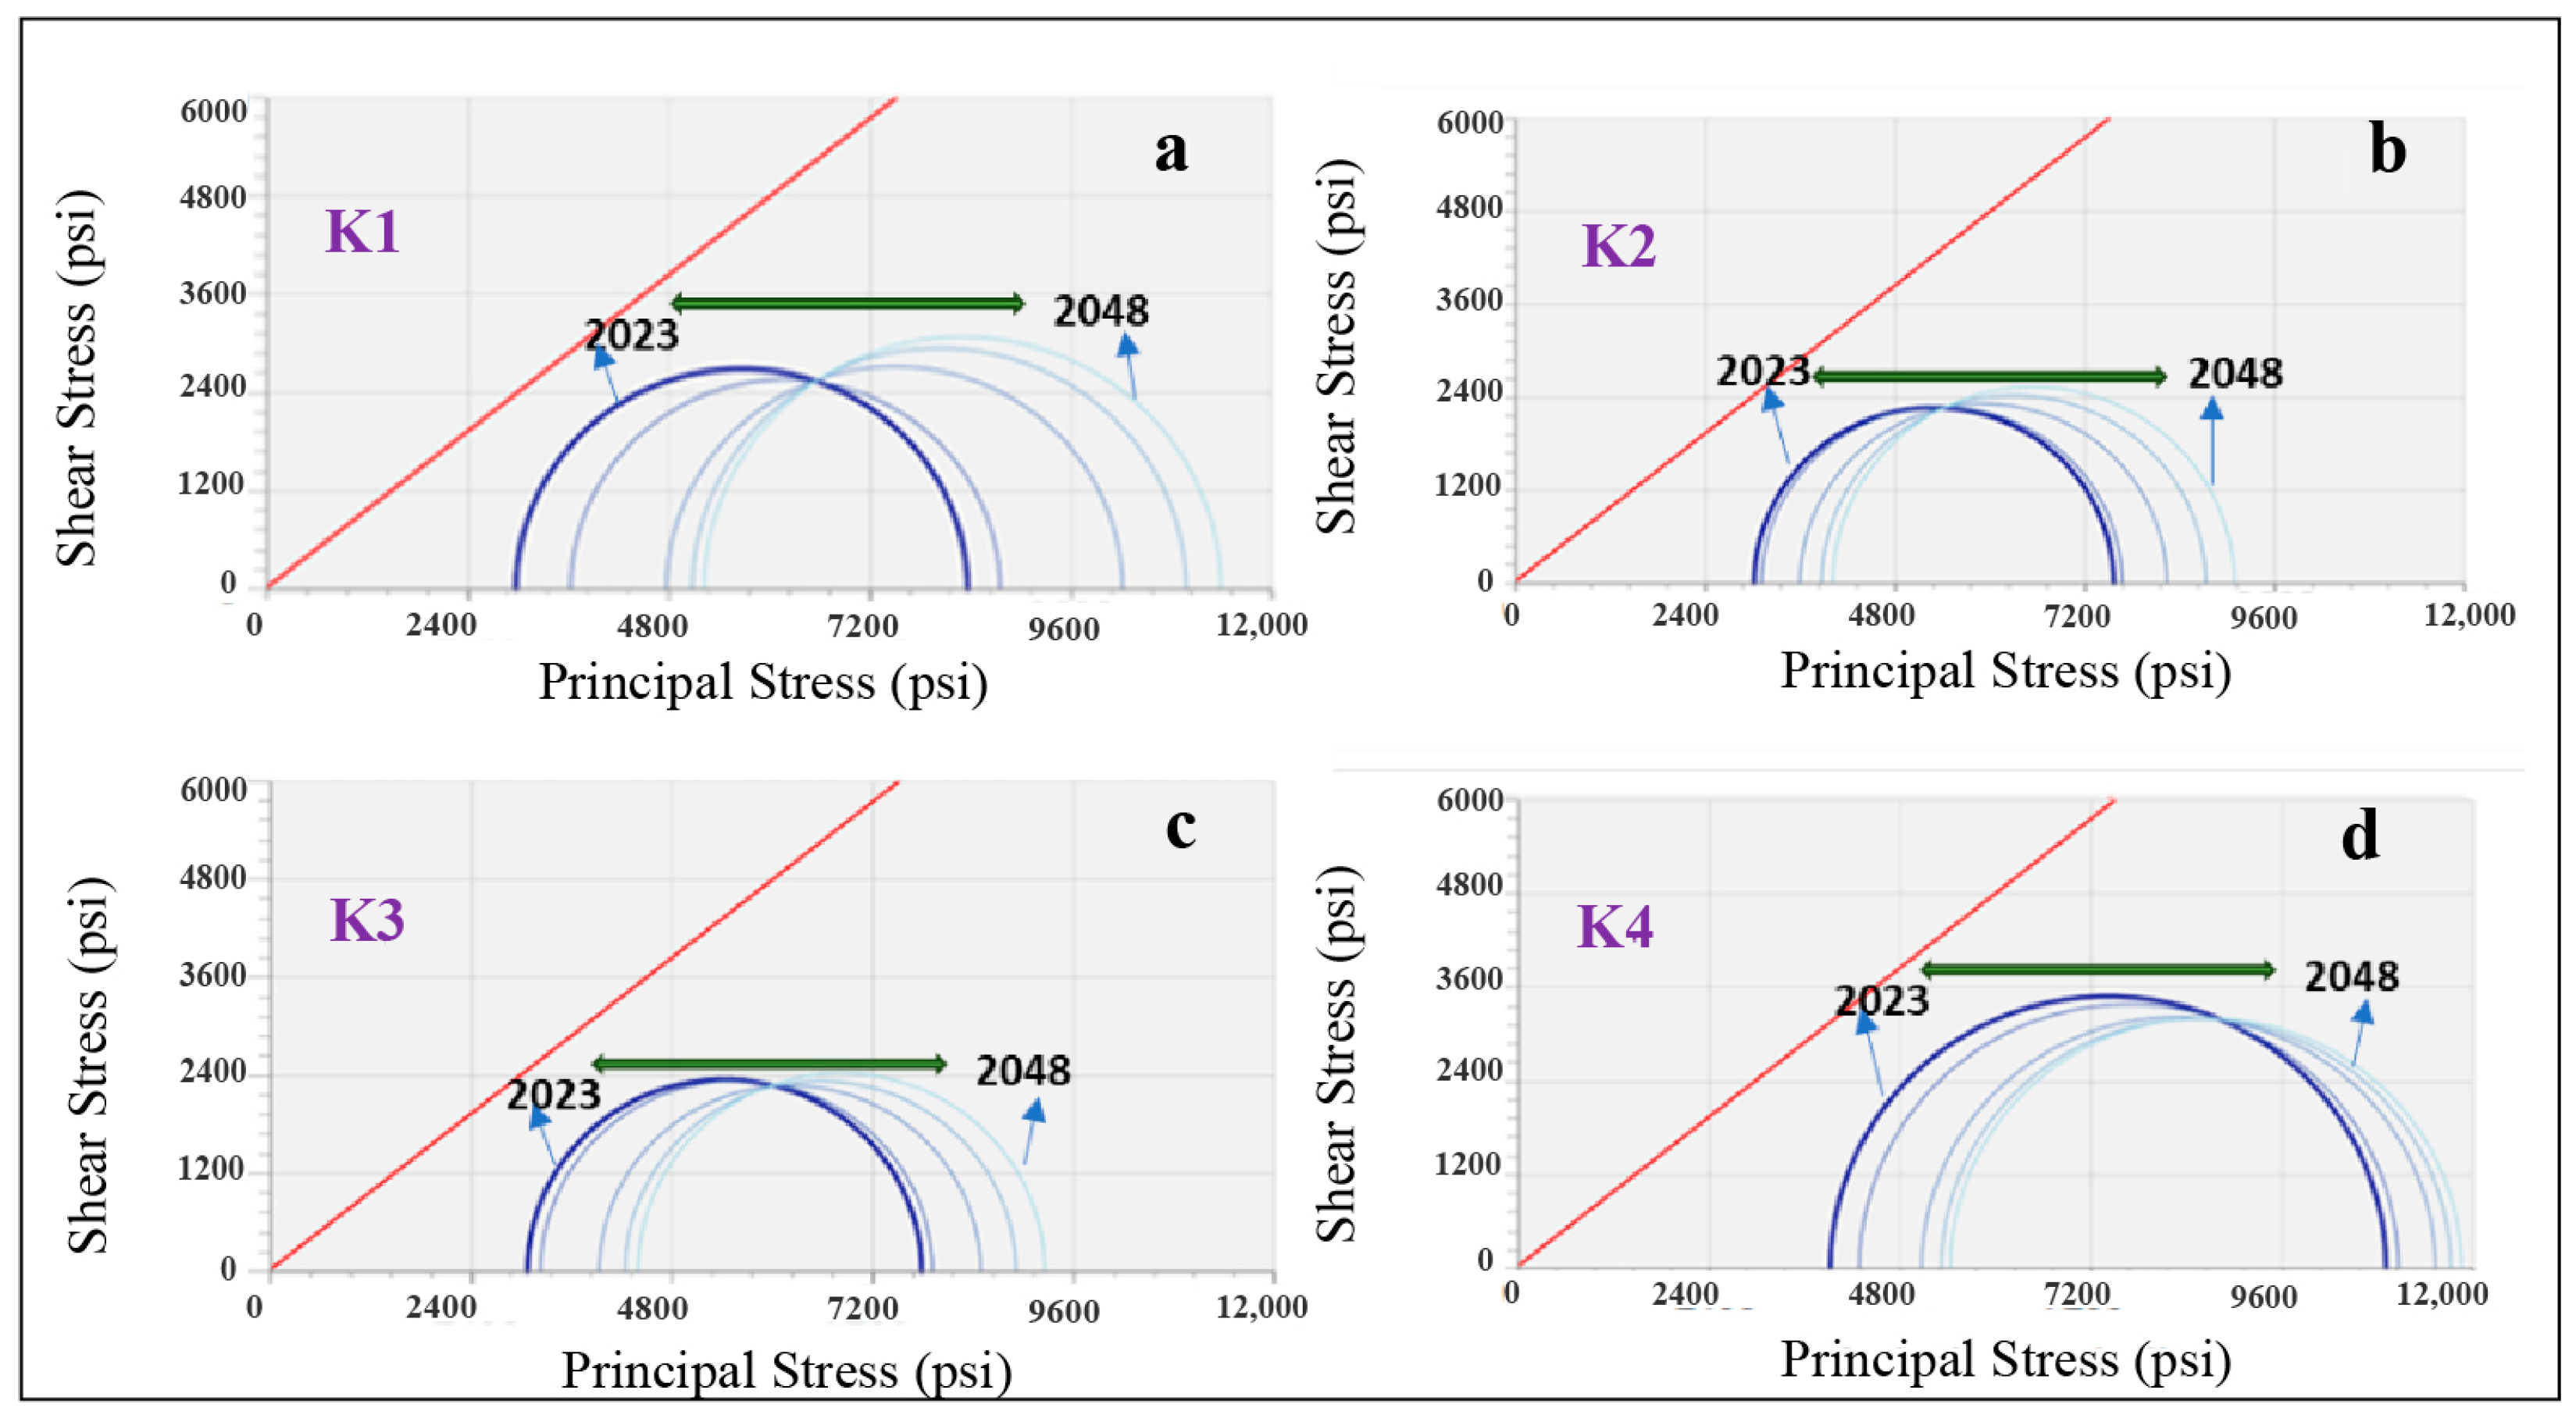
As hydrocarbons are extracted from the reservoir, pore pressure decreases. According to the Mohr–Coulomb criterion, the decrease in pore pressure leads to an increase in the effective stress acting on the rock. Effective stress is the difference between the total stress and the pore pressure. A decrease in pore pressure reduces the normal stress acting on potential failure planes within the rock. This reduction in normal stress can lower the threshold for failure, allowing the principal stresses to increase as the rock becomes less constrained. The increase in effective stress triggered reservoir compaction, causing the rock matrix to compact and decrease in volume. This compaction may lead to an increase in the principal stresses due to the redistribution of stresses within the reservoir (Figure 23).
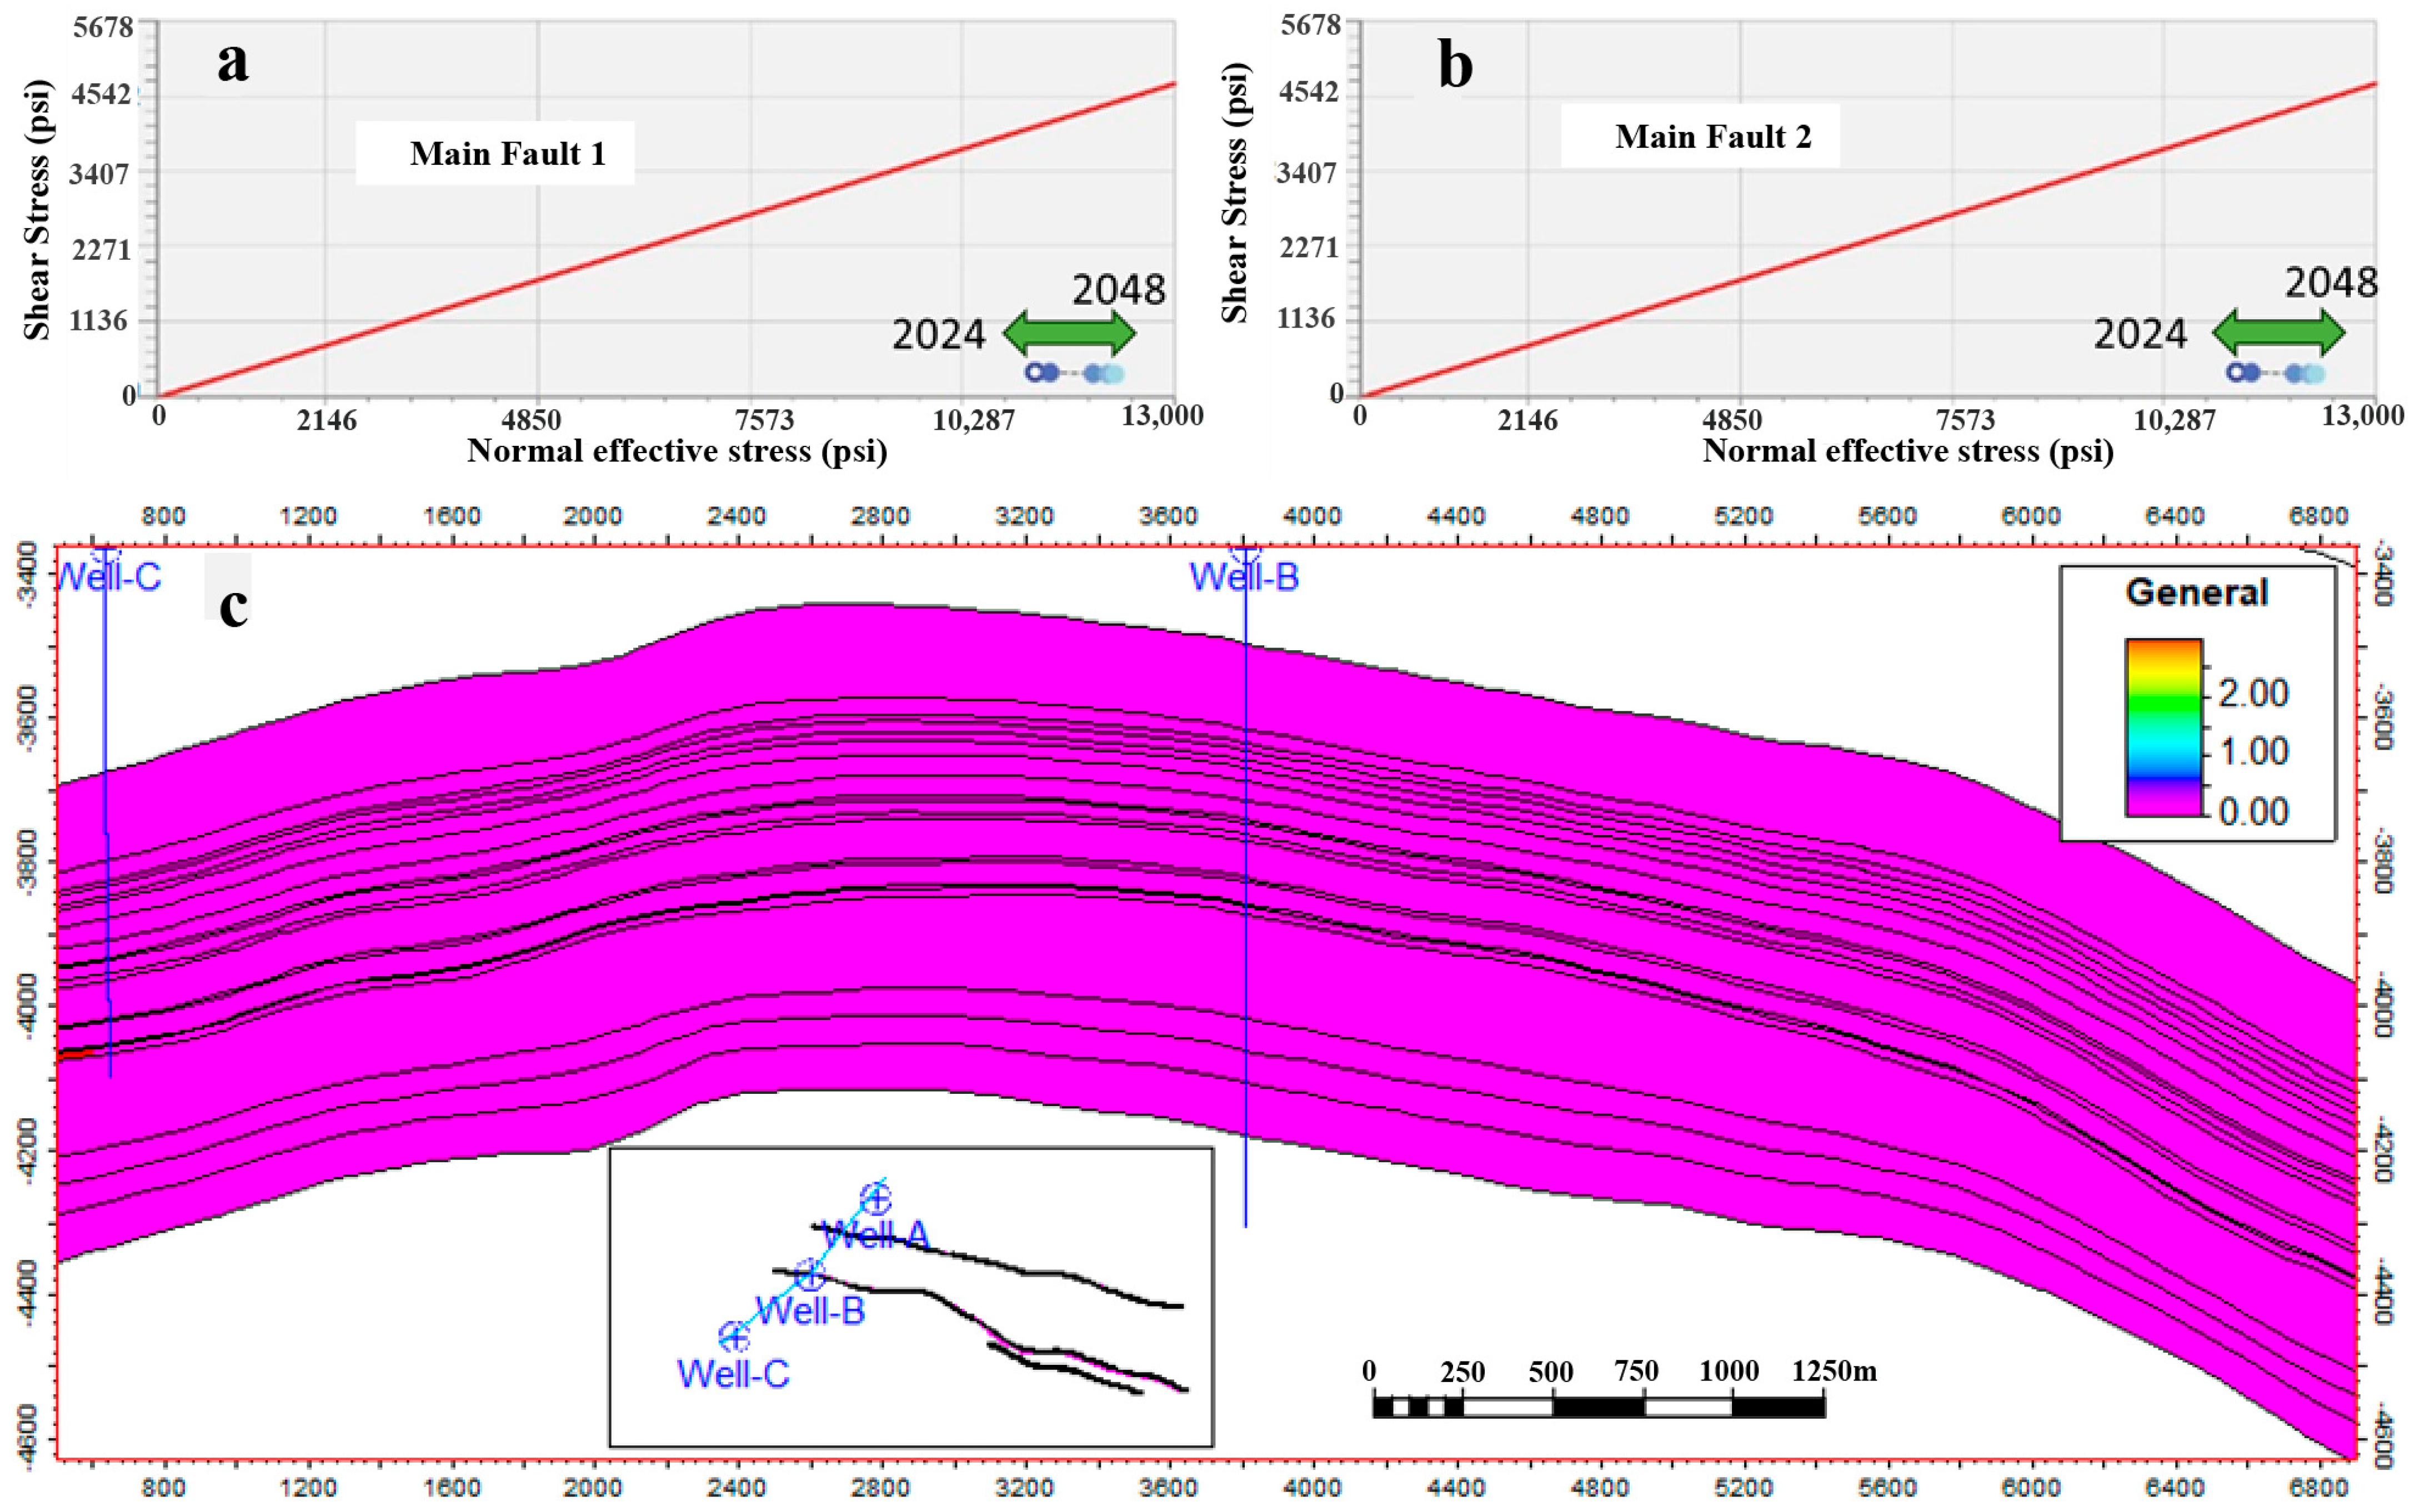
As fluid is extracted from the reservoir, the pore pressure within the rock formation decreases. This reduction in pore pressure can alter the stress distribution in the surrounding rock mass. In some cases, the reduction in pore pressure can lead to a decrease in the effective stress acting on pre-existing faults. If the decrease in effective stress is significant enough to overcome the frictional resistance holding the fault in place, it can result information damage or fault reactivation. The magnitude of the area enclosed by the blue semi-circle in Figure 21 tends to grow as pore pressure decreases, causing it to eventually breach the failure envelope and thereby signifying the possibility of formation failure conditions, including the reactivation of faults. However, as shown in Figure 24, there was no possibility of any failure occurring throughout the Kangan–Dalan Formations during the reservoir depletion. This is because there was no sign of breaching the failure envelope at various timesteps and cell locations. Furthermore, the yield modes reached in each part of the simulated reservoir volume are color-coded, as displayed in the legend of Figure 24. The color codes used are YIELDMOD values in the 2048 timestep, where code 0 (pink), code 1 (blue), code 2 (green), and code 3 (red) indicate no failure, tension, shear, and the cap failure of the rock, respectively. Each simulation case evaluated displayed no failure in the Kangan–Dalam Formation layers located in the simulated area.
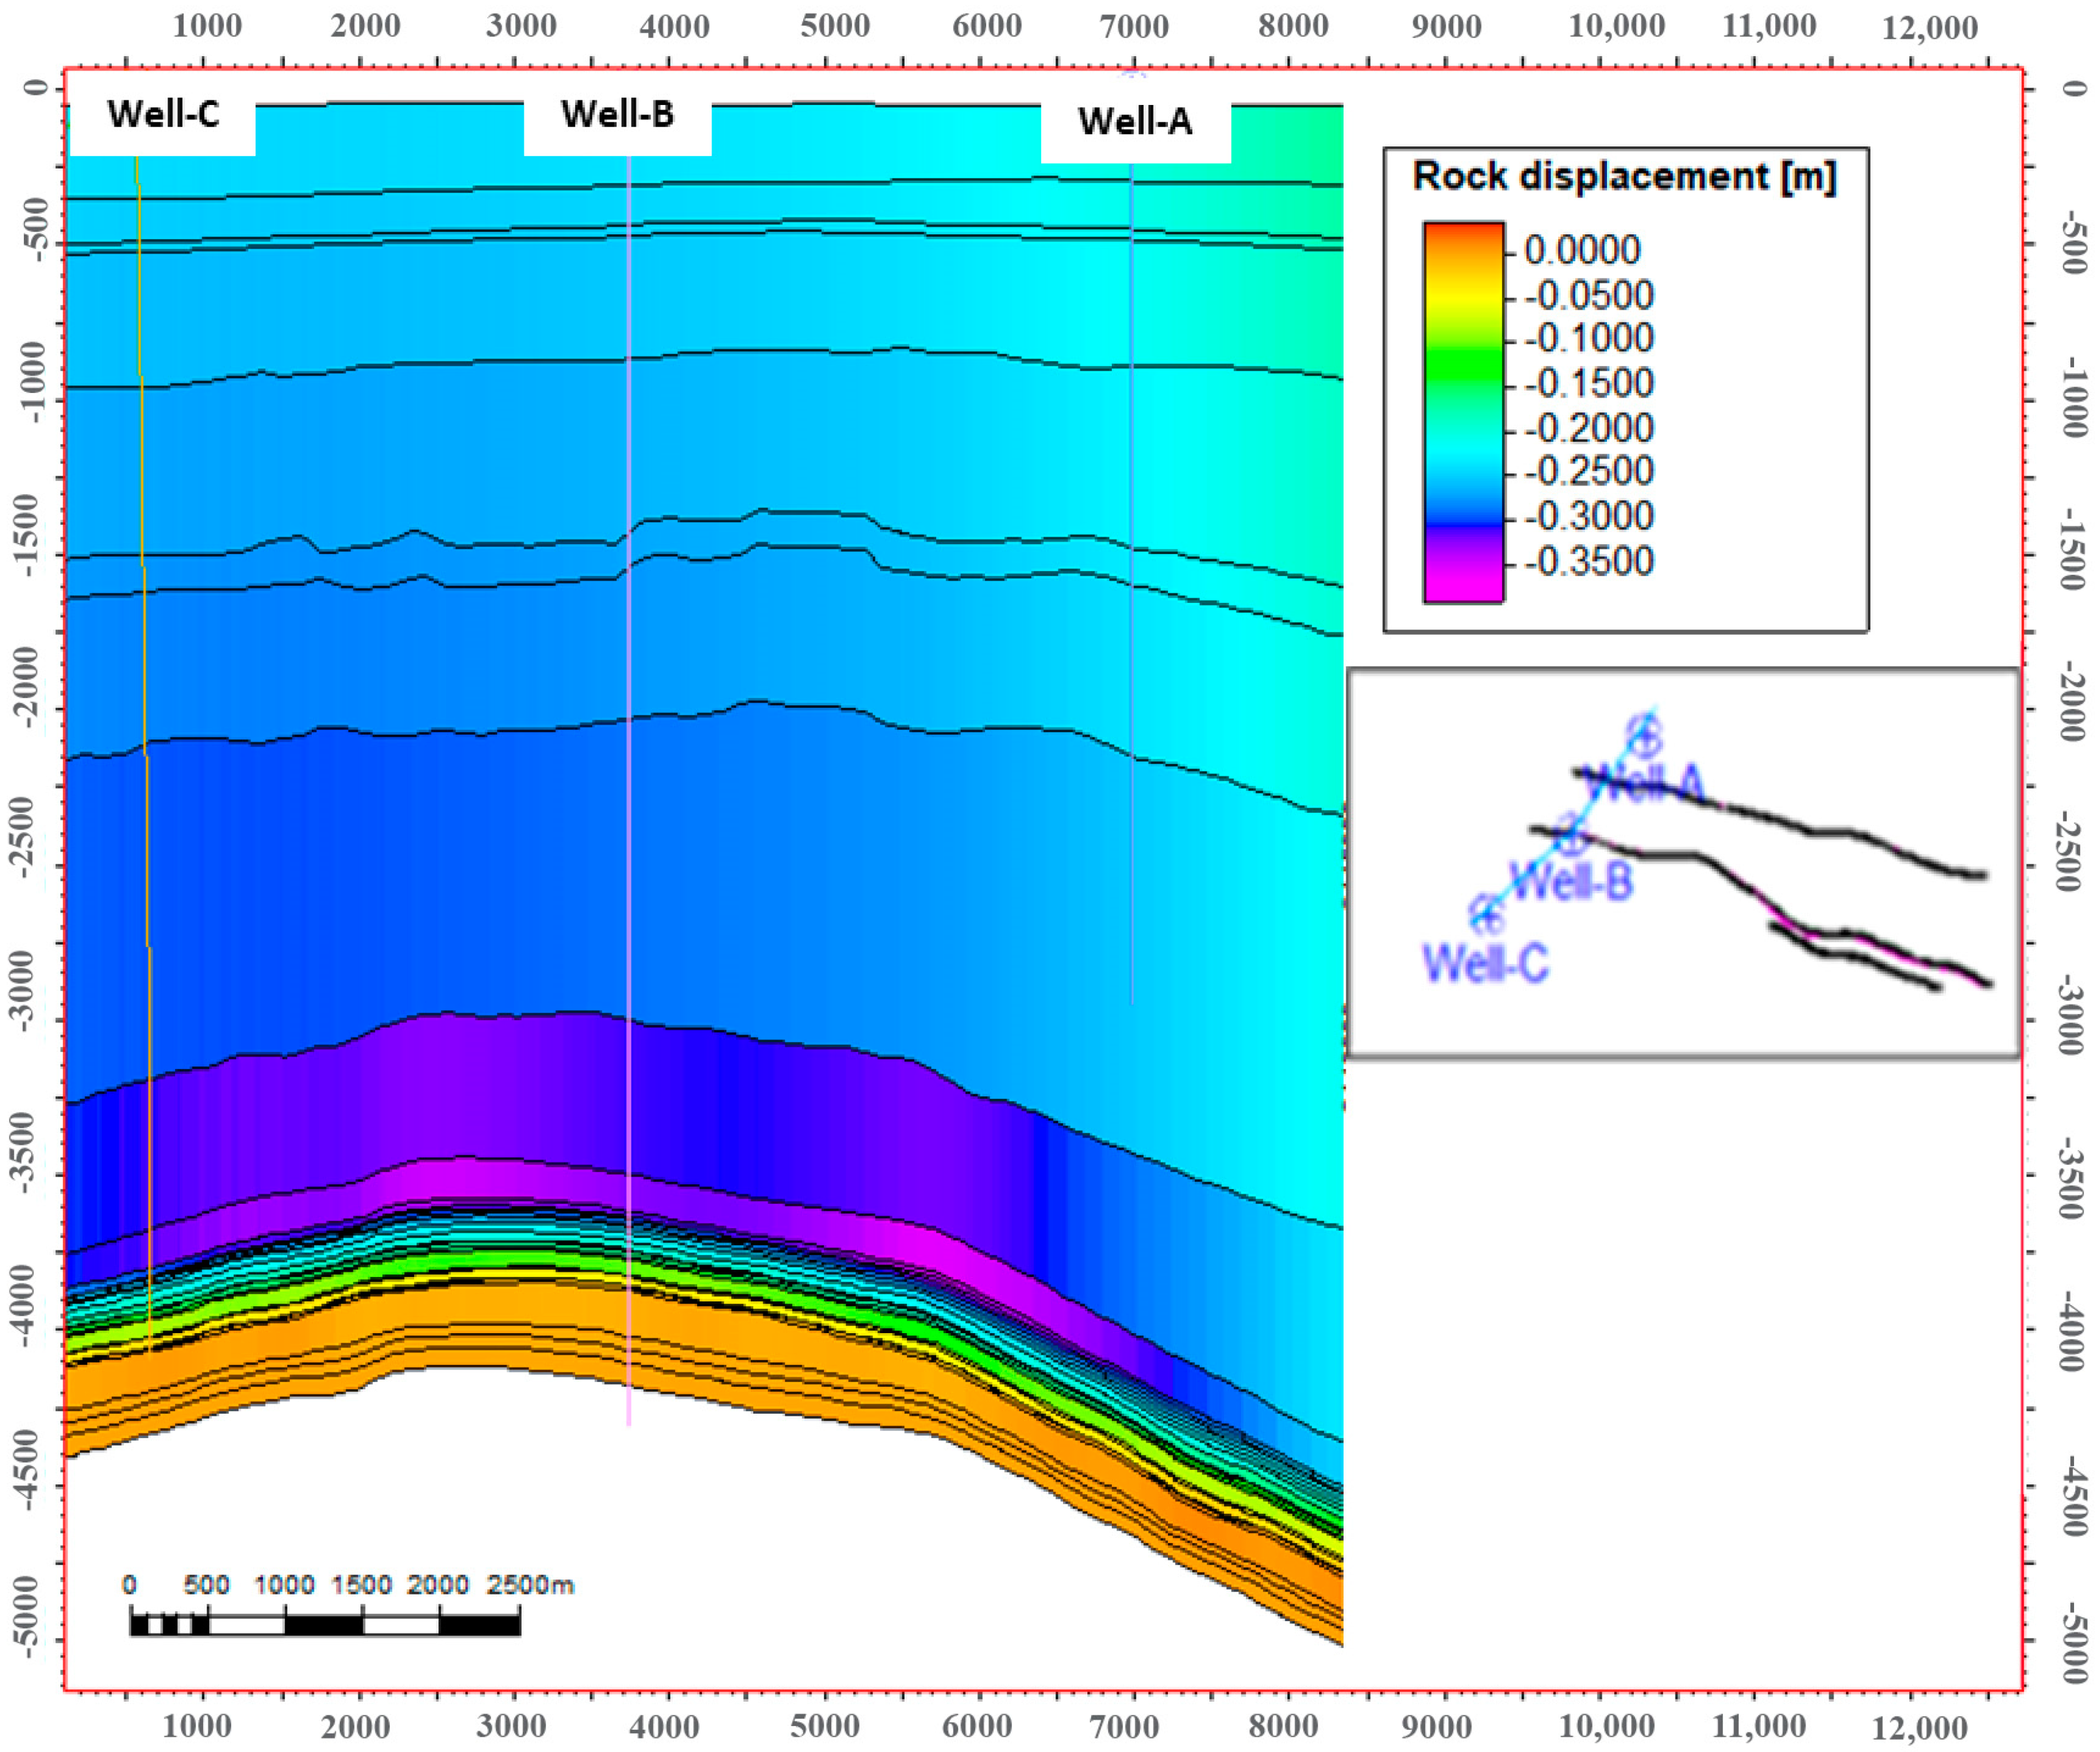
The compaction experienced in the reservoir impacts not just the reservoir rock itself but also the overlying and underlying formations. As the reservoir undergoes compaction and reduces in volume, it exerts a downward force on the overlying formation while simultaneously lifting the underlying formation upwards. This is easily seen in the result of the finite-element model, as shown in Figure 25, which shows a cross-section through the model with vertical displacement through 2048. Orange is zero displacement, green (overburden) is about 15 cm (downward), and purple is about 35 cm subsidence. At the top of the reservoir formation, there is a maximum downward displacement of 35 cm.

4.8. Comparing with Related Studies

Ranjbar et al. (2017) [31] conducted three-dimensional finite-element mechanical simulations to examine the evolution of subsurface stress and displacement fields within the reservoir and overburden. Their study highlighted how local production and injection patterns influence the spatial and temporal variations of these fields. The geomechanical simulations focused on the Fahlian reservoir formation in an oil field located in southwestern Iran. The magnitude and direction of the stress field were calculated using available data, including geological, geomechanical, geophysical, and reservoir engineering information. According to the model, the maximum vertical and horizontal stresses were determined to be 110 MPa and 94 MPa, respectively. The iteratively coupled fluid flow–geomechanics model showed that ground subsidence in the study area is minimal, with a maximum value of 29 mm. This limited subsidence is attributed to the gas injection scenario alongside oil production, as gas injection can help mitigate reservoir compaction and surface subsidence.
Mahajan et al. (2018) [32] evaluated the subsidence of the Fahud West oil field in the Sultanate of Oman. The Fahud West structure spans approximately 10 km in length and 2 km in width. The primary bounding normal fault trends E–W to WNW–ESE and has a sigmoidal shape (Figure 3). The field is also intersected by several smaller normal faults, which are nearly parallel to the main boundary fault. The Natih formation shows a general northward dip of about 3–10 degrees, which becomes gentler as it extends away from the boundary fault. The main reservoir units in the Fahud West field belong to the Natih carbonate sequence, comprising three primary Natih formation reservoirs. The predicted maximum surface subsidence in the Fahud West field is less than 23 cm at a depleted reservoir pressure of 10 bars—a level of subsidence that poses minimal risk to the integrity of wells and facilities.
Moorthy et al. (2022) [71] evaluated reservoir compaction and surface subsidence to optimize field development planning in the Offshore Malay Basin, Malaysia. The assessed structure has a closure area ranging from 16 km2 at shallower levels to 10 km2 at deeper levels, with no significant faults present, indicating structural continuity across all reservoirs. The field comprises 27 stacked hydrocarbon-bearing intervals at depths between 1500 m and 2700 m TVDSS. Compaction and surface subsidence for each of the 27 reservoirs were calculated over the field’s entire lifespan, using data from reservoir geometries, rock mechanical properties, and reservoir pressure forecasts. Due to the lack of core data, multiple uncertainty scenarios were considered to account for a range of possible outcomes. The P10, P50, and P90 results indicated that cumulative reservoir compaction could vary between approximately 57 cm and 75 cm. These findings can be used in the future to assess the severity of pore collapse and its impact on reservoir productivity over time. The results shows that the surface subsidence could vary from approximately 35 to 25 cm.
Based on the aforementioned studies and Table 7, our findings regarding the predicted subsidence magnitude also fall within the expected range. Table 7 provides a summary of similar studies estimating reservoir subsidence during depletion.

4.9. Analysis and Evaluation of CO2 Storage in a Depleted Reservoir

The simulation results over the 25-year period (2024 to 2048) offer valuable insights into the geomechanical behavior of a depleted reservoir used for CO2 storage. The findings provide critical information about the reservoir’s ability to securely store CO2 and the associated risks of subsidence and structural integrity.
The depletion of the reservoir leads to a significant increase in effective stresses in all directions (ZZ, YY, and XX), with the most substantial rise observed in the vertical (ZZ) direction. This indicates that as pore pressure decreases due to fluid extraction, the rock matrix increasingly supports the overburden weight, resulting in higher effective stress. The corresponding strain analysis reveals substantial compaction in the reservoir, particularly in the vertical direction, which suggests a high potential for subsidence. The increase in strain in the horizontal directions (XX and YY), although less pronounced than in the vertical direction, indicates anisotropic deformation. This behavior could affect the overall stability of the reservoir and the overburden, potentially leading to differential subsidence, which may impact surface infrastructure. The increase in effective stress and associated compaction raises important considerations for CO2 storage. The enhanced effective stress could lead to a reduction in pore space, thereby affecting the reservoir’s capacity to store CO2. However, the modeling results indicate no shear failure or fault reactivation within the Kangan–Dalan Formations, suggesting that the reservoir’s structural integrity remains intact under the simulated conditions. This is a crucial finding, as it implies that the reservoir can securely contain injected CO2 without significant risks of leakage due to fault movement or other geomechanical failures.
The absence of fault reactivation or significant formation damage enhances the confidence in the long-term security of CO2 storage in the depleted reservoir. However, the potential for surface subsidence, particularly as the reservoir compacts, must be carefully managed. This is especially important if the storage site is near populated areas or critical infrastructure, where subsidence could pose risks. Furthermore, the increase in vertical strain suggests that the continuous monitoring of surface displacement and subsurface stresses is necessary to ensure the reservoir’s stability over time. The ability to predict and mitigate these geomechanical effects will be essential for the safe and effective storage of CO2.
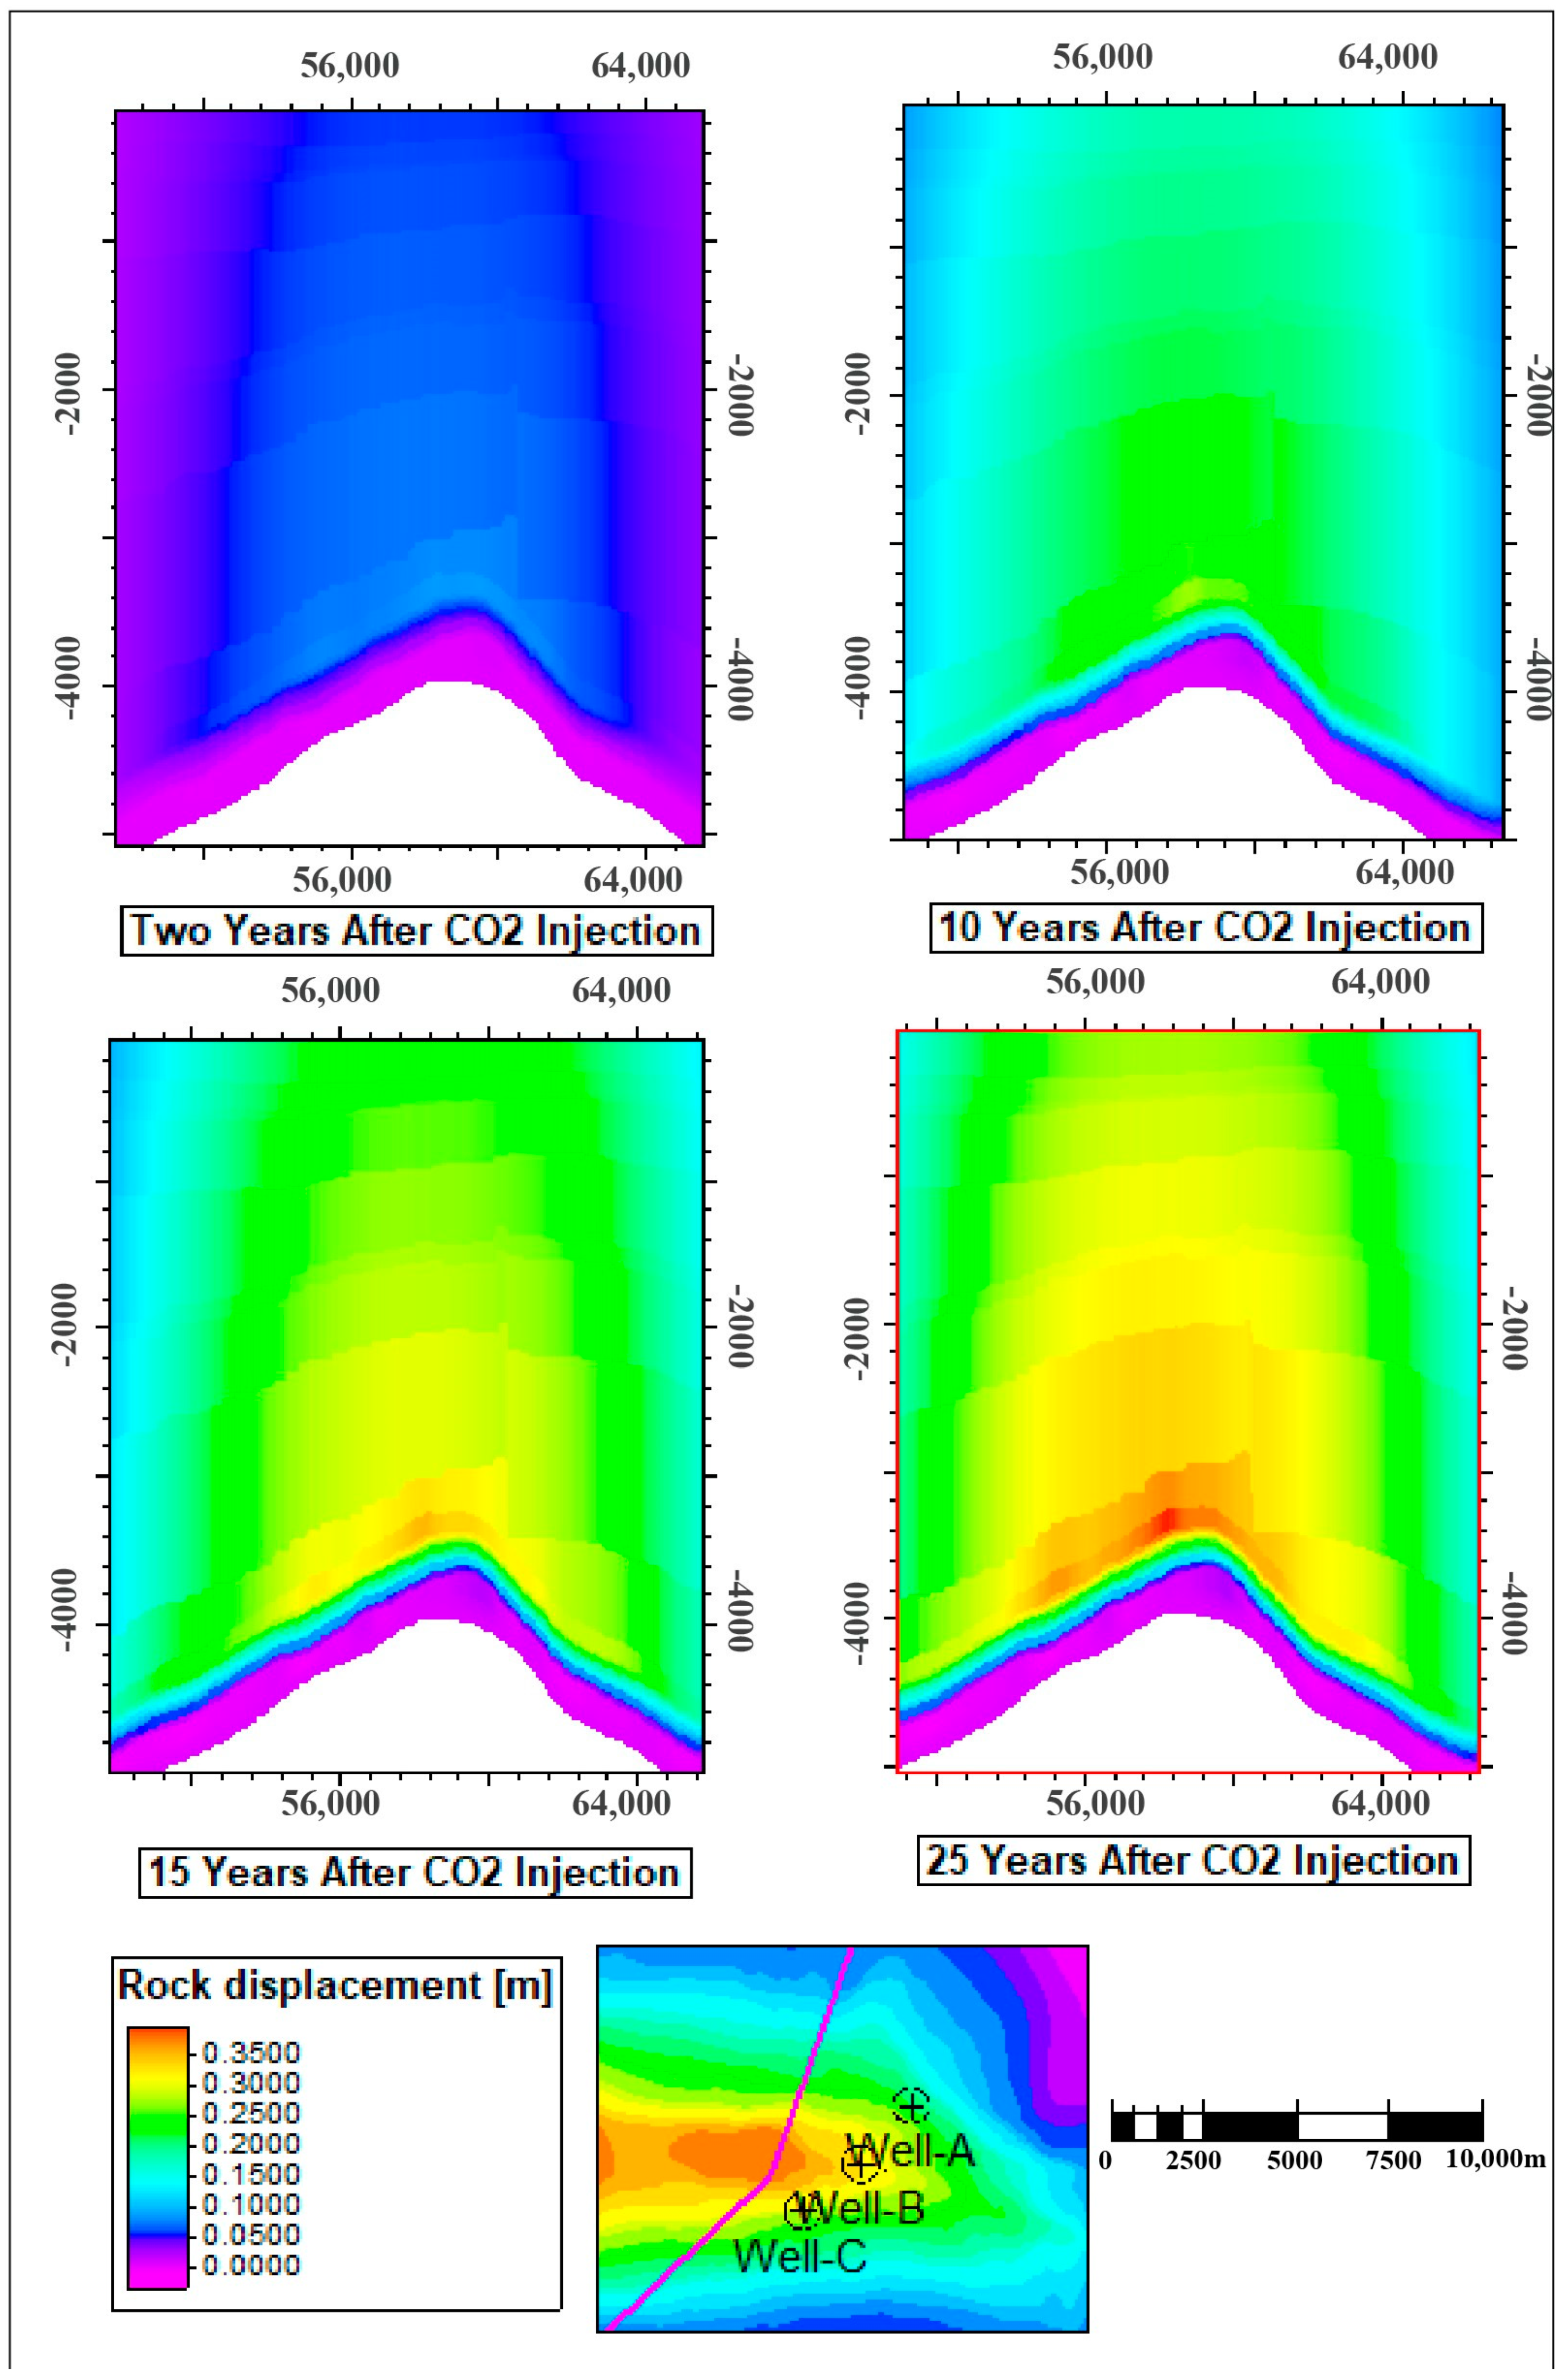
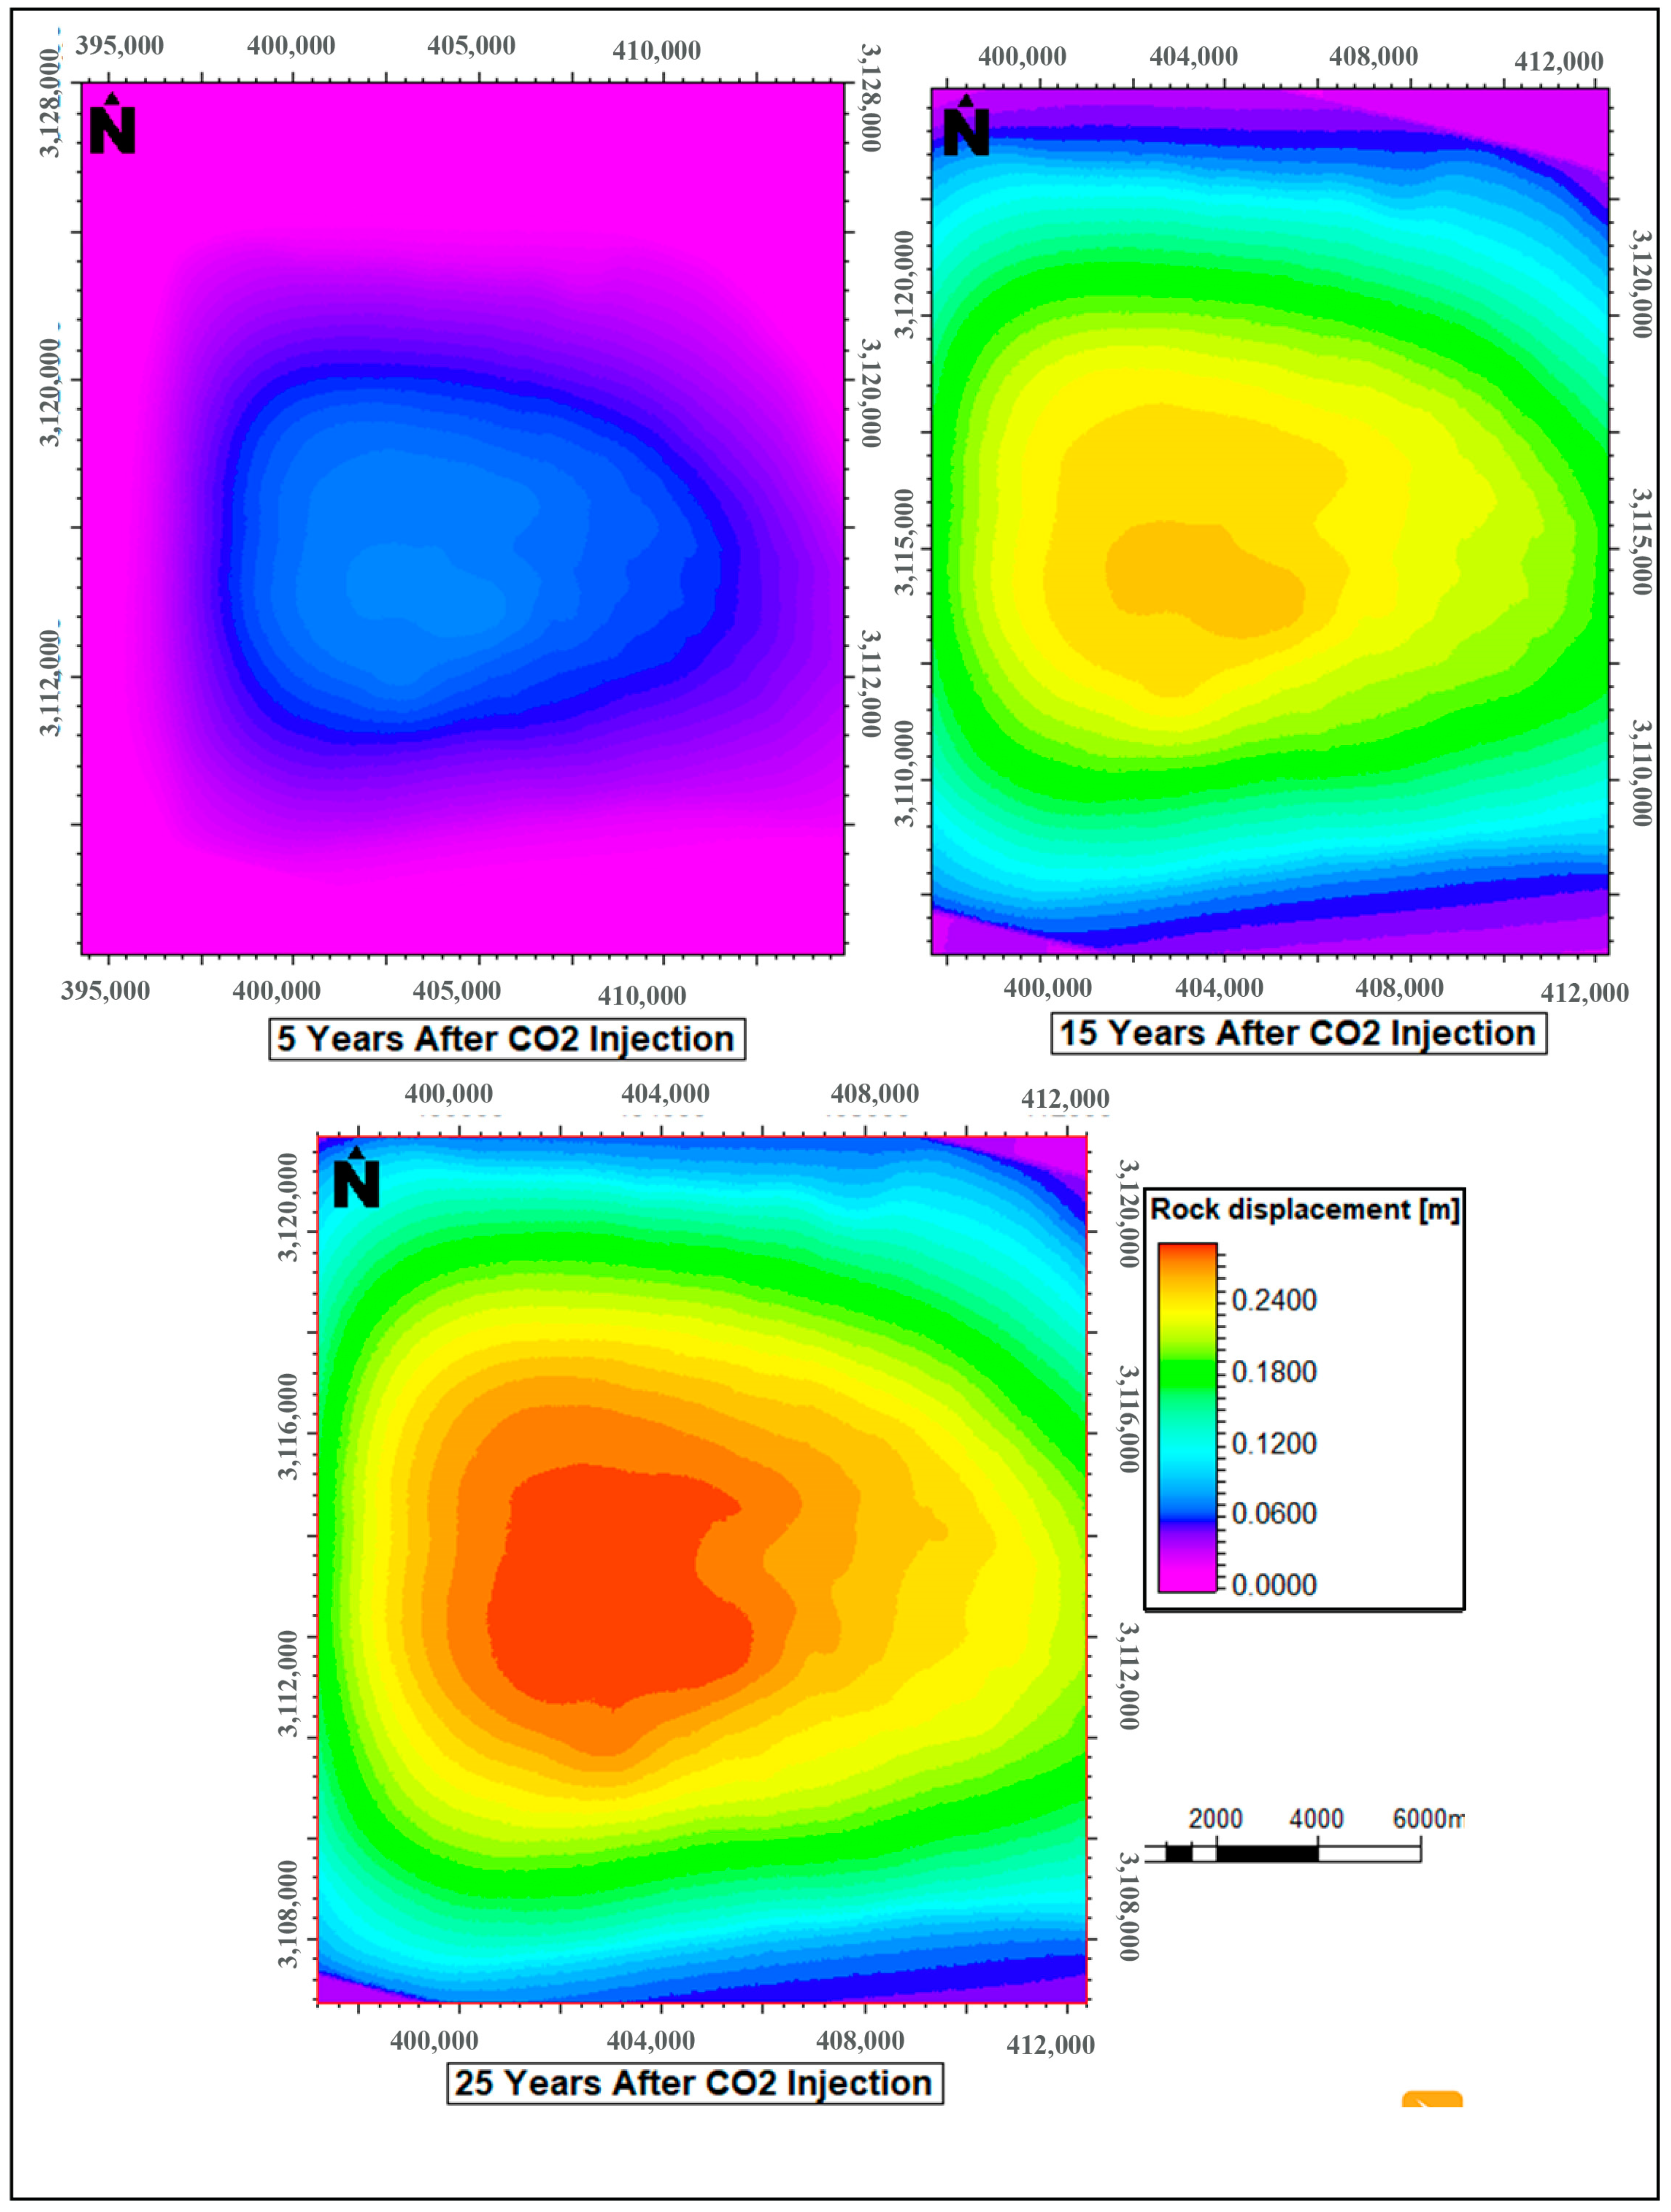
Figure 26 and Figure 27 illustrate the reservoir uplift magnitude over a 25-year period following CO2 injection. As CO2 is injected, the reservoir experiences a gradual increase in pressure, leading to a noticeable uplift of the overlying strata. Figure 26 and Figure 27 highlight that the uplift is most pronounced near the injection sites, where pressure changes are the greatest, and diminishes with distance from the reservoir center. This uplift is a positive indicator of CO2 storage, as it suggests that the injected CO2 is effectively increasing pore pressure and restoring some of the lost volume due to prior depletion, potentially mitigating subsidence risks.
Based on the results of the 25-year geomechanical analysis, CO2 storage in a depleted reservoir can significantly mitigate geohazards associated with reservoir depletion, such as subsidence and stress alterations. The analysis reveals that, as hydrocarbons are extracted, the effective stresses within the reservoir increase, leading to substantial compaction and potential surface subsidence. Specifically, the effective stress in the ZZ direction increases by approximately 6000 psi, in the YY direction it increases by 2000 psi, and in the XX direction it increases by 1000 psi during production from 2024 to 2048. These changes indicate that the weight of the overlying rock becomes more significant as pore pressure decreases. However, CO2 storage can counteract these adverse effects. By injecting CO2 into the depleted reservoir, the pore pressure is maintained or even increased, which helps to reduce the compaction and associated subsidence. The CO2 injection also contributes to the redistribution of stresses within the reservoir, which can mitigate the risk of fault reactivation or induced seismicity. The stability observed in the reservoir, with no shear failure or significant fault reactivation, further supports the notion that CO2 injection plays a crucial role in preserving the long-term mechanical stability of the reservoir. Thus, CO2 storage not only stabilizes the reservoir but also enhances its safety and integrity over time, making it a viable method for managing the geohazards associated with reservoir depletion.

5. Conclusions

A workflow is outlined that employs 1D mechanical earth models (1D MEMs) to estimate static elastic properties and pore pressures utilizing data from well logs. This approach offers an initial estimation of stress distribution and subsidence magnitude as a function of depth.
  • The results from the 1D modeling are then utilized to populate a 3D geomechanical model (3D MEM) with elastic properties. This process involves employing the kriging interpolation method, which is weighted by seismic inversion results.
  • Subsequently, the geomechanical model is integrated with a dynamic hydraulic model to ascertain the pore-pressure field within the reservoir for specific time increments. This integration enables the simulation of total and effective stresses, as well as related deformation within and outside the reservoir, including surface displacement.
  • The workflow was effectively applied to a gas reservoir case study situated in the southwest of Iran. Modeling outcomes were meticulously calibrated against diverse observational datasets. The validated 3D geomechanical model furnishes comprehensive stress-state information at any location within the model domain. These data can be beneficial, for instance, in devising future well trajectories.
  • The total stresses increase while depilation and effective stresses decrease while depilating in all directions, especially in the Z direction.
  • The predicted compaction in the reservoir and overburden was 0.35 m.
  • Most of the compaction was observed above the reservoir, and its magnitude decreased approaching the seabed.
  • The case evaluated displayed no failure, including formation damage or fault reactivation in the Kangan–Dalam Formation layers located in the simulated area.
  • Additionally, the modeling results offer insights into surface ground movement during periods of depletion and replenishment. The workflow delineated and assessed in this study is not constrained to a specific site but is broadly applicable to gas storage in porous media, encompassing methane, CO2, and hydrogen.
  • The results of this study demonstrate that CO2 injection into a depleted reservoir can effectively mitigate the geohazards associated with depletion, such as surface subsidence and stress alterations. By maintaining or increasing pore pressure through CO2 storage, the compaction and subsidence typically observed during reservoir depletion are significantly reduced. The redistribution of stresses within the reservoir helps to maintain its mechanical stability, lowering the risk of fault reactivation and structural failure.
  • The 25-year geomechanical analysis shows that the reservoir remains stable under CO2 injection, with no evidence of shear failure or significant fault reactivation. This indicates that CO2 storage can enhance the reservoir’s structural integrity while mitigating the adverse effects of depletion. Continuously monitoring stresses and strain will be essential to ensure safe and effective storage, especially in managing subsidence risks near populated areas or infrastructure.

Author Contributions

Conceptualization, S.H., S.S. and M.H.; Methodology, S.H., R.A. and S.S.; Software, S.H.; Validation, S.H. and M.H.; Formal analysis, S.H. and S.S.; Investigation, S.H., R.A., S.S. and M.H.; Resources, S.H.; Data curation, S.H.; Writing—original draft, S.H.; Writing—review & editing, R.A., S.S. and M.H.; Visualization, S.H.; Supervision, S.S. and M.H. All authors have read and agreed to the published version of the manuscript.

Funding

This research received no external funding.

Institutional Review Board Statement

Not applicable.

Informed Consent Statement

Not applicable.

Data Availability Statement

Data are contained within the article.

Conflicts of Interest

The authors declare no conflict of interest.

References

  1. French, S.; Puspitasari, R.; Isherwood, A.; Cox, P.; Energy, O.; Marsden, R.; Rock, M.; Ndong, M.; Mbang, E.; Chee, P.; et al. SPE/IADC-184603-MS 4-D Geomechanics to Predict Compaction and Subsidence for Development of Unconsolidated Sandstone Reservoirs: Fortuna Project Case Study, Offshore Equatorial Guinea. In Proceedings of the SPE/IADC Drilling Conference and Exhibition, Hague, The Netherlands, 14 March 2017. [Google Scholar] [CrossRef]
  2. Hosseinzadeh, S.; Kadkhodaie, A.; Yarmohammadi, S. NMR derived capillary pressure and relative permeability curves as an aid in rock typing of carbonate reservoirs. J. Pet. Sci. Eng. 2020, 184, 106593. [Google Scholar] [CrossRef]
  3. Hosseinzadeh, S.; Kadkhodaie, A.; Wood, D.A.; Rezaee, R.; Kadkhodaie, R. Discrete fracture modeling by integrating image logs, seismic attributes, and production data: A case study from Ilam and Sarvak Formations, Danan Oilfield, southwest of Iran. J. Pet. Explor. Prod. Technol. 2023, 13, 1053–1083. [Google Scholar] [CrossRef]
  4. Dung, T.Q. Coupled Fluid Flow-Geomechanics Simulations Applied to Compaction and Subsidence Estimation in Stress Sensitive & Heterogeneous Reservoirs. Ph.D. Thesis, Australian School of Petroleum, Adelaide, Australia, 2007. [Google Scholar]
  5. Zoccarato, C.; Ferronato, M.; Teatini, P. Formation compaction vs. land subsidence to constrain rock compressibility of hydrocarbon reservoirs. Geomech. Energy Environ. 2018, 13, 14–24. [Google Scholar] [CrossRef]
  6. Lizárraga, J.J.; Buscarnera, G. A geospatial model for the analysis of time-dependent land subsidence induced by reservoir depletion. Int. J. Rock Mech. Min. Sci. 2020, 129, 104272. [Google Scholar] [CrossRef]
  7. Abdollahi, R.; Hosseinzadeh, S.; Movassagh, A.; Kasperczyk, D.; Haghighi, M. Imaging Pressure Distribution in Geological Reservoirs from Surface Deformation Data. Sustainability 2024, 16, 7710. [Google Scholar] [CrossRef]
  8. Sun, H.; Liu, X.; Ye, Z.; Wang, E. Experimental investigation of the nonlinear evolution from pipe flow to fissure flow during carbonate rock failures. Bull. Eng. Geol. Environ. 2021, 80, 4459–4470. [Google Scholar] [CrossRef]
  9. Liu, Z.; Liu, R. A fully implicit and consistent finite element framework for modeling reservoir compaction with large deformation and nonlinear flow model. Part I: Theory and formulation. Comput. Geosci. 2018, 22, 623–637. [Google Scholar] [CrossRef]
  10. Belousov, A.; Lushpeev, V.; Sokolov, A.; Sultanbekov, R.; Tyan, Y.; Ovchinnikov, E.; Shvets, A.; Bushuev, V.; Islamov, S. Hartmann–Sprenger Energy Separation Effect for the Quasi-Isothermal Pressure Reduction of Natural Gas: Feasibility Analysis and Numerical Simulation. Energies 2024, 17, 2010. [Google Scholar] [CrossRef]
  11. Islamov, S.; Islamov, R.; Shelukhov, G.; Sharifov, A.; Sultanbekov, R.; Ismakov, R.; Agliullin, A.; Ganiev, R. Fluid-Loss Control Technology: From Laboratory to Well Field. Processes 2024, 12, 114. [Google Scholar] [CrossRef]
  12. David, C.; Le Ravalec-Dupin, M. Rock Physics and Geomechanics in the Study of Reservoirs and Repositories; The Geological Society of London: London, UK, 2007; Volume 284, pp. 1–14. [Google Scholar] [CrossRef]
  13. Liu, L.; Huang, Z.; Yao, J.; Lei, Q.; Di, Y.; Wu, Y.-S.; Zhang, K.; Cui, S. Simulating two-phase flow and geomechanical deformation in fractured karst reservoirs based on a coupled hydro-mechanical model. Int. J. Rock Mech. Min. Sci. 2021, 137, 104543. [Google Scholar] [CrossRef]
  14. Sangnimnuan, A.; Li, J.; Wu, K. Development of coupled two phase flow and geomechanics model to predict stress evolution in unconventional reservoirs with complex fracture geometry. J. Pet. Sci. Eng. 2021, 196, 108072. [Google Scholar] [CrossRef]
  15. Xiao, F.; Salimzadeh, S.; Zhang, Q.-B. Opening versus shearing of a fluid-driven fault reactivation. Aust. Energy Prod. J. 2024, 64, S298–S301. [Google Scholar] [CrossRef]
  16. Yuan, B.; Wood, D.A. A holistic review of geosystem damage during unconventional oil, gas and geothermal energy recovery. Fuel 2018, 227, 99–110. [Google Scholar] [CrossRef]
  17. Dusseault, M.B. Coupled Processes and Petroleum Geomechanics. In Elsevier Geo-Engineering Book Series; Elsevier: Amsterdam, The Netherlands, 2004; pp. 49–62. [Google Scholar] [CrossRef]
  18. Dusseault, M.B. Geomechanical challenges in petroleum reservoir exploitation. KSCE J. Civ. Eng. 2011, 15, 669–678. [Google Scholar] [CrossRef]
  19. Liu, K.; Hosseinzadeh, S.; Safaei-Farouji, M.; Liu, B.; Morta, H.B.; Ostadhassan, M. Fracture toughness of organic rich shale via nanoindentation: A comparison of energy-based methods. Geoenergy Sci. Eng. 2023, 225, 211695. [Google Scholar] [CrossRef]
  20. Teatini, P.; Castelletto, N.; Gambolati, G. 3D geomechanical modeling for CO2 geological storage in faulted formations. A case study in an offshore northern Adriatic reservoir, Italy. Int. J. Greenh. Gas Control 2014, 22, 63–76. [Google Scholar] [CrossRef]
  21. Hosseinzadeh, S.; Haghighi, M.; Salmachi, A.; Shokrollahi, A. Carbon dioxide storage within coal reservoirs: A comprehensive review. Geoenergy Sci. Eng. 2024, 241, 213198. [Google Scholar] [CrossRef]
  22. Ye, Z.; Liu, X.; Sun, H.; Dong, Q.; Du, W.; Long, Q. Variations in Permeability and Mechanical Properties of Basaltic Rocks Induced by Carbon Mineralization. Sustainability 2022, 14, 15195. [Google Scholar] [CrossRef]
  23. Maerten, L.; Legrand, X.; Castagnac, C.; Lefranc, M.; Joonnekindt, J.P.; Maerten, F. Fault-related fracture modeling in the complex tectonic environment of the Malay Basin, offshore Malaysia: An integrated 4D geomechanical approach. Mar. Pet. Geol. 2019, 105, 222–237. [Google Scholar] [CrossRef]
  24. Ye, Z.; Liu, X.; Dong, Q.; Wang, E.; Sun, H. Hydro-Damage Properties of Red-Bed Mudstone Failures Induced by Nonlinear Seepage and Diffusion Effect. Water 2022, 14, 351. [Google Scholar] [CrossRef]
  25. Lewis, R.W.; Makurat, A.; Pao, W.K.S. Fully coupled modeling of seabed subsidence and reservoir compaction of North Sea oil fields. Hydrogeol. J. 2003, 11, 142–161. [Google Scholar] [CrossRef]
  26. Moid, F.; Hamid, O. 4D Geomechanics Application for Successful Well Drilling Plan. In Proceedings of the ADIPEC, Abu Dhabi, United Arab Emirates, 3 October 2023. Society of Petroleum Engineers. [Google Scholar] [CrossRef]
  27. De Santis, F.; Renaud, V.; Gunzburger, Y.; Kinscher, J.; Bernard, P.; Contrucci, I. In situ monitoring and 3D geomechanical numerical modelling to evaluate seismic and aseismic rock deformation in response to deep mining. Int. J. Rock Mech. Min. Sci. 2020, 129, 104273. [Google Scholar] [CrossRef]
  28. Guerra, C.; Fischer, K.; Henk, A. Stress prediction using 1D and 3D geomechanical models of a tight gas reservoir—A case study from the Lower Magdalena Valley Basin, Colombia. Geomech. Energy Environ. 2019, 19, 100113. [Google Scholar] [CrossRef]
  29. Ambati, V.; Mahadasu, N.B.; Koehn, D.; Nair, R.R. Construction of a 3D geomechanical model using integrated workflow to study zones causing subsidence and wellbore instabilities. Geomech. Geophys. Geo-Energy Geo-Resources 2021, 7, 83. [Google Scholar] [CrossRef]
  30. Shad, S.; Kolahkaj, P.; Zivar, D. Geomechanical analysis of an oil field: Numerical study of wellbore stability and reservoir subsidence. Pet. Res. 2023, 8, 350–359. [Google Scholar] [CrossRef]
  31. Ranjbar, A.; Hassani, H.; Shahriar, K. 3D geomechanical modeling and estimating the compaction and subsidence of Fahlian reservoir formation (X-field in SW of Iran). Arab. J. Geosci. 2017, 10, 116. [Google Scholar] [CrossRef]
  32. Mahajan, S.; Hassan, H.; Duggan, T.; Dhir, R.; Development, P. SPE-192744-MS Compaction and Subsidence Assessment to Optimize Field Development Planning for an Oil Field in Sultanate of Oman. In Proceedings of the Abu Dhabi International Petroleum Exhibition & Conference, Abu Dhabi, United Arab Emirates, 14 November 2018. [Google Scholar] [CrossRef]
  33. Mehrabi, H.; Rahimpour-Bonab, H.; Hajikazemi, E.; Jamalian, A. Controls on depositional facies in Upper Cretaceous carbonate reservoirs in the Zagros area and the Persian Gulf, Iran. Facies 2015, 61, 23. [Google Scholar] [CrossRef]
  34. Alsharhan, A.S.; Kendall, C.G.S.C. Paleozoic sequence stratigraphy, depositional systems, and hydrocarbon habitats across the Arabian plate. Am. Assoc. Pet. Geol. Bull. 2021, 105, 1149–1198. [Google Scholar] [CrossRef]
  35. Ezati, M.; Olfati, H.; Khadem, M.; Yazdanipour, M.R.; Mohammad, A. Petrophysical Evaluation of a Severely Heterogeneous Carbonate Reservoir; Electrical Image Logs Usage in Porosity Estimation. Open J. Geol. 2019, 9, 193–200. [Google Scholar] [CrossRef]
  36. Jafari, A.; Ao, S.; Jamei, S.; Ghasemi, H. Evolution of the Zagros sector of Neo-Tethys: Tectonic and magmatic events that shaped its rifting, seafloor spreading and subduction history. Earth-Sci. Rev. 2023, 241, 104419. [Google Scholar] [CrossRef]
  37. Kakemem, U.; Jafarian, A.; Husinec, A.; Adabi, M.H.; Mahmoudi, A. Facies, sequence framework, and reservoir quality along a Triassic carbonate ramp: Kangan Formation, South Pars Field, Persian Gulf Superbasin. J. Pet. Sci. Eng. 2021, 198, 108166. [Google Scholar] [CrossRef]
  38. Kaveh-Ahangar, S.; Nozaem, R.; Tavakoli, V. The effects of planar structures on reservoir quality of Triassic Kangan formation in the central Persian Gulf, an integrated approach. J. Afr. Earth Sci. 2023, 197, 104764. [Google Scholar] [CrossRef]
  39. Esrafili-Dizaji, B.; Rahimpour-Bonab, H. Effects of depositional and diagenetic characteristics on carbonate reservoir quality: A case study from the South Pars gas field in the Persian Gulf. Pet. Geosci. 2009, 15, 325–344. [Google Scholar] [CrossRef]
  40. Kadkhodaie, R.; Sohrabi, A.; Jodeyri-Agaii, R. A syngenetic classification of anhydrite textures in carbonate reservoirs and its relationship with reservoir quality: A case study from the Permo-Triassic Dalan and Kangan formations. Carbonates Evaporites 2022, 37, 44. [Google Scholar] [CrossRef]
  41. Sabouhi, M.; Kadkhodaie, A.; Hosseinzadeh, S.; Batezelli, A. Seismic sequence stratigraphy of Late Albian-Early Turonian successions in SW Iran: Implication for reservoir characterizations and potential for improved reservoir quality prediction. J. Afr. Earth Sci. 2024, 214, 105269. [Google Scholar] [CrossRef]
  42. Sharland, P.R.; Casey, D.M.; Davies, R.B.; Simmons, M.D.; Sutcliffe, O.E. Arabian Plate Sequence Stratigraphy—Revisions to SP2. GeoArabia 2004, 9, 199–214. [Google Scholar] [CrossRef]
  43. Rezavand, N.; Jahani, D.; Asilian, H. Facies, Sedimentary Environment and Sequence Stratigraphy of Dalan Formation in South Fars, Iran—(Qatar-South Fars Arch) Well ASL-A. Open J. Geol. 2016, 6, 944–962. [Google Scholar] [CrossRef]
  44. Gholami, R.; Rasouli, V.; Aadnoy, B.; Mohammadi, R. Application of in situ stress estimation methods in wellbore stability analysis under isotropic and anisotropic conditions. J. Geophys. Eng. 2015, 12, 657–673. [Google Scholar] [CrossRef]
  45. Zoback, M.D. Reservoir Geomechanics; Cambridge University Press: Cambridge, UK, 2007. [Google Scholar] [CrossRef]
  46. Li, Y.; Otsubo, M.; Kuwano, R. Interpretation of static and dynamic Young’s moduli and Poisson’s ratio of granular assemblies under shearing. Comput. Geotech. 2022, 142, 104560. [Google Scholar] [CrossRef]
  47. Sharifi, J.; Nooraiepour, M.; Amiri, M.; Mondol, N.H. Developing a relationship between static Young’s modulus and seismic parameters. J. Pet. Explor. Prod. Technol. 2023, 13, 203–218. [Google Scholar] [CrossRef]
  48. Cheng, B.; Xu, T.; Tang, J. Reservoir Brittleness Prediction Method Based on the Mohr–Coulomb Failure Criterion and Effective In Situ Stress Principle. Rock Mech. Rock Eng. 2022, 55, 5933–5951. [Google Scholar] [CrossRef]
  49. Khaksar, A.; Taylor, P.G.; Fang, Z.; Kayes, T.; Salazar, A.; Rahman, K. Rock Strength from Core and Logs, Where We Stand and Ways to Go. In All Days; SPE: Kuala Lumpur, Malaysia, 2009. [Google Scholar] [CrossRef]
  50. Yang, L.; Ge, H.; Shen, Y.; Zhang, J.; Yan, W.; Wu, S.; Tang, X. Imbibition inducing tensile fractures and its influence on in-situ stress analyses: A case study of shale gas drilling. J. Nat. Gas Sci. Eng. 2015, 26, 927–939. [Google Scholar] [CrossRef]
  51. Liu, P.-H.; Wu, J.-H.; Lee, D.-H. New rock strength-based UCS-Vp correlation equation for different rock types by statistical regression methods. Geomech. Energy Environ. 2022, 32, 100403. [Google Scholar] [CrossRef]
  52. Najibi, A.R.; Ghafoori, M.; Lashkaripour, G.R.; Asef, M.R. Reservoir geomechanical modeling: In-situ stress, pore pressure, and mud design. J. Pet. Sci. Eng. 2017, 151, 31–39. [Google Scholar] [CrossRef]
  53. Motahari, M.; Hashemi, A.; Molaghab, A. Successful mechanical earth model construction and wellbore stability analysis using elastic and plasticity solutions, a case study. Geomech. Energy Environ. 2022, 32, 100357. [Google Scholar] [CrossRef]
  54. Eaton, B.A. The Effect of Overburden Stress on Geopressure Prediction from Well Logs. J. Pet. Technol. 1972, 24, 929–934. [Google Scholar] [CrossRef]
  55. Bowers, G.L. Determining an Appropriate Pore-Pressure Estimation Strategy. In Proceedings of the Offshore Technology Conference, Houston, TX, USA, 30 April–3 May 2001. All Days, OTC-13042-MS. [Google Scholar] [CrossRef]
  56. Ibrahim, A. A review of mathematical modelling approaches to tackling wellbore instability in shale formations. J. Nat. Gas Sci. Eng. 2021, 89, 103870. [Google Scholar] [CrossRef]
  57. Donald, J.A.; Neville, T.J. The Impact of Anisotropic Mechanical Properties on Stimulation and Wellbore Stability in the Beetaloo Basin, Northern Territory, Australia. In Proceedings of the 2021 Asia Pacific Unconventional Resources Technology Conference, Virtual, 16–18 November 2021. [Google Scholar] [CrossRef]
  58. Vernik, L.; Zoback, M.D. Estimation of maximum horizontal principal stress magnitude from stress-induced well bore breakouts in the Cajon Pass Scientific Research borehole. J. Geophys. Res. Solid Earth 1992, 97, 5109–5119. [Google Scholar] [CrossRef]
  59. Stephenson, R.; Schiffer, C.; Peace, A.; Nielsen, S.B.; Jess, S. Late Cretaceous-Cenozoic basin inversion and palaeostress fields in the North Atlantic-western Alpine-Tethys realm: Implications for intraplate tectonics. Earth-Sci. Rev. 2020, 210, 103252. [Google Scholar] [CrossRef]
  60. Lei, Q.; Gholizadeh Doonechaly, N.; Tsang, C.-F. Modelling fluid injection-induced fracture activation, damage growth, seismicity occurrence and connectivity change in naturally fractured rocks. Int. J. Rock Mech. Min. Sci. 2021, 138, 104598. [Google Scholar] [CrossRef]
  61. Han, H.; van der Baan, M. Constraint strategies for estimating in-situ stress from borehole measurements. Geomech. Energy Environ. 2024, 37, 100518. [Google Scholar] [CrossRef]
  62. Tang, Z.; Kong, X.; Duan, W.; Gao, J. Wellbore breakout analysis and the maximum horizontal stress determination using the thermo-poroelasticity model. J. Pet. Sci. Eng. 2021, 196, 107674. [Google Scholar] [CrossRef]
  63. Qi, S.; Tan, X.; Li, X.-P.; Meng, Z.; Xu, Y. Numerical simulation and experimental verification studies on a unified strength theory-based elastoplastic damage constitutive model of shale. Nat. Gas Ind. B 2021, 8, 267–277. [Google Scholar] [CrossRef]
  64. Giraldo-Londoño, O.; Paulino, G.H. A unified approach for topology optimization with local stress constraints considering various failure criteria: Von Mises, Drucker–Prager, Tresca, Mohr–Coulomb, Bresler– Pister and Willam–Warnke. Proc. R. Soc. A Math. Phys. Eng. Sci. 2020, 476, 20190861. [Google Scholar] [CrossRef]
  65. Gao, C.; Gray, K.E. A coupled geomechanics and reservoir simulator with a staggered grid finite difference method. J. Pet. Sci. Eng. 2022, 209, 109818. [Google Scholar] [CrossRef]
  66. Gudala, M.; Govindarajan, S.K. Numerical Modeling of Coupled Fluid Flow and Geomechanical Stresses in a Petroleum Reservoir. J. Energy Resour. Technol. 2020, 142, 063006. [Google Scholar] [CrossRef]
  67. Rabe, C.; Perdomo, P.R.R.; Roux, P.-F.; Silva, C.G.; Gamboa, L.A.P. Coupled fluid flow and geomechanics: A case study in Faja del Orinoco. Geomech. Geophys. Geo-Energy Geo-Resources 2020, 6, 14. [Google Scholar] [CrossRef]
  68. Cui, X.; Wong, L.N.Y. A 3D fully thermo–hydro–mechanical coupling model for saturated poroelastic medium. Comput. Methods Appl. Mech. Eng. 2022, 394, 114939. [Google Scholar] [CrossRef]
  69. Beck, M.; Rinaldi, A.P.; Flemisch, B.; Class, H. Accuracy of fully coupled and sequential approaches for modeling hydro- and geomechanical processes. Comput. Geosci. 2020, 24, 1707–1723. [Google Scholar] [CrossRef]
  70. Duran, O.; Sanei, M.; Devloo, P.R.B.; Santos, E.S.R. An enhanced sequential fully implicit scheme for reservoir geomechanics. Comput. Geosci. 2020, 24, 1557–1587. [Google Scholar] [CrossRef]
  71. Moorthy, P.R.S.; Chatterjee, A.; Younessi, A.; Ghosh, A. Reservoir Compaction and Surface Subsidence Assessment to Optimize Field Development Planning in Offshore Malay Basin, Malaysia. In Proceedings of the IADC/SPE Asia Pacific Drilling Technology Conference, APDT, Bangkok, Thailand, 9–10 August 2022; Society of Petroleum Engineers (SPE): Kuala Lumpur, Malaysia, 2022. [Google Scholar]
  72. Treffeisen, T.; Henk, A. Faults as Volumetric Weak Zones in Reservoir-Scale Hydro-Mechanical Finite Element Models—A Comparison Based on Grid Geometry, Mesh Resolution and Fault Dip. Energies 2020, 13, 2673. [Google Scholar] [CrossRef]
  73. Younessi, A.; Gui, F.; Guises, R.; Ngan, A.; Nadzri, S.; Zhou, C. OTC-28227-MS Evaluation of Reservoir Compaction and Geomechanical Related Risks Associated with Reservoir Production Using a Two-Way Coupled 4D Geomechanical Model for a Deep-Water Field in South East Asia. In Proceedings of the Offshore Technology Conference Asia, Kuala Lumpur, Malaysia, 20–23 March 2018. [Google Scholar] [CrossRef]
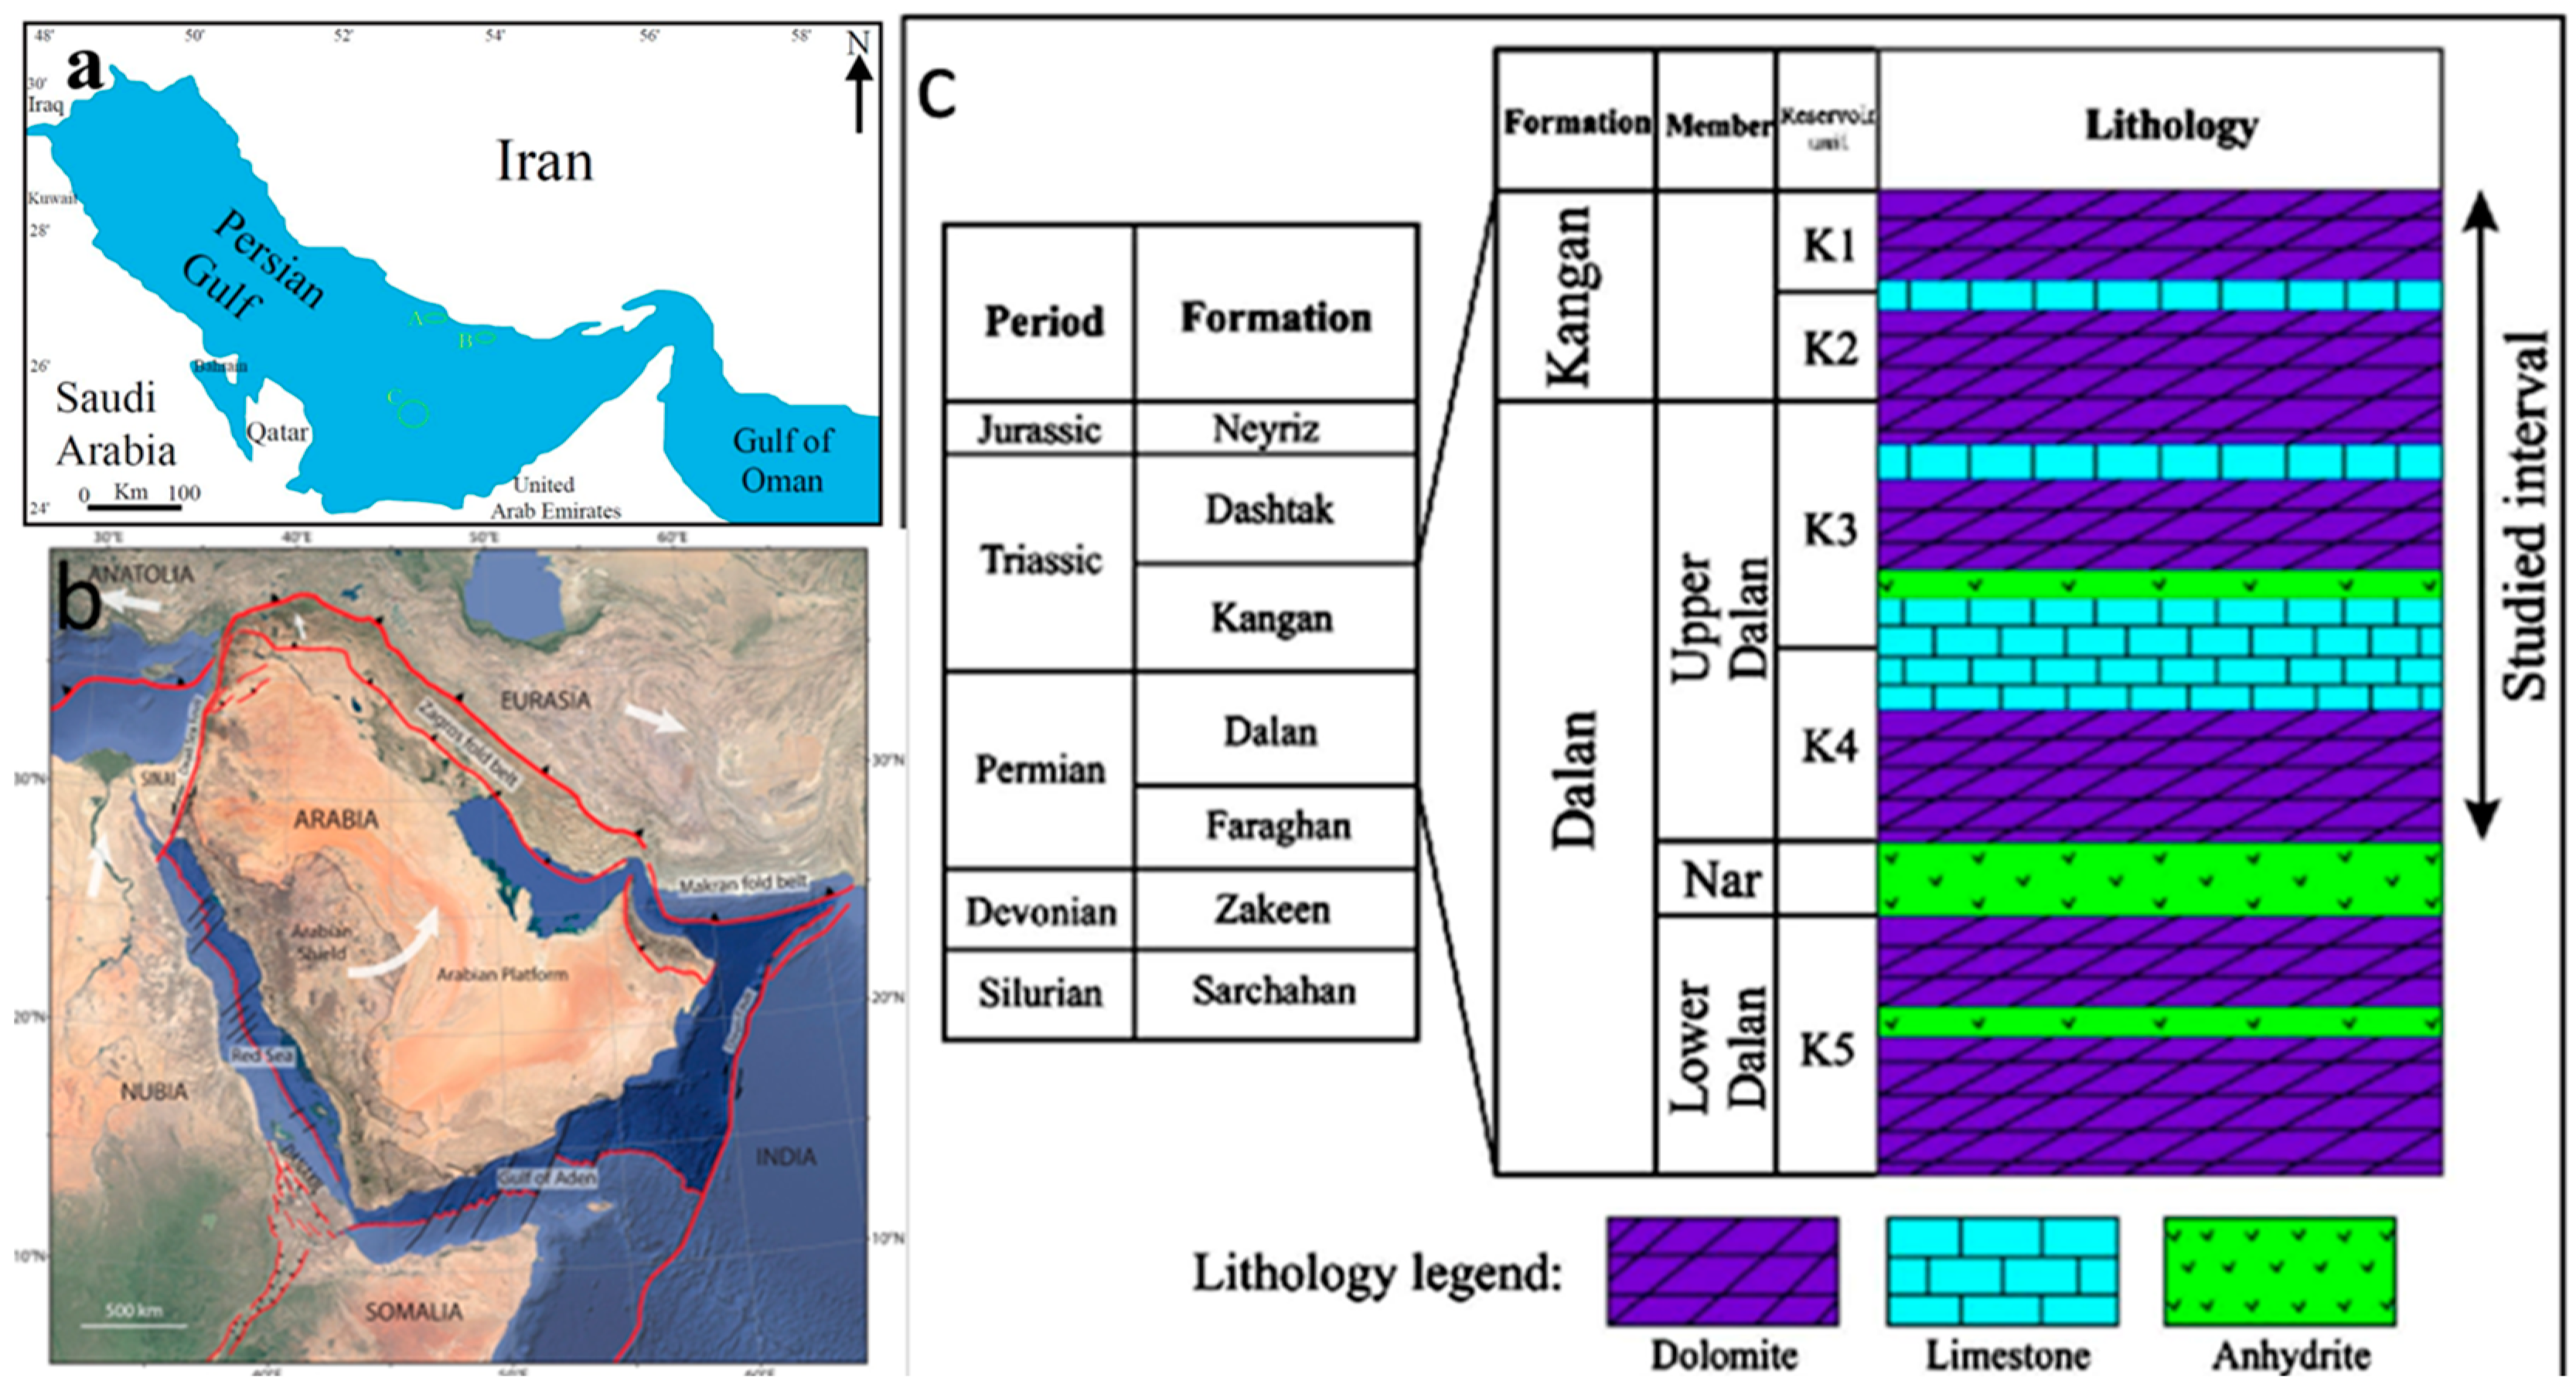
Figure 1. (a) Shows the location of the studied field in the southwest of Iran. (b) Geological and tectonic map of the studied area during late Permian, modified from Ezat et al. (2019) [35]. (c) Stratigraphic charts that make up the Greater Paleozoic petroleum systems of Khuff Group (Kangan–Dalan Formations). Modified from Ezat et al. (2019) [35].
Sustainability 16 08482 g001
Figure 2. Schematic palaeogeographical model of the Kangan and Dalan platform system. Modified from Sharland et al. (2004) [42] and Rezavand et al. (2016) [43].
Sustainability 16 08482 g002
Figure 3. Typical workflow for construction of MEM.
Sustainability 16 08482 g003
Figure 4. Es from Ed.
Sustainability 16 08482 g004
Figure 5. Breakout and tensile fractures are oriented in accordance with the in situ stresses.
Sustainability 16 08482 g005
Figure 6. Coupled reservoir–geomechanical model workflow highlighted in the dotted square area.
Sustainability 16 08482 g006
Figure 7. Comparison between mechanical rock properties obtained from log data and core data is illustrated. Calibration data points are denoted by dots. The tracks include Gamma ray (Track 1), Density log (Track 2), Compressional and shear slowness (Track 3), Dynamic and Static Young’s modulus (Track 4), Static and dynamic shear modulus (Track 5), Static and dynamic Bulk modulus (Track 6), Dynamic and Static Poisson’s ratio (Track 7), Unconfined compressive strength, fraction angle, and TSTR (Track 8), Pore-pressure and MDT data (Track 9), and Principal stresses (Track 10).
Sustainability 16 08482 g007
Figure 8. (a) The reservoir model is integrated within a 3D geomechanical framework, encompassing reservoir, overburden, underburden, and sideburden zones. Panel (a) provides a top-down perspective, while panel (b) offers an oblique view, with arrows indicating the northward direction.
Sustainability 16 08482 g008
Figure 9. Above: Young’s modulus calculated from seismic inversion results. Below: Young’s modulus populated in the FEM grid.
Sustainability 16 08482 g009
Figure 10. Above: Poisson’s ratio calculated from seismic inversion results. Below: Poisson’s ratio populated in the FEM grid.
Sustainability 16 08482 g010
Figure 11. Geostatistical modeling of Vp (a), vs. (b) and density (c) with weighted by colored inversion results on an arbitrary section passing through the wells.
Sustainability 16 08482 g011
Figure 12. Young’s module (upper) and Poisson ratio (lower) through the reservoir intervals.
Sustainability 16 08482 g012
Figure 13. UCS (upper) and friction angle (lower) through the reservoir intervals.
Sustainability 16 08482 g013
Figure 14. Pore pressure in the beginning of production.
Sustainability 16 08482 g014
Figure 15. Minor and major faults throughout the field.
Sustainability 16 08482 g015
Figure 16. The azimuth of breakout in the reservoir section which indicates minimum horizontal-stress direction.
Sustainability 16 08482 g016
Figure 17. Sv (a), SH (b) and Sh (c) magnitude.
Sustainability 16 08482 g017
Figure 18. Pressure decline due to the production from 2024 to 2048.
Sustainability 16 08482 g018
Figure 19. Simulation validation. Correlation between modeled and 1D geomechanical model results.
Sustainability 16 08482 g019
Figure 20. Pore-pressure and effective stress alteration during the depletion in ZZ for Well A and Well B.
Sustainability 16 08482 g020
Figure 21. Effective stress changes during depletion from 2024 to 2048 in the ZZ (Track 2), XX (Track 3), and YY (Track 4) directions. It is evident that as pore pressure decreases (Track 1), the effective stress increases.
Sustainability 16 08482 g021
Figure 22. Strain changes during depletion from 2024 to 2048 in the XX (Track 2), YY (Track 3), and ZZ (Track 4) directions. It is evident that as pore pressure decreases (Track 1), the strain increases.
Sustainability 16 08482 g022
Figure 23. Principal stress changes through various timesteps during the production through (a) K1 zone (b) K2 zone (c) K3 zone and (d) K4 zone.
Sustainability 16 08482 g023
Figure 24. Fault reactivation results: (a) principal stress changes through various timesteps during the production through Main Fault 1; (b) principal stress changes through various timesteps during the production through Main Fault 2; and (c) YIELDMOD values at the 2048 timestep. The case evaluated displayed no failure in the Kangan–Dalam Formation layers located in the simulated area.
Sustainability 16 08482 g024
Figure 25. Reservoir compaction magnitude in 2048.
Sustainability 16 08482 g025
Figure 26. Reservoir uplift magnitude during the CO2 injection.
Sustainability 16 08482 g026
Figure 27. Reservoir uplift magnitude after 5, 15, and 25 years of CO2 injection.
Sustainability 16 08482 g027
Table 1. Data inventory for Well A, Well B and Well C for MEM generation. Y (yes), N (No).
Well DataWell AWell BWell CField Data
GRYYY
Sonic compression and shearOnly compressionYY
DensityYYY3D Seismic
PorosityYYY
Image LogNNY
CalliperYYY
MDTNYY
Drilling reportYYY
Core dataNNY
Table 2. The applied materials modeled in studied field.
ParametersCriteria
Linear isotropicA standard elastic material typically used to establish the magnitudes of in situ stress in generic rock.
Non-linear isotropicMaterial governed by yield criteria (e.g., Mohr–Coulomb) with parameters including strength and friction angle. These are required for Mohr–Coulomb plastic-deformation breakout calculations in the mud-weight window plug-in.
Plate Typically has a Young’s modulus 1.5 times higher than the highest modeled value.
UnderburdenA standard material is utilized to accurately model stress transfer within the model, with properties intended to closely resemble the average values obtained from calibrated logs and/or seismic.
Fault Non-linearDiscontinuity characteristics featuring yield criteria and supplementary normal and shear stiffness terms.
Table 3. A summary of applied data for MEM.
Fm/Mbr NameDepth (m)Thickness (m)Average Vp (m/s)Average vs. (m/s)Average ρ (g/cm3)Average E (GPa)Average ν
Seabed75.00263.002263.00900.001.901.000.35
Lower Fars338.00127.002400.001200.001.931.000.33
Asmari465.0034.002700.001250.002.002.000.33
Jahrum499.00618.003400.001300.002.163.000.25
Tarbur1117.00121.005800.001900.002.608.000.25
Gurpi1238.0091.005100.003000.002.608.000.25
Ilam1329.00100.005900.003200.002.608.000.25
Sarvak1429.00120.504900.002800.002.706.000.29
Kazhdumi1549.5086.504100.002200.002.604.000.29
Dariyan1636.00114.004000.002100.002.607.000.29
Gadvan1750.0055.004300.002250.002.606.000.29
Fahliyan1805.00248.004800.002900.002.606.000.29
Hith2053.0035.505900.003200.002.8012.000.26
Surmeh2088.50764.505600.003000.002.707.000.26
Neyriz2853.00180.005300.002900.002.807.000.26
Dashtak3033.00494.506300.003250.002.9012.000.28
Kangan3527.50149.325800.003150.002.9010.000.28
Table 4. Summary of geomechanical parameters throughout the reservoir intervals.
Fm/ParameterVp (km/s)Vs (km/s)ρ (g/cm)E
(Gpa)
νUCS (bar)TSTR (bar)Φ
(deg)
Kangan642.9420.1217417.481.1
Upper Dalan5.43.42.5300.1614214.281.6
Nar6.34.22.9470.091901980.0
Lower Dalan5.43.52.7320.1413413.481.6
Table 5. Fault parameters.
Fault ParametersMagnitudeUnit
Normal Stiffness309,452.53psi/ft
Shear Stiffness110,518.76psi/ft
Cohesion0.02bar
Friction Angle25.00deg
Dilation Angle10.00deg
Tensile Strength0.01bar
Initial Opening0.00m
Table 6. Boundary condition.
Boundary ConditionValueUnit
Sh Gradient0.21bar/m
Sh Offset0.00psi
SH/Sh1.20-
Sh Azimuth20.00degree
Sea Fluid Pressure Gradient0.43psi/ft
Table 7. A summary of similar studies estimating reservoir subsidence during depletion.
Author(s)Field of StudySubsidence Magnitude (cm)
Ranjbar et al. (2017) [31]An oil field located in southwestern Iran0.29 *
Mahajan et al. (2018) [32]Fahud West oil field in the Sultanate of Oman23
Moorthy et al. (2022) [71]Offshore Malay Basin, Malaysia35 to 25
Younessi et al. (2023) [73]South Senoro field in the Eastern Indonesia11.1
Shad et al. (2023) [30]An oil field located in southwestern Iran7
* There was an injection during production.
Disclaimer/Publisher’s Note: The statements, opinions and data contained in all publications are solely those of the individual author(s) and contributor(s) and not of MDPI and/or the editor(s). MDPI and/or the editor(s) disclaim responsibility for any injury to people or property resulting from any ideas, methods, instructions or products referred to in the content.