Article

Navigating Health-Related Crises: Unraveling the Role of Confidence in Tourism Recovery in Shaping Sustainable Strategies for Tourists’ Intentions across Pandemic Phases

1
School of Information Technology & Management, University of International Business and Economics, No. 10, Huixin East Street, Chaoyang District, Beijing 100029, China
2
College of City Management, Beijing Open University, No. A4, Zaojunmiao, Haidian District, Beijing 100081, China
3
Business School, Beijing Technology and Business University, No. 33, Fucheng Road, Haidian District, Beijing 100048, China
*
Author to whom correspondence should be addressed.
Sustainability 2024, 16(19), 8492; https://doi.org/10.3390/su16198492 (registering DOI)
Submission received: 23 August 2024 / Revised: 25 September 2024 / Accepted: 27 September 2024 / Published: 29 September 2024
(This article belongs to the Special Issue Economic and Social Consequences of the COVID-19 Pandemic)

Abstract

:
The COVID-19 pandemic has severely impacted global tourism, raising the need for sustainable recovery strategies. This study examines how tourists’ confidence in tourism recovery (CTR) influences travel intentions across different pandemic phases—outbreak, stabilization, and conclusion. Positioned within the Theory of Planned Behavior (TPB), the research explores the mediating role of CTR in the relationships between attitude, subjective norms, perceived behavioral control, and travel intention. Using structural equation modeling (SEM), multi-group analysis (MGA), and Importance–Performance Matrix Analysis (IPMA), this study assesses changes in travel behavior during each pandemic phase. Data were collected through three surveys conducted in major Chinese cities between late 2022 and early 2023. The findings reveal that CTR significantly mediates the influence of behavioral factors on travel intention, especially during the stabilization and conclusion phases. The IPMA results highlight key areas for intervention, with CTR, perceived behavioral control, and subjective norms varying in importance across phases. This research underscores the need for adaptive and sustainable strategies to strengthen traveler confidence, offering practical insights for supporting long-term resilience and growth in the tourism industry during and beyond health-related crises.

1. Introduction

The global tourism industry, a significant driver of economic growth and cultural exchange, is uniquely sensitive to health-related crises. Among these, the COVID-19 pandemic has posed an unprecedented challenge worldwide. Over the past three years, significant fluctuations in tourist arrivals have been observed as the pandemic evolved [1]. Despite evident signs of recovery in 2023 and 2024, the resurgence of health-related crises continues to threaten tourism stability, underscoring the importance of understanding how tourist confidence drives sustainable recovery strategies [2,3,4,5].
Existing research on tourism behavior during crises has predominantly focused on risk perception, media influence, and health awareness, often centered on the early stages of the pandemic [6,7,8,9,10,11,12,13,14,15,16,17,18]. These studies have provided valuable insights into how fear and uncertainty shape travel intentions. However, much of the literature remains limited by its reliance on cross-sectional data and static analyses, neglecting the dynamic evolution of tourists’ behavior across different pandemic phases. This gap in longitudinal analysis hinders our understanding of how confidence in tourism recovery (CTR) dynamically influences travel intentions during health-related crises.
To bridge this gap, this study introduces CTR as a key mediating variable within the framework of the Theory of Planned Behavior (TPB). While TPB has proven robust in predicting behavioral intentions across various contexts, its application in pandemic scenarios remains under-explored. By integrating CTR, this study aims to enhance the predictive power of TPB in the context of tourism recovery, offering a more comprehensive understanding of how attitudes, subjective norms, and perceived behavioral control interact with CTR to shape travel intentions.
In addition, by drawing on longitudinal data collected from three rounds of surveys conducted in major Chinese cities between late 2022 and early 2023, the research captures real-world shifts in tourists’ behavior as the pandemic progressed. To enable dynamic tracking of behavioral shifts and identification of key areas for improving sustainable tourism strategies, this study utilizes Partial Least Squares Structural Equation Modeling (PLS-SEM), combined with Multi-Group Analysis (MGA) and Importance–Performance Matrix Analysis (IPMA) to explore the mediating role of confidence in tourism recovery (CTR) across different pandemic phases. The findings underscore the importance of adaptive strategies that strengthen tourists’ confidence and support sustainable tourism recovery, particularly in response to ongoing health-related uncertainties [4,5].
By addressing these issues, this research contributes to the growing body of literature on crisis management in tourism and provides actionable insights for both policymakers and industry stakeholders to design adaptive strategies that build tourists’ confidence and support long-term resilience in the face of health-related uncertainties.

2. Literature Review

2.1. Tourists’ Behavioral Intention

Behavioral intention refers to an individual’s readiness or plan to perform a specific action [19,20] and has been a focal point in fields such as behavioral science, psychology, and management for predicting actual behavior [21,22,23,24,25]. In tourism, behavioral intention involves decisions related to traveling [26], revisiting destinations [24,27], participating in activities [28], or recommending locations to others [29,30]. As behavioral intention offers insights into how tourists make decisions, researchers and practitioners are keen to explore the factors influencing these intentions. Recent reviews, such as that by Seyfi et al. (2024), identified multiple influencing factors, including risk perception, trust, past experiences, and media coverage [6].
Researchers consistently emphasize the dual role of travel inhibitors and motivators in shaping behavioral intentions [26,30,31]. During health-related crises such as COVID-19, tourists’ intentions become particularly complex and are subject to significant changes. Early pandemic research primarily focused on inhibitors, such as health risks, anxiety, and travel restrictions [7,8,9,10,32]. However, as the pandemic subsides, attention is shifting towards motivators such as satisfaction, trust, and positive experiences [26,31], which are expected to play a stronger role in driving travel intentions post-crisis. For instance, Fuchs et al. (2024) suggest that strong motivators can outweigh risk concerns [10], while Kim et al. (2022) highlight that anticipated positive emotional experiences significantly boost travel likelihood in the post-pandemic period [12].

2.2. Theory of Planned Behavior

Rooted in the theory of reasoned action, the Theory of Planned Behavior (TPB) is a widely applied framework for predicting behavioral intentions by examining attitudes, subjective norms, and perceived behavioral control [20,33]. In tourism research, TPB has consistently demonstrated its robustness in understanding travel intentions, especially during and after the pandemic [29,30,33,34,35,36]. Beyond its established predictive power, the adaptability of TPB allows for the inclusion of additional variables, enhancing its relevance in varying contexts [37]. For instance, Yuzhanin and Fisher (2016) suggested extending TPB by adding new constructs to better account for the unique factors influencing tourist behavior, particularly in crisis situations [38].
Recent studies have integrated TPB with other frameworks to explore shifts in travel intentions during crises. For example, Hüsser et al. (2023) combined TPB with the Health Belief Model (HBM) to analyze how perceived health risks influence travel decisions during COVID-19 [13]. Additionally, the Stimulus–Organism–Response (S-O-R) model and the Protection Motivation Theory (PMT) have been introduced to extend TPB in research to address factors such as perceived risk, information overload, and fear [7,39]. Other extensions have incorporated constructs such as perceived risk [8,10,14], emotional responses [10], and trust [7,40,41] to capture factors not covered by the original TPB framework.
Although TPB remains central in predicting travel intentions, there is a growing need for longitudinal research to track the changes in tourist behavior intentions as the pandemic evolves and recovery progresses. As Yuzhanin and Fisher (2016) suggest, such studies can offer deeper insights into how intentions and behaviors change over time [38], which may guide the tourism industry in adapting to tourists’ shifting preferences and maintaining sustainability.

2.3. Tourists’ Confidence in Tourism Recovery

Consumer confidence is a well-established indicator in marketing and economics. High consumer confidence typically leads to increased spending and economic growth, while low confidence results in reduced consumption and economic stagnation [15,42,43]. In tourism research, this concept parallels tourists’ confidence, which plays a vital role in shaping travel decisions. Just as consumers’ confidence influences their spending, tourists’ confidence directly affects their perceptions of safety and attractiveness of a destination, which becomes a decisive factor in the recovery of destination image and tourists’ behavior, impacting whether or not they choose to visit a destination post-crisis [44,45].
Based on the previous studies, this research extends the concept of consumer confidence to the specific context of post-pandemic tourism recovery. Tourists’ confidence in tourism recovery (CTR) is defined as the collective assurance and positive expectations tourists hold regarding the tourism sector’s ability to rebound from health crises. Dissimilar to the broader consumer confidence, which reflects overall financial stability and economic outlook, CTR is concerned with how tourists perceive the tourism sector’s efforts to ensure safety, manage risks, and restore services after a crisis [2]. CTR is thus a more focused construct, offering a detailed view of how tourism-specific recovery efforts influence tourists’ decisions.
In pandemic-related studies, tourists’ trust has been a primary focus for predicting behavioral intentions [7,40,41]. While trust involves a relational and long-term perspective, CTR addresses the immediate perceptions of recovery and safety. It reflects real-time responses to crisis management, providing a more dynamic measure of how tourists react to recovery efforts [35,46,47,48]. Therefore, a study of the CTR variable will differ from previous research, allowing us to explore tourism recovery and post-pandemic sustainable development from a more dynamic perspective.
Notably, rebuilding tourists’ confidence in the recovery of the tourism industry has been highlighted as a crucial path to economic restoration in some research [49,50,51,52]. Dissimilar to previous studies, our research integrates CTR with the Theory of Planned Behavior (TPB), aiming to provide a comprehensive understanding of tourists’ behavioral intentions in the context of post-pandemic sustainable recovery of tourism.

2.4. Dynamics of Tourists’ Travel Intentions across Different Stages in the Development of a Health-Related Crisis

Health-related crises, such as COVID-19, progress through distinct stages, each bringing unique public health challenges. Understanding these stages is crucial for effective crisis management and for developing strategies to mitigate the impact on tourism [52,53]. Cheer et al. (2021) emphasized the importance of dynamically tracking tourists’ behavior across these stages to refine tourism crisis management strategies [54].
However, most existing studies rely on cross-sectional data collected at specific stages of a crisis, limiting their ability to capture the evolution of tourists’ travel intentions. For instance, early research focused on initial reactions through text mining techniques [55], while later studies shifted to examine health interventions such as mask-wearing or social distancing during stabilization phases [56,57,58]. In the post-pandemic stage, research primarily addresses recovery and lasting shifts in tourism behaviors [12,59,60,61,62].
This highlights a significant gap in research that continuously tracks tourists’ intentions throughout all stages of a crisis. Such continuous analysis offers valuable insights for policymakers and industry stakeholders, enabling timely adaptations to changing conditions [10,52,63]. Casal-Ribeiro et al. (2023) underscore that dynamic tracking allows for real-time adjustments in response to shifting behaviors [63], while other studies advocate for ongoing research to fully understand evolving travel decisions [16,17].
To fill this gap, this study uses longitudinal data collected across multiple pandemic stages to provide dynamic insights into tourists’ intentions, addressing a crucial need in the existing literature.

3. Conceptual Model and Hypotheses Development

The current study proposes a conceptual model (see Figure 1) to identify how the travel motivators, such as tourists’ confidence in tourism recovery (CTR), integrate with the original TPB framework to tourists’ behavioral intentions as the pandemic progresses. Beyond the primary constructs, several control variables were introduced to mitigate the potential confounding effects arising from respondents’ characteristics on the outcome variable. These control variables include age, gender, education, and marriage, as outlined in Figure 1. The objective of this section is to discuss each construct and hypothesis related to the causal relationships within the proposed model.

3.1. TPB-Based Constructs and Hypotheses

The Theory of Planned Behavior (TPB) is a widely used framework for predicting a variety of human behaviors, including tourist intentions. It is particularly effective in the context of health-related crises because it provides a structured way to understand the factors, and it is open to the addition of other predictive variables [20,37]. TPB posits that three core components influence behavioral intentions, namely, attitude (hereinafter referred to as ATTD), subjective norms (hereinafter referred to as SN), and perceived behavioral control (hereinafter referred to as PBC) [20,64]. Tourist attitude refers to the individual’s positive or negative evaluations of traveling. During a crisis such as the COVID-19 pandemic, the TPB effectively captures this dynamic by linking attitudes directly to behavioral intentions, which were tested by many empirical studies [7,30,65,66,67]. Subjective norms involve the perceived social pressure to perform or not perform the behavior. In the context of health-related crisis, tourists’ travel decisions can be influenced by family, friends, and social media, which was demonstrated in some previous research [7,16,39,68,69,70]. Perceived behavioral control refers to an individual’s perception of resources, opportunities, and abilities to perform a certain behavior. Individuals with high perceived behavioral control always demonstrate a stronger behavioral intention [20]. It is considered to be salient where travel barriers (e.g., financial constraints, health risks, and accessibility issues) can significantly influence decisions. Tourists are more likely to travel if they feel confident in their ability to overcome these barriers, which have been asserted by some pandemic-related researchers [10,66,70]. Based on the original TPB framework and the previous empirical research, this study proposes the following hypotheses:
H1. 
Attitude toward travel positively influences tourists’ behavioral intention during and after the pandemic.
H2. 
Social norms positively influence tourists’ behavioral intentions during and after the pandemic.
H3. 
Perceived behavioral control positively influences tourists’ behavioral intention during and after the pandemic.

3.2. Incorporating the Construct of Tourists’ Confidence in Tourism Recovery (CTR) into the TPB

This study extends the TPB model by adding the construct of Tourists’ Confidence in Tourism Recovery (CTR), which is conceptualized as the level of assurance and positive expectation that tourists hold regarding the ability of the tourism sector to effectively rebound and restore its services, safety, infrastructure, and overall travel experience in the aftermath of a health-related crisis.
Both in academic research and practice, the close relationship between consumer confidence and economic behavior has been widely recognized. The UNWTO uses the Tourism Confidence Index to predict tourism demand for destinations. Previous studies emphasize that confidence levels significantly affect tourists’ decision-making processes during crises [71,72,73]. During a health-related crisis, the increased uncertainty amplifies the impact of psychological factors on tourists’ travel intentions. The stronger the tourists’ confidence in the recovery of the destination, the greater their intention to travel. Based on this, we propose the hypothesis as follows:
H4. 
Tourists’ confidence in tourism recovery (CTR) positively influences tourists’ behavioral intention to travel during and after the pandemic.
The current study posits that Tourists’ Confidence in Tourism Recovery (CTR) plays a crucial mediating role between the three antecedent variables (attitudes, subjective norms, and perceived behavioral control) and the dependent variable of travel intention, which may enhance the predictive power of the TPB framework during and after the pandemic.
First, according to the Attitude–Behavior Relationship Theory, an individual’s attitude towards a particular matter influences their beliefs and confidence regarding that matter [19,20]. During a crisis such as the COVID-19 pandemic, when tourists develop favorable attitudes toward travel—believing it to be enjoyable, safe, and valuable—these attitudes bolster their Confidence in Tourism Recovery (CTR). Positive attitudes signal a belief that tourism infrastructure is resilient and that travel will be met with adequate support, such as safety measures and services [20]. Some research suggests that when individuals hold favorable attitudes, they are more likely to trust in the success and recovery of the systems supporting their behavior, in this case, the tourism industry [71].
Without CTR, even a positive attitude may not translate into travel behavior due to lingering doubts or perceived barriers. Therefore, CTR serves as a critical mediator between attitude and actual behavioral intention, enhancing the belief that the behavior (travel) is supported and will be successfully executed [52]. In light of this, the hypotheses can be developed as follows:
H5a. 
Attitude (ATTD) towards travel positively influences Tourists’ Confidence in Tourism Recovery (CTR) during and after the pandemic.
H5b. 
Tourists’ Confidence in Tourism Recovery (CTR) mediates the relationship between tourists’ attitudes (ATTD) and their behavioral intention to travel (BI) during and after the pandemic.
Second, in the context of tourism, social norms encompass the expectations and behaviors of peers, family, media, and society regarding travel. During and after the health-related crisis, social norms play a prominent role in people’s decision-making process [74]. When tourists observe that others are confident in the recovery of the tourism industry and are starting to travel again, their own confidence in the industry’s recovery is bolstered. The role of social learning theory can also be integrated here, where individuals learn behaviors by observing others, particularly in ambiguous situations such as a post-crisis recovery phase [75].
This increased confidence enhances their intention to travel, aligning their personal attitudes with positive social norms. Recovery confidence serves as a bridge in this process by providing assurance that traveling is not only socially endorsed but also safe [50]. Given the crucial influence of tourists’ confidence on the relationship between, particularly in the context of post-crisis recovery, the following hypotheses are proposed:
H6a. 
Social norms (SN) positively influence Tourists’ Confidence in Tourism Recovery (CTR) during and after the pandemic.
H6b. 
Tourists’ Confidence in Tourism Recovery (CTR) mediates the relationship between social norms (SN) and tourists’ behavioral intention to travel (BI) during and after the pandemic.
Third, Perceived behavioral control (PBC) is repeatedly proven to serve as a predictor of a particular intention or behavior [20]. In the context of health-related crises, PBC encompasses tourists’ confidence in their ability to travel, considering factors such as financial resources, health and safety, logistical ease, and regulatory requirements. Tourists who feel they can navigate these obstacles—by, for example, adhering to safety protocols, managing finances, or making informed travel choices—are more likely to trust that they can travel safely and successfully. High levels of PBC reflect the optimistic mindsets of tourists, which boosts their positive belief in the tourism sector’s ability to rebound and provide safe, enjoyable experiences post-crisis [50].
In this sense, PBC not only reflects tourists’ belief in their ability to act but also builds their trust in the recovery of the tourism sector. Therefore, under the unique conditions of the pandemic, high levels of PBC significantly enhance CTR, and this enhanced confidence mediates the relationship between PBC and actual travel intentions. Based on this, the current study proposes the following hypotheses:
H7a. 
Perceived behavioral control (PBC) positively influences Tourists’ Confidence in Tourism Recovery (CTR)during and after the pandemic.
H7b. 
Tourists’ Confidence in Tourism Recovery (CTR) mediates the relationship between Perceived behavioral control (PBC) and tourists’ behavioral intention to travel (BI) during and after the pandemic.

4. Methodology

4.1. Overall Design

This study employs a survey-based approach, a widely used quantitative method to test hypotheses and validate theoretical models [76]. Conducted in the second half of 2022 during the global COVID-19 pandemic, this study utilized a quasi-experimental design with real-world scenarios. We grouped respondents by their perceived stage of epidemic development (PSED) and used PLS-MGA (Partial Least Squares Multi-Group Analysis) to assess differences in model relationships across groups and IPMA (Importance–Performance Map Analysis) to evaluate the importance and performance of constructs identifying areas for impactful improvements.

4.2. Questionnaire Design and Measure Instrument

A structured questionnaire was designed to capture tourists’ psychological responses during the pandemic. The questionnaire was divided into three sections. The first section presented pandemic-related scenarios for respondents to assess which best fit their perception. The second section measured key constructs, including attitude towards travel (ATTD), subjective norms (SN), perceived behavioral control (PBC), confidence in tourism recovery (CTR), and behavioral intention (BI). The third section collected socio-demographic information.
All constructs were adapted from established theories and prior studies (see Appendix A Table A1). The TPB constructs (ATTD, SN, PBC, and BI) were based on Ajzen’s guidelines [77,78]. Questions were adjusted with the pandemic or tourism-based situations, as referenced by prior studies [29,79]. The CTR construct was adapted from Curtin (1982), Gurtner (2016), and Boukes et al. (2021) [80,81,82]. Responses were measured on a five-point Likert scale ranging from 1 (strongly disagree) to 5 (strongly agree).

4.3. Pre-Test and Pilot Study

The questionnaire, originally in English, was translated into Chinese using the blind translation-back-translation method [83]. To ensure content and construct validity, the questionnaire was reviewed by three scholars and two field experts, leading to revisions for clarity. A pilot study with 204 respondents was conducted in mainland China using the Credamo platform (a survey provider in China specializing in collecting responses with 1.5 million qualified users.) in November 2022. Reliability for the constructs was assessed using Cronbach’s alpha, with all constructs scoring above or near 0.7, except for PBC [84]. Items that did not meet reliability thresholds were removed, and quality control measures, such as minimum stay time and screening questions, were implemented to ensure valid responses.

4.4. Data Collection and Samples

Data collection was conducted through Credamo across eight provincial areas or cities of China (including Beijing, Tianjin, Henan, Shanghai, Zhejiang, Chongqing, Fujian, and Guangdong), with a small portion distributed offline. Given the evolving epidemic control measures, some questionnaire items were adjusted to ensure relevance to the respondents’ current situation.
Three rounds of surveys were distributed between 25 December 2022 and 10 January 2023, resulting in 1026 valid responses after excluding low-quality or incomplete data. The sample was divided into three groups based on respondents’ perceived stage of the pandemic: 330 respondents perceived the outbreak stage, 365 perceived stabilization, and 331 believed the pandemic had concluded.

4.5. Data Analysis

Data analysis included descriptive analysis of socio-demographic data using SPSS 23, hypothesis testing, and model evaluation using SmartPLS 4.0, a variance-based SEM technique widely used in marketing, management, and tourism research [85,86,87,88]. PLS-SEM was chosen for its predictive orientation and robustness in analyzing new constructs and complex models [88,89,90,91]. Moreover, PLS-MGA and IPMA are other advanced techniques we can use to achieve this study’s objectives. Especially, while many researchers highlight that PLS-SEM works well with small sample sizes, PLS-SEM offers substantial potential for analyzing large datasets, which is the case in this study [92].

5. Results

5.1. Descriptive Statistics

5.1.1. Profile of Samples

A total of 1026 valid responses were analyzed, with the majority being female (70.7%), whereas males account for 29.3%. Most respondents were married (59.7%), while 39.3% were unmarried. The age distribution was concentrated between 21–30 years (44.6%) and 31–40 years (40.1%), and a significant portion had completed higher education (64.7% with undergraduate and 22.6% with graduate degrees). Occupations were primarily business-related (61.5%), and 57.3% of respondents reported monthly household incomes above 15,000 yuan (see more in Appendix A Table A2).

5.1.2. General Information About Travel Intention

This survey examined the impact of the pandemic on travel plans, post-pandemic travel intentions, and expenditure plans (as shown in Appendix A Table A3). Respondents were categorized into three phases based on their perception of the pandemic: outbreak (32.2%), stabilization (35.6%), and conclusion (32.3%), ensuring a balanced sample distribution. A significant 89.5% of respondents acknowledged that COVID-19 affected their travel plans, with 86.1% intending to travel within a year. Over half (53.3%) planned to increase their travel spending compared to pre-pandemic levels, while 17.9% expected to maintain their spending, and 15.3% intended to decrease it. Respondents primarily valued tourism for its ability to enhance well-being (22.7%), expand knowledge (20.5%), and provide spiritual experiences (19.8%), reflecting a shift in motivations since the pandemic began.

5.2. Model and Hypotheses Testing

As Henseler et al. (2009) [93] and Hair et al. (2012) [85] proposed, we evaluated the indicator reliability with outer loadings and Cronbach’s α while the internal consistency reliability was assessed with Composite Reliability (CR). Convergent validity was analyzed with both CR and Average Variance Extracted (AVE), while discriminant validity was evaluated by using Average Variance Extracted (AVE) or by using the Heterotrait-monotrait (HTMT) Criterion. All the values were produced with SMARTPLS 4.0.
Table 1 summarizes the test for construct reliability and convergent validity. A total of 17 of the 19 items have outer loadings above 0.7. Only two of them exhibit slightly lower loadings of 0.653 and 0.643 but exceed the minimum cut of 0.5 [94]. Cronbach’s α of every construct in this study is above the threshold of 0.7 [95]. Therefore, the indicator reliability can be confirmed in this study. Meanwhile, all CR values are above 0.7 with a minimum of 0.822, which indicates high internal consistency reliability. In addition, the AVE of each construct exceeds the suggested value of 0.5 with a minimum of 0.538 [96], indicating adequate convergent validity [97].
In terms of discriminant validity, which detects the degree of discrimination between tested variables and constructs, two commonly used methods were used in this study. As suggested by Fornell and Larcker (1981) [96], discriminant validity is obtained when the square root of each Average Variance Extracted (AVE) exceeds the correlation with other latent variables. As shown in Table 2, the square roots of the AVEs are higher than the off-diagonal correlations between the constructs, indicating sufficient levels of discriminant validity. Furthermore, another discriminant validity test was conducted using the Heterotrait-monotrait (HTMT) criterion, which had been proposed by Henseler et al. (2015) [98] and gradually developed as a preferred method for variance-based structural equation modeling (SEM). Table 3 demonstrates the HTMT values between the constructs, which are all below the conservative threshold of 0.85, as stated by Henseler et al. (2015) [98]. In addition, we conducted bootstrapping with 5000 sub-samples and found neither of the confidence interval values was below 1, which provided further support for discriminant validity.
Above all, based on the testing and evaluation, the results demonstrate that the scales used in this study have sufficient construct reliability and validity.
In addition, the PLS method requires no multicollinearity and no bias when assessing data from a composite model population [97]. This study uses variance inflation factor (VIF) values to assess the multicollinearity issues and common method bias (CMB). All constructs exhibit VIF values below the conservative threshold of 3.3, suggesting the absence of multicollinearity issues in the results [99]. The VIF values are summarized in Table 4. Kock (2015) [100] indicates that when all factor-level VIFs from a full collinearity assessment remain at or below 3.3, the model can be considered free from common method bias. In our study, all factor-level VIFs are below this threshold, indicating no evidence of such bias in these data.

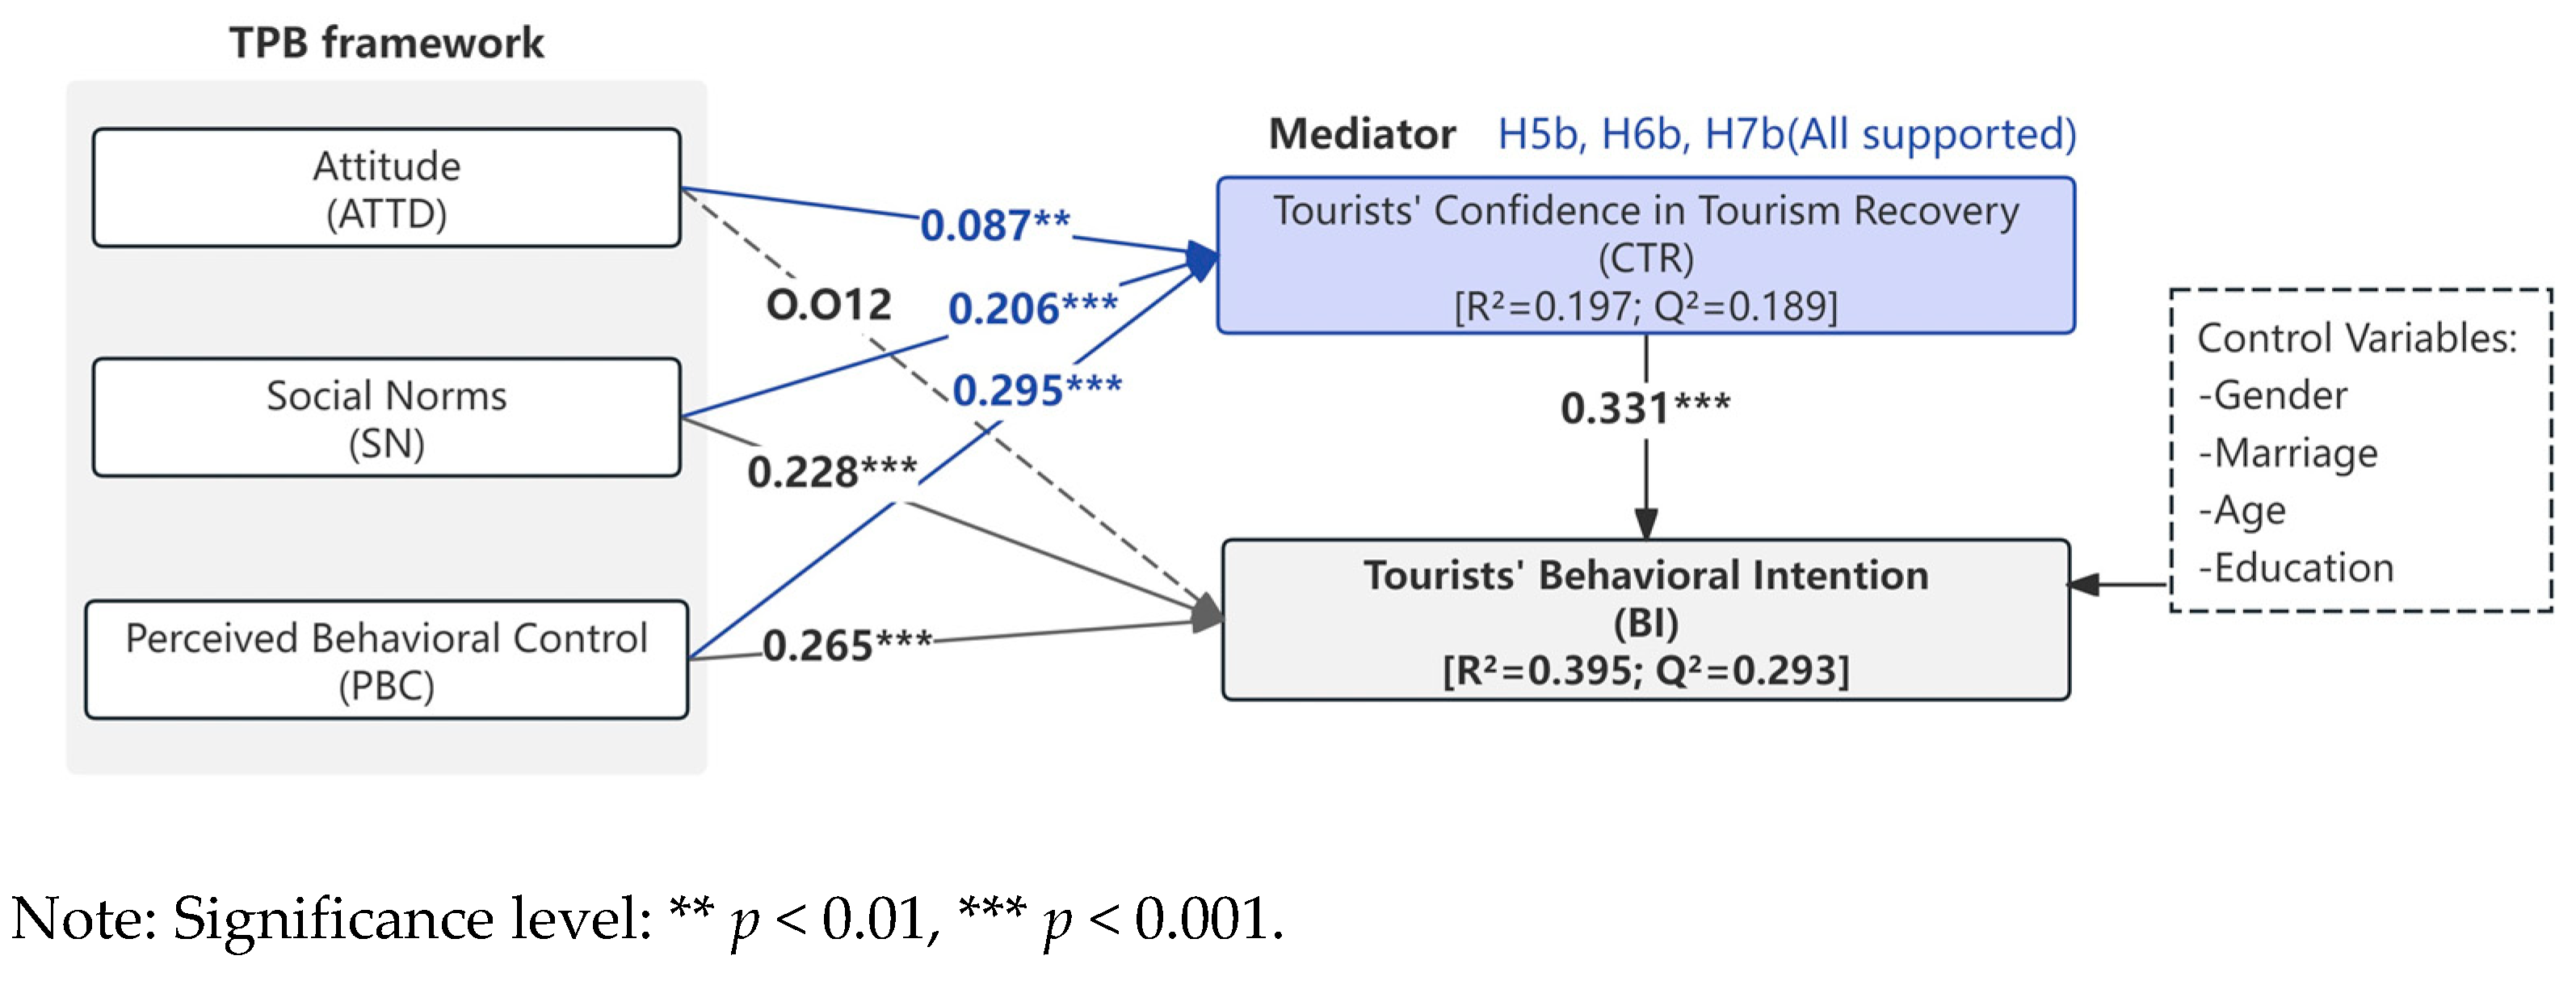
5.2.1. Structural Model

In relation to the evaluation of model fit in PLS path modeling, Henseler and Sarstedt (2013) argue that the Goodness-of-fit (GoF) indices are not appropriate for model validation [101]. However, as Henseler and Sarstedt (2011) suggested in detail, the Standardized Root Mean Square Residual (SRMR) could be used for analyzing the model fit of the Partial Least Squares (PLS) path models, and it was also appropriate for a PLS multi-group study with the same PLS path model [102]. Therefore, this study adopted the SRMR values to assess the adequacy of the model fit. The result shows that the SRMR values for the fully saturated model and the estimated model are 0.056 and 0.062, which are below the threshold of 0.08 and exhibit a satisfactory fit with empirical data [103].
As suggested by Hair et al. (2014), this study used the coefficient of determination (R2) and Stone–Geisser’s Q2 to analyze the explanatory power and predictive relevance of the model [104]. The R2 and Q2 values presented in Table 5 demonstrate the model’s satisfactory explanatory power. The R2 value for BI indicates that its predictors account for 39.5% (>33%) of the variance in this construct, which could be considered moderate. Similarly, the R2 value for CTR shows that 19.7% (>19% and <33%) of its variance is explained by its predictors, which was weak but acceptable. Meanwhile, Q2 values of BI and CTR are both greater than zero, which indicates that the model has predictive relevance.

Path Coefficient Testing

This study employed a bootstrapping method with 5000 resamples to determine the statistical significance of the path coefficients, which are assessed to test the hypothesized relationships between latent variables. The significance level utilized in this research is five, which denotes that the hypothesized relationship is deemed to be significantly influential when the t-value is above 1.96 [97]. As illustrated in Table 6, both SN (β = 0.228, T = 6.491, p < 0.001) and PBC (β = 0.265, T = 7.620, p < 0.001) have a significant and positive relationship with BI, while ATTD (β = 0.012, T = 0.457, p > 0.05) is not statistically related to BI. Therefore, H2 and H3 are supported, while H1 is not supported. Concerning CTR, the findings reveal that CTR has a significant and positive relationship with BI (β = 0.331, T = 9.518, p < 0.001), which confirms H4. In addition, statistics also show that ATTD (β = 0.087, T = 2.902, p < 0.005), SN (β = 0.206, T = 5.519, p < 0.001), PBC (β = 0.295, T = 8.552, p < 0.001) demonstrate a positive relationship with CTR, which support H5a, H6a, and H7a respectively. Above all, Figure 2 shows the hypothetical models.

5.2.2. Mediating Effect of Confidence in Tourism Recovery (CTR)

To verify H5b, H6b, and H7b, the mediating role of CTR in the original framework of TPB, Variance Accounted For (VAF), is introduced in the data analysis (as shown in Table 7). According to Hair et al. (2014) [104], VAF is a crucial metric to qualify the proportion of the total effect that is mediated through the mediator variable. As discussed above, the direct effect of ATTD on BI (H1) is found to be non-significant. When CTR is introduced as a mediator, the indirect effect of ATTD on BI becomes significant. The VAF was calculated to be 71% (larger than 20% but smaller than 80%), revealing that the mediation of CTR on the relationship between ATTD and BI can be confirmed as partial mediation. In other words, 71% of the total effect of ATTD on BI is mediated by CTR, while 29% of the effect is direct. Similarly, when CTR mediates SN and BI, or PBC and BI, VAF values are calculated as 23% and 27%, respectively, which reveals a partial mediation effect as well. Hence, H5b, H6b, and H7b are all supported.

5.3. Multi-Group Comparison

In the current study, we have chosen to employ the MICOM (Measurement Invariance of Composite Models) combined with the IPMA (Importance–Performance Matrix Analysis) method to analyze the differences across different time points. The MICOM procedure allows us to rigorously test for measurement invariance across groups, thereby ensuring that any observed differences in IPMA results are not due to inconsistencies in how constructs are measured over time [97,105]. Following the validation of measurement invariance, we can compare the IPMA results across the three sample groups to gain a deeper understanding of how different variables influence travel intentions during various stages of the pandemic’s development, which is based on the assessment of not only the performance but also relative importance of each construct [106].

5.3.1. Measurement Invariance Testing

First, we paired the three sample groups for pairwise comparisons (see Table 8 for details). Following the MICOM procedure, the first step tested for configural invariance. Since the model’s structure was consistent, this step was fully passed. The second and third steps were analyzed using the permutation MGA results in SmartPLS 4.0. The second step yielded the compositional invariance results, which, as shown in Table 8, were fully passed, with each pairwise comparison achieving partial invariance. The third step provided the mean invariance and variance invariance results, where some variables exhibited significant differences between groups. Based on the results of the second and third steps, we can proceed with the comparison of intergroup differences [105].

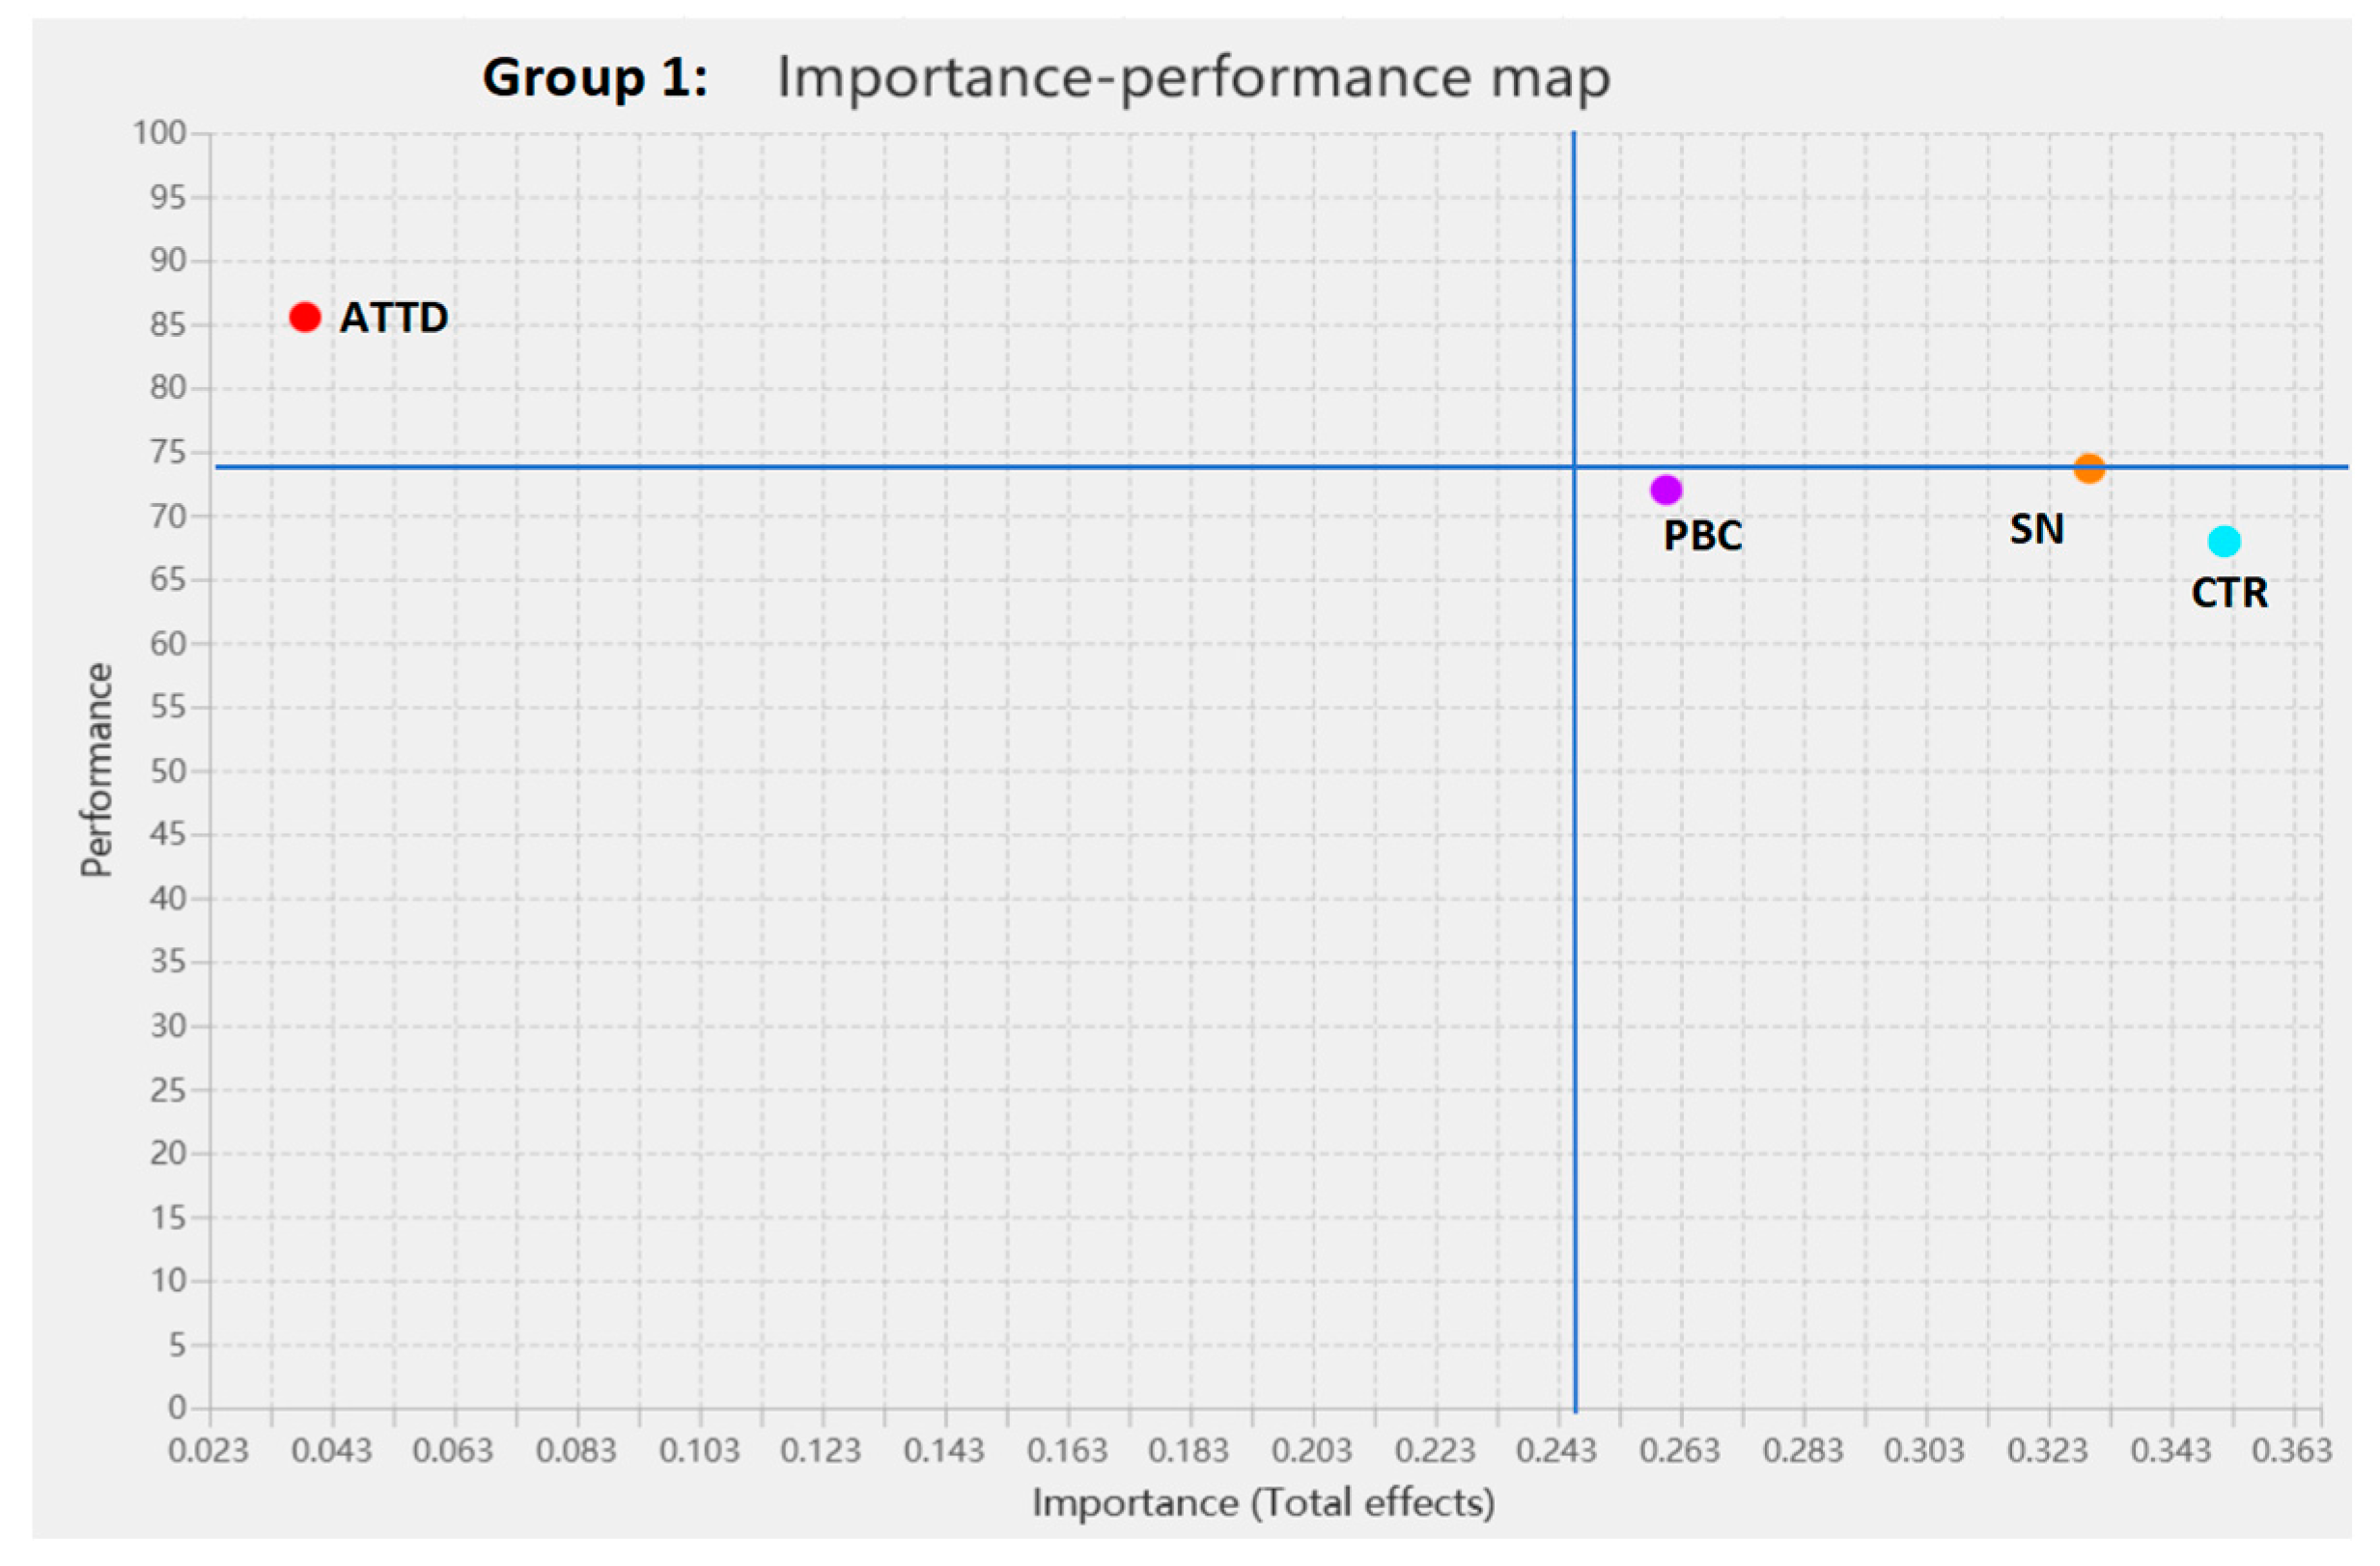
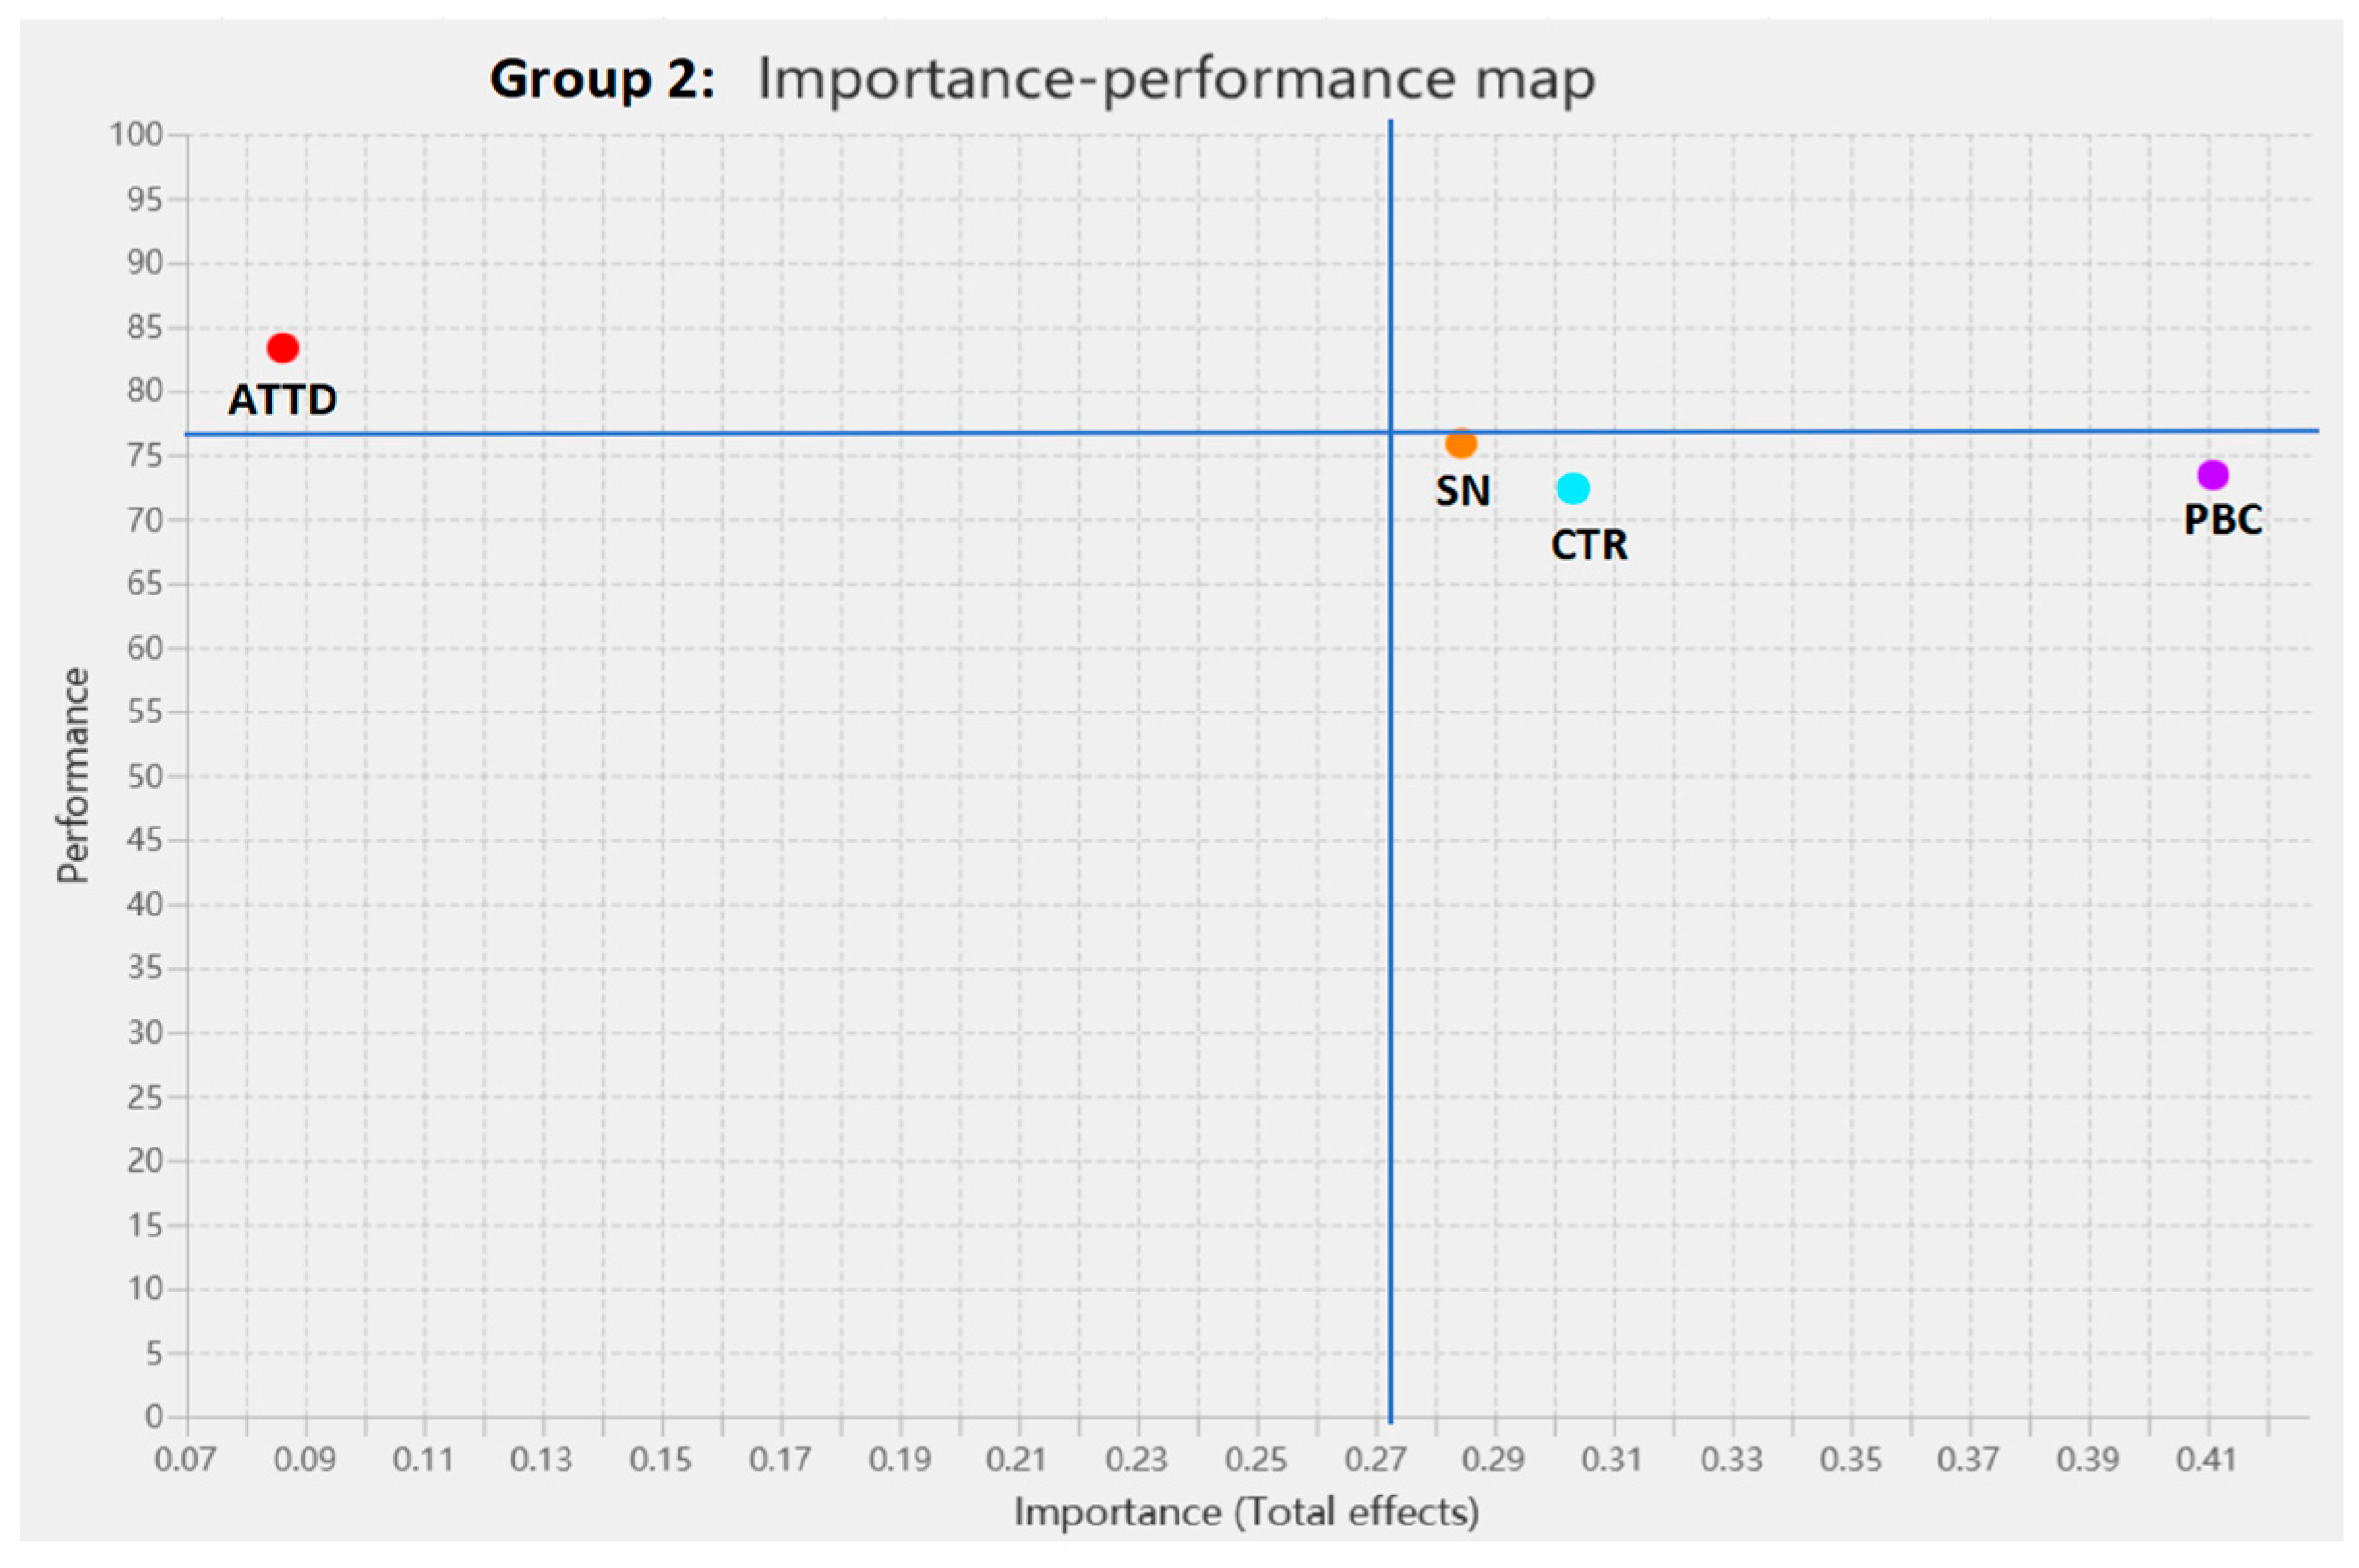
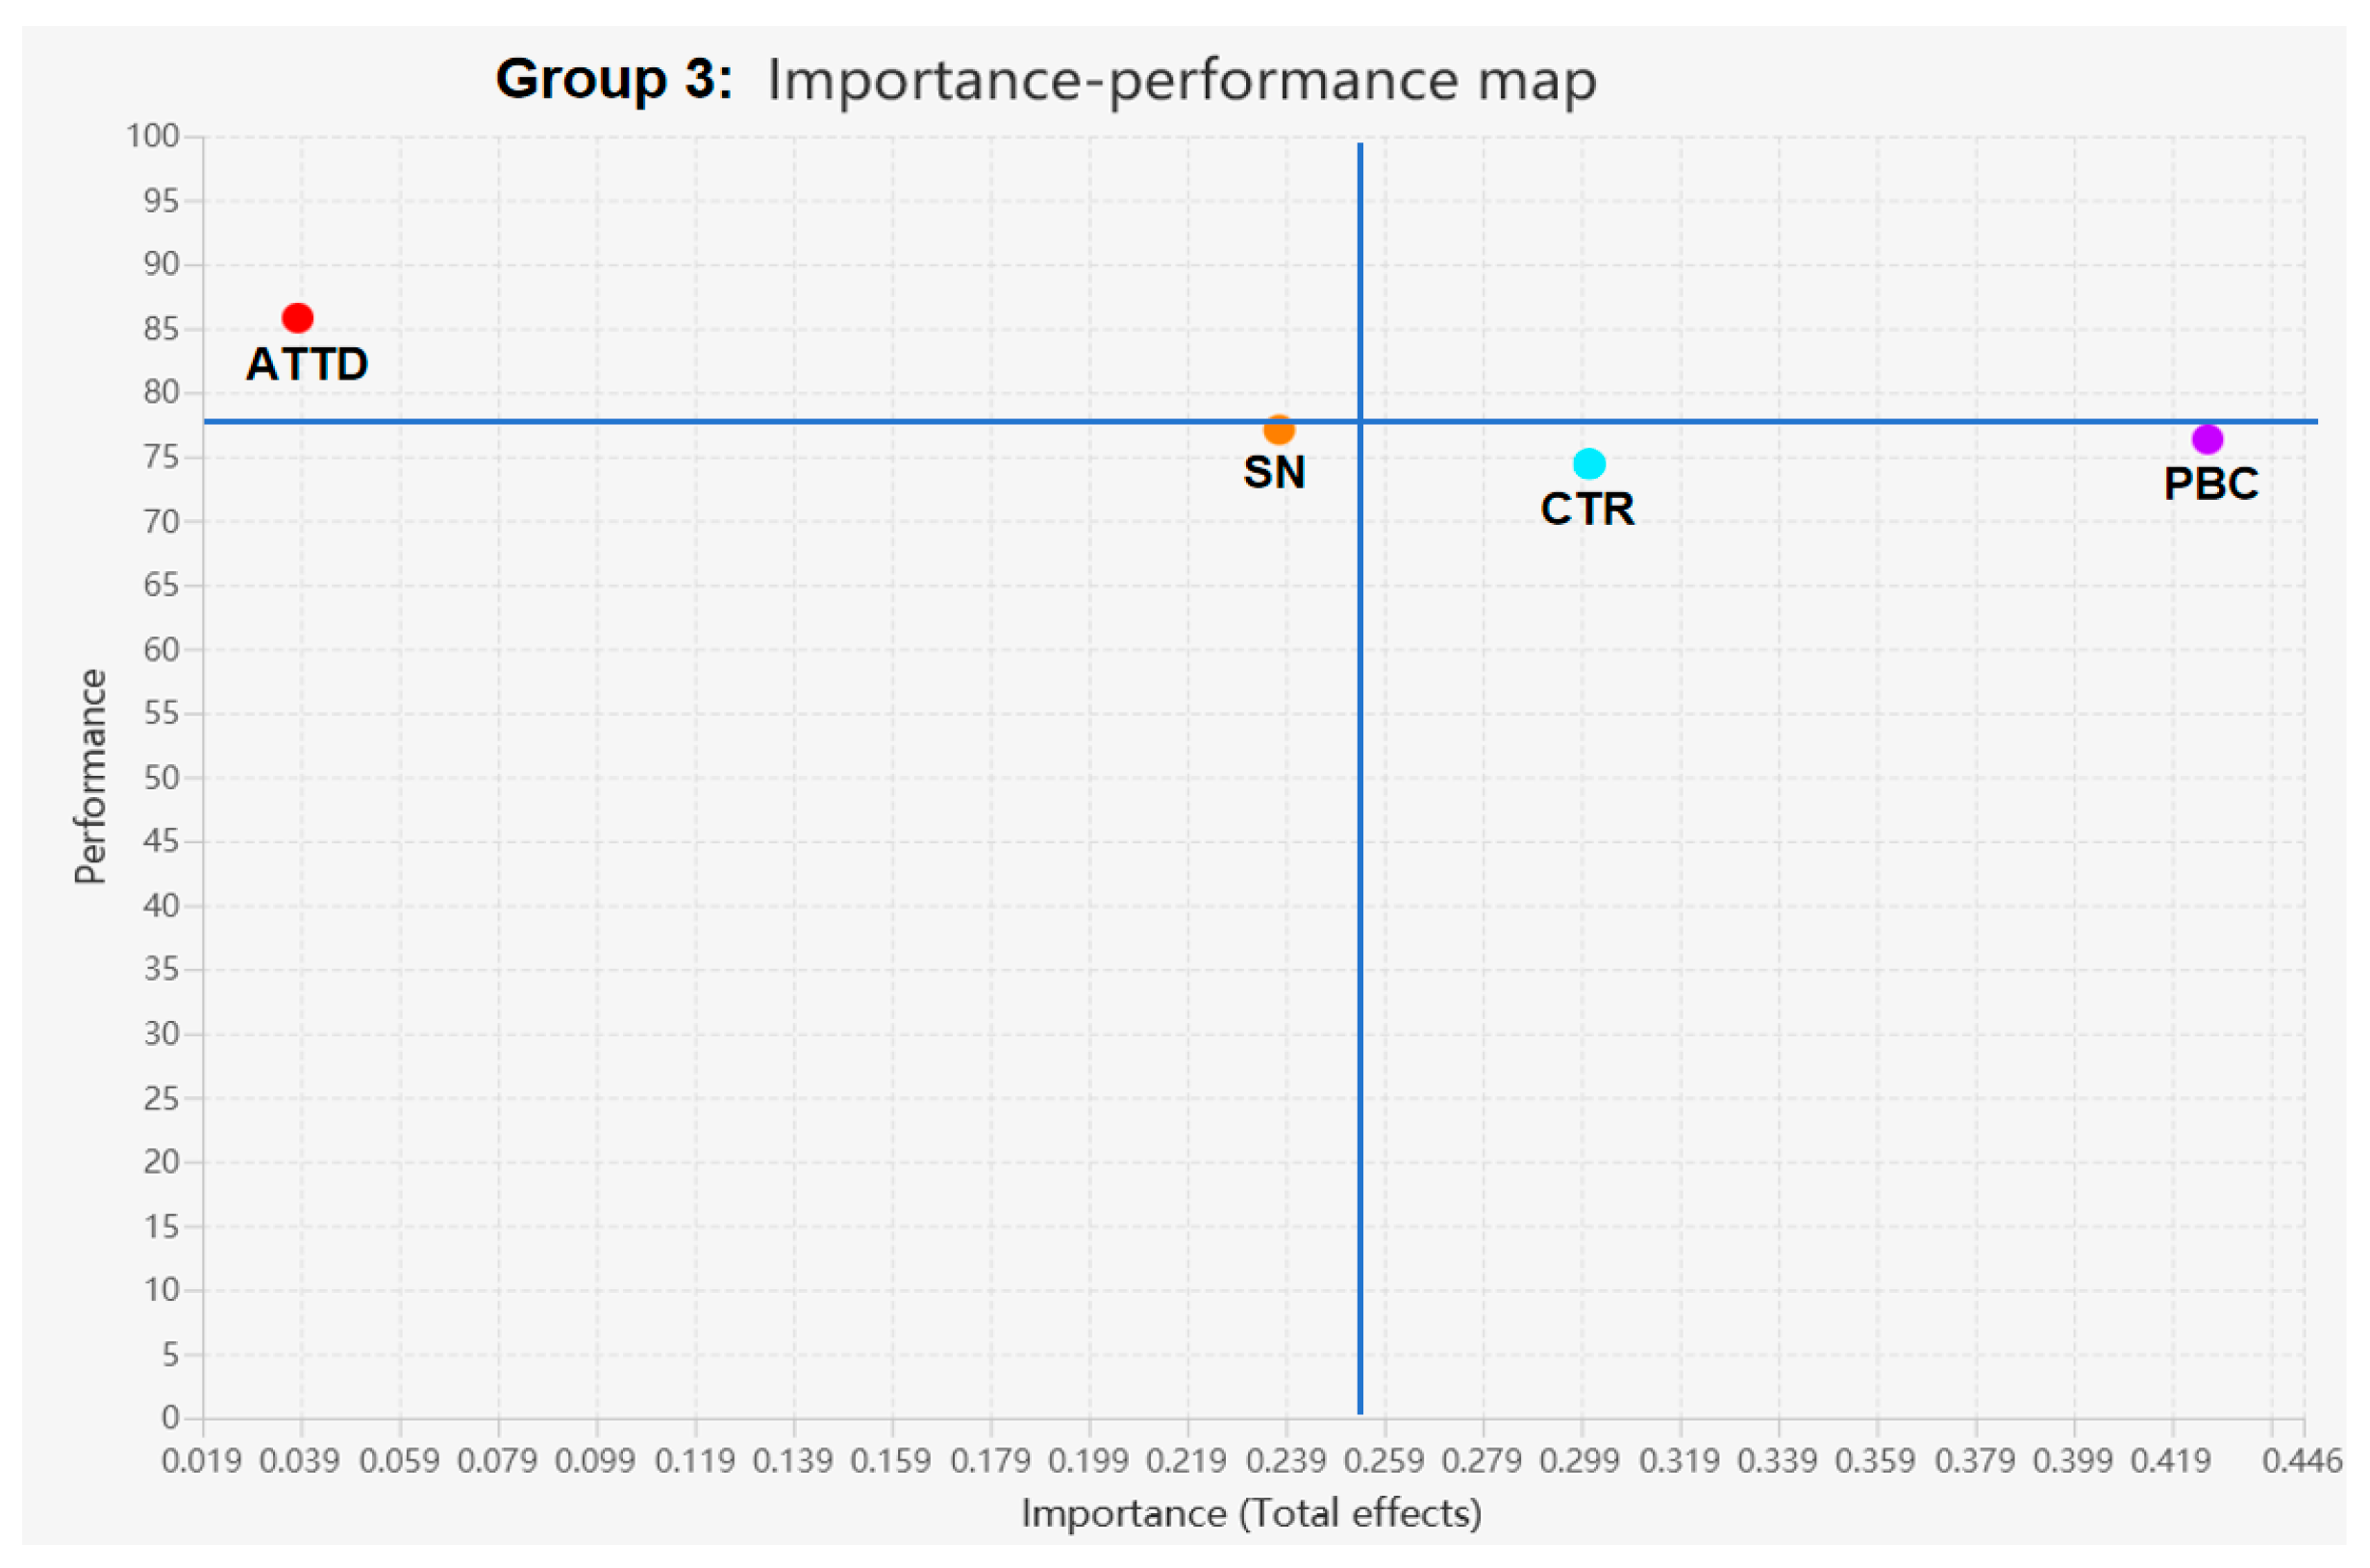
5.3.2. IPMA Analysis and Comparison

Secondly, this study employed the Importance–Performance Map Analysis (IPMA) to understand how the importance and performance of different variables related to travel intentions vary across the three sample groups (as shown in Table 9). The analysis was conducted using SmartPLS 4.0, and the importance scores reflect the relative influence of each variable on tourists’ Behavioral Intentions (BI), while the performance scores represent how well each variable is perceived by the respondents in each group.
Figure 3, Figure 4 and Figure 5 show the IPMA results of Groups 1, 2, and 3, respectively. According to Ringle, et al. (2016) [106] and Irimia-Diéguez, Ana, et al. (2023) [107], when examining the Importance–Performance Map, constructs located in the lower-right quadrant, indicating above-average importance but below-average performance, present the most promising opportunities for improvement. These are followed in priority by constructs in the upper-right, lower-left, and, finally, the upper-left quadrants.
In the first group, representing the perceived pandemic outbreak stage, the variables CTR, PBC, and SN fall into the lower-right quadrant, among which CTR emerged with the highest importance but exhibited relatively low performance. This indicates a critical area for improvement. In the second group, corresponding to the stabilization phase, the variables CTR, PBC, and SN are still located in the lower-right quadrant. In contrast, the importance ranking of the three variables in the lower-right quadrant of the second group has changed, with PBC showing the highest importance, followed by CTR and SN. Finally, the third group, representing the conclusion of the pandemic, saw a shift in importance towards SN, which is located in the lower-left quadrant. PBC and CTR remain in the lower-right quadrant and PBC still calls for the most attention to be improved. The variable ATTD, across the three groups, has consistently remained in the same position in the upper-left quadrant. Above all, these findings suggest that tourism management strategies should be dynamic and responsive to the changing priorities of travelers as the pandemic evolves.

6. Discussion and Implications

This study accomplished two primary research objectives: first, it introduced the concept of Confidence in Tourism Recovery (CTR) as a mediating variable within the Theory of Planned Behavior (TPB) model, investigating how the relationships between Attitude (ATTD), Subjective Norm (SN), and Perceived Behavioral Control (PBC) and travel intentions (BI) change in the context of a public health crisis, such as a pandemic. Second, by comparing samples from different stages of the pandemic, this study provided insights for governments and businesses to develop strategies that adapt to the dynamic changes in tourism demand. The main findings and implications of this study can be summarized as follows.

6.1. Main Findings

6.1.1. Impact of Confidence in Tourism Recovery (CTR) on Travel Intentions

This study empirically confirmed that CTR has a direct positive impact on travel intentions (BI) and serves as a mediator for the effects of ATTD, SN, and PBC on BI. Data from the overall sample demonstrated a strong correlation between CTR and BI, with a path coefficient of 0.331. This indicates that in the specific context of a pandemic, travel intentions are influenced not only by negative factors, such as perceived risk and travel restrictions but also by positive factors, such as confidence in the recovery of the tourism industry. This finding aligns with previous research [30,108]. Enhancing CTR can effectively stimulate travel intentions and aid in the recovery of the tourism industry. Additionally, this study revealed that CTR plays a significant role as a mediator in the pathways by which ATTD, SN, and PBC influence BI. Specifically, CTR accounted for 71% of the effect of ATTD on BI, 23% of the effect of SN on BI, and 27% of the effect of PBC on BI, indicating a strong amplifying effect. This suggests that CTR is a crucial variable for predicting and stimulating travel intentions in the context of a pandemic, as it can enhance the predictive power of traditional TPB variables when they might otherwise fail under such circumstances. Furthermore, because CTR is more susceptible to the influence of industry recovery policies and marketing strategies, this finding is particularly valuable for improving management practices. Across the three groups of samples from different pandemic stages, CTR consistently appeared in the lower-right quadrant of the IPMA analysis, indicating that it is a variable with potential that requires focused improvement.

6.1.2. Impact of Tourism Attitudes on Travel Intentions

This study found that under pandemic conditions, the direct effect of ATTD on BI is not significant, with CTR explaining 71% of the impact of ATTD on BI. This suggests that attitudes toward tourism are relatively stable and long-term, while travel intentions are more dynamic and influenced by a broader range of factors, particularly in crisis contexts. This distinction can help explain why our results show that attitudes did not have a significant direct impact on travel intentions during the pandemic. This finding aligns with Ajzen’s Theory of Planned Behavior (TPB), which suggests that while attitudes are important, their predictive power can vary depending on the context [37]. Juschten et al. (2019) also highlighted that attitudes may not always serve as reliable predictors of intentions, especially in situations where external factors play a dominant role [109].
Additionally, we have found in Multi-Group Analysis (MGA) (see Table 8 for details) that the means and variances of tourism attitudes across the three sample groups showed no significant differences, indicating that attitudes toward tourism did not change with the progression of the pandemic. As for travel intention (the construct BI), the research results revealed significant differences in mean invariance for most group comparisons (p-values below 0.05), indicating that average travel intentions varied across groups. Additionally, the variance invariance test showed that, except for the comparison between Group 2 and Group 3 (p = 0.323), all other group comparisons indicated significant differences in variance, suggesting different levels of variability in travel intentions across groups. These findings highlight how different stages of the pandemic influenced both the average levels and the variability of travel intentions, whereas attitudes toward tourism remained stable. Descriptive statistics from this study indicate that respondents generally held positive attitudes toward travel, with most expressing a willingness to travel post-pandemic and maintain or increase their travel spending. In summary, the introduction of CTR as a mediator provides new insights into how crisis-induced variables can reshape the pathways from attitudes to behavior. It reveals that increasing CTR levels can help positive tourism attitudes translate more quickly into travel intentions, which is crucial for the recovery of tourism consumption post-pandemic.

6.1.3. Impact of Subjective Norms on Travel Intentions

In this study, SN had a significant positive direct effect on BI, with a path coefficient of 0.228. SN represents external influences on travelers, and research has shown that people are aware of pandemic prevention measures, including movement restrictions and social distancing. They may face social pressure, and SN was previously a major driver of travel intentions [16]. This study also confirmed the positive impact of SN on BI in the context of a pandemic. Furthermore, this study examined the mediating role of CTR in the relationship between SN and BI. Enhancing CTR can also increase the influence of SN on BI to some extent.
Additionally, IPMA analysis of three sample groups revealed that the importance of SN in influencing BI gradually decreased from the outbreak to the stabilization and end of the pandemic. However, the differences in performance were not significant. In the IPMA chart, SN shifted from the lower-right quadrant to the lower-left quadrant over time. This trend can be explained by the fact that as the pandemic progressed, individuals relied less on social cues and more on personal confidence in the recovery of the tourism industry and their own ability to travel. This reflects a transition from externally driven behavior (influenced by social pressures) to internally motivated behavior, where individuals make travel decisions based on their personal confidence and risk assessments. This nuanced understanding of the evolving role of SN provides new insights into travel behavior models, particularly during disruptive events such as the pandemic.

6.1.4. Impact of Perceived Behavioral Control on Travel Intentions

This study also found that PBC had a significant positive direct effect on BI, with a path coefficient of 0.265. According to the Theory of Planned Behavior, PBC directly influences behavioral intentions and, subsequently, actual behavior. PBC reflects individuals’ perceived ability and resources to engage in a particular behavior [20]. This study further confirmed the mediating effect of CTR through empirical data. This suggests that when travelers’ confidence in the recovery of the tourism industry increases, this confidence can alleviate their concerns about risk, enhance their PBC, and, in turn, strengthen their travel intentions. The IPMA analysis of the three sample groups also revealed that the importance of PBC in influencing BI increased from the outbreak to the stabilization and end of the pandemic. However, the differences in performance were not significant. This trend was the opposite of SN. In the IPMA chart, PBC consistently appeared in the lower-right quadrant, with its importance ranking first in the second and third groups, indicating that it is the most promising variable requiring improvement.

6.2. Managerial Implication

This study empirically verified the importance of CTR in restoring travel intentions and demonstrated the dynamic changes in factors influencing travel intentions across different stages of the pandemic through data tracking. These findings provide significant insights for government agencies and tourism enterprises. Based on this, we summarize the policies and measures that governments and businesses can adopt at different stages of the pandemic as follows:

6.2.1. Policies and Measures during the Outbreak Stage

During the initial outbreak stage, government control measures were intensified, and travelers’ perceived risk of travel significantly increased. The tourism industry was severely affected, and travelers developed strong doubts about the safety of tourism activities, leading to widespread cancellations and postponements [110]. At this stage, travelers’ confidence in tourism recovery was at its lowest. However, this study’s findings indicate that CTR at this stage had the greatest potential for improvement. According to IPMA analysis, CTR was the variable most in need of policy intervention, followed by SN and PBC.
From a government perspective, implementing strict and effective travel restrictions, quarantine requirements, and public health measures can build traveler trust and enhance CTR levels. This will lay a solid foundation for travelers to rebuild confidence and resume travel activities post-pandemic. Additionally, government financial support and subsidies for the tourism industry, along with public promotion of the industry’s recovery potential and positive outlook, can also enhance CTR levels, contributing to the recovery of the tourism market post-pandemic. In response to COVID-19, fiscal support measures were taken by the government for tourism businesses during the outbreak stage, including tax reductions and exemptions. However, there was a lack of sustained support to ensure the industry’s full recovery. Additionally, government agencies might overlook promoting the recovery potential of the tourism sector to travelers, which is critical for maintaining their confidence. These are areas that should be addressed and improved in the future.
From a business perspective, adopting flexible cancellation and refund policies during the crisis can help travelers mitigate economic losses due to force majeure and establish a responsible corporate image. By improving CTR levels, businesses can reduce the negative psychological impact of the crisis on travelers. Furthermore, tourism enterprises should actively cooperate with the government in implementing strict sanitation and safety protocols, showcasing their crisis management capabilities and positive public brand image. This not only enhances CTR but also improves SN and PBC levels, mitigating the negative effects of the crisis.

6.2.2. Policies and Measures during the Stabilization Stage

As the pandemic is brought under a certain level of control, travelers’ confidence gradually begins to recover. Kock et al. (2020) found that during this stage, travelers start reconsidering short-distance travel and domestic tourism [111]. The IPMA analysis results of this study indicate that at this stage, the importance of PBC surpassed CTR, ranking first, with CTR second and SN third. The findings suggest that during this stage, people are more concerned about whether they can successfully engage in tourism activities. While CTR levels improved, their importance diminished.
From a government perspective, travel restrictions can be gradually relaxed, starting with short-distance and domestic tourism activities and progressively reopening low-risk tourist destinations. Additionally, special funds and support programs can be introduced to encourage tourism enterprises to develop safer and more innovative tourism products in response to market changes.
From a business perspective, the development and promotion of “safe travel” brands, such as small group tours, customized private tours, and outdoor wellness tours, can meet travelers’ safety needs. Utilizing social media and digital platforms to strengthen communication with potential tourists, and sharing safe travel cases and positive reviews can enhance trust. These measures can more effectively improve PBC and CTR levels, thereby maintaining and stimulating tourism demand, which is beneficial for the sustainable recovery of the tourism market.

6.2.3. Policies and Measures during the Post-Pandemic Stage

Once the pandemic is effectively controlled or ends, travelers’ confidence will quickly rebound. Related research indicates that during this stage, travel intentions increase significantly, especially for long-distance and international travel [8]. However, behavioral patterns and preferences may undergo long-term changes, such as a greater focus on health and safety and a preference for more personalized travel experiences [47]. Descriptive statistics and IPMA analysis of this study show that during this stage, PBC and CTR remain key variables requiring improvement, while the importance of SN in influencing travel intentions diminishes. Travelers are more focused on meeting and fulfilling their travel needs.
From a government perspective, once the pandemic is under control, full-scale resumption of domestic and international tourism activities should be implemented, with all remaining travel restrictions lifted. A long-term but agile public crisis response mechanism should be established to address the uncertainty of future crises. Additionally, collaborating with international organizations and other countries to promote safe international travel and attract foreign tourists back to the domestic market can help quickly rebuild confidence among international and domestic tourists, making it easier to translate travel intentions into travel behavior. At the same time, during the next crisis, these measures can help reduce the negative effects of anxiety and fear. Furthermore, government agencies should formulate long-term strategies focused on sustainable tourism recovery. These may include Infrastructure investment to support evolving traveler needs, talent development programs to ensure the sector remains competitive, and market promotion aimed at highlighting the resilience and adaptability of the tourism sector, helping to solidify the recovery process.
From a business perspective, attention should be paid to the long-term impact of the pandemic on tourism demand, including shifts in travelers’ habits and preferences. Developing health-focused and personalized tourism products is essential. Our research shows that travelers are still very concerned about the safety of travel during this stage. Therefore, reinforcing the brand’s safety and reliability image has a greater impact on travelers. Additionally, given the continued influence of CTR during this stage, tourism enterprises can introduce new technologies and services, such as virtual reality experiences and intelligent travel guides, to enhance the overall experience of tourists and improve CTR levels, thereby strengthening relationships with travelers.
In conclusion, through these measures, governments and businesses can effectively boost traveler confidence at different stages of the pandemic, driving the sustained recovery and development of the tourism industry.

7. Conclusions, Limitations and Future Research

This study explores the mediating role of Confidence in Tourism Recovery (CTR) in the relationship between Tourism Attitude (ATTD), Subjective Norm (SN), Perceived Behavioral Control (PBC), and Behavioral Intention (BI) to travel in the context of the pandemic. The findings reveal that CTR has a significant positive impact on travel intentions and serves as a key mediator in the pathways between ATTD, SN, and PBC toward BI, especially when attitudes exert a weaker influence on travel intentions. Moreover, this study, through data analysis across different pandemic stages, demonstrates that the influence of CTR, SN, and PBC on travel intentions changes dynamically as the pandemic progresses. The results provide governments and tourism enterprises with valuable insights for formulating targeted recovery strategies and marketing approaches at various stages of the pandemic, emphasizing the importance of enhancing travelers’ confidence in the industry’s recovery. By implementing effective policies and measures, governments and businesses can boost traveler confidence across different phases of the pandemic, thereby promoting the sustained recovery and development of the tourism industry.
Despite the efforts made in this study to accurately reflect the real conditions of the pandemic in the research design, data collection, and analysis, with the aim of capturing respondents’ genuine psychological responses, there are areas for improvement concerning the randomness and representativeness of the sample. For example, the final sample contained a higher proportion of female respondents compared to male respondents. Although age variables were controlled for, minor biases still exist. Future research could aim to control gender ratios to match real population distributions better. Furthermore, although three rounds of surveys were conducted to capture people’s psychological feedback at different stages of the pandemic, the unpredictability of pandemic phases—along with regional differences in progression—may have led to some biases. Specifically, the transition from the stabilization phase to the end of the pandemic was relatively brief, potentially missing some critical findings. Future research could consider collecting data six months, one year, and two years after the pandemic’s conclusion to track psychological changes during tourism recovery and explore the dynamic changes in the mechanisms influencing travel intentions in the post-pandemic era, thereby extending the results of this study.

Author Contributions

Conceptualization, J.C., X.H., and L.S.; Methodology, L.S.; Software, L.S.; Formal analysis, L.S., J.C., and X.H.; Investigation, L.S.; Resources, J.C. and X.H.; Data curation, L.S.; Writing—original draft preparation, L.S.; Writing—review and editing, J.C. and X.H.; Visualization, L.S.; Supervision, J.C. and X.H. All authors have read and agreed to the published version of the manuscript.

Funding

This research received no external funding.

Institutional Review Statement

This study has received an exemption from ethics approval from Beijing Technology and Business University since it was categorized as a non-interventional survey and a minimal-risk study according to the above-mentioned institution.

Informed Consent Statement

In accordance with ethical requirements, informed consent was obtained from all participants involved in this study.

Data Availability Statement

Data that support the findings of this study are available from the corresponding author upon request. Due to privacy concerns and restrictions imposed by the online survey platform, which requires user authentication for access, the raw survey data cannot be made publicly available.

Acknowledgments

The authors acknowledge the “Credamo Data Platform” in China for providing professional online survey tools and data collection services. The authors would like to extend their sincere appreciation to Han Huilin and Yu Shuyang from Beijing Open University for their valuable exchange of ideas that contributed to this study. In addition, the authors offer special thanks to ChatGPT for its assistance in language editing and proofreading during the preparation of the manuscripts.

Conflicts of Interest

The authors declare no conflict of interest.

Appendix A

Table A1. Constructs and Measurement Items.
Constructs (Latent Variables)ItemsMeasurementReference
Attitude (ATTD)Conceptualization: There are differences in people’s attitudes towards travel activities. As a tourist, to what extent do you agree with the following statements about travel attitudes?
ATTD1I think travel activities are helpful to me[77,78]
ATTD2I think travel activities can make me happy.
ATTD3I think travel activities can enrich my life experience.
Subjective Norms (SN)Conceptualization: When people travel, they often consider the opinions and ideas of people or institutions that are important to them, which we call subjective norms. To what extent do you agree with the following statements about subjective norms?
SN1I prefer to travel if those who are important to me (family, friends, colleagues, neighbors, etc.) approve of my travel.[29,78]
SN2I prefer to travel if those who are important to me (family, friends, colleagues, neighbors, etc.) allow me to travel.
SN3I prefer to travel if those who are important to me (family, friends, colleagues, neighbors, etc.) give me time or money to support me.
Perceived Behavioral Control (PBC)Conceptualization: When people travel, they often consider their own conditions and the control of future behavior, which we call perceived behavioral control. To what extent do you agree with the following statement about perceived behavioral control?
PBC1I have the basic conditions to travel (such as my income, time, and health conditions allow me to travel)
PBC2I can make travel preparations according to the epidemic situation at the destination (such as preparing epidemic prevention items and accordingly making travel arrangements).[29]
PBC2I can deal with all kinds of emergencies related to the epidemic in the process of traveling (such as medical treatment due to infection, temporary closure of scenic spots, cancellation of tourist activities, etc.).
PBC3I can bear the consequences of the epidemic during the trip (such as the health impact and additional medical expenses caused by the infection during the trip, the material and spiritual losses caused by the cancellation of travel activities, and other additional losses caused by other emergencies).
Confidence in Tourism Recovery (CTR)Conceptualization: Are you confident about the recovery of the tourism industry? To what extent do you agree with the following statements about the restoration of confidence in the tourism industry?
CTR1I think the tourism industry will recover quickly after the epidemic.[80,81,82]
CTR2I believe that the government’s policies and measures for the revitalization and recovery of tourism will promote the rapid recovery of tourism.
CTR3I think the scale of tourism will quickly recover to the level before the epidemic (2019).
CTR4I think the ability of tourism enterprises to provide products will recover quickly.
CTR5If I were an investor, I would buy shares of listed companies in the tourism industry.
Behavioral Intention (BI)Conceptualization: (In Chinese, the concept of travel intentions could be understood literally; thus no extra explanation here). To what extent do you agree with the following statements about travel intentions?
BI1Although affected by the epidemic, I have plans to travel.[78,79]
BI2I will go out to travel recently.
BI3I will encourage and support people around me to travel.
BI4I would recommend tourist destinations to people around.
Table A2. Respondents’ profile.
CharacteristicsClassification FrequencyPercentage
GenderMale30129.3%
Female72570.7%
Marital StatusUnmarried40339.3%
Married61359.7%
Others (divorced, separated, or widowed)101%
Age (years)<20545.3%
21–3045844.6%
31–4041140.1%
41–50666.4%
51–60353.4%
>6020.2%
Education LevelSecondary school and below80.8%
High school/Technical school/Vocational school292.8%
Technical college939.1%
Undergraduate college66464.7%
Graduate college23222.6%
OccupationGovernment agency/institution official171.7%
Government agency/institution staff464.5%
State-owned business/enterprise manager10610.3%
State-owned business/enterprise staff10510.2%
Private or foreign-funded business/enterprise manager22421.8%
Private or foreign-funded business/enterprise manager staff19719.2%
Professional/technician/teacher/doctor/lawyer868.4%
Private business owner272.6%
Self-employed222.1%
Farmer 10.1%
Student 18117.6%
Retiree40.4%
Others101%
Family Member1 person282.7%
2 people555.4%
3 people36335.4%
4 people30930.1%
5 people18417.9%
6 people686.6%
More than 6 people191.9%
Average Monthly Household IncomeLess than 3000 yuan191.9%
3001–6000 yuan777.5%
6001–9000 yuan11611.3%
9001–12,000 yuan10510.2%
12,001–15,000 yuan12211.9%
15,001–18,000 yuan11711.4%
18,001–21,000 yuan12812.5%
21,001–24,000 yuan878.5%
24,001–27,000 yuan494.8%
27,001–30,000 yuan727%
More than 30,000 yuan13413.1%
Table A3. General information about travel intention.
QuestionsOptionsFrequencyPercentage
In which phase of the epidemic do you believe your city is presently situated?The outbreak33032.2%
The stabilization36535.6%
The conclusion33132.3%
Has the COVID-19 pandemic had an impact on your travel arrangements or the execution of your travel plans?Yes91889.5%
No10810.5%
How soon will you travel?Within a month14113.7%
Within one to three months36235.3%
Within three months to one year38137.1%
A year later979.5%
No plan454.4%
How will your expenses change if you travel compared to before the epidemic?Increase 54753.3%
Reduce 15715.3%
Unchanged18417.9%
Not sure939.1%
Missing 454.4%
* What do you believe you can benefit from traveling?Pleasure body and mind93922.70%
(91.50%)
Obtain spiritual experience81819.80%
(79.70%)
Increase knowledge and expand the horizon84820.50%
(82.70%)
Improve relationships with friends and family65415.80%
(63.70%)
Fulfill the intention of rest and vacation44710.80%
(43.60%)
Improve one’s social status1413.40%
(13.70%)
Expand the circle of friends2836.80%
(27.60%)
Others20.00%
(0.20%)
Note: The question marked with “*” is a multiple-choice question. The unenclosed percentage number denotes the proportion of selecting a particular option’s frequency in relation to the entire frequency, while the percentage in bracket signifies a particular option’s frequency in relation to the total number of respondents.

References

  1. UNWTO. Available online: https://www.unwto.org/news/international-tourism-to-reach-pre-pandemic-levels-in-2024 (accessed on 17 August 2024).
  2. UNWTO. Available online: https://www.unwto.org/news/tourism-recovery-gains-momentum-as-restrictions-ease-and-confidence-returns (accessed on 17 August 2024).
  3. UNWTO. Available online: https://www.unwto.org/news/tourist-numbers-down-83-but-confidence-slowly-rising (accessed on 17 August 2024).
  4. UN. Available online: https://news.un.org/en/story/2024/08/1152866 (accessed on 17 August 2024).
  5. WHO. Available online: https://www.who.int/news/item/14-08-2024-who-director-general-declares-mpox-outbreak-a-public-health-emergency-of-international-concern (accessed on 17 August 2024).
  6. Seyfi, S.; Kuhzady, S.; Rastegar, R.; Vo-Thanh, T.; Zaman, M. Exploring the dynamics of tourist travel intention before and during the COVID-19 pandemic: A scoping review. Tour. Recreat. Res. 2024, 3, 1–14. [Google Scholar] [CrossRef]
  7. Wu, H.; Cao, Q.; Mao, J.M.; Hu, H.L. The effect of information overload and perceived risk on tourists’ intention to travel in the post-COVID-19 pandemic. Front. Psychol. 2022, 13, 1000541. [Google Scholar] [CrossRef] [PubMed]
  8. Aziz, N.A.; Long, F. To travel, or not to travel? The impacts of travel constraints and perceived travel risk on travel intention among Malaysian tourists amid the COVID-19. J. Consum. Behav. 2022, 21, 352–362. [Google Scholar] [CrossRef] [PubMed]
  9. Plank, P.A.; Gomes, L.F.; Caldas, P.; Varela, M.; Ferreira, D.C. Assessing the Traveling Risks Perceived by South African Travelers during Pandemic Outbreaks: The Case of COVID-19. Sustainability 2023, 15, 9267. [Google Scholar] [CrossRef]
  10. Fuchs, G.; Efrat-Treister, D.; Westphal, M. When, where, and with whom during crisis: The effect of risk perceptions and psychological distance on travel intentions. Tour. Manag. 2024, 100, 104809. [Google Scholar] [CrossRef]
  11. Luo, J.M.; Lam, C.F. Travel Anxiety, Risk Attitude and Travel Intentions towards “Travel Bubble” Destinations in Hong Kong: Effect of the Fear of COVID-19. Int. J. Environ. Res. Public Health 2020, 17, 7859. [Google Scholar] [CrossRef]
  12. Kim, E.E.K.; Seo, K.; Choi, Y. Compensatory Travel Post COVID-19: Cognitive and Emotional Effects of Risk Perception. J. Travel Res. 2022, 61, 1895–1909. [Google Scholar] [CrossRef]
  13. Hüsser, A.P.; Ohnmacht, T. A comparative study of eight COVID-19 protective measures and their impact on swiss tourists’ travel intentions. Tour. Manag. 2023, 97, 104734. [Google Scholar] [CrossRef] [PubMed]
  14. Wang, L.-H.; Yeh, S.-S.; Chen, K.-Y.; Huan, T.-C. Tourists’ travel intention: Revisiting the TPB model with age and perceived risk as moderator and attitude as mediator. Tour. Rev. 2022, 77, 877–896. [Google Scholar] [CrossRef]
  15. Rimal, R.N.; Real, K. Perceived Risk and Efficacy Beliefs as Motivators of Change: Use of the Risk Perception Attitude (RPA) Framework to Understand Health Behaviors. Hum. Commun. Res. 2003, 29, 370–399. [Google Scholar] [CrossRef]
  16. Bae, S.Y.; Chang, P.J. The effect of coronavirus disease-19 (COVID-19) risk perception on behavioural intention towards ‘untact’ tourism in South Korea during the first wave of the pandemic (March 2020). Curr. Issues Tour. 2021, 24, 1017–1035. [Google Scholar] [CrossRef]
  17. Rather, R.A. Monitoring the impacts of tourism-based social media, risk perception and fear on tourist’s attitude and revisiting behaviour in the wake of COVID-19 pandemic. Curr. Issues Tour. 2021, 24, 3275–3283. [Google Scholar] [CrossRef]
  18. Bicchieri, C.; Dimant, E. Nudging with care: The risks and benefits of social information. Public Choice 2022, 191, 443–464. [Google Scholar] [CrossRef]
  19. Fishbein, M.; Ajzen, I. Belief, Attitude, Intention, and Behavior: An Introduction to Theory and Research; Addison-Wesley Pub. Co.: Reading, MA, USA, 1975; pp. 405–410. [Google Scholar]
  20. Ajzen, I. The theory of planned behavior. Organ. Behav. Hum. Decis. Process. 1991, 50, 179–211. [Google Scholar] [CrossRef]
  21. Zeithaml, V.A.; Berry, L.L.; Parasuraman, A. The behavioral consequences of service quality. J. Mark. 1996, 60, 31–46. [Google Scholar] [CrossRef]
  22. Oliver, R.L. Satisfaction: A Behavioral Perspective on the Consumer: A Behavioral Perspective on the Consumer. Routledge: New York, NY, USA, 2014; pp. 56–78.
  23. Hyun, S.S.; Kim, W.; Lee, M.J. The impact of advertising on patrons’ emotional responses, perceived value, and behavioral intentions in the chain restaurant industry: The moderating role of advertising-induced arousal. Int. J. Hosp. Manag. 2011, 30, 689–700. [Google Scholar] [CrossRef]
  24. Fard, M.H.; Sanayei, A.; Ansari, A. Determinants of Medical Tourists’ Revisit and Recommend Intention. Int. J. Hosp. Tour. Adm. 2019, 22, 429–454. [Google Scholar] [CrossRef]
  25. Khan, R.; Awan, T.M.; Fatima, T.; Javed, M. Driving forces of green consumption in sharing economy. Manag. Environ. Qual. 2021, 32, 41–63. [Google Scholar] [CrossRef]
  26. Chen, C.F.; Tsai, D. How destination image and evaluative factors affect behavioral intentions? Tour. Manag. 2007, 28, 1115–1122. [Google Scholar] [CrossRef]
  27. Gohary, A.; Pourazizi, L.; Madani, F.; Chan, E.Y. Examining Iranian tourists’ memorable experiences on destination satisfaction and behavioral intentions. Curr. Issues Tour. 2018, 23, 131–136. [Google Scholar] [CrossRef]
  28. Tzetzis, G.; Alexandris, K.; Kapsampeli, S. Predicting visitors’ satisfaction and behavioral intentions from service quality in the context of a small-scale outdoor sport event. Int. J. Event Festiv. Manag. 2014, 5, 4–21. [Google Scholar] [CrossRef]
  29. Lam, T.; Hsu, C.H. Predicting behavioral intention of choosing a travel destination. Tour. Manag. 2006, 27, 589–599. [Google Scholar] [CrossRef]
  30. Quintal, V.A.; Lee, J.A.; Soutar, G.N. Risk, uncertainty and the theory of planned behavior: A tourism example. Tour. Manag. 2010, 31, 797–805. [Google Scholar] [CrossRef]
  31. Prayag, G. Tourists’ evaluations of destination image, satisfaction, and future behavioral intentions—The case of Mauritius. J. Travel Tour. Mark. 2009, 26, 836–853. [Google Scholar] [CrossRef]
  32. Golets, A.; Farias, J.; Pilati, R.; Costa, H. COVID-19 pandemic and tourism: The impact of health risk perception and intolerance of uncertainty on travel intentions. Curr. Psychol. 2023, 42, 2500–2513. [Google Scholar] [CrossRef] [PubMed]
  33. Lam, T.; Hsu, C.H.C. Theory of planned behaviour: Potential travelers from China. J. Hosp. Tour. 2004, 28, 463–482. [Google Scholar] [CrossRef]
  34. Sparks, B. Planning a wine tourism vacation? Factors that help to predict tourist behavioral intentions. Tour. Manag. 2007, 28, 1180–1192. [Google Scholar] [CrossRef]
  35. Han, H.; Hsu, L.T.J.; Sheu, C. Application of the theory of planned behavior to green hotel choice: Testing the effect of environmental friendly activities. Tour. Manag. 2010, 31, 325–334. [Google Scholar] [CrossRef]
  36. Seow, A.N.; Choong, Y.O.; Moorthy, K.; Chan, L.M. Intention to visit Malaysia for medical tourism using the antecedents of Theory of Planned Behaviour: A predictive model. Int. J. Tour. Res. 2017, 19, 383–393. [Google Scholar] [CrossRef]
  37. Ajzen, I. The theory of planned behavior: Frequently asked questions. Hum. Behav. Emerg. Technol. 2020, 2, 314–324. [Google Scholar] [CrossRef]
  38. Yuzhanin, S.; Fisher, D. The efficacy of the theory of planned behavior for predicting intentions to choose a travel destination: A review. Tour. Rev. 2016, 71, 135–147. [Google Scholar] [CrossRef]
  39. Fan, X.; Lu, J.; Qiu, M.; Xiao, X. Changes in travel behaviors and intentions during the COVID-19 pandemic and recovery period: A case study of China. J. Outdoor Recreat. Tour. 2023, 41, 100522. [Google Scholar] [CrossRef] [PubMed]
  40. Seçilmiş, C.; Özdemir, C.; Kılıç, İ. How travel influencers affect visit intention? The roles of cognitive response, trust, COVID-19 fear and confidence in vaccine. Curr. Issues Tour. 2022, 25, 2789–2804. [Google Scholar] [CrossRef]
  41. Nguyen, H.M.; Phuc, H.N.; Tam, D.T. Travel intention determinants during COVID-19: The role of trust in government performance. J. Innov. Knowl. 2023, 8, 100341. [Google Scholar] [CrossRef]
  42. Wattel, H.L. Review of The Powerful Consumer: Psychological Studies of the American Economy; The Consumer’s Manifesto: A Bill of Rights to Protect the Consumer in the Wars Between Capital and Labor, by G. KATONA & M. PEI. Soc. Res. 1961, 28, 242–244. [Google Scholar]
  43. Dees, S.; Brinca, P.S. Consumer confidence as a predictor of consumption spending: Evidence for the United States and the Euro area. Int. Econ. 2013, 134, 693–704. [Google Scholar] [CrossRef]
  44. Prideaux, B. The need to use disaster planning frameworks to respond to major tourism disasters. J. Travel Tour. Mark. 2004, 15, 281–298. [Google Scholar] [CrossRef]
  45. Walters, G.; Mair, J.; Lim, J. Sensationalist media reporting of disastrous events: Implications for tourism. J. Hosp. Tour. Manag. 2016, 28, 3–10. [Google Scholar] [CrossRef]
  46. Kani, Y.; Aziz, Y.A.; Sambasivan, M.; Bojei, J. Antecedents and outcomes of destination image of Malaysia. J. Hosp. Tour. Manag. 2017, 32, 89–98. [Google Scholar] [CrossRef]
  47. Zenker, S.; Kock, F. The coronavirus pandemic–A critical discussion of a tourism research agenda. Tour. Manag. 2020, 81, 104164. [Google Scholar] [CrossRef]
  48. Assaf, A.; Scuderi, R. COVID-19 and the recovery of the tourism industry. Tour. Econ. 2020, 26, 731–733. [Google Scholar] [CrossRef]
  49. Yeh, S.S. Tourism recovery strategy against COVID-19 pandemic. Tour. Recreat. Res. 2020, 46, 188–194. [Google Scholar] [CrossRef]
  50. Ruan, W.Q.; Yang, T.T.; Zhang, S.N. Restoration path of small tourism enterprise managers’ confidence in the COVID-19 period. J. Travel Tour. Mark. 2022, 39, 137–151. [Google Scholar] [CrossRef]
  51. Brouder, P. Reset redux: Possible evolutionary pathways towards the transformation of tourism in a COVID-19 world. Tour. Geogr. 2020, 22, 484–490. [Google Scholar] [CrossRef]
  52. Sigala, M. Tourism and COVID-19: Impacts and implications for advancing and resetting industry and research. J. Bus. Res. 2020, 117, 312–321. [Google Scholar] [CrossRef] [PubMed]
  53. Sharma, G.D.; Thomas, A.; Paul, J. Reviving tourism industry post-COVID-19: A resilience-based framework. Tour. Manag. Perspect. 2021, 37, 100786. [Google Scholar] [CrossRef] [PubMed]
  54. Cheer, J.M.; Lapointe, D.; Mostafanezhad, M.; Jamal, T. Global tourism in crisis: Conceptual frameworks for research and practice. J. Tour. Futures 2021, 7, 278–294. [Google Scholar] [CrossRef]
  55. Uğur, N.G.; Akbıyık, A. Impacts of COVID-19 on global tourism industry: A cross-regional comparison. Tour. Manag. Perspect. 2020, 36, 100744. [Google Scholar] [CrossRef]
  56. Volgger, M.; Taplin, R.; Aebli, A. Recovery of domestic tourism during the COVID-19 pandemic: An experimental comparison of interventions. J. Hosp. Tour. Manag. 2021, 48, 428–440. [Google Scholar] [CrossRef]
  57. Kong, A.; Oh, J.-E.; Lam, T. Face mask effects during COVID-19: Perspectives of managers, practitioners and customers in the hotel industry. Int. Hosp. Rev. 2021, 35, 195–207. [Google Scholar] [CrossRef]
  58. Chi, X.; Han, H.; Kim, S. Protecting yourself and others: Festival tourists’ pro-social intentions for wearing a mask, maintaining social distancing, and practicing sanitary/hygiene actions. J. Sustain. Tour. 2022, 30, 1915–1936. [Google Scholar] [CrossRef]
  59. Sun, T.; Zhang, J.; Zhang, B.; Ong, Y.; Ito, N. How trust in a destination’s risk regulation navigates outbound travel constraints on revisit intention post-COVID-19: Segmenting insights from experienced Chinese tourists to Japan. J. Destin. Mark. Manag. 2022, 25, 100711. [Google Scholar] [CrossRef]
  60. Seyfi, S.; Rastegar, R.; Rasoolimanesh, S.M.; Hall, C.M. A framework for understanding media exposure and post-COVID-19 travel intentions. Tour. Recreat. Res. 2021, 48, 305–310. [Google Scholar] [CrossRef]
  61. Abdul-Rahman, M.N.; Hassan, T.H.; Abdou, A.H.; Abdelmoaty, M.A.; Saleh, M.I.; Salem, A.E. Responding to Tourists’ Intentions to Revisit Medical Destinations in the Post-COVID-19 Era through the Promotion of Their Clinical Trust and Well-Being. Sustainability 2023, 15, 2399. [Google Scholar] [CrossRef]
  62. Mensah, E.A.; Boakye, K.A. Conceptualizing post-COVID 19 tourism recovery: A three-step framework. Tour. Plan. Dev. 2023, 20, 37–61. [Google Scholar] [CrossRef]
  63. Casal-Ribeiro, M.; Boavida-Portugal, I.; Peres, R.; Seabra, C. Review of Crisis Management Frameworks in Tourism and Hospitality: A Meta-Analysis Approach. Sustainability 2023, 15, 12047. [Google Scholar] [CrossRef]
  64. Ajzen, I. From intentions to actions: A theory of planned behavior. In Action Control: From Cognition to Behavior; Kuhl, J., Beckmann, J., Eds.; Springer: Berlin/Heidelberg, Germany, 1985; pp. 11–39. [Google Scholar]
  65. Han, H.; Al-Ansi, A.; Chua, B.L.; Tariq, B.; Radic, A.; Park, S.H. The post-coronavirus world in the international tourism industry: Application of the theory of planned behavior to safer destination choices in the case of US outbound tourism. Int. J. Environ. Res. Public Health 2020, 17, 6485. [Google Scholar] [CrossRef]
  66. Liu, Y.; Shi, H.; Li, Y.; Amin, A. Factors influencing Chinese residents’ post-pandemic outbound travel intentions: An extended theory of planned behavior model based on the perception of COVID-19. Tour. Rev. 2021, 76, 871–891. [Google Scholar] [CrossRef]
  67. Su, D.N.; Tran, K.P.T.; Nguyen, L.N.T.; Thai, T.H.T.; Doan, T.H.T.; Tran, V.T. Modeling behavioral intention toward traveling in times of a health-related crisis. J. Vacat. Mark. 2022, 28, 135–151. [Google Scholar] [CrossRef]
  68. Yao, Y.; Zhao, X.; Ren, L.; Jia, G. Compensatory travel in the post COVID-19 pandemic era: How does boredom stimulate intentions? J. Hosp. Tour. Manag. 2023, 54, 56–64. [Google Scholar] [CrossRef]
  69. Duong, L.H.; Phan, Q.D.; Nguyen, T.T.; Huynh, D.V.; Truong, T.T.; Duong, K.Q. Understanding Tourists’ Behavioral Intention and Destination Support in Post-pandemic Recovery: The Case of the Vietnamese Domestic Market. Sustainability 2022, 14, 9969. [Google Scholar] [CrossRef]
  70. Azhar, M.; Nafees, S.; Sujood; Hamid, S. Understanding post-pandemic travel intention toward rural destinations by expanding the theory of planned behavior (TPB). Future Bus. J. 2023, 9, 36. [Google Scholar] [CrossRef]
  71. My, D.T.H.; Tung, L.T. What Can Affect the Intention to Revisit a Tourism Destination in the Post-pandemic Period? Evidence from Southeast Asia. In Sustainable Approaches and Business Challenges in Times of Crisis; Negrușa, A.L., Coroş, M.M., Eds.; ICMTBHT 2022. Springer Proceedings in Business and Economics; Springer: Berlin/Heidelberg, Germany, 2024. [Google Scholar] [CrossRef]
  72. Shin, H.; Nicolau, J.L.; Kang, J.; Sharma, A.; Lee, H. Travel decision determinants during and after COVID-19: The role of tourist trust, travel constraints, and attitudinal factors. Tour. Manag. 2022, 88, 104428. [Google Scholar] [CrossRef]
  73. Gholipour, H.F.; Nunkoo, R.; Foroughi, B.; Daronkola, H.K. Economic policy uncertainty, consumer confidence in major economies and outbound tourism to African countries. Tour. Econ. 2022, 28, 979–994. [Google Scholar] [CrossRef]
  74. Jiang, X.; Qin, J.; Gao, J.; Gossage, M.G. How tourists’ perception affects travel intention: Mechanism pathways and boundary conditions. Front. Psychol. 2022, 13, 821364. [Google Scholar] [CrossRef]
  75. Le, L.H.; Hancer, M. Using social learning theory in examining YouTube viewers’ desire to imitate travel vloggers. J. Hosp. Tour. Technol. 2021, 12, 512–532. [Google Scholar] [CrossRef]
  76. Easterby-Smith, M.; Thorpe, R.; Jackson, P.R. Management Research; Sage: London, UK, 2012. [Google Scholar]
  77. Ajzen, I.; University of Massachusetts, Amhers, MA, USA. Constructing a theory of planned behavior questionnaire. Personal communication, 2006. [Google Scholar]
  78. Ajzen, I.; Fishbein, M. Scaling and testing multiplicative combinations in the expectancy–value model of attitudes. J. Appl. Soc. Psychol. 2008, 38, 2222–2247. [Google Scholar] [CrossRef]
  79. Trifiletti, E.; Shamloo, S.E.; Faccini, M.; Zaka, A. Psychological predictors of protective behaviours during the COVID-19 pandemic: Theory of planned behaviour and risk perception. J. Community Appl. Soc. Psychol. 2022, 32, 382–397. [Google Scholar] [CrossRef]
  80. Curtin, R.T. Indicators of consumer behavior: The University of Michigan surveys of consumers. Public Opin. Q. 1982, 46, 340–352. [Google Scholar] [CrossRef]
  81. Gurtner, Y. Returning to paradise: Investigating issues of tourism crisis and disaster recovery on the island of Bali. J. Hosp. Tour. Manag. 2016, 28, 11–19. [Google Scholar] [CrossRef]
  82. Boukes, M.; Damstra, A.; Vliegenthart, R. Media effects across time and subject: How news coverage affects two out of four attributes of consumer confidence. Commun. Res. 2021, 48, 454–476. [Google Scholar] [CrossRef]
  83. Brislin, R.W. Comparative research methodology: Cross-cultural studies. Int. J. Psychol. 1976, 11, 215–229. [Google Scholar] [CrossRef]
  84. Nunnally, J.C.; Bernstein, I.H. Psychometric Theory, 3rd ed.; McGraw-Hill: New York, NY, USA, 1994. [Google Scholar]
  85. Hair, J.F.; Ringle, C.M.; Sarstedt, M. Partial least squares: The better approach to structural equation modeling? Long Range Plan. 2012, 45, 312–319. [Google Scholar] [CrossRef]
  86. Richter, N.F.; Sinkovics, R.R.; Ringle, C.M.; Schlägel, C. A critical look at the use of SEM in international business research. Int. Mark. Rev. 2016, 33, 376–404. [Google Scholar] [CrossRef]
  87. do Valle, P.O.; Assaker, G. Using partial least squares structural equation modeling in tourism research: A review of past research and recommendations for future applications. J. Travel Res. 2016, 55, 695–708. [Google Scholar] [CrossRef]
  88. Ali, F.; Rasoolimanesh, S.M.; Sarstedt, M.; Ringle, C.M.; Ryu, K. An assessment of the use of partial least squares structural equation modeling (PLS-SEM) in hospitality research. Int. J. Contemp. Hosp. Manag. 2018, 30, 514–538. [Google Scholar] [CrossRef]
  89. Hair, J.F.; Risher, J.J.; Sarstedt, M.; Ringle, C.M. When to use and how to report the results of PLS-SEM. Eur. Bus. Rev. 2019, 31, 2–24. [Google Scholar] [CrossRef]
  90. Reinartz, W.; Haenlein, M.; Henseler, J. An empirical comparison of the efficacy of covariance-based and variance-based SEM. Int. J. Res. Mark. 2009, 26, 332–344. [Google Scholar] [CrossRef]
  91. Sarstedt, M.; Hair, J.F.; Nitzl, C.; Ringle, C.M.; Howard, M.C. Beyond a tandem analysis of SEM and PROCESS: Use of PLS-SEM for mediation analyses! Int. J. Mark. Res. 2020, 62, 288–299. [Google Scholar] [CrossRef]
  92. Akter, S.; Fosso Wamba, S.; Dewan, S. Why PLS-SEM is suitable for complex modelling? An empirical illustration in big data analytics quality. Prod. Plan. Control 2017, 28, 1011–1021. [Google Scholar] [CrossRef]
  93. Henseler, J.; Ringle, C.M.; Sinkovics, R.R. The use of partial least squares path modeling in international marketing. In New Challenges to International Marketing; Sinkovics, R.R., Ghauri, P.N., Eds.; Emerald Group Publishing Limited: Bingley, Bradford, UK, 2009; pp. 277–319. [Google Scholar]
  94. Bagozzi, R.P.; Yi, Y.; Phillips, L.W. Assessing construct validity in organizational research. Adm. Sci. Q. 1991, 36, 421–458. [Google Scholar] [CrossRef]
  95. Bagozzi, R.P.; Yi, Y. On the evaluation of structural equation models. J. Acad. Mark. Sci. 1988, 16, 74–94. [Google Scholar] [CrossRef]
  96. Fornell, C.; Larcker, D.F. Evaluating structural equation models with unobservable variables and measurement error. J. Mark. Res. 1981, 18, 39–50. [Google Scholar] [CrossRef]
  97. Leguina, A. A primer on partial least squares structural equation modeling (PLS-SEM). Int. J. Res. Method Educ. 2015, 38, 220–221. [Google Scholar] [CrossRef]
  98. Henseler, J.; Ringle, C.M.; Sarstedt, M. A new criterion for assessing discriminant validity in variance-based structural equation modeling. J. Acad. Mark. Sci. 2015, 43, 115–135. [Google Scholar] [CrossRef]
  99. Kock, N.; Lynn, G. Lateral collinearity and misleading results in variance-based SEM: An illustration and recommendations. J. Assoc. Inf. Syst. 2012, 13, 546–580. [Google Scholar] [CrossRef]
  100. Kock, N. Common Method Bias in PLS-SEM: A Full Collinearity Assessment Approach. Int. J. E-Collab. 2015, 11, 1–10. [Google Scholar] [CrossRef]
  101. Henseler, J.; Sarstedt, M. Goodness-of-fit indices for partial least squares path modeling. Comput. Stat. 2013, 28, 565–580. [Google Scholar] [CrossRef]
  102. Sarstedt, M.; Henseler, J.; Ringle, C.M. Multigroup analysis in partial least squares (PLS) path modeling: Alternative methods and empirical results. Adv. Int. Mark. 2011, 22, 195–218. [Google Scholar] [CrossRef]
  103. Hair, J.F., Jr.; Howard, M.C.; Nitzl, C. Assessing measurement model quality in PLS-SEM using confirmatory composite analysis. J. Bus. Res. 2020, 109, 101–110. [Google Scholar] [CrossRef]
  104. Hair Jr, J.F.; Sarstedt, M.; Hopkins, L.; Kuppelwieser, V.G. Partial least squares structural equation modeling (PLS-SEM) An emerging tool in business research. Eur. Bus. Rev. 2014, 26, 106–121. [Google Scholar] [CrossRef]
  105. Henseler, J.; Ringle, C.M.; Sarstedt, M. Testing Measurement Invariance of Composites Using Partial Least Squares. Int. Mark. Rev. 2016, 33, 405–431. [Google Scholar] [CrossRef]
  106. Ringle, C.M.; Sarstedt, M. Gain More Insight from Your PLS-SEM Results: The Importance-Performance Map Analysis. Ind. Manag. Data Syst. 2016, 116, 1865–1886. [Google Scholar] [CrossRef]
  107. Irimia-Diéguez, A.; Liébana-Cabanillas, F.; Blanco-Oliver, A.; Lara-Rubio, J. What drives consumers to use P2P payment systems? An analytical approach based on the stimulus–organism–response (S-O-R) model. Eur. J. Manag. Bus. Econ. 2023; ahead-of-print. [Google Scholar] [CrossRef]
  108. Seyitoğlu, F.; Costa, C. A scenario planning framework for (post-) pandemic tourism in European destinations. Eur. Plan. Stud. 2022, 30, 2554–2574. [Google Scholar] [CrossRef]
  109. Juschten, M.; Jiricka-Pürrer, A.; Unbehaun, W.; Hössinger, R. The mountains are calling! An extended TPB model for understanding metropolitan residents’ intentions to visit nearby alpine destinations in summer. Tour. Manag. 2019, 75, 293–306. [Google Scholar] [CrossRef]
  110. Neuburger, L.; Egger, R. Travel risk perception and travel behaviour during the COVID-19 pandemic 2020: A case study of the DACH region. Curr. Issues Tour. 2021, 24, 1003–1016. [Google Scholar] [CrossRef]
  111. Kock, F.; Nørfelt, A.; Josiassen, A.; Assaf, A.G.; Tsionas, M.G. Understanding the COVID-19 tourist psyche: The Evolutionary Tourism Paradigm. Ann. Tour. Res. 2020, 85, 103053. [Google Scholar] [CrossRef]
Figure 1. Research Model.
Sustainability 16 08492 g001
Figure 2. Results of structural modeling analysis.
Sustainability 16 08492 g002
Figure 3. Importance–Performance Map for Group 1 (Outbreak Phase).
Sustainability 16 08492 g003
Figure 4. Importance–Performance Map for Group 2 (Stabilization Phase).
Sustainability 16 08492 g004
Figure 5. Importance–Performance Map for Group 3 (Conclusion Phase).
Sustainability 16 08492 g005
Table 1. Construct reliability and validity.
ConstructItemsLoadingCronbach’s AlphaCRAVE
ATTDATTD_10.7470.7140.8290.619
ATTD_20.723
ATTD_30.881
SNSN_10.7740.7060.8270.614
SN_20.748
SN_30.827
PBCPBC_10.6530.710 0.8220.538
PBC_20.643
PBC_30.792
PBC_40.828
CTRCTR_10.780 0.8510.8940.628
CTR_20.720
CTR_30.849
CTR_40.820
CTR_50.786
BIBI_10.7830.7880.8630.612
BI_20.798
BI_30.800
BI_40.747
Table 2. Discriminant validity (Fornell-Larcker criteria).
ATTDBICTRPBCSN
ATTD0.787
BI0.1760.782
CTR0.1880.5100.792
PBC0.1870.4730.3840.734
SN0.2240.4330.3300.3550.784
Table 3. Discriminant validity (HTMT criteria).
ATTDBICTRPBCSN
ATTD
BI0.208
CTR0.2300.620
PBC0.2340.6270.485
SN0.3320.5440.3920.461
Table 4. VIF values.
VIF
ATTD -> BI1.093
ATTD -> CTR1.067
CTR -> BI1.278
PBC -> BI1.345
PBC -> CTR1.160
SN -> BI1.249
SN -> CTR1.179
Table 5. Predictive validity and predictive relevance.
R2Q2
BI0.3950.293
CTR0.1970.189
Table 6. Hypothesis testing.
HypothesisPathStd. βT Valuep-Value
H1ATTD -> BI0.0120.4570.648
H2SN -> BI0.228 ***6.4910.000
H3PBC -> BI0.265 ***7.6200.000
H4CTR -> BI0.331 ***9.5180.000
H5aATTD -> CTR0.087 **2.9020.004
H6aSN -> CTR0.206 ***5.5190.000
H7aPBC -> CTR0.295 ***8.5520.000
Note: Significance level: ** p < 0.01, *** p < 0.001.
Table 7. Mediation analysis.
RelationshipsIndirect EffectTpDirect EffectTpVAFMediation TypeHypothesis
Testing
Mediation effect of CTR
H5b: ATTD -> CTR -> BI0.0292.7750.0060.0120.4570.64871%PMSupported
H6b: SN -> CTR -> BI0.0684.6020.0000.2286.4910.00023%PMSupported
H7b: PBC -> CTR -> BI0.0986.4460.0000.2657.6200.00027%PMSupported
Note: T represents two-tailed T-test values; p denotes significance level; VAF, Variance Accounted For; PM, Partial Mediation; NM, No Mediation.
Table 8. MGA analysis.
ConstructsComparison GroupConfigural Invariance Compositional Invariance (p-Value)Mean Invariance (p-Value)Variance Invariance (p-Value)Measurement Invariance Conclusion
ATTDGroup 1 vs. Group 2Passed0.1110.1580.913Fully Passed
Group 1 vs. Group 3Passed0.1640.7220.659Fully Passed
Group 2 vs. Group 3Passed0.5430.1050.752Fully Passed
SNGroup 1 vs. Group 2Passed0.1220.0120.025Partially Passed
Group 1 vs. Group 3Passed0.4210.0080.409Partially Passed
Group 2 vs. Group 3Passed0.5340.4670.171Fully Passed
PBCGroup 1 vs. Group 2Passed0.4830.7520.495Fully Passed
Group 1 vs. Group 3Passed0.4310.0160.239Partially Passed
Group 2 vs. Group 3Passed0.4640.0240.639Partially Passed
CTRGroup 1 vs. Group 2Passed0.3830.0010.021Partially Passed
Group 1 vs. Group 3Passed0.7680.0000.022Partially Passed
Group 2 vs. Group 3Passed0.3740.0050.959Partially Passed
BIGroup 1 vs. Group 2Passed0.1420.0000.021Partially Passed
Group 1 vs. Group 3Passed0.1870.0000.000Partially Passed
Group 2 vs. Group 3Passed0.9050.0000.323Partially Passed
Table 9. IPMA results.
Predictor ConstructsGroup1Group2Group3
Importance (X)Performance (Y)Importance (X)Performance (Y)Importance (X)Performance (Y)
ATTD0.03985.5450.08783.3410.03985.801
CTR0.35267.9520.30472.4020.30174.409
PBC0.26171.9840.41173.4290.42676.335
SN0.33073.660.28575.8880.23877.079
Mean values0.24674.7850.27276.2650.25178.406
Disclaimer/Publisher’s Note: The statements, opinions and data contained in all publications are solely those of the individual author(s) and contributor(s) and not of MDPI and/or the editor(s). MDPI and/or the editor(s) disclaim responsibility for any injury to people or property resulting from any ideas, methods, instructions or products referred to in the content.

