Article

Zooplankton Structure and Ecological Niche Differentiation of Dominant Species in Tahe Bay, Lushun, China

by
Yanrong Zhang
1,
Zengqiang Yin
1,*,
Yan Wang
1,
Guoxing Li
1,
Dawang Zhang
2,
Jun Yang
1,
Lei Chen
1,
Haifeng Gu
1,
Yuxue Qin
1 and
Tao Tian
2
1
College of Marine Science and Environment, Dalian Ocean University, Dalian 116023, China
2
College of Fisheries and Life Science, Dalian Ocean University, Dalian 116023, China
*
Author to whom correspondence should be addressed.
Sustainability 2024, 16(19), 8590; https://doi.org/10.3390/su16198590
Submission received: 16 July 2024 / Revised: 30 September 2024 / Accepted: 30 September 2024 / Published: 3 October 2024
(This article belongs to the Section Sustainable Oceans)

Abstract

:
Zooplankton are important food organisms in the marine ecosystem, and their community structure and distribution reflect the productivity of the waters. To investigate the zooplankton structure and the environmental factors affecting ecological niche differentiation in the waters of Tahe Bay, Lushun, a survey was conducted in September 2021 and March, April, and November 2022 in the waters of Tahe Bay. The results showed that there are 31 species representing four phyla, with an annual mean abundance of 12.42 × 10³ ind/m3, dominated by Copepoda (13 species, 41.94%), with zooplankton richness indices ranging from 0.83 to 2.44, diversity indices ranging from 0.84 to 2.42, and evenness indices ranging from 0.14 to 0.84. Pearson’s correlation of zooplankton abundance and community diversity with environmental factors, such as water temperature, salinity, dissolved oxygen, NH3-N, and NO3-N, was significant in the waters of Tahe Bay. There were 13 dominant species, mainly consisting of broad-niche species, among which Oithona similis was the dominant species in all four seasons; the degree of niche overlap of the dominant species was related to the seasons, with a serious niche overlap accounting for 81.0% in September 2021, and there was no niche overlap in March 2022; 33.3% of the species had a severe ecological niche overlap in April 2022, with a serious niche overlap accounting for 86.7% in November 2022. The results of redundancy analysis (RDA) indicated that water temperature, salinity, DO, and DIP are the main environmental factors affecting the ecological niche differentiation of the dominant species of zooplankton.

1. Introduction

The 2030 Agenda for Sustainable Development was adopted in September 2015 by the United Nations General Assembly in its resolution 70/1. The agenda declared 17 global Sustainable Development Goals (SDGs), which aim to promote sustainable development globally by addressing current development issues in an integrated manner across social, economic, and environmental dimensions. SDGs 1 (Eradicate Poverty), 2 (Zero Hunger), and 14 (Life Below Water) are closely related to fisheries [1]. The SDGs of fisheries depend on the fishery productivity of aquatic ecosystems. Zooplankton, as food organisms, are the basis of the fishery productivity of aquatic ecosystems, and zooplankton research can provide theoretical guidance for the sustainable development of fisheries.
Zooplankton are an indispensable component of aquatic ecosystems. Although small in size, they are numerous and widely distributed and are the basis of marine productivity and the most important link in the energy flow and material cycle of marine ecosystems [2]. Zooplankton, as a secondary producer in the marine ecosystem, influence or control the primary productivity through feeding, which in turn affects the fluctuation of fishery resources [3,4]. At the same time, there is an inseparable relationship between zooplankton and the environment; their community dynamics show variability with changes in environmental factors, such as water temperature and pH; and this differential feedback to environmental factors can, in turn, serve as indicators for changes in watershed ecosystems [5]. The study of the relationship between the two can allow a better understanding of the role of environmental factors in the plankton community structure and dynamics. The study of ecological niches is conducive to the understanding of interspecific relationships, which is important for the optimal use of the marine biological environment, increasing the efficiency of marine space use and enhancing the productivity of the sea area.
The current research on zooplankton mainly focuses on the analysis of the zooplankton community structure, the species composition, and their relationship with environmental factors, but there are relatively few studies on the ecological niche differentiation of dominant species in zooplankton communities. For example, Sobko et al. [6] found that the structure, abundance, and spatial distribution of zooplankton in Sukhumvit Bay are affected by complex environmental factors, such as temperature, salinity, tidal dynamics, and water depth. Cataldo et al. [7] showed that changes in water temperature have a certain impact on the reproduction rate of zooplankton, and the reproduction rate is significantly higher in low water temperature than in high water temperature. Chen et al. [8] found that environmental factors, such as DO, nitrate, COD, and water temperature, are the key factors affecting changes in the dominant zooplankton species in the typical aquaculture waters of Lushunkou, Dalian. Zhao et al. [9] showed that changes in zooplankton populations in Dalian’s Heishijiao waters have a certain degree of correlation with the water temperature. Fu et al. [10] found that the distribution of dominant species in the Northwest Pacific Ocean is affected by the combined influence of a variety of environmental factors. Hou et al. [11] found that the ecological niche overlap index of the dominant offshore zooplankton species in Yantai is closely related to the overlap of environmental sites of species distribution. Yang et al. [12] revealed that most of the species with high spatial ecological niche overlap indices of the dominant zooplankton species in spring and summer in the Yangtze River Estuary and neighboring seas have predator–prey relationships.
Lushun Tahe Bay is located in the sea near Longwangtang Town, Lushun South Road, Dalian City, Liaoning Province. With an area of about 7 km2, a water depth of about 10 m, a water temperature of 5~25 °C, and a salinity of 30.2~32.2 and influenced by the warm currents of the Yellow Sea and coastal currents, the waters are rich in nutrient salts and full of seawater exchange [13,14], and wakame, scallops, sea cucumbers, and reef fishes are the major species in this waters [8]. The waters are mainly used for aquaculture with wakame rafts and artificial reefs. It is an important fishery culture area in Lushun. This study analyzed the changes in the zooplankton structure and quantity in Tahe Bay, calculated the ecological niche correlation index, and searched for the factors influencing the ecological niche differentiation of the dominant species, which provided basic information for an in-depth understanding of the interspecific relationship of zooplankton and the adaptation mechanism of zooplankton to environmental changes in the waters of Tahe Bay and provided theoretical references for the sustainable development of fisheries in this sea area.

2. Materials and Methods

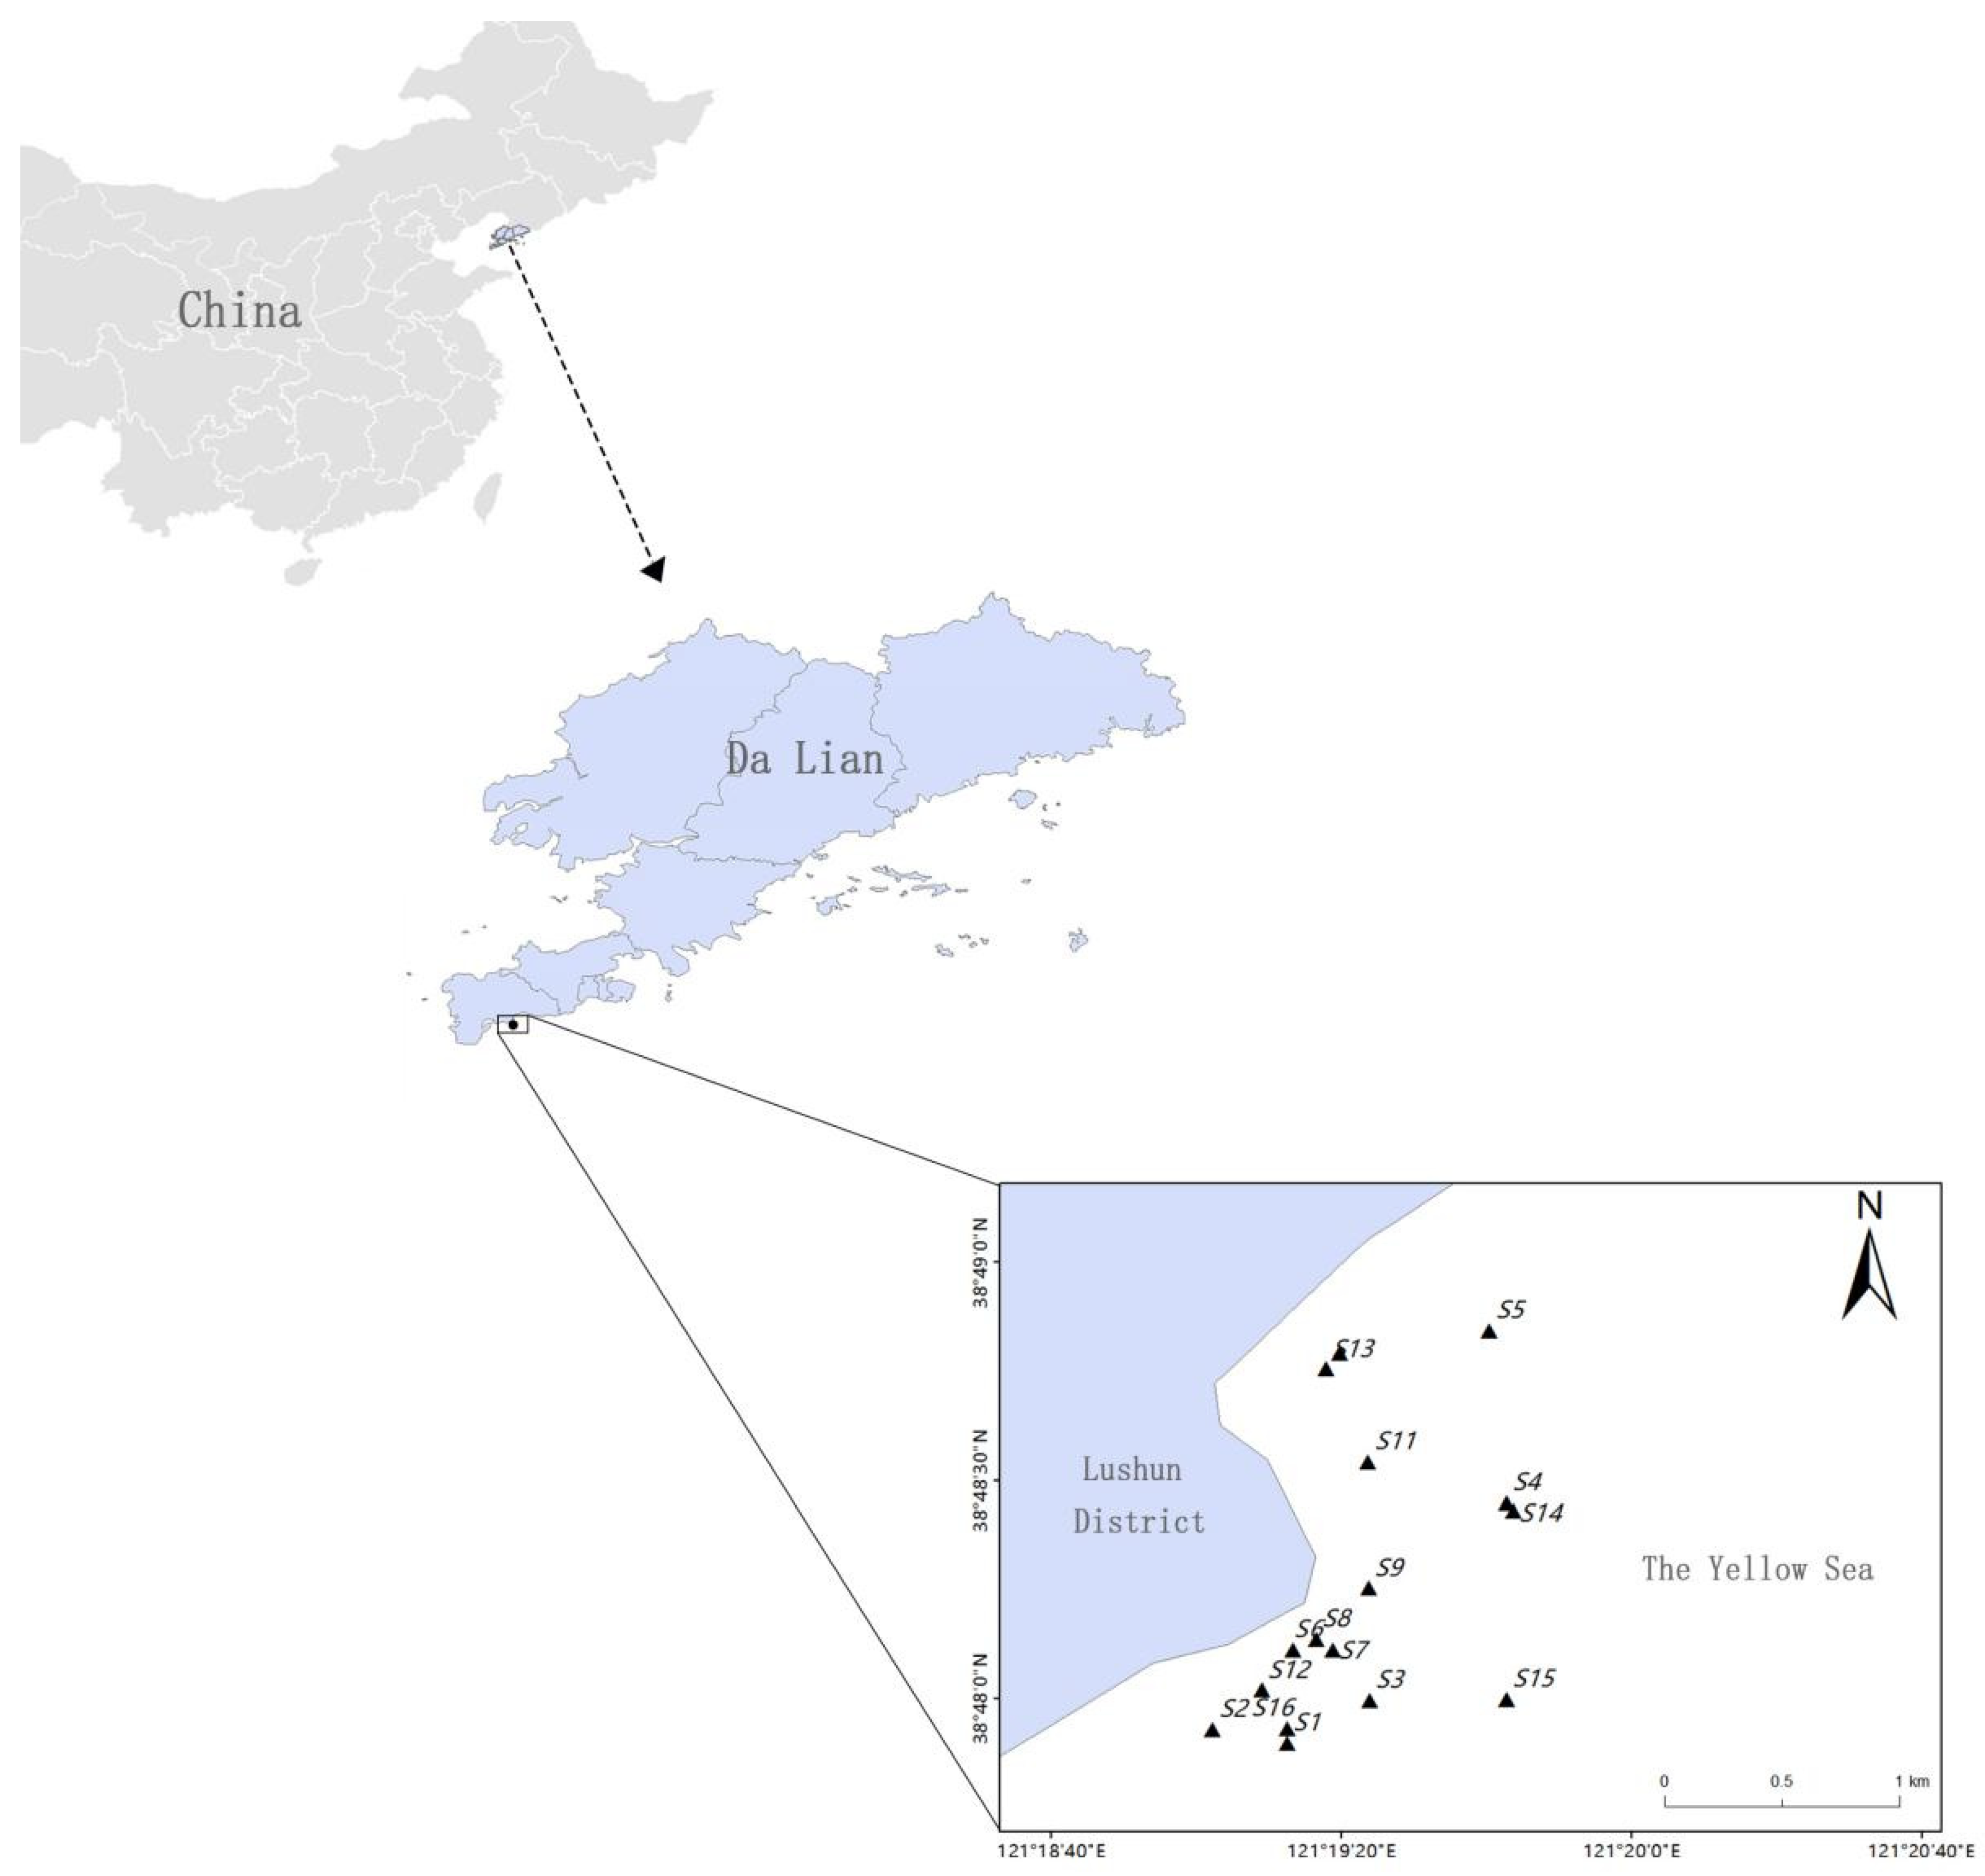
2.1. Data Sources and Survey Sites

The data for this study were obtained from the marine environmental survey data of the Tahe Bay area of Lushun in September 2021 (end of summer), mid-March 2022 (end of winter), late April (spring), and November 2022 (autumn) (since the fishing season is closed in May, June, July, and August each year, late April was chosen as spring, and September was chosen as the end of summer, so the survey samples basically included all seasons in this area) [14]. The distribution of specific stations is shown in Figure 1 and Table 1.

2.2. Sample Collection and Processing

Zooplankton samples were collected using a shallow-water zooplankton net (the inner diameter of the net mouth was 31.6 cm, the net area was 0.08 m2, and the length of the net was 140 cm) by towing the net vertically from the bottom to the surface, and the collected samples were fixed and preserved by adding 5% formalin. In the laboratory, the entire sample was divided into multiple portions and pipetted into a 5 mL counting frame using a quantitative pipette, and the number of species of zooplankton at every station was obtained by species identification and taxonomic counting using an Olympus X31 biomicroscope. Zooplankton abundance was then obtained by dividing the number of individuals of every species by the volume of the water column sampled by the zooplankton net at that station.

2.3. Measurement of Physical and Chemical Indicators of Water Quality

Water samples were synchronized with zooplankton collection at each survey station, and the pH, water temperature (T, °C), salinity (SAL, ppt), and dissolved oxygen content (DO, mg/L) of the water body at the sampling points were measured on-site using a water quality parameter meter. The collection and analysis of seawater samples in this study were carried out with reference to the Specification for Marine Monitoring Part 7: Ecological Survey and Biological Monitoring of Offshore Pollution (GB 17378.7-2007) [8]. The chemical oxygen demand (COD, mg/L) was determined by the potassium dichromate method, the ammonia nitrogen content (NH3-N, mg/L) was determined by nano reagent spectrophotometry, the nitrate nitrogen content (NO3-N, mg/L) was determined by phenol disulphonic acid spectrophotometry, the nitrite nitrogen content (NO2-N, mg/L) was determined by the spectrophotometric method, dissolved inorganic phosphorus (DIP, mg/L) was determined by ammonium molybdate spectrophotometry, and the sulfide content (S, mg/L) was determined using methylene blue spectrophotometry.

2.4. Data Analysis and Processing

2.4.1. Degree of Dominance Index

The dominant zooplankton species were calculated using the degree of dominance, calculated using the following formula [15,16]:
Y = N i N × F i
where N is the total number of individuals of all species, Ni is the number of species i, and Fi is the frequency of occurrence of species i. According to a related study [17], when Y ≥ 0.02, the species is dominant.

2.4.2. Biodiversity Indicators

In this paper, Shannon–Wiener’s diversity index (H′) [18], the Pielou index (J) [19], and Margalef’s index (D) [20,21,22] were used to analyze the diversity of zooplankton communities in the waters of Tahe Bay. The zooplankton community diversity was analyzed with the following formulae:
H = P i ln P i
J = H ln S
D = ( S 1 ) ln N
In the formulae, Pi is the proportion of the number of individuals of the i-th species in the community to the total number of individuals of the species, S is the number of species in the community, and N is the total number of individuals of all species.

2.4.3. Ecological Niche Width Index

The niche width index is an important indicator of the diversity of bioavailable resources. In this paper, the Levins formula was used to calculate the niche width of dominant species [23]; the formula is as follows:
B i = 1 r j = 1 1 p i j 2
where Pij is the proportion of individuals of species i using resource j and r is the total number of resources, and in this study, r was the total number of sampling stations. The larger the Bi value, the larger the ecological niche width for the species, and according to a related study [11], Bi is in the range of [0, 1]. When Bi ≥ 0.6, the species is a wide ecological niche; when 0.6 < Bi ≤ 0.3, the species is a medium ecological niche; when Bi < 0.3, the species is a narrow ecological niche.

2.4.4. Pianka Ecological Niche Overlap Index

The ecological niche overlap index is a measure of the degree of ecological niche overlap between species. The Pianka overlap index was used to calculate the degree of ecological niche overlap using the following formula [24]:
Q i k = j = i j N p k j j = 1 N p i j 2 j = 1 N p k j 2
where N is the total number of stations in the surveyed area and Pij and Pkj are the proportions of zooplankton i and zooplankton k in the total number of zooplankton at station j. The number of zooplankton i and k in the surveyed area is the total number of zooplankton at station j. According to a related study [11], when the niche overlap degree Qik < 0.3, the niche overlap of species i and k is low; when 0.3 ≤ Qik < 0.6, the niche overlap of species i and k is meaningful; and when Qik ≥ 0.6, the niche overlap of species i and k is serious.

2.4.5. Mathematical Statistics

ArcMap 10.7 was used to map the seasonal distribution of zooplankton species and abundance; SPSS 22.0 was used to carry out Pearson correlation analysis on zooplankton diversity indices (H′, J, D), abundance, and environmental factors, and the environmental factors with a variance inflation factor (VIF) greater than 10 were manually excluded to determine the degree of correlation between environmental factors that had a greater impact on the structure of the zooplankton community and the degree of correlation between the zooplankton diversity index and environmental factors. Canoco 5.0 was then used to determine the length of the first axis of correlation between the dominant zooplankton species and environmental data by de-trending correspondence analysis (DCA), which was used to determine whether to perform redundancy analysis (RDA) or canonical correspondence analysis (CCA): When the value of the first axis of DCA was >4.0, CCA was performed; when the value of the first axis was between 3.0 and 4.0, either RDA or CCA could be used; when the value of the first axis was <3.0 to 4.0, either RDA or CCA could be used; and when the value of the first axis was <3.0, RDA was preferred. The drawing of bar charts was completed using Excel 2021 software.

3. Results and Analyses

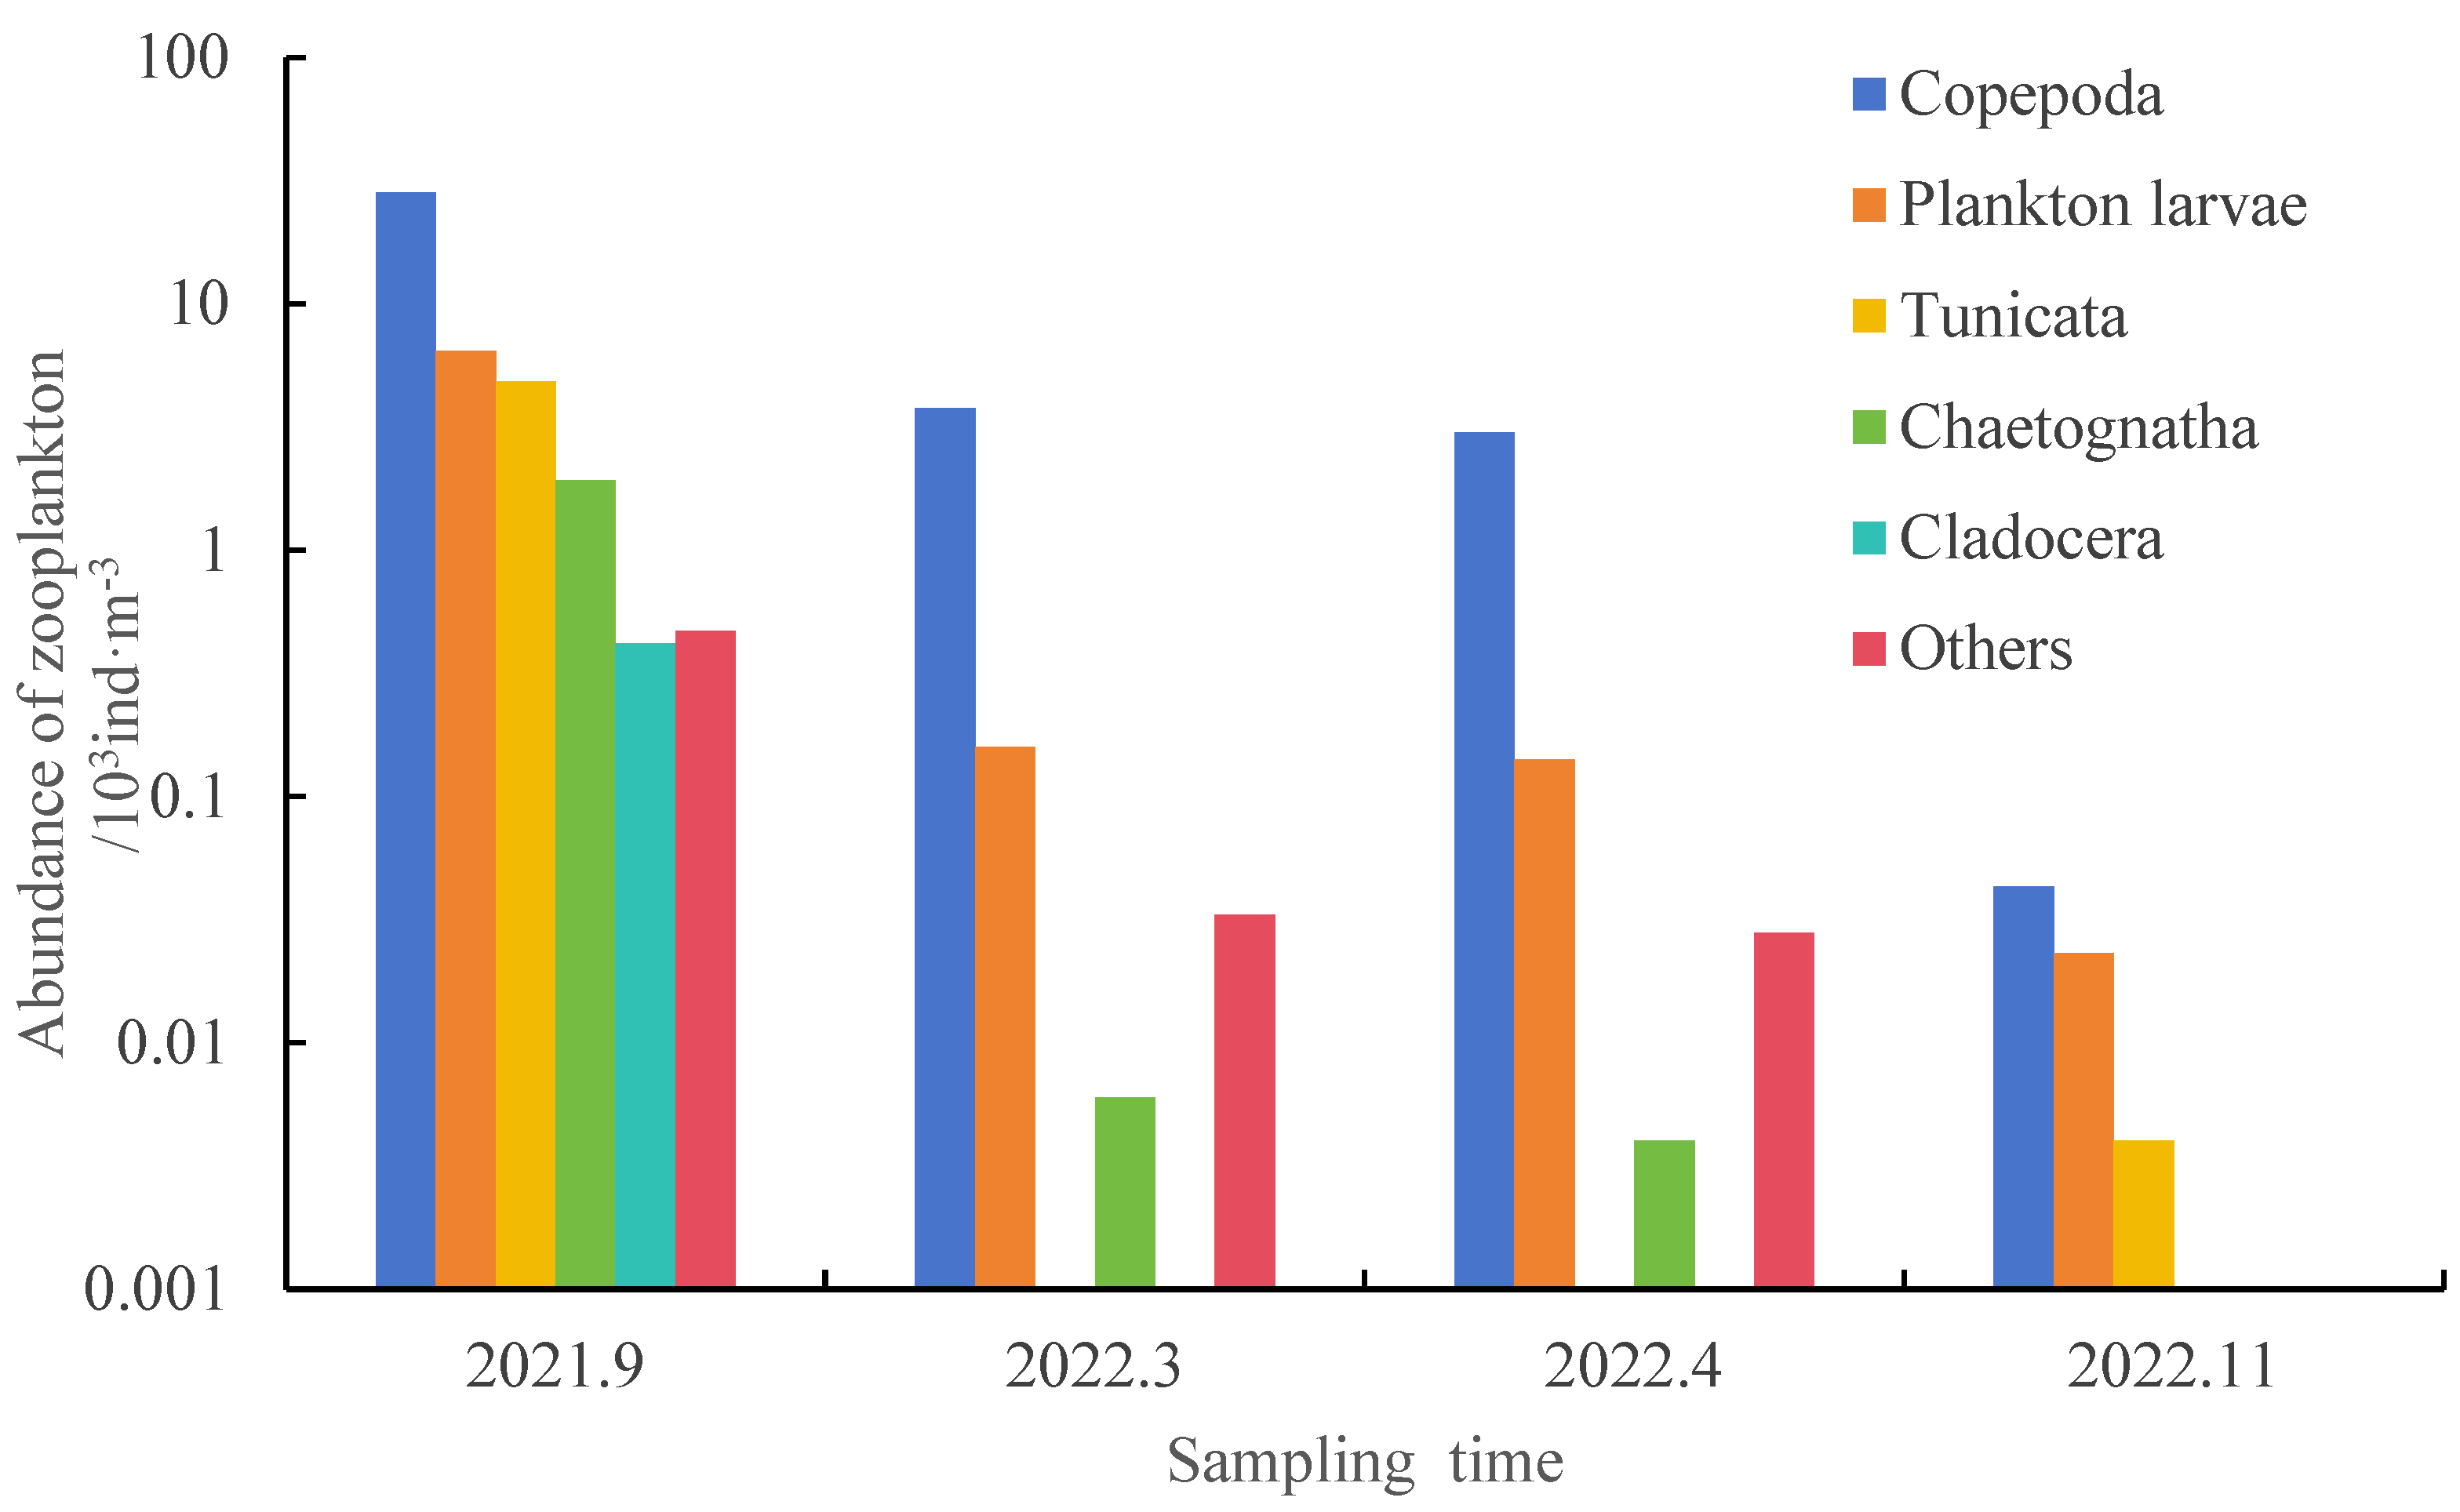
3.1. Analysis of the Zooplankton Structure

3.1.1. Zooplankton Species Composition and Species Diversity

The sampling times in declining order of the abundance of zooplankton were September 2021 (end of summer), March 2022 (end of winter), April 2022 (spring), and November 2022 (autumn) (Figure 2). The mean abundance was 12.42 × 10³ ind·m−3, and the zooplankton taxa in the order of mean abundance were as follows: Copepoda > plankton larvae > Tunicata > Chaetognatha > others > Cladocera. Changes in the abundance of various taxa in the waters of Tahoe Bay from September 2021 to November 2022 are shown in Figure 2. The abundance was the highest in September 2021: 28,375 ind·m−3 for Copepoda, 6427 ind·m−3 for planktonic larvae, 4854 ind·m−3 for Tunicata, 1917 ind·m−3 for Chaetognatha, 417 ind·m−3 for Cladocera, and 469 ind·m−3 for other zooplankton. The seasons in descending order in terms of the total number of zooplankton species were winter, spring, summer, and autumn, and the number of species of Copepoda was absolutely dominant in all seasons (Table 2). In this study, the Shannon–Wiener diversity index (H′), the evenness index (J), and the species richness index (D) were obtained according to Equations (2)–(4), and as can be seen in Table 3, the medians of H’, D, and J were 2.14, 1.87, and 0.32, respectively. The highest values of H’ and D were found in November 2022 (autumn), and the values of H’ (2.81), D (4.99), and J were the highest in September 2021 (end of summer) (0.70) and the lowest in March 2022 (end of winter) (0.14).

3.1.2. Analysis of Dominant Species

According to the zooplankton survey data and the results of dominance index calculation (Table 4), the dominant species during the four sampling times totaled 13 species, belonging to five major taxa. The dominant species included seven species of Copepoda, four types of planktonic larvae, and one species each of Chaetognatha and Tunicata. The survey showed that the seven dominant zooplankton species in September 2021 (end of summer) were Oikopleura dioica, Parvocalanus crassirostris, Corycaeus affinis, Pluteus, Oithona setigera, Oithona similis, and Sagitta crassa; the dominant species in March 2022 (end of winter) totaled two species, Oithona similis and Euterpina acutifrons; in April 2022 (spring), the dominant species, totaling three, were Oithona similis, Euterpina acutifrons, and Copepoda nauplius; and in November 2022 (autumn), the dominant species, totaling six, were Oikopleura dioica, Harpacticidae, Paracalanus parvus, Oithona similis, Polychaeta larvae, and Copepoda larvae. Parvocalanus crassirostris was the first dominant species at the end of summer (0.256), Euterpina acutifrons was the first dominant species at end of winter and spring (0.820 and 0.819), and Paracalanus parvus was the first dominant species in autumn (0.245).

3.2. Ecological Niche Width (Bi) and Overlap (Qik) of Dominant Species

Based on the survey data, the niche widths and overlap degrees of dominant species in the four surveys from September 2021 to November 2022 were calculated by Equations (5) and (6) (Table 5, Table 6, Table 7 and Table 8). The niche width of zooplankton Bi in the waters of Tahe Bay ranged from 0.34 to 1.00, and the overlap degree Qik ranged from 0 to 1.00. The niche width of zooplankton Bi in the waters of Tahe Bay in September 2021 ranged from 0.71 to 1.00 (Table 5), and all of them were wide-niche species because Bi > 0.6. The maximum niche width (1.00) was found for Oithona similis, followed by Oithona setigera (0.96), and the minimum niche width (0.71) was found for Oikopleura dioica. The dominant species niche overlap was obtained using Pianka’s formula, and the range of the zooplankton niche overlap was 0 to 0.97 in September 2021 (Table 5). There were 12 pairs with a significant niche overlap (Qik ≥ 0.6), accounting for 81.0%, among which Oithona similis and Sagitta crassa had a high ecological niche overlap (0.97). There were five pairs with a significant ecological niche overlap (i.e., 0.3 ≤ Qik < 0.6), accounting for 23.8%, and a low ecological niche overlap was found between pairs of Corycaeus affinis and Sagitta crassa (0.33). There were four pairs with an ecological niche overlap index less than 0.3, accounting for 19.0%, and the ecological niche overlap between Oithona setigera and Oithona similis and Sagitta crassa species pairs was zero. The results of the calculations are shown in Table 5.
The niche widths of the dominant zooplankton species in March 2022 ranged from 0.34 to 1.00 (Table 6), with one wide niche, one medium niche, and no narrow niches. The niche width of Oithona similis (1.00) was the largest, and the niche width of Euterpina acutifrons (0.34) was the smallest. Pianka’s formula was used to calculate the niche overlap of dominant species. There was one pair with a niche overlap index of less than 0.3, and the niche overlap between pairs of Oithona similis and Euterpina acutifrons was 0.01, suggesting that the degree of interspecific competition in the community is low.
The niche widths of the dominant zooplankton species in April 2022 ranged from 0.34 to 1.00 (Table 7), with two broad niches, one medium niche, and no narrow niches. The niche width (1.00) was the largest for Oithona similis, and the niche width was the smallest for Euterpina acutifrons (0.34). The dominant species’ niche overlap was calculated using Pianka’s formula, and the zooplankton niche overlap index ranged from 0.01 to 0.91 in April 2022 (Table 7). There was one pair with a significant niche overlap (Qik ≥ 0.6), accounting for 33.3% of the total, i.e., a high niche overlap between the species pair of Oithona similis and Copepodite Nauplius larva (0.91). There was one pair with a significant ecological niche overlap (i.e., 0.3 ≤ Qik < 0.6), accounting for 33.3% of the total, i.e., the ecological niche overlap between the pair of Euterpina acutifrons and Copepoda nauplius (0.42), and there was one pair with ecological niche overlap indices of <0.3, accounting for 33.3% of the total, i.e., the ecological niche overlap between the pair of Oithona similis and Euterpina acutifrons (0.01).
The niche widths of the dominant zooplankton species in November 2022 ranged from 0.64 to 1.00 (Table 8), with six broad-niche species. The niche width of Polychaeta larvae (1.00) was the largest, followed by Oikopleura dioica (0.90), and the niche width of Oithona similis was the smallest (0.64). The dominant species niche overlap was calculated using Pianka’s formula, and the zooplankton niche overlap index ranged from 0.49 to 0.95 in November 2022 (Table 8). There were 13 pairs with a significant niche overlap (Qik ≥ 0.6), accounting for 86.7% of the total, with a high niche overlap between the species pairs of Oithona similis and Paracalanus parvus (0.95). There were two pairs with a significant ecological overlap (13.3%), with a low ecological overlap between pairs of Oikopleura dioica and Harpacticidae (0.49). There were zero pairs with an ecosystem overlap index of less than 0.3.

3.3. Zooplankton Community Structure in Relation to Environmental Factors

As shown in Table 9, the evenness (J) of zooplankton showed a highly significant negative correlation with the dissolved oxygen concentration and the inorganic phosphorus content (p < 0.01). Richness (D) showed a highly significant negative correlation with water temperature, the nitrate nitrogen content, the nitrite nitrogen content, and the ammonia nitrogen content (p < 0.05) and a highly significant positive correlation with salinity (p < 0.01); the abundance of Copepoda, Tunicata, and planktonic larvae showed highly significant positive correlations with water temperature, the nitrate nitrogen content, and the nitrite nitrogen content, respectively; highly significant negative correlations with salinity (p < 0.01); and significant negative correlations with the dissolved oxygen concentration (p < 0.05); and the abundance of Chaetognatha was positively correlated with water temperature and the nitrite nitrogen content (p < 0.05).

3.4. Factors Influencing Ecological Niche Differentiation of Dominant Zooplankton Species

In this paper, firstly, the abundance of the dominant species and environmental factors were analyzed by Pearson’s correlation method, and after manually eliminating environmental factors with variance inflation factor (VIF) > 10, the results showed that temperature, salinity, pH, DO, NH3-N, NO3-N, NO2-N, DIP, and COD, a total of nine environmental factors, had VIF ≤ 1. Secondly, the dominant zooplankton species in the waters of Tahe Bay in September 2021, March 2022, April 2022, and November 2022 were selected for de-trending correspondence analysis (DCA), and the results showed that the longest gradient length of the first sorting axis value of the dominant zooplankton species was 1.54, which is less than 3. Therefore, analysis was conducted using the RDA method to assess the correlation between zooplankton communities and the environment.
As can be seen from Figure 3, four environmental factors, COD, NH3-N, DO, and salinity, had a great correlation with the zooplankton community structure in the sea area of Tahe Bay, Lushun, in September 2021. Salinity, pH, DO, and NO3-N were positively correlated with the scores of the first principal component axis, and all other environmental factors were negatively correlated with the scores of the first principal component axis. DIP and NO2-N were positively correlated with the scores of the second principal component axis, and the other environmental factors were negatively correlated with the scores of the second principal component axis. For the dominant species, the abundance of Oikopleura dioica, Corycaeus affinis, and Oithona setigera was positively correlated with temperature, NO2-N, and COD and negatively correlated with DO, pH, and salinity; the abundance of Parvocalanus crassirostris, Pluteus, Oithona similis, and Sagitta crassa was positively correlated with salinity, COD, and pH and negatively correlated with DIP, NO2-N, and COD.
As can be seen from Figure 4, four environmental factors, namely DIP, DO, salinity, and water temperature, showed the highest correlation with the zooplankton community structure in the sea area of Tahe Bay, Lushun, in March 2022. For the dominant species, the abundance of Oithona similis was positively correlated with temperature, pH, salinity, NH3-N, NO2-N, and DIP and negatively correlated with DO, COD, and NO3-N, and the abundance of Euterpina acutifrons was positively correlated with NO3-N, DO, and COD and negatively correlated with temperature, salinity, NO2-N, NH3-N, and pH.
As can be seen from Figure 5, four environmental factors, namely DIP, DO, pH and water temperature, had a greater influence on the zooplankton community structure in the sea area of Tahe Bay, Lushun, in April 2022. For the dominant species, the abundance of Oithona similis and Copepoda nauplius was positively correlated with temperature, salinity, COD, NH3-N, NO3-N, NO2-N, and DIP, of which the abundance of Oithona similis was negatively correlated with DO, while the abundance of Euterpina acutifrons was positively correlated with DO and was negatively correlated with and all other environmental factors.
As can be seen from Figure 6, four environmental factors, namely DIP, DO, NO3-N, and water temperature, had a greater influence on the zooplankton community structure in the sea area of Tahe Bay, Lushun, Dalian, in November 2022. For the dominant species, the abundance of Harpacticidae and Copepoda larvae was positively correlated with temperature, DO, and NH3-N and negatively correlated with NO3-N, NO2-N, COD, and DIP, and the abundance of Oikopleura dioica, Oithona similis, Paracalanus parvus, and Polychaeta larvae was positively correlated with NH3-N, NO3-N, and DIP and negatively correlated with DO, salinity, and pH.

4. Discussion

4.1. Plankton Species Composition and Seasonal Variation

A total of 31 species of zooplankton, belonging to four phyla and six taxa, were recorded in the survey of Tahe Bay; among them, 13 species of Copepoda were the main zooplankton in this area, followed by 11 types of planktonic larvae, and Copepoda, such as Parvocalanus crassirostris, Paracalanus parvus, and Euterpina acutifrons, were dominant, which is similar to the results of the survey of the Bohai Sea [25,26] and the other Dalian near-shore waters [6,7].
Zooplankton abundance was the highest at the end of summer, followed by the end of winter, and lower in autumn than in spring. This result was similar to that of Wang’s study on the distribution of Copepoda in Dalian Bay [27], showing that zooplankton in the waters of Tahe Bay are dominated by Copepoda and that, as far as Copepoda are concerned, temperature, salinity, food, and currents are more important. In this survey, summer had the highest water temperature throughout the year, with an average water temperature of 23.33 °C, and the lowest salinity throughout the year, with an average of 30.23. Certain small Copepoda of wide-temperature, wide-salinity type, such as Paracalanus parvus and Oithona similis, were abundant, and similarly, large species, such as Calanus sinicus, were also relatively more abundant. Thus, this is one of the possible causes of the higher abundance of zooplankton at the end of summer, and the lower zooplankton abundance in winter may be due to the fact that some Cyanophyta species (e.g., Bacillaria paradoxa Gmelin) are less likely to be preyed upon by zooplankton in winter and, on the contrary, they can inhibit zooplankton growth when they are too abundant [28,29,30,31]. In addition, the lowest zooplankton abundance was in autumn probably due to the fact that November had the lowest water temperatures of the four sampling times, which is not favorable for zooplankton survival.

4.2. Ecological Niche Width Analysis

Niche width is an important indicator to measure the degree of species’ use of different resources, and its size depends on the species’ ability to use the resources of the environment in which they live and the degree of environmental adaptation [32]. As per the results of the niche width analysis of the dominant zooplankton species in autumn, spring, summer, and winter, the seven dominant species in September 2021 (end of summer) were all broad-niche species; of the two dominant species in March 2022 (end of winter), one species was broad niche and one species was medium niche; of the three dominant species in April 2022 (spring), two were broad niche and one was medium niche; and the six dominant species in November 2022 (autumn) were all broad-niche species. This indicates that the dominant zooplankton population in the waters of Tahe Bay is mainly composed of broad-niche species. The largest niche width values in September 2021 and March and April 2022 were all for Oithona similis (1.00), and the largest niche width value in November 2022 was for Polychaeta larvae (1.00).
Under the same environmental conditions in the sea, the larger value of niche width indicates that the organisms have a higher degree of habitat suitability and resource possession and are more likely to win in the interspecific competition, which indicates that niche width is one of the most important indicators for evaluating the ecological adaptability of a species in the biological community [33]. The number of dominant zooplankton species in autumn and summer was slightly higher than that in spring and winter, and the niche width of the dominant species changed with seasonal changes. For example, Oithona similis was a dominant species with a high niche width at the end of summer, end of winter, and in spring, but it was unable to continue to prevail in autumn, and it was gradually replaced by Polychaeta larvae and Oikopleura dioica; at end of winter and spring, Euterpina acutifrons belonged to the medium ecological niche and was replaced in autumn as it could not continue to prevail; at end of summer, the ecological niche width value of Oikopleura dioica was 0.71, and in autumn, its ecological niche width value increased to 0.90, making it the dominant species with the larger niche width compared to the other species. This indicates that a change in the niche width of species is closely related to a change in the environment, and the adaptability of species to their environment and the degree of resource use change with a change in the environment, which is similar to the results of the study by [34] in Baimahu Lake and the results of the study by [35] in the Jiuquwan reservoir. In addition, the species and number of zooplankton were significantly higher in spring than in autumn, which is basically similar to the results of the study by [36] in the northern part of the Yellow Sea and the results of the study by [37] in the Tangshan Sea Ranch. The reason may be that the temperature in spring is more favorable than that in autumn, and the nutrient salt content is more suitable for phytoplankton mass reproduction and growth, thus providing abundant food for zooplankton and a wider niche width of the zooplankton.

4.3. Ecological Niche Overlap Analysis

The degree of niche overlap can measure the similarity and competition among different species for resource use [38]. The proportions of dominant species with highly overlapping zooplankton ecological niches (Qik ≥ 0.6) were 81.0%, 0%, 33.3%, and 86.7% in September 2021, March 2022, April 2022, and November 2022, respectively, in the waters of Tahe Bay. In the existing findings, the degree of niche overlap between dominant species with larger values of niche widths tends to be higher [39], but in the study, it was found that the niche overlap index between Echinoderm plutei (0.94 for Bi) and Oithona setigera (0.96 for Bi) was only 0.29, which is not significant. This phenomenon was also found in the study by Song Chen et al. [40], which showed that the high heterogeneity of environmental resources, a patchy distribution of species, and differences in population ecological characteristics could lead to different degrees of niche overlap among species with different niche widths. Therefore, there may be some bias in judging the competitiveness of species only by the value of the niche width [39]. Secondly, the degree of niche overlap may be closely related to the seasonal differences in niche widths. A high niche overlap results in high competitive pressure for survival, causing changes in niche widths [11]. For example, the niche width value of Oithona similis was 1.00 at the end of summer but decreased to 0.64 in autumn, which may be closely related to the interspecific competition between Corycaeus affinis at the end of summer and Copepoda larvae in autumn. The overlap index of the niches between Oithona similis and Corycaeus affinis was 0.94 at the end of summer and 0.91 for the niches between Oithona similis and Copepoda larvae in autumn. The niche overlap between these species was high, which to some extent indicates that the competition between these species is intense, and the dominant species with a high niche overlap could only reduce the interspecific competition by niche differentiation, which is the same as the results of the study by Pang Songyao et al. [41] on the niches of the dominant species of macrofauna of the South Yellow Sea in spring.

4.4. Analysis of Ecological Niche Differentiation of Dominant Zooplankton Species in Relation to Environmental Factors

In this investigation of zooplankton in the waters of Tahe Bay, a total of 13 species of four phyla of zooplankton were identified, with the dominance of Copepoda, with the largest number of dominant species (seven) at the end of summer, followed by autumn (six), spring (three), and the end of winter (two), and Oithona similis was the dominant species in all four seasons. This is not in line with the results of the study by [8] in the typical aquaculture waters of Lushun, Dalian. This may be due to the fact that the water temperature was suitable in spring, and some zooplankton (e.g., Euterpina acutifrons) had a faster growth in number and occupied a dominant position in the community, which reduced the space for the survival of the other zooplankton, so the abundance and species of zooplankton were higher but the number of dominant species was smaller in spring.
In this study, the combined Pearson analysis and RDA showed that the diversity indices of zooplankton (H′, D, J) are strongly correlated with water temperature, salinity, DO, NH3-N, NO3-N, and DIP, and the ecological niche differentiation of the dominant species of zooplankton is strongly correlated with environmental factors, such as DIP, DO, salinity, and water temperature, which is similar to the findings of [11]. Environmental factors can indirectly affect the zooplankton community structure by acting on phytoplankton [34]. Nitrogen and phosphorus nutrient salts are the basic substances needed for phytoplankton growth and reproduction, and their concentration levels play an important role in phytoplankton growth, so nitrogen and phosphorus nutrient salt contents will indirectly affect the zooplankton that feed on phytoplankton [42,43], which is in line with the results of this paper. Salinity in September 2021 (end of summer) was the lowest of the year, averaging 30.23, so Oithona setigera, which is a small copepod that lives in near-shore, low-salt waters, was the dominant species at the end of summer only. The RDA in this paper also showed a significant negative correlation between the abundance of Oithona setigera and salinity at the end of summer (Figure 3), which is basically consistent with the findings of [27], who found that the abundance of Oithona setigera peaks in September in the distribution of Copepoda in the waters of Dalian Bay.
Water temperature, as an important environmental factor, has a significant effect on the physiological characteristics, metabolic rate, and growth and reproduction of zooplankton. As an important environmental factor, high or low values of water temperature have adverse effects on zooplankton’s physiological metabolic rate, growth, and reproduction [44,45], and there are differences in the responses of different zooplankton to water temperature. In this investigation, Oithona similis, as a widespread species of Copepoda (becoming dominant in all four seasons), had a significant positive correlation with water temperature and a significant negative correlation with DO, and Oithona similis was located in the top four of the dominant species in all seasons except summer (the first dominant species at the end of winter and spring and the fourth dominant in autumn). Research has demonstrated that the growth of most Copepoda zooplankton, such as Oithona similis, has a significant positive correlation with water temperature [46], which is similar to the results of this paper, so a lower water temperature is likely to be a key factor restricting the growth of zooplankton in autumn. When the dissolved oxygen content of the waters is too low, it leads to eutrophication and phytoplankton proliferate, which promotes the increase in zooplankton, and thus, it is likely to be one of the reasons that the number of dominant zooplankton species in autumn are higher than the number of dominant zooplankton in spring. Therefore, water temperature, salinity, DO, NH3-N, NO3-N, DIP, and the zooplankton diversity index are suitable as indicators for the evaluation of water quality in the waters of Tahe Bay.
RDA sequencing can not only show the relationship between the distributions of dominant species and environmental factors but also reveal the relationship between the dominant species in the habitat. It can also be used to explain some of the data obtained in the determination of the degree of ecosystem overlap that cannot be reasonably explained. For example, the ecological niche overlap index of Oithona similis and Euterpina acutifrons was 0.01, and the correlation between the two and the nine environmental factors measured was basically the opposite. The different ecological adaptations led to the differences in spatial distribution, resulting in the low ecological niche overlap index, and the competition with the other dominant species was not intense. Oithona setigera, waterflea, Oithona similis, and Sagitta crassa also showed similar distribution patterns with low ecological niche overlap indices and different environmental responses.

5. Conclusions

During the investigation of the Tahe Bay waters, a total of 31 species, representing four phyla, were identified. The zooplankton taxa were dominated by Copepoda (13 species, accounting for 41.94%). The abundance range of zooplankton was 71~42,458.26 ind/m3, with the highest value in summer and the lowest in autumn.
The number of dominant species was the highest in summer and the lowest in winter, and Oithona similis was always the dominant species in all seasons, with a niche width of 0.64–1.00, therefore being the main food organism in the waters of Tahe Bay.
The degree of ecological niche overlap of dominant species was seasonally related, and the proportion of a severe ecological niche overlap accounted for 86.7% in autumn, 81.0% in summer, and 33.3% in spring, and there was no ecological niche overlap in winter. The competition among zooplankton species may be more intense in autumn, followed by summer. Therefore, increasing the abundance of bait organisms (phytoplankton) in the waters may alleviate interspecific competition.
Pearson’s correlation of zooplankton abundance and community diversity with environmental factors, such as water temperature, salinity, DO, NH3-N, and NO3-N, was significant in the waters of Tahe Bay. The results of redundancy analysis (RDA) showed that water temperature, salinity, DO, and DIP are the main environmental factors affecting the ecological niche differentiation of dominant zooplankton species.
The results of this study can provide a reference for understanding the dynamics of planktonic animals and sustainable use of fishery organisms in the waters.

Author Contributions

Methodology, Y.Z., G.L., Y.Q. and T.T.; software, G.L.; formal analysis, Y.Z.; investigation, Z.Y., Y.W., D.Z., J.Y., L.C. and H.G.; data curation, Y.Z., Y.W., D.Z., J.Y. and H.G.; writing—original draft, Y.Z.; writing—review & editing, Z.Y., Y.Z.; supervision, Z.Y.; project administration, Z.Y.; funding acquisition, Z.Y. All authors have read and agreed to the published version of the manuscript.

Funding

This research was funded by the National Key R&D Program of China (2019YFD0901302) and the Dalian Science and Technology Fund (2021JJ11CG001).

Institutional Review Board Statement

Not applicable.

Informed Consent Statement

Not applicable.

Data Availability Statement

Data is contained within the article.

Conflicts of Interest

The authors declare no conflict of interest.

References

  1. Liang, J.S.; Yin, Z.Q.; Li, Y.; Xu, M.; Yang, M.; Niu, L.H. Bibliometrics and visualization analysis of research in the field of sustainable development of the blue economy (2006–2021). Front. Mar. Sci. 2022, 15, 936612. [Google Scholar] [CrossRef]
  2. Xia, P.; Zhang, Z.D.; Dai, X.F.; Wang, H.X.; Wang, P.X. Distribution characteristics of phytoplankton in the offshore waters of Zhejiang Province in April 2009 and the relationship with environmental factors. J. Mar. Sci. 2011, 29, 125–135. [Google Scholar]
  3. Jiang, H.C.; Liu, N.; Gao, J.Q.; Su, B.; Li, J.H.; He, J.L.; Liu, A.Y. Characteristics of zooplankton community and relationship with environmental factors in Forty Mile Bay, Yantai. Acta Ecol. Sin. 2017, 37, 1318–1327. [Google Scholar]
  4. Yildiz, I.; Feyzioglu, A.M. Distribution of mesozooplankton along to Anatolian coast in Black Sea over autumn period. Indian J. Geo-Mar. Sci. 2016, 45, 269–276. [Google Scholar]
  5. Chen, J.Y.; Geng, Z.M.; Zhang, Q.Y.; Shao, Y.; Zheng, X. Analysis of plankton community structure and key environmental factors in Baiyangdian. J. Qingdao Agric. Univ. (Nat. Sci. Ed.) 2024, 41, 50–61. [Google Scholar]
  6. Sobko, E.I.; Klimov, S.I.; Neverova, N.V.; Moreva, O.Y. The Structure of the Zooplankton Communities in Sukhoe More Bay, Southeastern White Sea. Russ. J. Mar. Biol. 2023, 49, 488–497. [Google Scholar] [CrossRef]
  7. Cataldo, D.H.; Boltovskoy, D. Yearly reproductive activity of Limnoperna fortunei (Bivalvia) as inferred from the occurrence of its larvae in the plankton of the lower Paraná river and the Río de la Plata estuary (Argentina). Aquat. Ecol. 2000, 34, 307–317. [Google Scholar] [CrossRef]
  8. Chen, Y.; Wang, L.; Shang, H.X.; Ma, L.; Xu, Y. Zooplankton community structure and its relationship with environmental factors in typical aquaculture waters of Lushunkou, Dalian. J. Aquac. 2022, 43, 1–6. [Google Scholar]
  9. Zhao, W.; Yin, X.W.; Li, B.T.; Huo, Y.Z.; Liu, Q. Community structure and spatial and temporal pattern of zooplankton in Heishi Reef, Dalian. J. Dalian Fish. Univ. 2005, 4, 270–277. [Google Scholar]
  10. Fu, F.Y.; Han, P.W.; Fang, Z.; Liu, B.L. Relationship between the horizontal distribution of zooplankton dominant species in spring and winter in the Northwest Pacific Ocean and the factors affecting them. J. Dalian Ocean. Univ. 2022, 37, 489–496. [Google Scholar]
  11. Hou, Z.W.; Sun, X.Y.; Liu, Y.L.; Zhang, C.; Zhang, W.J. Spatial ecological position of dominant zooplankton species off Yantai. Acta Ecol. Sin. 2020, 40, 5822–5833. [Google Scholar]
  12. Yang, J.Q.; Chen, L.; Yang, Y.Y.; Zhou, J.; Shi, Y.R. Spatial and temporal ecological position analysis of zooplankton dominant species in spring and summer in the Yangtze River estuary and adjacent waters. J. Fish. Sci. China 2022, 29, 1625–1635. [Google Scholar]
  13. Li, G.X.; Yin, Z.Q.; Wang, D.; Zhou, Y.Y.; Zhang, D.W. Ecological niches of dominant zooplankton species and their differentiation in the waters of Beranzi. J. Shanghai Ocean. Univ. 2024, 33, 1199–1210. [Google Scholar]
  14. Wang, D.; Yin, Z.Q.; Zhang, D.W.; Wang, Y.; Chen, L.; Yang, J. Evaluation of the Environmental Impact of Artificial Habitat on Seawater Quality in Tahe Bay, Lushun. OAJRC Environ. Sci. 2023, 4, 1–12. [Google Scholar] [CrossRef]
  15. Habib, O.A.; Tippett, R.; Murphy, K.J. Seasonal changes in phytoplankton community structure in relation to physic-chemical factors in Loch Lomond. Hydrobiologia 1997, 350, 63–79. [Google Scholar] [CrossRef]
  16. Akin, S.; Winemiller, K.; Gelwick, F. Seasonal and spatial variations in fish and macrocrustacean assemblage structure in the Mad Island Marsh estuary, Texas. Estuar. Coast. Shelf Sci. 2003, 57, 269–282. [Google Scholar] [CrossRef]
  17. Zhang, L.; Tao, H.H.; Ji, Y.L.; Su, K. Characteristics of zooplankton community structure in spring and autumn in the waters adjacent to Dongjiakou Harbour, Qingdao. J. Appl. Oceanogr. 2023, 42, 16–27. [Google Scholar]
  18. Shannon, C.E. A mathematical theory of communication. Bell Syst. Tech. J. 1948, 27, 379–423. [Google Scholar] [CrossRef]
  19. Pielou, E.C. The measurement of diversity in different types of biological collections. J. Theor. Biol. 1966, 13, 131–144. [Google Scholar] [CrossRef]
  20. Izaguirre, I.; O’farrell, I.; Unrein, F.; Sinistro, R.; Afonso, M.D.; Tell, G. Algal Assemblages Across a Wetland, from a Shallow Lake to Relictual Oxbow Lakes (Lower Paraná River, South America). Hydrobiologia 2004, 511, 25–36. [Google Scholar] [CrossRef]
  21. Haiyuan, C.; Kui, W.; Sijun, H.; Nianzhi, J.; Feng, C. Distinct patterns of picocyanobacterial communities in winter and summer in the Chesapeake Bay. Appl. Environ. Microbiol. 2010, 76, 2955–2960. [Google Scholar]
  22. Resende, P.; Azeiteiro, M.U.; Gonçalves, F.; Pereira, J.M. Distribution and ecological preferences of diatoms and dinoflagellates in the west Iberian Coastal zone (North Portugal). Acta Oecologica 2007, 32, 224–235. [Google Scholar] [CrossRef]
  23. Tian, Y.X.; Han, J.X.; Chen, B.C.; Xie, W.D.; Pan, L.R.; Meng, X. Species diversity and interspecific ecological niche characteristics of Acacia spp. in Northwest Guangxi. Guangxi For. Sci. 2022, 51, 466–474. [Google Scholar]
  24. Pianka, E.R. The structure of lizard communities. Annu. Rev. Ecol. Syst. 1973, 4, 53–74. [Google Scholar] [CrossRef]
  25. Yang, L.; Liu, J.; Zhang, J.; Wang, X.L.; Xu, Y.; Li, X.; He, L. Changes of zooplankton community and its relationship with environmental factors in Bohai Bay. J. Mar. Sci. 2018, 36, 93–101. [Google Scholar]
  26. Li, Z.L.; Zhang, H.Y.; Zhao, L.; Xu, F. Spatial and temporal distribution of phytoplankton community structure in the Bohai Sea and its influencing factors. Mar. Sci. 2021, 45, 10–20. [Google Scholar]
  27. Wang, Z.L. Distribution of planktonic Copepoda in Dalian Bay. Adv. Mar. Sci. 1995, 1, 47–54. [Google Scholar]
  28. Zhou, X.S.; Li, N.; Sun, B.W.; Gao, X.P. Seasonal changes of plankton community structure in Baiyangdian and its relationship with environmental factors. Water Resour. Hydropower Eng. 2021, 52, 110–119. [Google Scholar]
  29. Tang, C.H.; Yi, Y.J.; Yang, Z.F.; Yang, Z.; Zerizghi, T.; Wang, X.; Cui, X.L.; Duan, P.Y. Planktonic indicators of trophic states for a shallow lake (Baiyangdian Lake, China). Limnologica 2019, 78, e125712. [Google Scholar] [CrossRef]
  30. Jakobsen, H.H.; Blanda, E.; Staehr, P.A.; Højgård, J.K.; Rayner, T.A.; Pedersen, M.F.; Jepsen, P.M.; Hansen, B.W. Development of phytoplankton communities: Implications of nutrient injections on phytoplankton composition, pH and ecosystem production. J. Exp. Mar. Biol. Ecol. 2015, 473, 81–89. [Google Scholar] [CrossRef]
  31. Ismail, H.A.; Lim, C.C.; Omar WM, W. Evaluation of spatial and temporal variations in zooplankton community structure with reference to water quality in Teluk Bahang Reservoir, Malaysia. Trop. Ecol. 2019, 60, 186–198. [Google Scholar] [CrossRef]
  32. Chen, X.C.; Zhu, L.Y.; Huang, Y.; Gong, W.J.; Hao, Y. Research on zooplankton community structure in the South Yellow Sea. Mar. Sci. 2017, 41, 41–49. [Google Scholar]
  33. Feng, Y.C.; Zheng, X.Y.; Wang, Z.N.; Liu, B.; Lan, S.R. Characteristics of ecological niche of understorey herb layer populations in pure and mixed fir forests. J. Ecol. Rural. Environ. 2019, 35, 217–224. [Google Scholar]
  34. Fan, L.J.; Hu, X.D.; Chen, W.M.; Wang, C.M. Zooplankton ecological niche and its ecological differentiation factors in Lake Baima. J. Hydroecology 2022, 43, 59–66. [Google Scholar]
  35. Luo, H.; Wu, Q.; Chen, Q.; Chen, W.L.; Chen, H.X. Characterisation of zooplankton dominant species succession and ecological niche analysis in Jiuquwan Reservoir after ecological restoration. J. Ecol. Environ. 2021, 30, 320–330. [Google Scholar]
  36. Duan, Y.; Wang, A.Y.; Wang, X.L.; Liu, X.Z.; Chai, Y. Ecological characteristics and spatial and temporal distribution of zooplankton in spring and summer in the northern Yellow Sea. Fish. Sci. 2017, 36, 456–461. [Google Scholar]
  37. Zhao, Q.; Liu, H.; Zhang, X.W.; Qi, Z.L.; Li, C. Zooplankton community structure and ecological niche in Tangshan Sea Ranch. Hebei Fish. 2021, 10, 17–24+30. [Google Scholar]
  38. Wathne, J.A.; Haug, T.; Lydersen, C. Prey preference and niche overlap of ringed seals Phoca hispida and harp seals P. groenlandica in the Barents Sea. Mar. Ecol. Prog. Ser. 2000, 194, 233–239. [Google Scholar] [CrossRef]
  39. Liu, K.; Yu, C.G.; Xu, Y.J.; Jiang, X.Q.; Zheng, J. Spatial ecological niche analysis of major crustacean species in spring and autumn in the eastern waters of Zhoushan Islands. J. Zhejiang Univ. (Sci. Ed.) 2021, 48, 450–460+480. [Google Scholar]
  40. Song, C.; Meng, Z.; Wang, X.B.; Han, Q.X. Ecological niches of dominant zooplankton species and their ecological differentiation in Zhoushan waters during the summer of 2019–2020. Acta Oceanol. Sin. 2022, 44, 127–139. [Google Scholar]
  41. Peng, S.Y.; Li, X.Z.; Wang, H.F.; Zhang, B.L. Ecological niche of dominant macrobenthic species in the South Yellow Sea in spring. Acta Ecol. Sin. 2015, 35, 1917–1928. [Google Scholar]
  42. Zhu, Z.; Sun, X.; Yang, X.R.; Tang, X.F.; Hu, Y.Q.; Zhang, M. Characteristics of seasonal dynamics of phytoplankton community in Chaohu Lake and its influencing factors. Environ. Monit. China 2024, 40, 129–142. [Google Scholar]
  43. Tao, M.; Xiong, Y.; Li, B.; Wang, Z.J.; Huang, J. Spatial and temporal distribution of phytoplankton communities in the Sichuan section of the Jialing River and their environmental impact factors. Resour. Environ. Yangtze Basin 2021, 30, 1680–1694. [Google Scholar]
  44. Devreker, D.S.S.; Seuront, L. Effects of chlorophyll concentration and temperature variation on the reproduction and survival of Temora longicornis (Copepoda, Calanoida) in the Eastern English Channel. J. Exp. Mar. Biol. Ecol. 2004, 318, 145–162. [Google Scholar] [CrossRef]
  45. Lenz, P.H.; Herma, E.; Hartline, D.K. Temperature compensation in the escape response of a marine copepod, Calanus finmarchicus (Crustacea). Biol. Bull. 2005, 209, 75–85. [Google Scholar] [CrossRef]
  46. Wang, X.X.; Huo, J.; Yang, Y.Y.; Liu, X.B.; Zhang, X.M. Zooplankton community structure and seasonal changes in the nearshore waters of northern Shandong Peninsula. Ecol. Sci. 2024, 43, 163–170. [Google Scholar]
Figure 1. Map of survey stations in the sea area of Tahe Bay, Lushun.
Sustainability 16 08590 g001
Figure 2. The zooplankton abundance at different sampling times in the Tahe Bay waters.
Sustainability 16 08590 g002
Figure 3. Redundancy analysis of zooplankton and environmental factors in September 2021. Note: The first principal component of the graph contributes 83.93% and the second principal component contributes 12.81% of the sample variation. B01: Oikopleura dioica; B02: Parvocalanus crassirostris; B03: Corycaeus affinis; B04: Pluteus; B05: Oithona setigera; B06: Oithona similis; B07: Sagitta crassa.
Sustainability 16 08590 g003
Figure 4. Redundancy analysis of zooplankton and environmental factors in March 2022. Note: The first principal component of the graph contributes 99.88% and the second principal component contributes 0.12% to sample variation. B06: Oithona similis; B08: Euterpina acutifrons.
Sustainability 16 08590 g004
Figure 5. Redundancy analysis of zooplankton and environmental factors in April 2022. Note: The first principal component of the plot contributes 99.74% and the second principal component contributes 0.26% to sample differences. B06: Oithona similis; B08: Euterpina acutifrons; B09: Copepoda nauplius.
Sustainability 16 08590 g005
Figure 6. Redundancy analysis of phytoplankton and environmental factors in November 2022. Note: The first principal component of the graph contributes 82.47% and the second principal component contributes 16.03% to the sample variation. B01: Oikopleura dioica; B010: Paracalanus parvus; B06: Oithona similis; B012: Polychaeta larvae; B013 Copepoda larvae.
Sustainability 16 08590 g006
Table 1. The coordinates of sampling stations.
StationLatitudeLongitude
S138°47′53.84″ N121°19′12.46″ E
S238°47′59.54″ N121°19′2.25″ E
S338°47′59.78″ N121°19′23.92″ E
S438°48′26.92″ N121°19′42.74″ E
S538°48′50.63″ N121°19′40.40″ E
S638°48′25.86″ N121°19′43.69″ E
S738°47′59.85″ N121°19′23.90″ E
S838°47′55.86″ N121°19′2.25″ E
S938°48′6.73″ N121°19′13.31″ E
S1038°48′6.62″ N121°19′18.79″ E
S1138°48′8.16″ N121°19′16.48″ E
S1238°48′15.21″ N121°19′23.76″ E
S1338°48′47.46″ N121°19′19.75″ E
S1438°48′32.54″ N121°19′23.68″ E
S1538°48′01.16″ N121°19′08.97″ E
S1638°48′45.30″ N121°19′17.80″ E
Table 2. Number of zooplankton species in the waters of Tahe Bay in 4 different seasons.
TaxaSeptember 2021
(End of Summer)
March 2022
(End of Winter)
April 2022 (Spring)November 2022
(Autumn)
Copepoda5875
Cladocera1000
Planktonic larvae2663
Tunicata1001
Chaetognatha1111
Others1330
Table 3. Number of zooplankton species and evaluation indices in the sea area of Tahe Bay.
Sampling TimeZooplankton
Shannon–Wiener’s
Diversity Index (H’)
Margalef’s Index (D)Pielou Index (J)
September 20212.050.940.70
March 20220.861.930.14
April 20222.221.810.34
November 20222.814.990.29
Median2.141.870.32
Table 4. Dominant zooplankton species in the waters of Tahe Bay.
Serial NumberSpecies NameDominance Index
September 2021
(End of Summer)
March 2022
(End of Winter)
April 2022 (Spring)November 2022
(Autumn)
B01Oikopleura dioica0.114 0.027
B02Parvocalanus crassirostris0.256
B03Corycaeus affinis0.193
B04Pluteus0.091
B05Oithona setigera0.049
B06Oithona similis0.0510.0350.0440.227
B07Sagitta crassa0.023
B08Euterpina acutifrons 0.8200.819
B09Copepoda nauplius 0.030
B010Harpacticidae 0.118
B011Paracalanus parvus 0.245
B012Polychaeta larvae 0.082
B013Copepoda larvae 0.15
Table 5. Zooplankton niche width (Bi) and niche overlap (Qik) statistics in September 2021.
CodeBiQik
B01B02B03B04B05B06B07
B010.711
B020.940.781
B030.840.940.821
B040.940.440.890.601
B050.960.750.500.860.291
B061.000.340.840.400.930.001
B070.920.290.800.330.900.000.971
Note: See Table 4 for species codes in the figure.
Table 6. Zooplankton niche width (Bi) and niche overlap (Qik) statistics for March 2022.
CodeBiQik
B06B08
B061.001
B080.340.011
Note: See Table 4 for species codes in the figure.
Table 7. Zooplankton niche width (Bi) and niche overlap (Qik) statistics for April 2022.
CodeBiQik
B06B08B09
B061.001
B080.340.011
B090.960.910.421
Note: See Table 4 for species codes in the figure.
Table 8. Zooplankton niche width (Bi) and niche overlap (Qik) statistics in November 2022.
CodeBiQik
B01B010B011B06B012B013
B010.901
B0100.800.491
B0110.880.840.811
B060.640.890.630.951
B0121.000.770.550.880.851
B0130.680.820.730.890.910.601
Note: See Table 4 for species codes in the figure.
Table 9. Correlation of zooplankton community indicators with environmental factors.
Zooplankton
Community Indicator
Water Temperature (°C)SalinitypHDissolved Oxygen Concentration (mg/L)Chemical Oxygen Demand (mg/L)Ammonia–Nitrogen Content (μg/L)Nitrate–Nitrogen Content (μg/L)Nitrite–Nitrogen Content (μg/L)Inorganic Phosphorus Content (μg/L)
H′0.166−0.024−0.094−0.325−0.1370.130.0170.111−0.159
J0.379−0.168−0.518−0.864 **−0.2810.4710.0140.397−0.705 **
D−0.645 *0.677 **−0.2560.3430.244−0.658 *−0.560 *−0.608 *0.013
Abundance of Copepoda0.935 **−0.920 **0.391−0.546 *−0.3210.909 **0.778 **0.848 **0.015
Abundance of Tunicata0.780 **−0.727 **0.211−0.582 *−0.030.900 **0.703 **0.753 **−0.088
Abundance of planktonic larvae0.927 **−0.837 **0.286−0.616 *−0.4670.897 **0.626 *0.881 **−0.124
Abundance of other zooplankton0.408−0.4140.118−0.327−0.0160.2310.4860.1450.087
Abundance of Cladocera0.411−0.3690.122−0.268−0.3190.3130.2540.179−0.017
Abundance of Chaetognatha0.587 *−0.510.18−0.363−0.5250.5150.2670.539 *−0.115
Note: “*” indicates a significant correlation at the 0.05 level (two sided); “**” indicates a significant correlation at the 0.01 level (two sided).
Disclaimer/Publisher’s Note: The statements, opinions and data contained in all publications are solely those of the individual author(s) and contributor(s) and not of MDPI and/or the editor(s). MDPI and/or the editor(s) disclaim responsibility for any injury to people or property resulting from any ideas, methods, instructions or products referred to in the content.

