Optimizing the Operation of Grid-Interactive Efficient Buildings (GEBs) Using Machine Learning
Abstract
1. Introduction
1.1. Data Pre-Processing
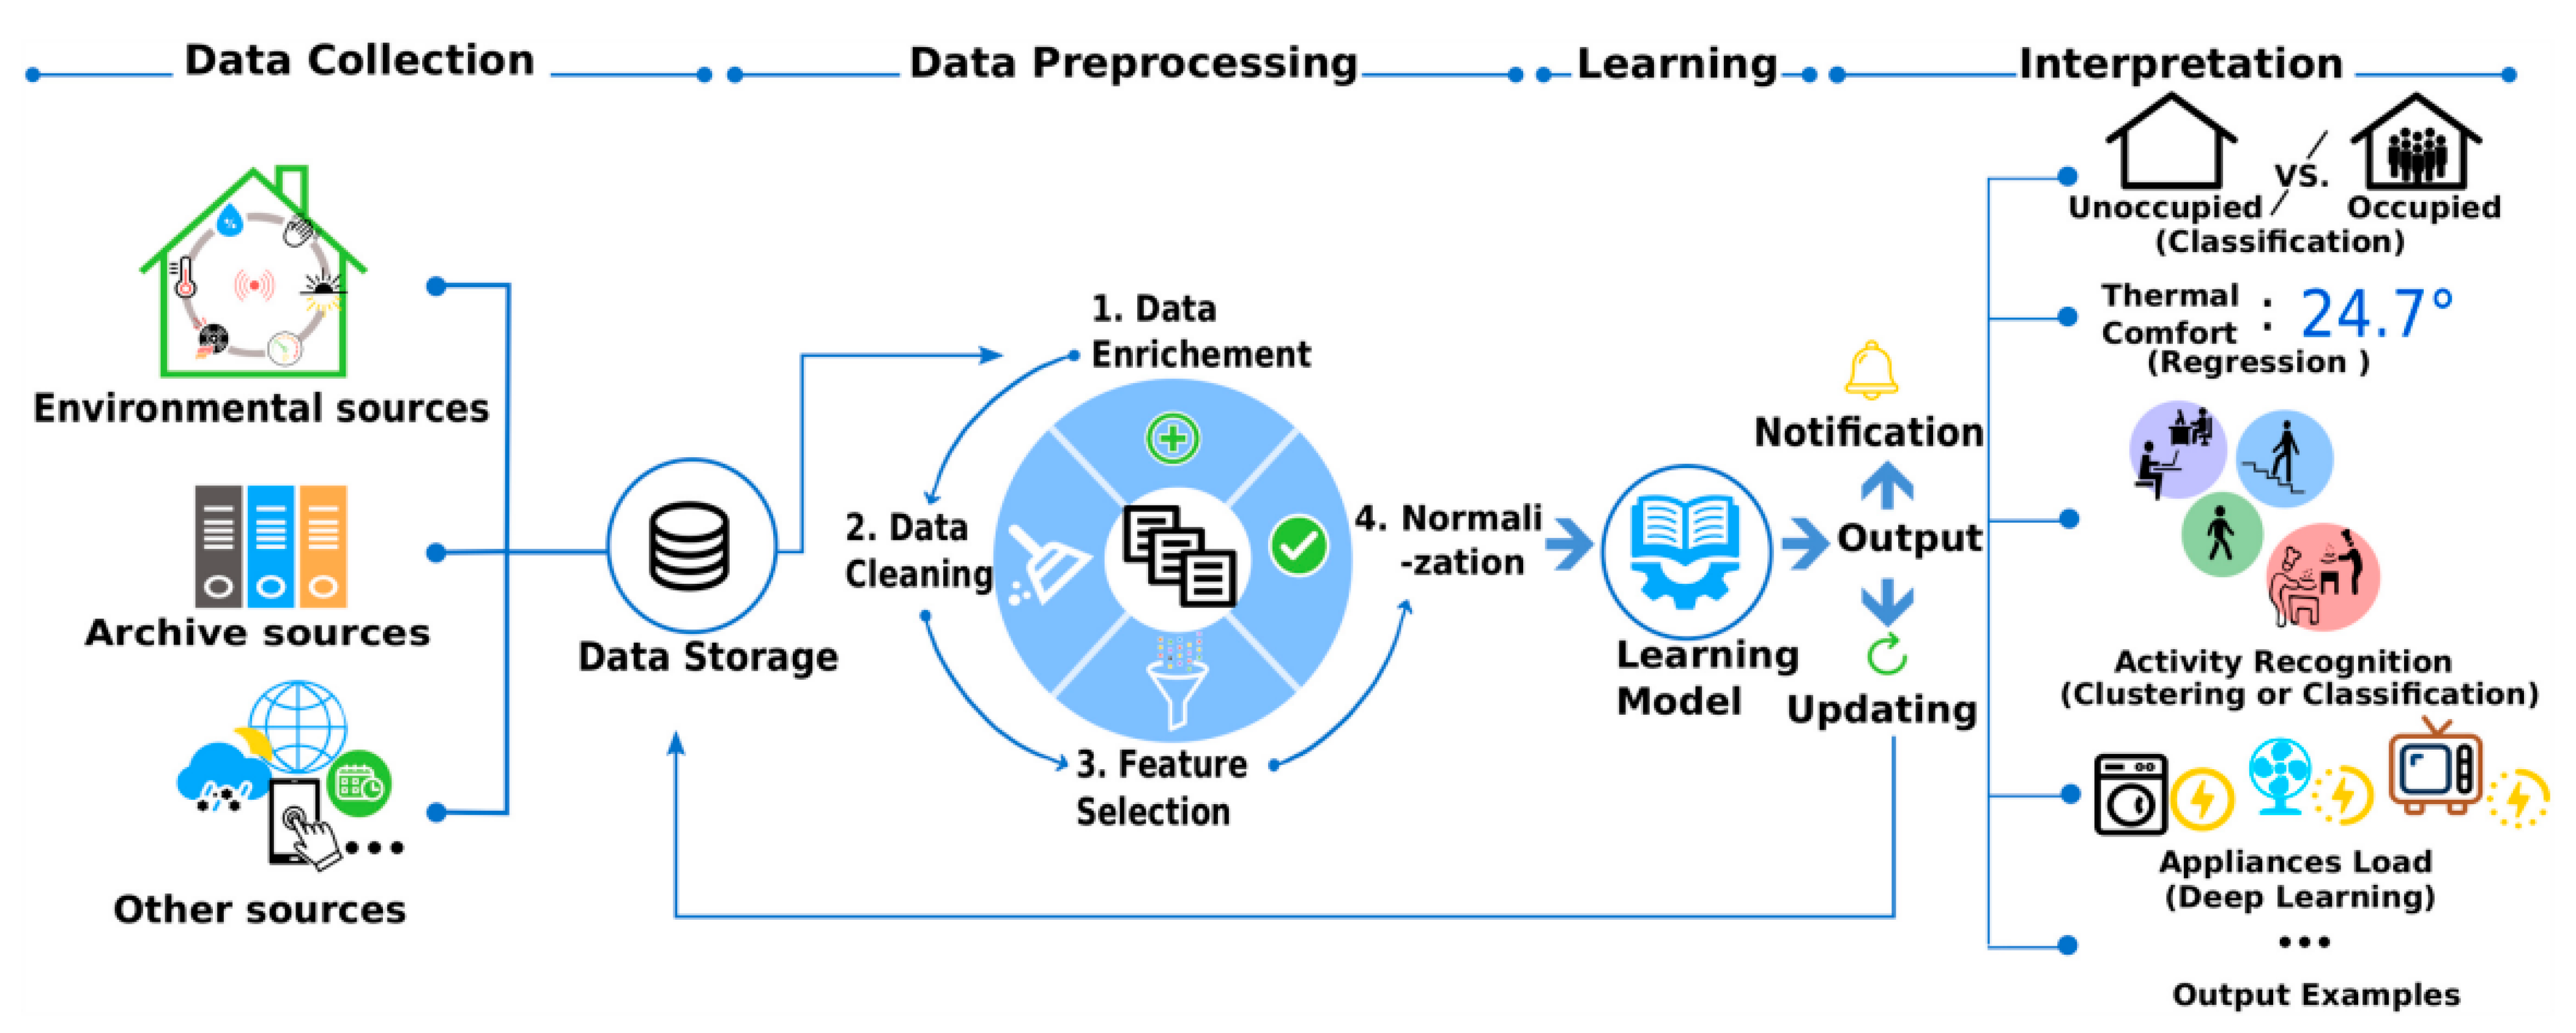
- Data enrichment: dataset enhancement with statistical information.
- Data cleaning: Natural Language Processing (NLP) techniques [9] for textual data.
- Data filtering: elimination of irrelevant features from the dataset, which enhances system efficiency.
- Data normalization: data scaling for accurate comparisons.
Forecasting Performance Criteria
| Method | RMSE | nRMSE (%) | Reference |
|---|---|---|---|
| Linear Regression | 50.96 MW | 0.864 | [12] |
| Compound-Growth | 90.76 MW | 1.539 | [12] |
| Cubic Regression | 98.63 MW | 1.673 | [12] |
| ANN | 13.3891 kW | 3.6995 | [13] |
| SVR-RB | 11.6557 kW | 3.2205 | [13] |
| SVR-Poly | 14.2854 kW | 8.2536 | [13] |
| SVR-Linear | 15.8223 kW | 6.1628 | [13] |
1.2. Machine Learning Methods for Electric Load Forecasting
1.3. Techniques for Machine Learning Optimization
- Optimal Training Data Length (Readings Duration)
- 2.
- Parameter Weighting Algorithms for Feature Selection
- Investigate optimal pre-processing methods, training dataset sizes, and automated feature selection methods for enhanced model accuracies.
- Identify the best-performing machine learning algorithm for building and grid electric load forecasting by extensively training and testing with actual electricity consumption readings.
- Develop and integrate building and grid electric load forecasting systems, considering the impacts of local solar PV and electric vehicle (EV) charging, and present findings through an interactive GUI.
- Estimate potential savings of implementing the proposed electric load forecasting system through a case study with verified network stability using industry standard ETAP and Trimble ProDesign software.
2. Methodology
2.1. Normalization of Machine Learning Forecasting Performance Measures
2.2. Data Collection
- IEEE Data port: Short-Term Load Forecasting using an LSTM Neural Network [21];
- MathWorks File Exchange: Long Term Energy Forecasting with Econometrics in MATLAB [22];
- MathWorks File Exchange: Electricity Load and Price Forecasting Webinar Case Study [23];
- UK National Grid Dataset [24].
- AMMP Energy Consumption Tracker (Internal BH Record) [25];
- Arizona State University (ASU) Campus Metabolism [26];
- The Building Data Genome 2 (BDG2) Project Data Set [27];
- UCL Smart Energy Research Lab: Energy Use in GB domestic buildings 2021 [28];
- IEEE Data port: Short-Term Load Forecasting Data with Hierarchical Advanced Metering Infrastructure and Weather Features [29].
2.3. Pre-Processing
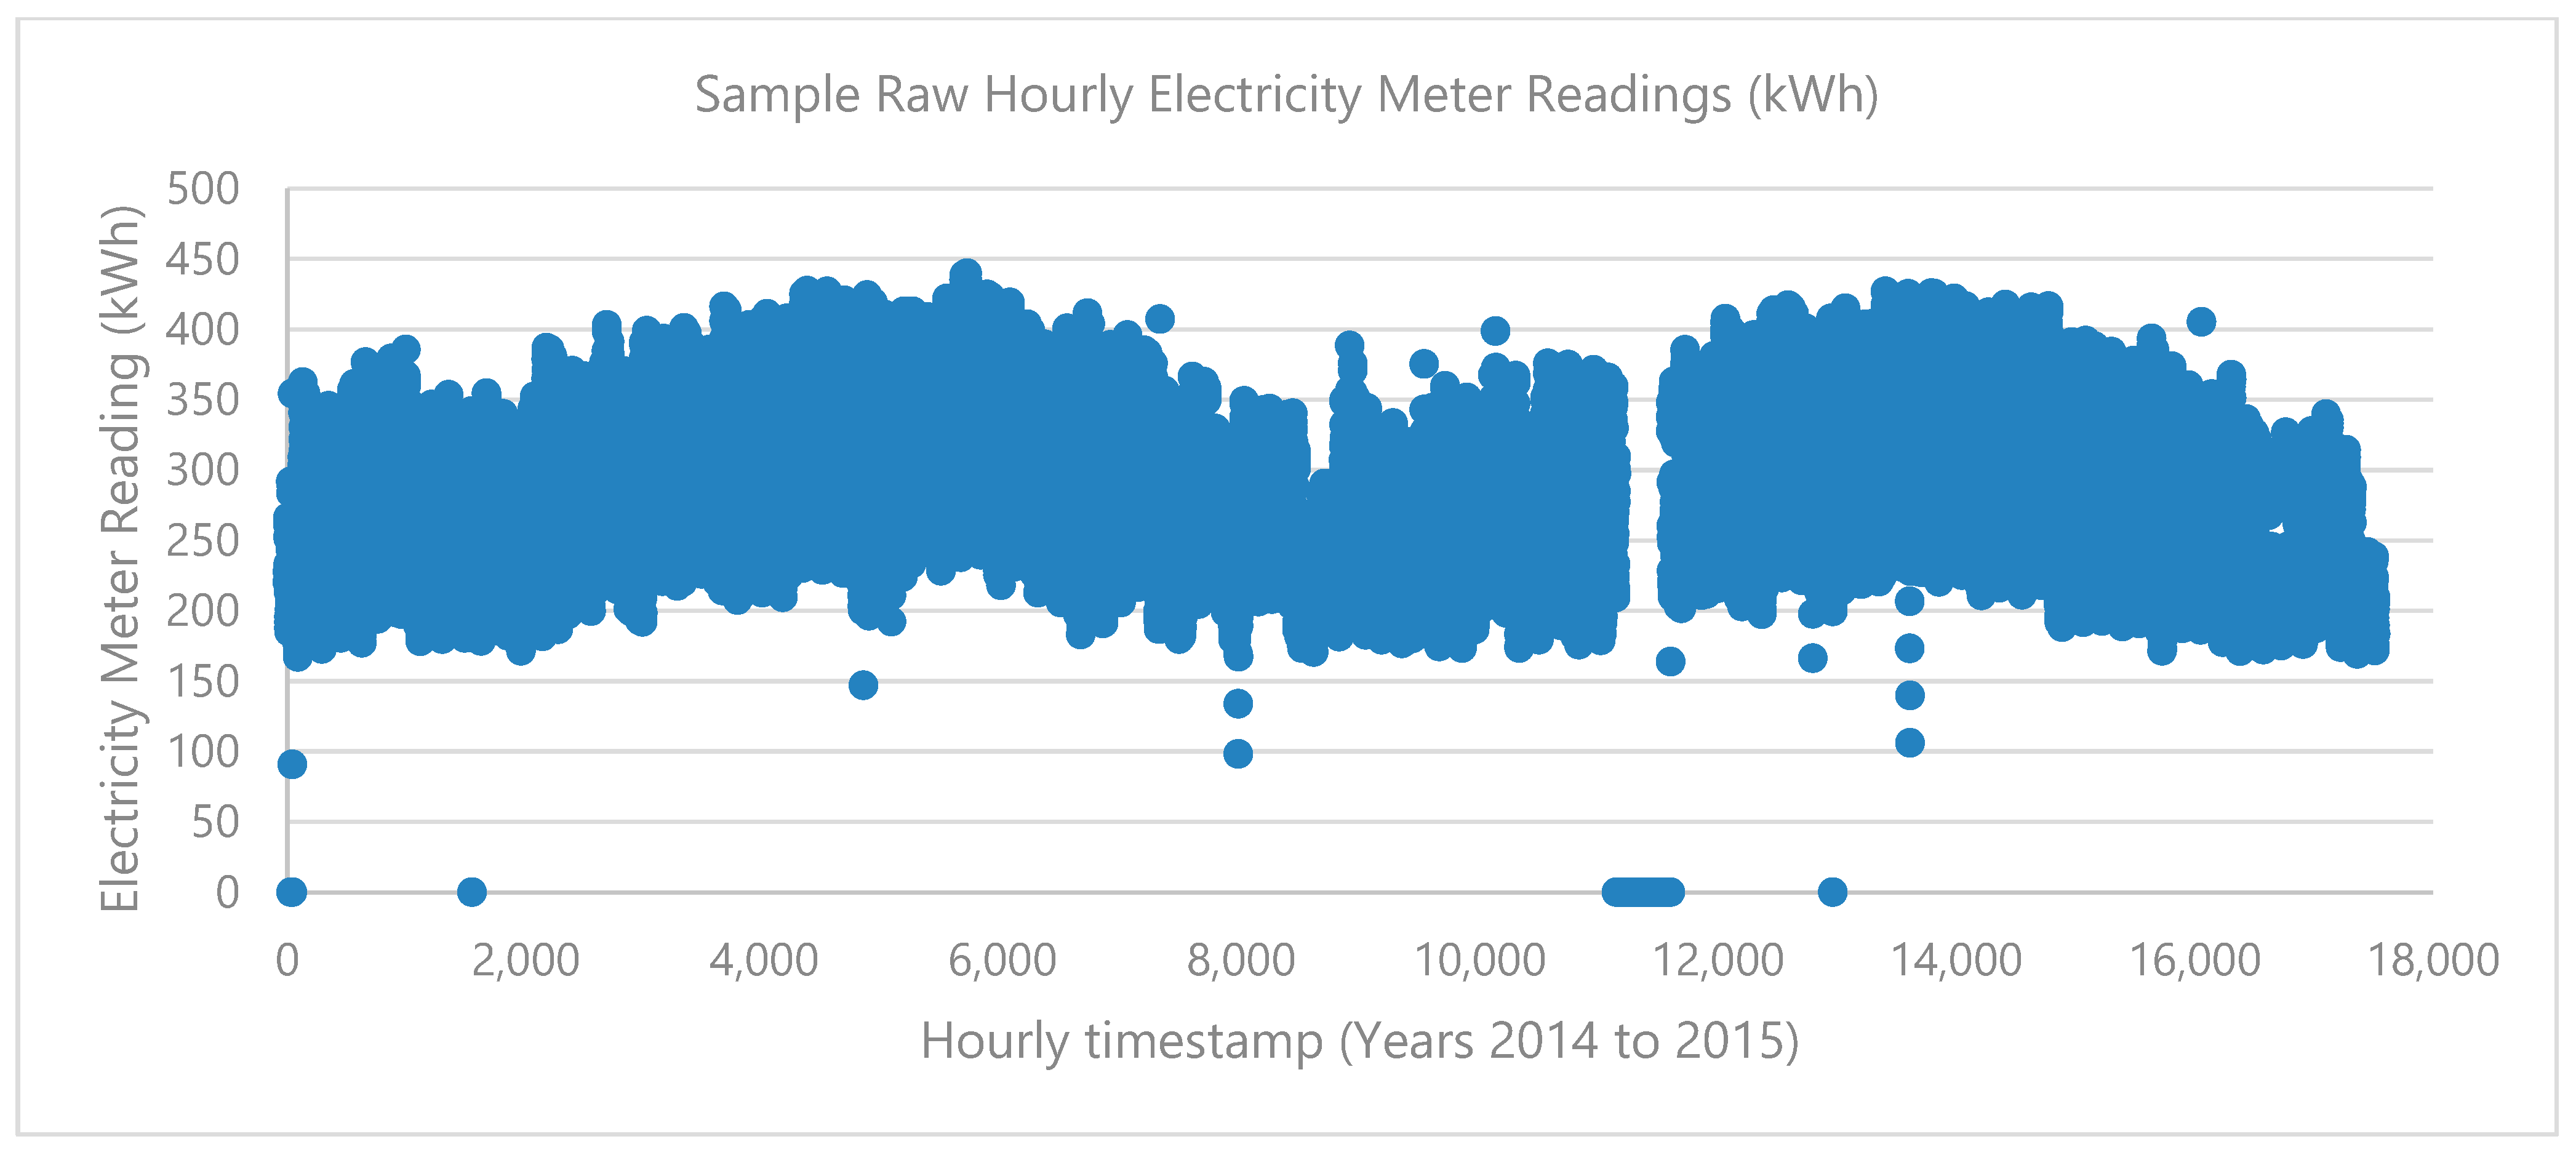
- Identification and removal of data anomalies, such as prolonged streaks of zero values and large positive or negative spikes, were determined through visual inspection. Outlier data were identified using lower and upper bounds calculated from the median and interquartile range (IQR) of differences in consecutive readings, specifically targeting consecutive values with differences greater than 100 kWh.
- Linear interpolation was employed to address missing temperature values.
2.4. Machine Learning (ML) Model Training and Testing
2.5. Building to Grid Interface
- Average diurnal values for EV and PV operations represent daily load variations.
- The ratio of the difference to actual values was calculated for each timestamp and applied to the forecasting electric load figure.
3. Results and Validation
3.1. Data Pre-Processing
3.2. Machine Learning (ML) Model Training and Testing
3.2.1. Feature Selection and Parameter Weighting
- BDG2 building dataset [27]—Opting for the top five out of eight features, with consideration given to the sixth feature’s score being less than 50% of the fifth feature.
- UTD campus load data [29]—Selection of the top fifteen out of twenty features, ensuring that the score of the sixteenth feature is less than 70% of the fifteenth feature.
- ERCOT grid data [21]—Choosing the top four out of six features, with consideration given to the fifth feature’s score being less than 50% of the fourth feature, or the top four features having an ‘infinite’ F-test score.
3.2.2. Optimal Training Data Duration
3.2.3. Forecasting Model Training and Selection
3.3. Case Study Verification
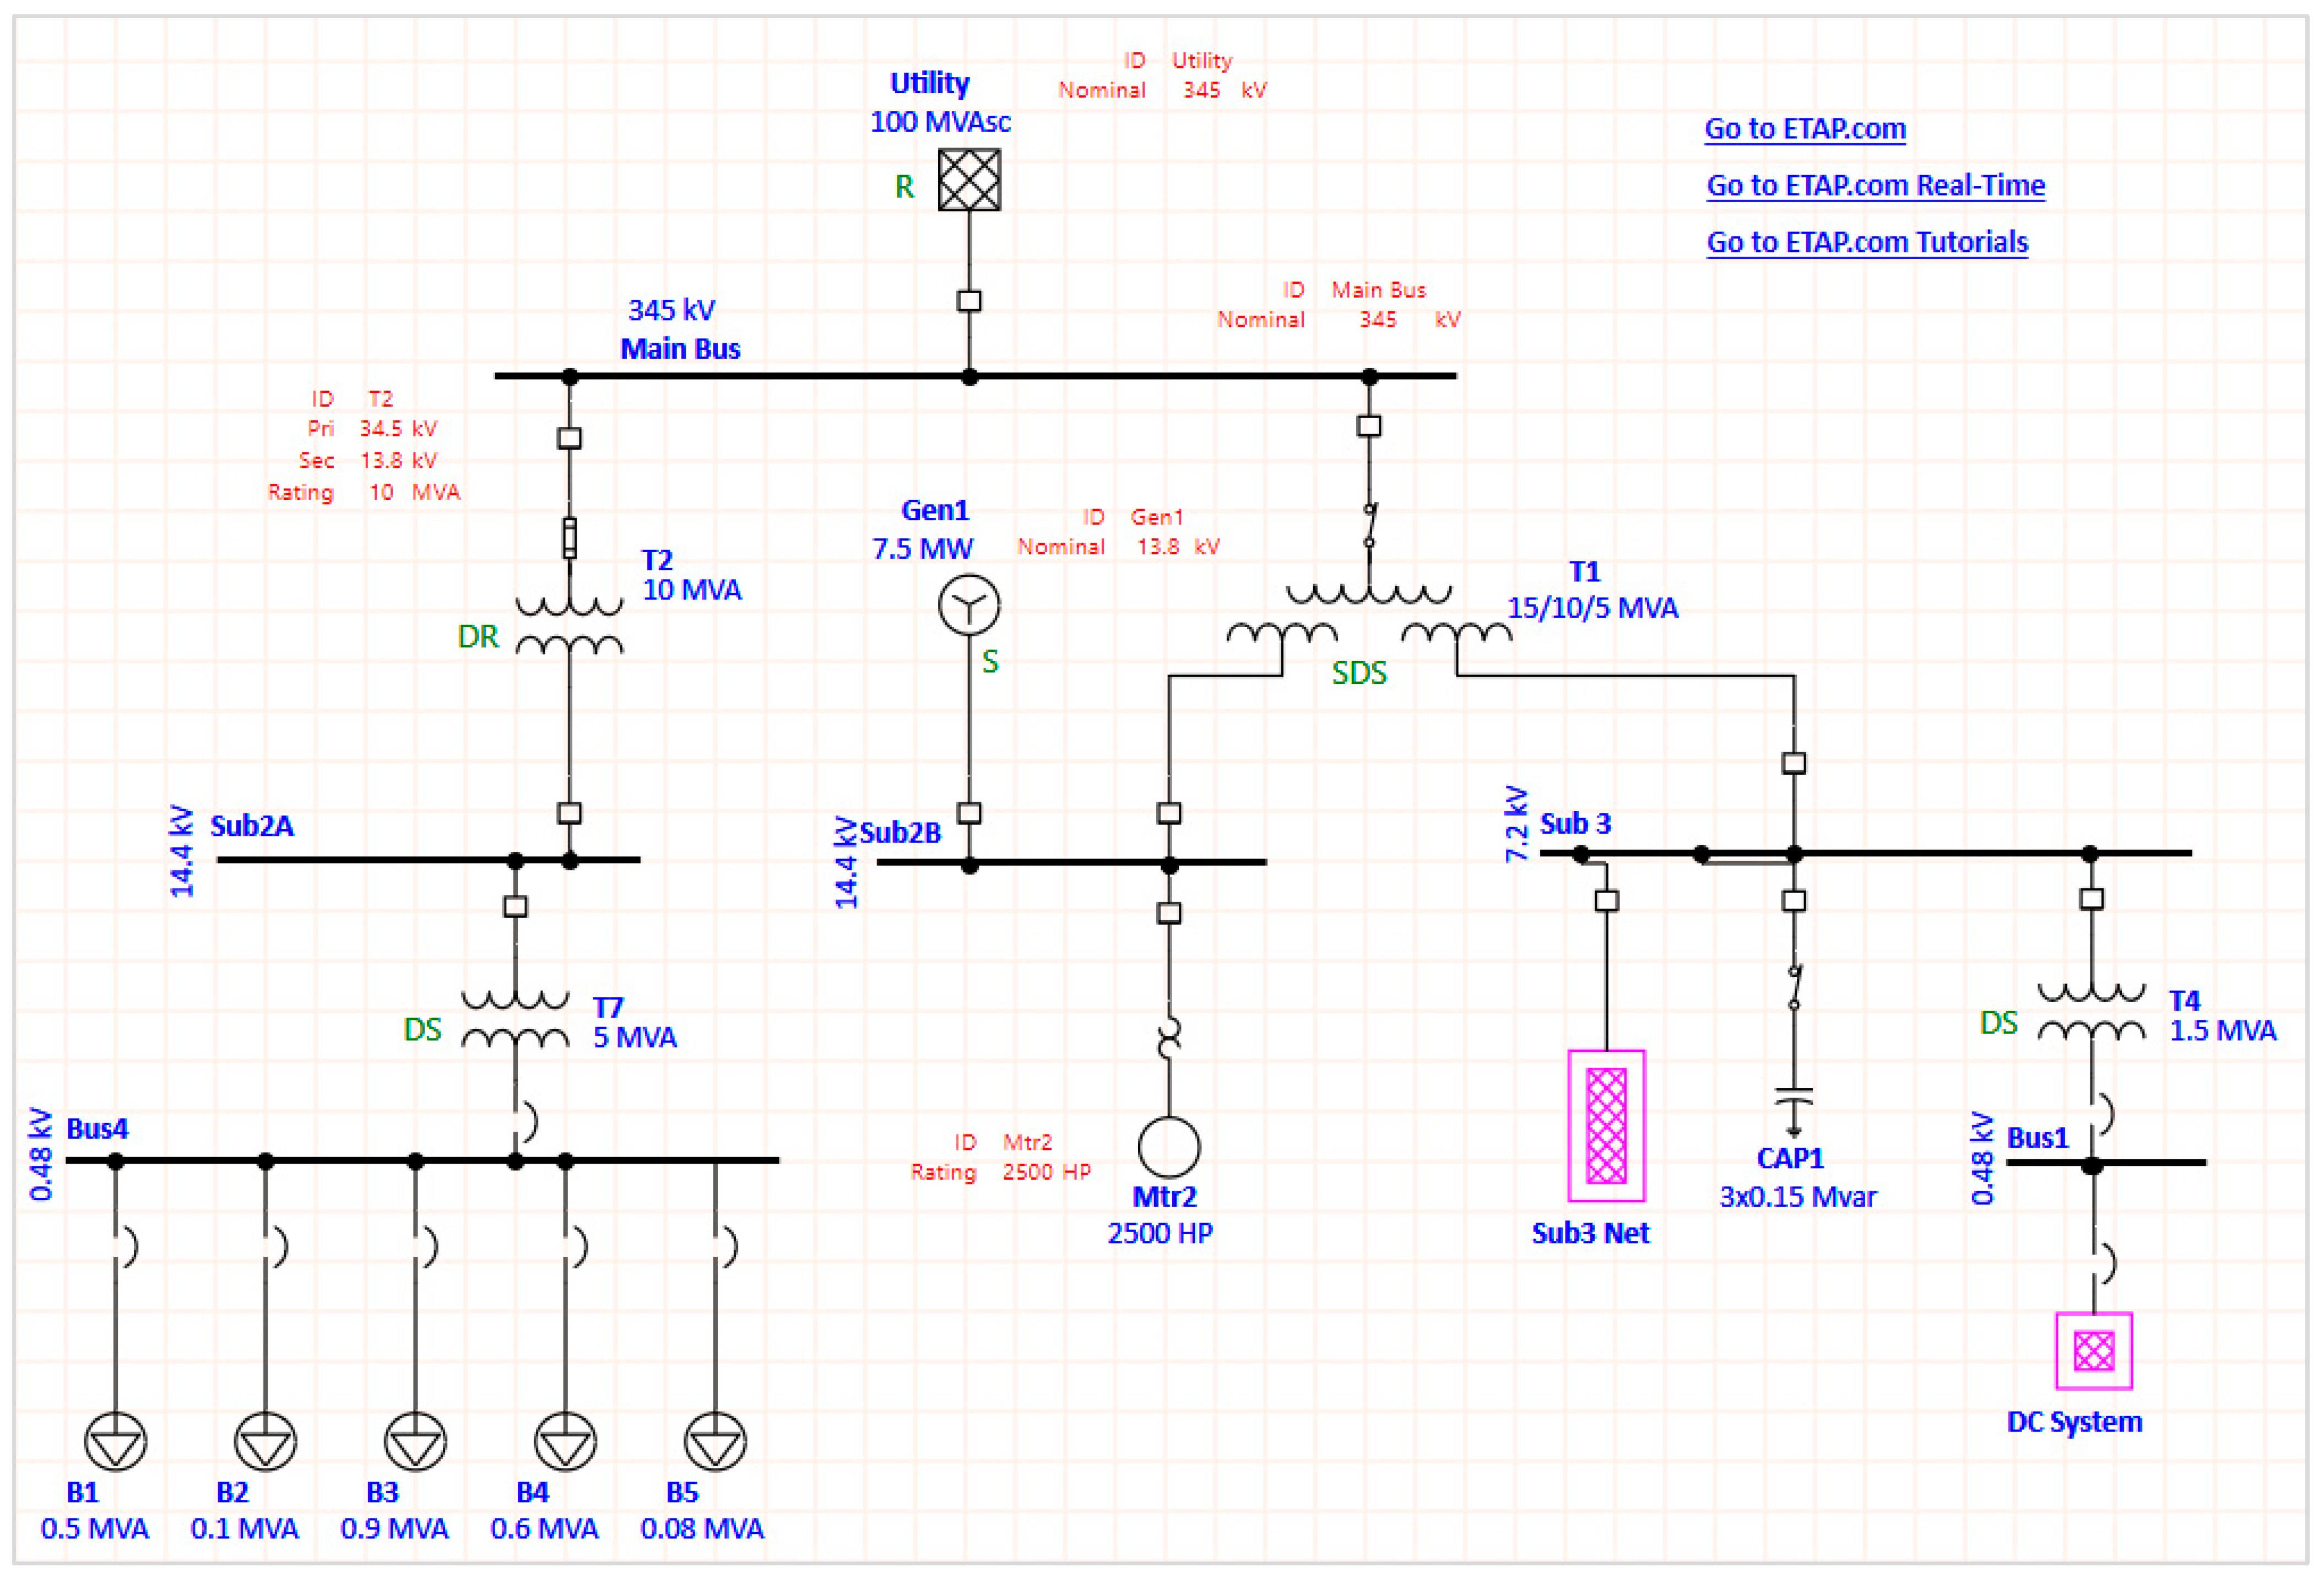
- One MV/LV transformer feeds five campus buildings within the same plot.
- Equal distances between the MV/LV transformer and campus buildings were considered.
- All campus buildings were modeled as ‘lump loads’ based on the maximum loads recorded from the UTD database [29] plus a 10% spare.
- All demand loads were applied with a power factor of 0.8 and a frequency of 60 Hz.
3.4. System Savings Estimation
3.4.1. Electric Vehicle (EV) Local Forecasting Savings
3.4.2. Solar Photovoltaic (PV) Local Forecasting Savings
3.4.3. Combined System Electricity Demand Forecasting Savings
3.5. Graphical User Interface (GUI) Integration
4. Discussion
4.1. Regression Model Training Optimization
- RMSE figures are commonly available in previously published papers, facilitating direct comparisons between model performances.
- The RMSE formula squares the prediction difference, highlighting larger differences and representing the worst-case forecasting figure.
- RMSE is equivalent to the mathematical standard deviation of residuals, providing an average difference between predicted and actual values, useful for determining system accuracy.
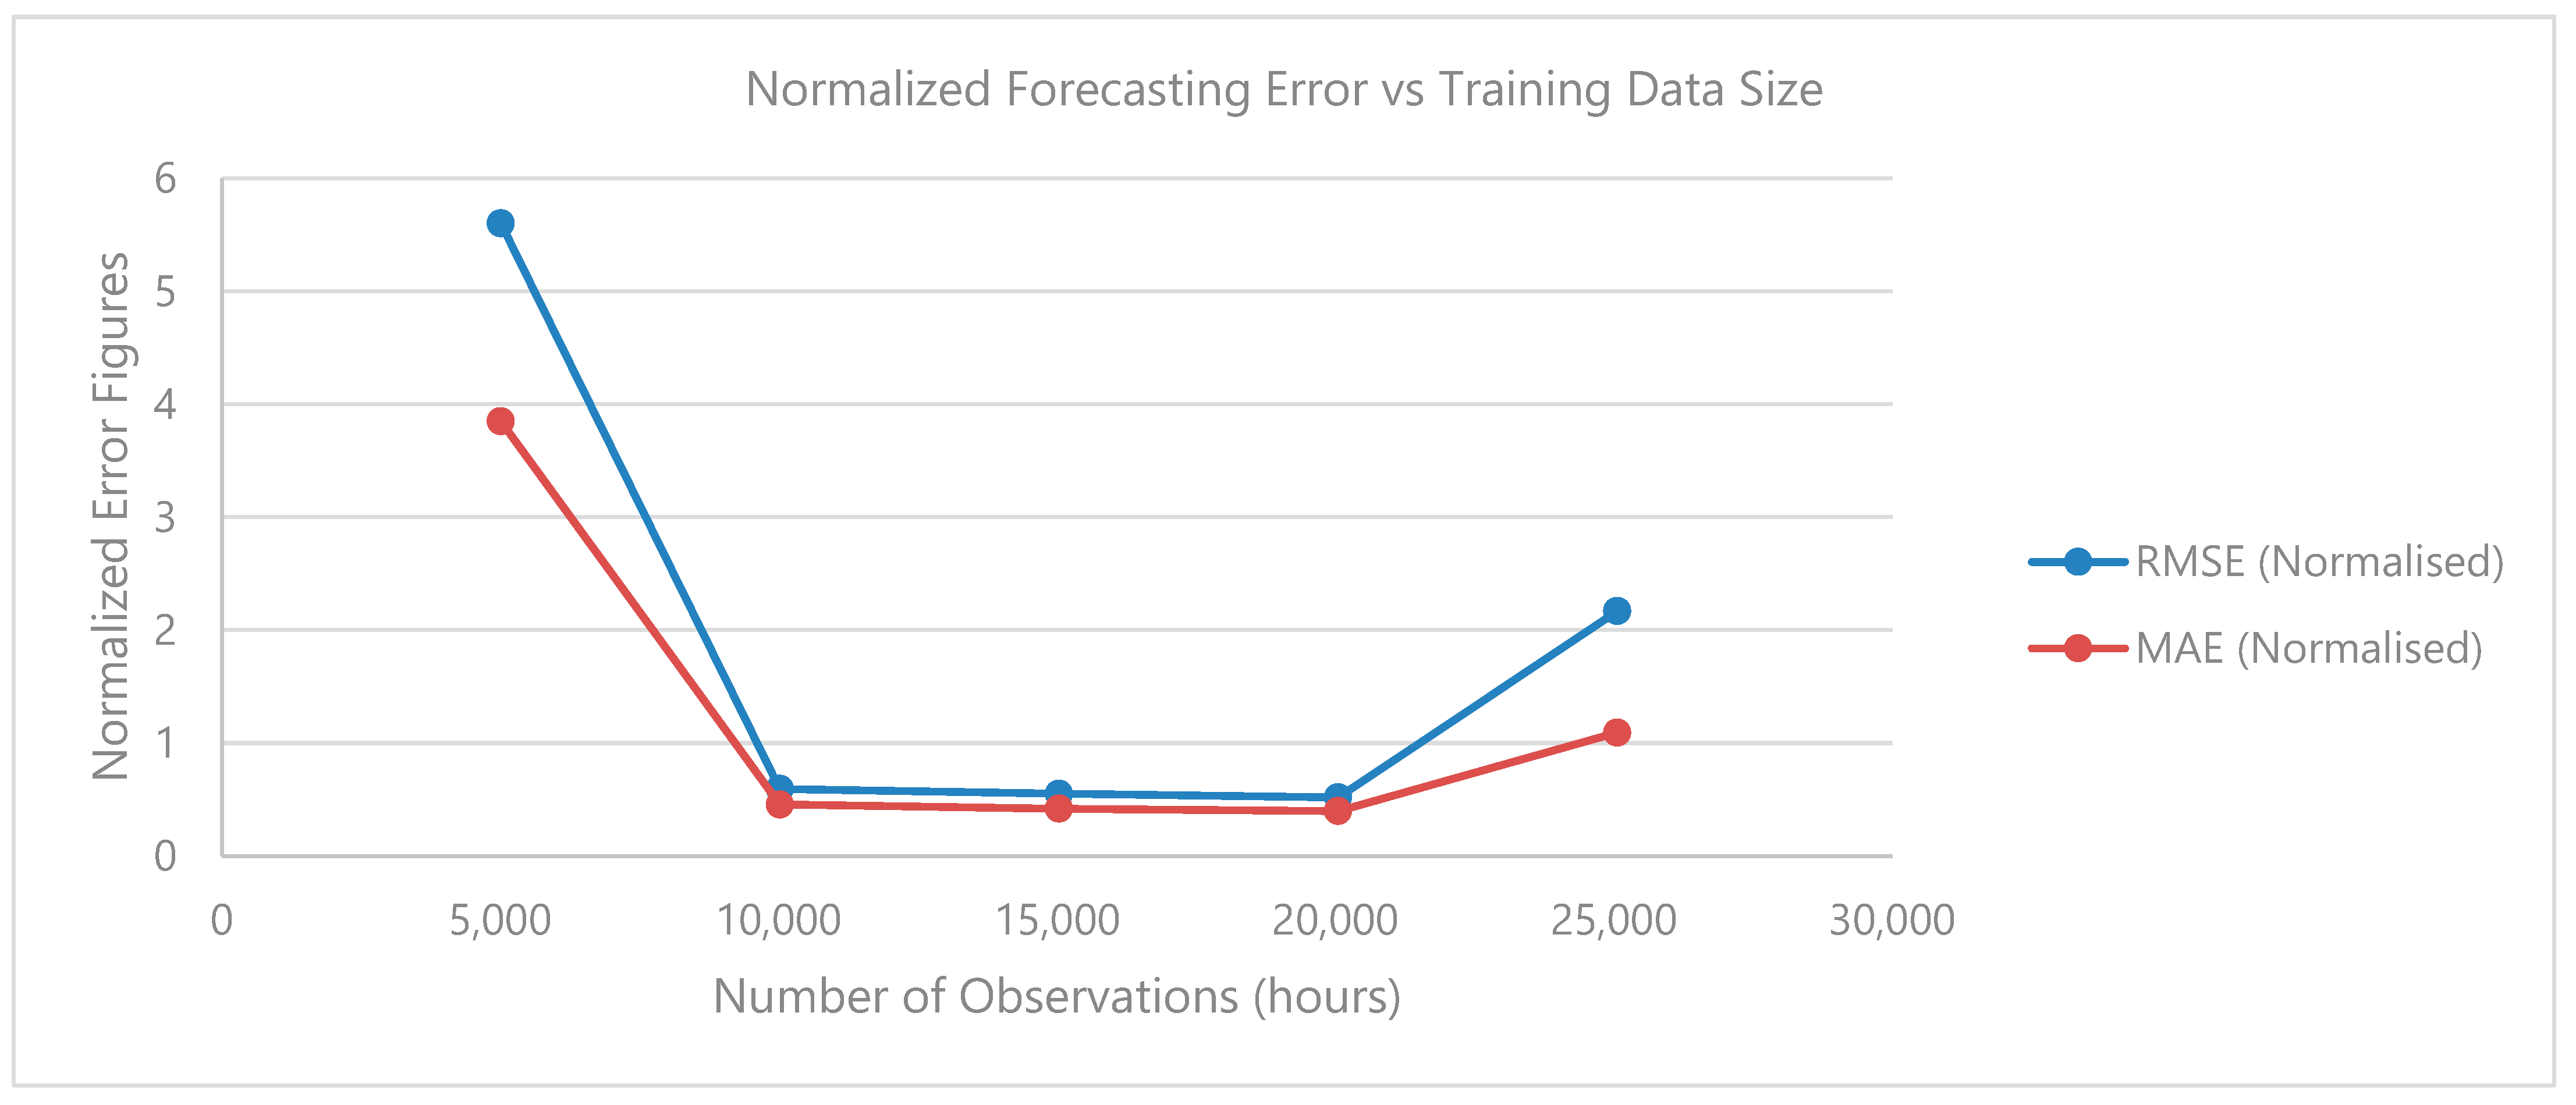
- Optimal training dataset size for reduced errors and preventing model overfitting is approximately 1–2 years’ worth of hourly data. Beyond this, there is a risk of model generalization, characterized by low training RMSE and high testing RMSE.
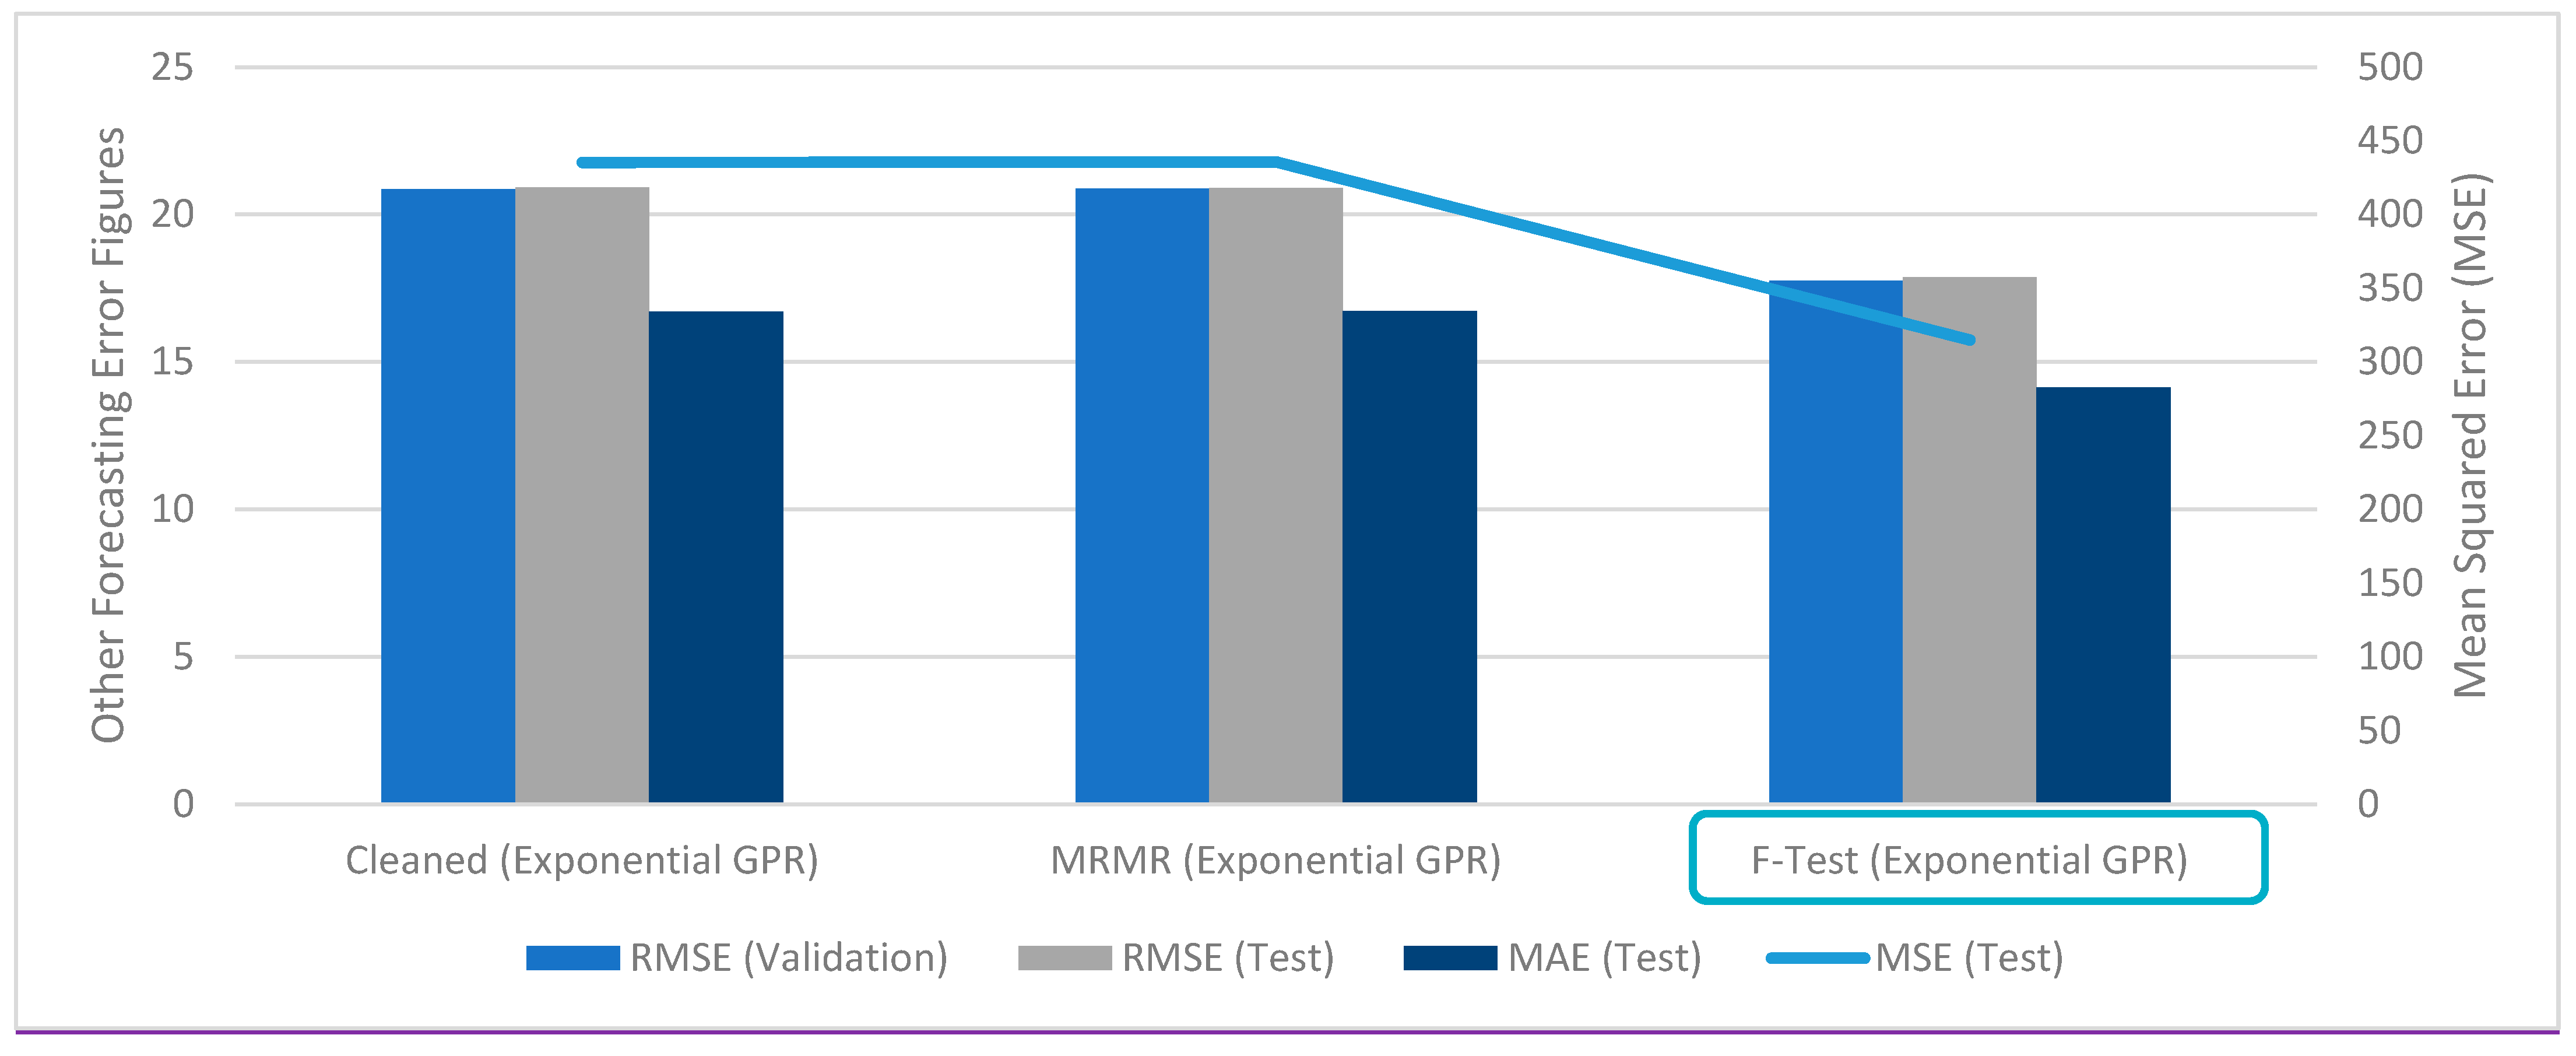
- Feature selection methods like MRMR and F-test rank training variables by importance. It is important to note that not all models benefit from limiting the quantities of training variables, and it is recommended to conduct feature selection for each new database.
- Improvement percentages for RMSE, MSE, and MAE using combined methods averaged at 12.34%, 24.40%, and 9.1% for building-level electric demand forecasting.
4.2. Exponential GPR for Electric Load Forecasting
- Non-parametric: it makes no assumptions about the entire data population based on the sample training dataset. Algorithms in this category often demonstrate higher robustness with datasets featuring large distribution measures.
- Bayesian approach: it applies a probability distribution over all possible values, enabling the provision of predictions with uncertainty measurements.
- Exponential GPR kernel: this feature facilitates effective handling of large datasets. When combined with the described pre-processing methods, smooth functions can be achieved with minimal errors.
4.3. Case Study Verification and Savings Estimation
4.4. Recommendations
- Availability of building data storage through an existing BMS.
- Possession of an existing MATLAB (or similar) software license.
- Full access to previous and forecasted local weather data.
- Annual model recalibration to include past-year data.
4.5. Conclusions and Future Work
- System implementation in operational buildings. Involving regular performance assessments to gauge its effectiveness in real-world scenarios.
- Expanded database sources. Using additional database sources to further validate and enhance the obtained results.
- Integration effects of external systems. Investigating the integration effects of other external systems on building electric demand to understand how various factors influence forecasting accuracy.
- Study on different generation technologies. Conducting a detailed study on the effects of different types of generation panels and capacities on overall building and grid demand to optimize energy generation.
- Extended applications of load forecasting. Exploring the implementation of load forecasting on extended areas of research such as information exchange security and larger-scale renewable energy generation.
Author Contributions
Funding
Institutional Review Board Statement
Informed Consent Statement
Data Availability Statement
Acknowledgments
Conflicts of Interest
References
- Kolokotsa, D. The role of smart grids in the building sector. Energy Build. 2015, 116, 703–708. [Google Scholar] [CrossRef]
- Schito, E.; Lucchi, E. Advances in the Optimization of Energy Use in Buildings. Sustainability 2023, 15, 13541. [Google Scholar] [CrossRef]
- Buro Happold. Digital Buildings Consultancy Presentation, 2021.
- Wurtz, F.; Delinchant, B. “Smart buildings” integrated in “smart grids”: A key challenge for the energy transition by using physical models and optimization with a “human-in-the-loop” approach. Comptes Rendus Phys. 2017, 18, 428–444. [Google Scholar] [CrossRef]
- Martín-Lopo, M.; Boal, J.; Sánchez-Miralles, Á. A literature review of IoT energy platforms aimed at end users. Comput. Netw. 2020, 171, 107101. [Google Scholar] [CrossRef]
- Xie, X.; Lu, Q.; Herrera, M.; Yu, Q.; Parlikad, A.; Schooling, J. Does historical data still count? Exploring the applicability of smart building applications in the post-pandemic period. Sustain. Cities Soc. 2021, 69, 102804. [Google Scholar] [CrossRef] [PubMed]
- Wang, Z.; Srinivasan, R. A review of artificial intelligence-based building energy use prediction: Contrasting the capabilities of single and ensemble prediction models. Renew. Sustain. Energy Rev. 2017, 75, 796–808. [Google Scholar] [CrossRef]
- Djenouri, D.; Laidi, R.; Djenouri, Y.; Balasingham, I. Machine Learning for Smart Building Applications. ACM Comput. Surv. 2020, 52, 1–36. [Google Scholar] [CrossRef]
- Yi, J.; Nasukawa, T.; Bunescu, R.; Niblack, W. Sentiment analyzer: Extracting sentiments about a given topic using natural language processing techniques. In Proceedings of the Third IEEE International Conference on Data Mining, Melbourne, FL, USA, 22 November 2003; pp. 427–434. [Google Scholar] [CrossRef]
- Klimberg, R.K.; Sillup, G.P.; Boyle, K.J.; Tavva, V. Forecasting performance measures—What are their practical meaning? Adv. Bus. Manag. Forecast. 2010, 7, 137–147. [Google Scholar] [CrossRef]
- Jedox. Error Metrics: How to Evaluate Your Forecasting Models. Available online: https://www.jedox.com/en/blog/error-metrics-how-to-evaluate-forecasts/#nrmse (accessed on 14 June 2023).
- Samuel, I.A.; Emmanuel, A.; Odigwe, I.A.; Felly-Njoku, F.C. A comparative study of regression analysis and artificial neural network methods for medium-term load forecasting. Indian J. Sci. Technol. 2017, 10, 1–7. [Google Scholar] [CrossRef]
- Alrashidi, A.; Qamar, A.M. Data-driven load forecasting using machine learning and Meteorological Data. Comput. Syst. Sci. Eng. 2021, 44, 1973–1988. [Google Scholar] [CrossRef]
- Varghese, D. Comparative Study on Classic Machine Learning Algorithms. Medium. Available online: https://towardsdatascience.com/comparative-study-on-classic-machine-learning-algorithms-24f9ff6ab222 (accessed on 18 June 2023).
- Regression Trees. IBM Documentation. Available online: https://www.ibm.com/docs/en/db2-warehouse?topic=procedures-regression-trees (accessed on 18 June 2023).
- Rouse, M.; Artificial Neural Network. Techopedia. Available online: https://www.techopedia.com/definition/5967/artificial-neural-network-ann (accessed on 18 June 2023).
- Zhang, N.; Xiong, J.; Zhong, J.; Leatham, K. Gaussian process regression method for classification for high-dimensional data with limited samples. In Proceedings of the 2018 Eighth International Conference on Information Science and Technology (ICIST), Cordoba, Granada, and Seville, Spain, 30 June–6 July 2018. [Google Scholar] [CrossRef]
- Chen, Y.; Chen, Z. Short-term load forecasting for multiple buildings: A length sensitivity-based approach. Energy Rep. 2022, 8, 14274–14288. [Google Scholar] [CrossRef]
- Berrendero, J.R.; Cuevas, A.; Torrecilla, J.L. The MRMR Variable Selection Method: A Comparative Study for Functional Data. J. Stat. Comput. Simul. 2015, 86, 891–907. [Google Scholar] [CrossRef]
- Sureiman, O.; Mangera, C. F-test of overall significance in regression analysis simplified. J. Pract. Cardiovasc. Sci. 2020, 6, 116. [Google Scholar] [CrossRef]
- Hossain, M.S.; Mahmood, H. Data Set Used in the Conference Paper Titled “Short-Term Load …”. IEEE DataPort. Available online: https://ieee-dataport.org/documents/data-set-used-conference-paper-titled-short-term-load-forecasting-using-lstm-neural (accessed on 29 July 2023).
- Willingham, D. Long Term Energy Forecasting with Econometrics in MATLAB. MATLAB Central File Exchange. 2023. Available online: https://www.mathworks.com/matlabcentral/fileexchange/49279-long-term-energy-forecasting-with-econometrics-in-matlab (accessed on 22 January 2023).
- Deoras, A. Electricity Load and Price Forecasting Webinar Case Study. MATLAB Central File Exchange. 2023. Available online: https://www.mathworks.com/matlabcentral/fileexchange/28684-electricity-load-and-price-forecasting-webinar-case-study (accessed on 22 January 2023).
- Datasets. National Grid’s Connected Data Portal. Available online: https://connecteddata.nationalgrid.co.uk/dataset/?groups=demand (accessed on 29 July 2023).
- Buro Happold. AMMP Energy Consumption Tracker April 2022 Data, 2022.
- Campus Metabolism. Arizona State University—Campus Metabolism. Available online: https://sustainability-innovation.asu.edu/campus/what-asu-is-doing/ (accessed on 30 July 2023).
- Miller, C.; Biam, P. The Building Data Genome 2 (BDG2) Data-Set. GitHub. Available online: https://github.com/buds-lab/building-data-genome-project-2 (accessed on 30 July 2023).
- Pullinger, M.; Few, J.; McKenna, E.; Elam, S.; Oreszczyn, E.W.T. Smart Energy Research Lab: Energy Use in GB Domestic Buildings 2021 (Volume 1)—Data Tables (in Excel). University College London, 13 June 2022. Available online: https://rdr.ucl.ac.uk/articles/dataset/Smart_Energy_Research_Lab_Energy_use_in_GB_domestic_buildings_2021_volume_1_-_Data_Tables_in_Excel_/20039816/1 (accessed on 29 July 2023).
- Zhang, J. Short-Term Load Forecasting Data with Hierarchical Advanced Metering … IEEE Data Port. Available online: https://ieee-dataport.org/documents/short-term-load-forecasting-data-hierarchical-advanced-metering-infrastructure-and-weather (accessed on 29 July 2023).
- Najini, H.; Nour, M.; Al-Zuhair, S.; Ghaith, F. Techno-Economic Analysis of Green Building Codes in United Arab Emirates Based on a Case Study Office Building. Sustainability 2020, 12, 8773. [Google Scholar] [CrossRef]
- Lusis, P.; Khalilpour, K.R.; Andrew, L.; Liebman, A. Short-term residential load forecasting: Impact of calendar effects and forecast granularity. Appl. Energy 2017, 205, 654–669. [Google Scholar] [CrossRef]
- ERCOT. March Report to ROS—Electric Reliability Council of Texas. Available online: https://www.ercot.com/files/docs/2017/03/29/14._SSWG_Report_to_ROS_March_2017_R2.docx (accessed on 12 July 2023).
- Texas Co-Op Power. Field Guide to Power Lines. Available online: https://texascooppower.com/field-guide-to-power-lines/#:~:text=Distribution%20Lines&text=These%20lines%20are%20energized%20at,residential%20homes%20and%20small%20businesses (accessed on 12 July 2023).
- Electric Choice. Electric Rates. Available online: https://www.electricchoice.com/electricity-prices-by-state/ (accessed on 7 August 2023).
- Carbon Footprint. Country Specific Electricity Grid Greenhouse Gas Emission Factors. Available online: https://www.carbonfootprint.com/docs/2020_07_emissions_factors_sources_for_2020_electricity_v1_3.pdf (accessed on 7 August 2023).
- ZipRecruiter. Salary: Data Scientist (June 2023) United States. Available online: https://www.ziprecruiter.com/Salaries/DATA-Scientist-Salary (accessed on 18 August 2023).






| Method | BDG2 Dataset | UTD Dataset | ERCOT Dataset |
|---|---|---|---|
| MRMR | Air temperature (°C) Sea level pressure (mbar) Dew temperature (°C) Wind direction (degrees) 6 h Precipitation depth (mm) | Hour of day, Day of week, Relative humidity (%), Global horizon irradiance (GHI) (W/m2), Holiday, Solar zenith angle, Dew point (°C Td), Clear sky direct normal irradiance (DNI) (W/m2), Temperature (°C), Wind direction (degrees), Clear sky diffused horizontal irradiance (DHI) (W/m2), DNI (W/m2), Clear sky global horizontal irradiance (GHI) (W/m2), DHI (W/m2) | Temperature (°C) Hour Month Day |
| F-test | Air temperature (°C) Dew temperature (°C) Sea level pressure (mbar) Wind direction (degrees) Cloud coverage (oktas) | Hour of day, DHI (W/m2), DNI (W/m2), GHI (W/m2), Clear sky DHI (W/m2), Clear sky DNI (W/m2), Clear sky GHI (W/m2), Relative humidity (%), Solar zenith angle, Temperature (°C), Day of week, Dew point (°C Td), Month of year, Day, Wind direction (degrees) | Hour Month Relative Humidity (%) Temperature (°C) |
| List of Machine Learning Algorithms (MATLAB Regression Learner) | |
|---|---|
Linear Regression Models
| Gaussian Process Regression (GPR)
|
| Minimum difference (with EV − without EV) | 0.147 kW |
| Average difference − minimum difference | 0.145 kW |
| Peak load (worst-case scenario) | 0.984 kW |
| Calculated savings ratio (0.145/0.984) | 14.7% |
| Average of +ve difference | 0.079 kW |
| Peak load (worst-case scenario) | 0.612 kW |
| Calculated savings ratio (0.079/0.612) | 12.9% |
| Smart Building | Smart Grid | |
|---|---|---|
| Variance | 3228.4 kW2 | 81,314,603.5 kW2 |
| Standard Deviation | 56.82 kW | 9017.5 kW |
| Estimated Savings | 9.35% | 11.47% |
| Estimated Savings with Local EV/PV Installations | 11.93% | N/A |
| System Requirements | New Buildings | Existing Buildings |
|---|---|---|
| Electricity consumption meter | ✓ | Often available through the incoming supply to building. |
| Recording and storage of new consumption data | ✓ | ✓ |
| Access to equivalent previous data recordings | ✓ | Previous data recordings assumed to be available. |
| Annual model recalibration with new training data | ✓ | ✓ |
| Information share with grid | ✓ | ✓ |
Disclaimer/Publisher’s Note: The statements, opinions and data contained in all publications are solely those of the individual author(s) and contributor(s) and not of MDPI and/or the editor(s). MDPI and/or the editor(s) disclaim responsibility for any injury to people or property resulting from any ideas, methods, instructions or products referred to in the content. |
© 2024 by the authors. Licensee MDPI, Basel, Switzerland. This article is an open access article distributed under the terms and conditions of the Creative Commons Attribution (CC BY) license (https://creativecommons.org/licenses/by/4.0/).
Share and Cite
Copiaco, C.; Nour, M. Optimizing the Operation of Grid-Interactive Efficient Buildings (GEBs) Using Machine Learning. Sustainability 2024, 16, 8752. https://doi.org/10.3390/su16208752
Copiaco C, Nour M. Optimizing the Operation of Grid-Interactive Efficient Buildings (GEBs) Using Machine Learning. Sustainability. 2024; 16(20):8752. https://doi.org/10.3390/su16208752
Chicago/Turabian StyleCopiaco, Czarina, and Mutasim Nour. 2024. "Optimizing the Operation of Grid-Interactive Efficient Buildings (GEBs) Using Machine Learning" Sustainability 16, no. 20: 8752. https://doi.org/10.3390/su16208752
APA StyleCopiaco, C., & Nour, M. (2024). Optimizing the Operation of Grid-Interactive Efficient Buildings (GEBs) Using Machine Learning. Sustainability, 16(20), 8752. https://doi.org/10.3390/su16208752


