Article

The Green Indium Patented Technology SCRIPT, for Indium Recovery from Liquid Crystal Displays: Bench Scale Validation Driven by Sustainability Assessment

Department of Life and Environmental Sciences, Polytechnic University of Marche, 60131 Ancona, Italy
*
Author to whom correspondence should be addressed.
Sustainability 2024, 16(20), 8917; https://doi.org/10.3390/su16208917
Submission received: 3 September 2024 / Revised: 7 October 2024 / Accepted: 10 October 2024 / Published: 15 October 2024

Abstract

:
Indium is considered a valuable and irreplaceable material for a variety of applications that improve the quality of human life. Due to its limited availability and the growing demand, it is mandatory to find sustainable solutions for indium recovery from end-of-life devices. The green indium patented technology SCRIPT (ITA202018000008207) focuses on recovering indium from ground LCD panels, developed through laboratory scale investigation. The process ensures high recovery efficiencies of indium (>90%), features a simple design, and fully exploits the solid residue with the production of a concrete for building applications. This manuscript presents a study focused on the validation and optimization of the patented SCRIPT technology at the bench scale, driven by sustainability assessment. Bench scale experiments successfully validated the technology, improving its technology readiness level. Furthermore, an environmental sustainability assessment highlighted the importance of treating the finest fraction, which has the highest indium concentration. Optimization tests at the bench scale demonstrated that water could be recirculated for more than five cycles. The economic sustainability tests highlighted that when the indium concentration in the material fed into the recycling plant is above 1000 mg/kg, the technology is cost effective and worth investment. Our study is fundamental for boosting indium recycling in the world. Moreover, our methodological approach represents a guideline for achieving sustainability goals within circular economy approaches for strategic metals in complex matrices.

1. Introduction

Indium is a valuable and irreplaceable material, especially in the technological sector, due to its several applications that contribute to improving the quality of human life [1,2]. In the electronics industry, indium is mainly used to produce liquid crystal displays (LCDs), where it is present as indium-tin oxide (ITO) on the surface of the glass substrates that contain liquid crystals [3,4,5]. Additionally, indium is used in photovoltaic cells (PVs), LEDs, batteries, and other applications [1].
Despite its economic value, indium is relatively scarce in both continental and oceanic crusts, with an abundance ranging between 0.05 and 0.072 mg/kg [6,7]. Currently, there are no specific ores for this metal and its primary production is mainly linked to the mining of sphalerite ores, copper sulphide (chalcopyrite) ores, and tin ores, where indium concentrations are typically below 20 mg/kg [2,7,8,9].
The global indium supply is under pressure due to its limited availability and growing demand [7]. Therefore, the recycling of indium from waste electrical and electronic equipment (WEEE) has become an important strategy worldwide to address this challenge [5]. In this perspective, one common method for secondary indium production is ITO recycling after the sputtering phase [2,5,6]. LCD scraps offer an interesting alternative, as they contain higher indium concentration than ores [6,7,8,9] and they are widely available, due to the short lifecycle of devices [8,9,10,11]. The recycling of LCDs may reduce the high environmental impacts resulting from their conventional management (landfills, incinerators) and allows for resource conservation by reducing the need for primary production [12].
Several studies focused on the development of new technologies for the recovery of indium from WEEE residues [13]. These technologies promise lower energy consumption, reduced operational costs, and improved environmental sustainability, compared to traditional pyrometallurgical processes [7].
Most hydrometallurgical techniques for indium leaching from spent LCDs are based on strong mineral acids, such as hydrochloric acid, sulfuric acid, and nitric acid [6,14,15,16,17,18,19,20,21,22,23]. During acid leaching, the ITO layer is dissolved, releasing In(III) and Sn(IV) cations in the solution. The main reactions involved when ITO is treated with H2SO4 are shown in Equations (1) and (2) [17]. Indium is dissolved into the solution as indium ions (In3⁺) (Equation (1)),
In2O3 + 3H2SO4 → 2In3+ + 3SO42− + 3H2O
while tin is dissolved as follows (Equation (2)):
SnO2 + 2H2SO4 → Sn4+ + 2SO42− + 2H2O
In more detail, the leaching process begins when H2SO4 reacts with the surface of ITO glass, dissociating into SO42⁻ and H⁺ ions. This leads to the breakdown of the In-O bond, forming an intermediate In-O-H complex. The reaction proceeds until In3⁺ and SO42⁻ are fully generated in the leaching solution [17].
Several studies focused on the optimization and enhancement of the acid leaching process by different lixiviant combinations [21]. In this regard, organic acids, such as oxalic, malic, or citric acid, were found to be effective leaching agents [24,25,26]. In some works, oxidizing and reducing chemical agents have been added in the acid leaching process to accelerate the reaction [26,27,28,29].
Another promising approach is bioleaching, promoted by microorganisms such as Acidithiobacillus ferrooxidans, Acidithiobacillus thiooxidans, and Aspergillus niger. This technique is promising for lower costs and higher sustainability terms, though research on this topic remains limited [30,31,32,33,34].
Furthermore, several methods were tested to recover indium from leach liquors produced by the mentioned techniques. Solvent extraction is the most common technique [13], while possible alternatives are represented by ionic liquid, nonvolatile and nonflammable, and sorbent, including ion exchange and chelating resins, extraction [7,9]. Another less common approach, used as highly effective recovery technique, is cementation, based on the differences in the electrochemical potentials of indium, compared to other elements [5]. This technique shows the advantages of a simple implementation, relatively low cost and toxicity (compared to the most common solvent extraction), and high ensured efficiency.
Much of the scientific literature only focuses on technical feasibility; however, in the current era, it is crucial also to consider the combination of effectiveness and sustainability of the developed approaches. From the results achieved through laboratory scale investigation, documented by several scientific publications [9,11,12,35], we developed the SCRIPT (circular strategies for indium recovery from ground panels) patent (ITA202018000008207), which ensures high indium recovery efficiencies (>90%). This process also features a simple treatment design and allows the exploitation of the whole solid residue with the production of a concrete for building applications. The goal of the present paper is to present a study focused on scaling up the patented SCRIPT technology to a bench scale level, driven by sustainability assessment. An integrated assessment is essential to ensure the development of viable solutions, given the relatively low indium concentration in solid waste (order of magnitude 10–1000 mg/kg). Moreover, the study includes: 1. the initial validation of the technology at bench scale level; 2. an environmental assessment finalized to identify the potential process configuration able to promote the process sustainability; 3. the further experimental optimization to reduce the environmental impact; 4. and a final assessment that considers economic sustainability as well.

2. Materials and Methods

2.1. Samples

An SME recycler in Central Italy supplied the samples for bench scale experiments. The industrial facility collects and treats (by physical–mechanical treatment) around 30 tons of waste from WEEE, every day. The SME supplied to the Polytechnic University of Marche about 50 kg of crushed LCD panels (<10 cm), collected in big boxes and transported in plastic bags to university labs. The procedure reported below was implemented to achieve representative samples. A portion (4.820 kg) was placed on a clean table to form a cake with 7 cm thickness and 50 cm diameter (Figure 1); the cake was divided into 4 sections, and 2 of these fractions were selected to prepare a second cake with 3 cm thickness and 50 cm of diameter.
At the end, the sample for the characterizations had a weight of 1154 kg; it was sieved to achieve 3 representative fractions: >5 mm, 1–5 mm, <1 mm. Chemical characterizations were performed by ICP-MS to quantify In and Ga concentrations.

2.2. The Bench Scale Experimental System

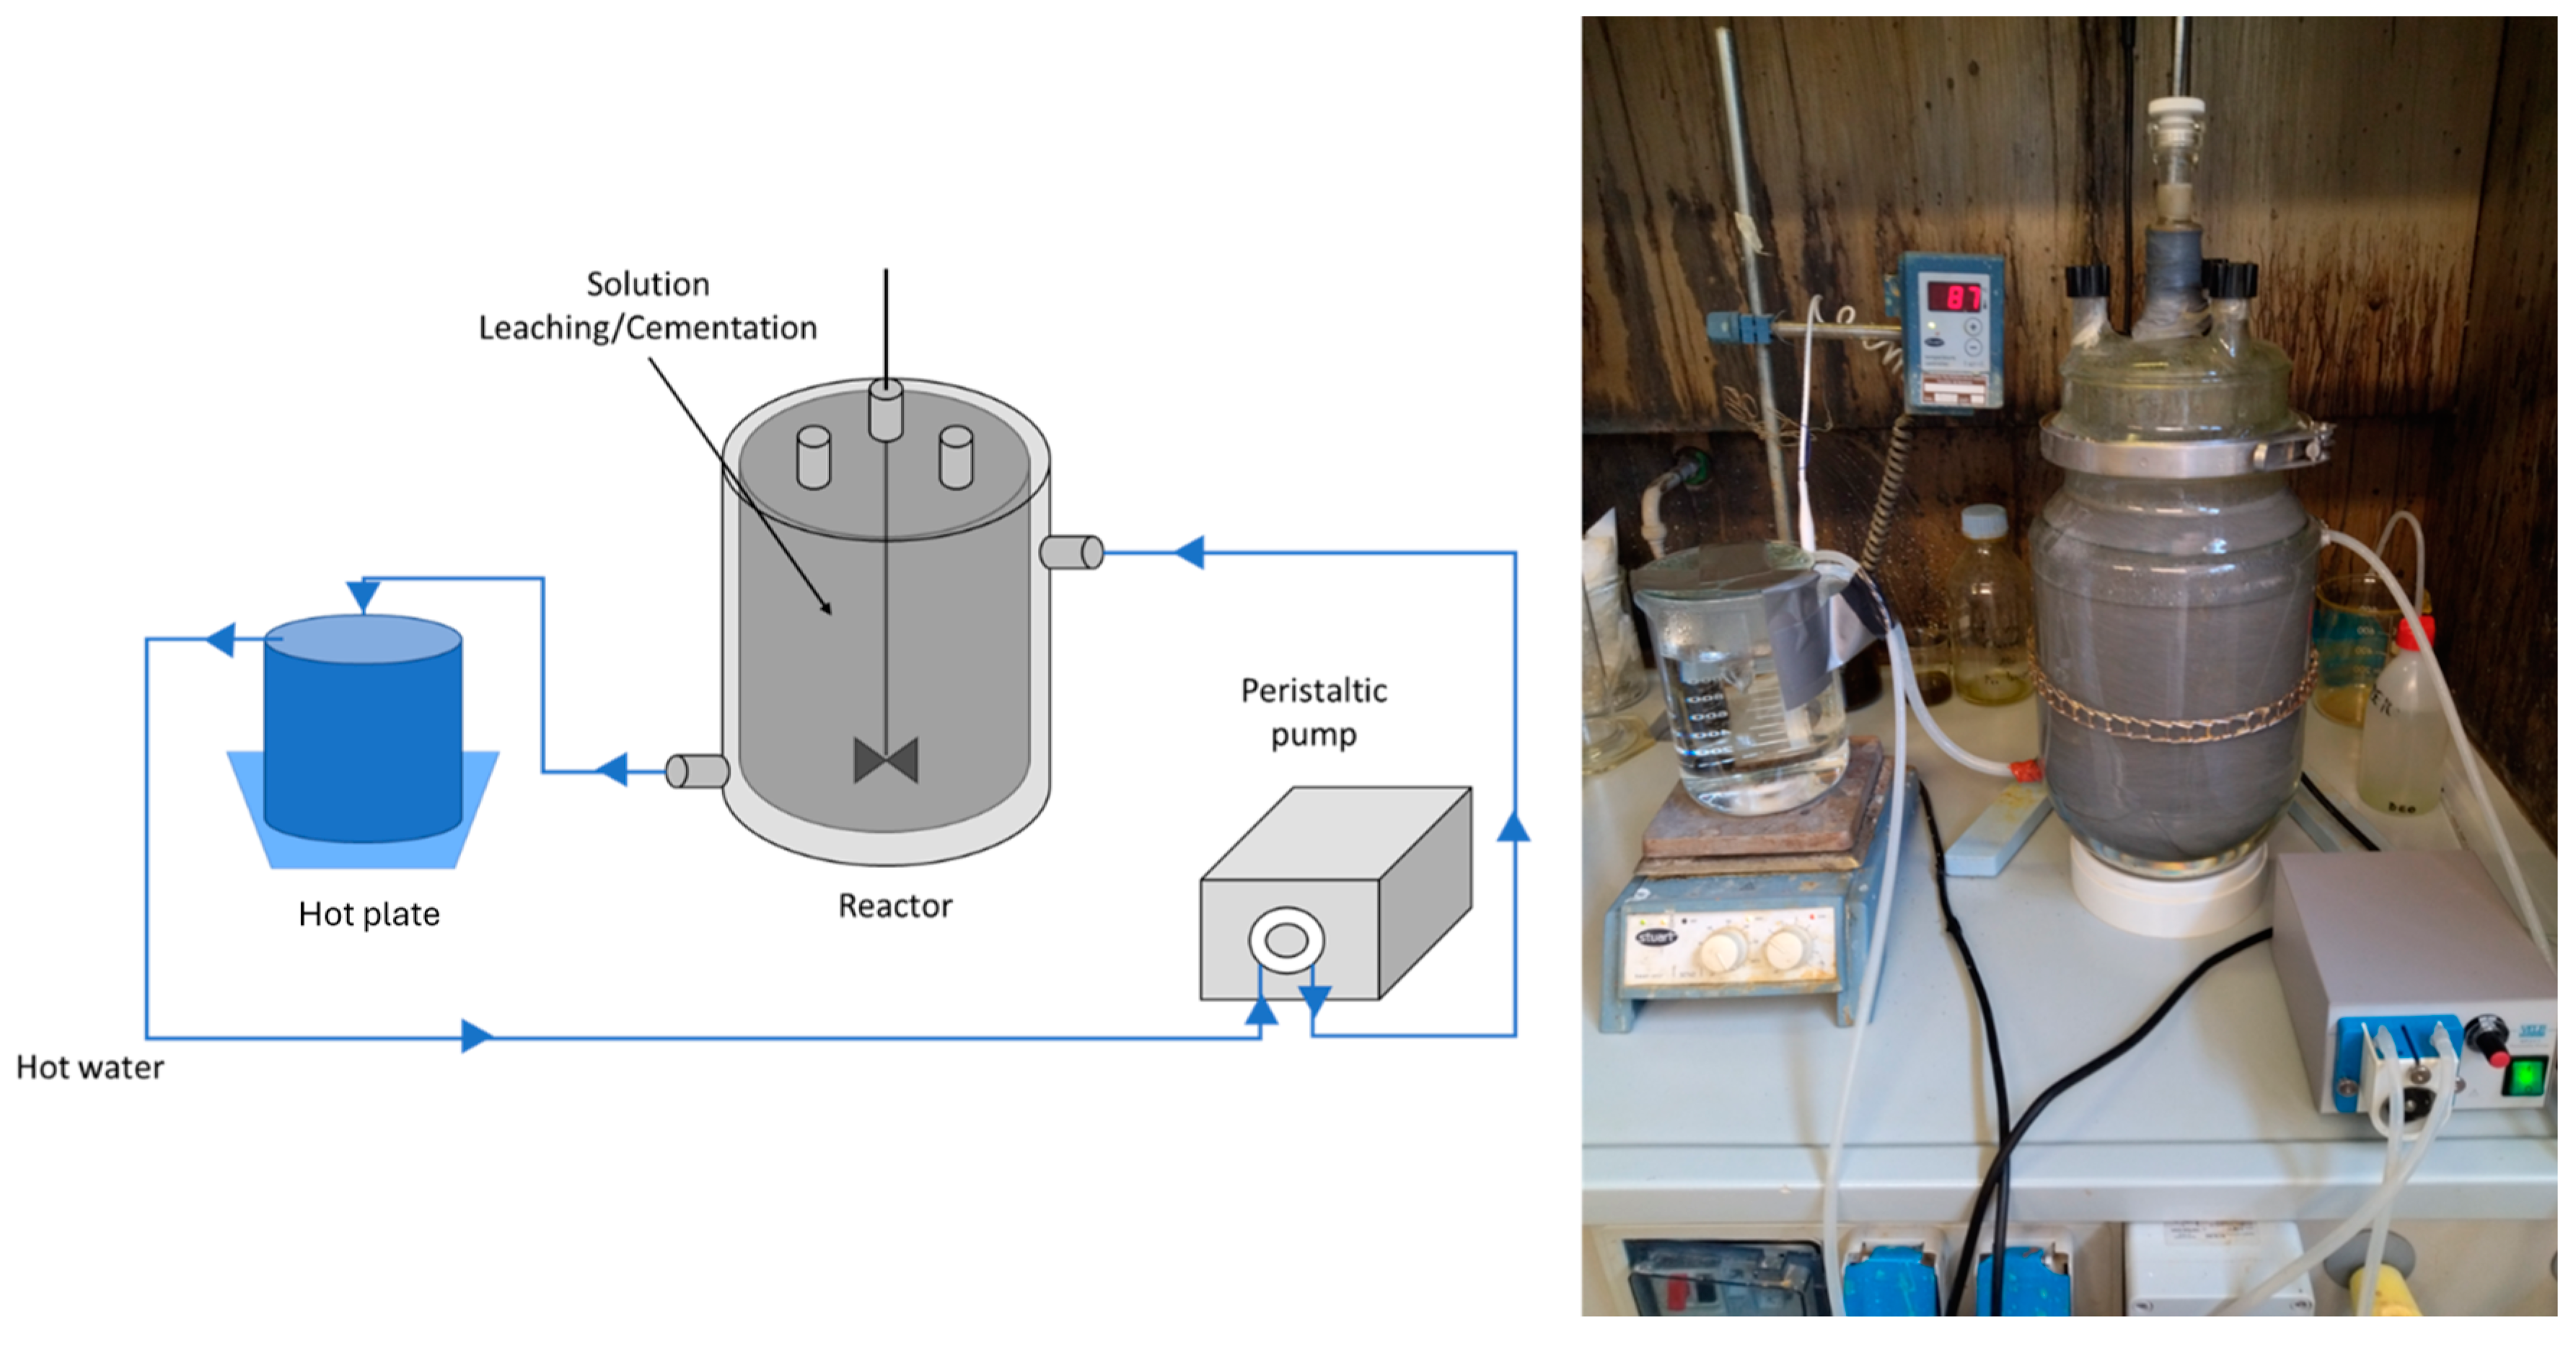
The leaching system consisted of three main components: a hot plate (Stuart SC162, Essex, UK), a 5 L jacketed reactor (the reactor is not a commercial product, but it was designed in the laboratory), and a peristaltic pump (Velp Scientifica™ SP 311, Usmate Velate, Italy) to ensure hot water circulation (Figure 2). More in detail, hot water, at 100 °C (used for both the leaching and cementation processes), was produced in a 2 L beaker placed on the hot plate and supplied to the reactor jacket with a 200 mL/min flow. The solution in the reactor reaches the requested temperature for leaching after 2 h (75–80 °C) and after 1 h (50–55 °C) for cementation. Thereafter, the hot water flows back from the jacketed reactor to the beaker, ensuring temperature maintenance (Figure 2).
At the end of each step, the leaching or cementation solution was pumped to the filtration system which includes the following: a peristaltic pump, a filtration system with a paper filter, and a vacuum pump (Chemker 400, New Taipei City, Taiwan). More in detail, the solution is pumped by the peristaltic pump at 240 mL/min flow (Figure 3) to the filtration system. The vacuum pump was used to promote and speed up the filtration operations. A total of 30 min was enough for the complete solution to be pumped from the reactor.

2.3. Assessment of the Advantageous Process Configuration through the Life Cycle Methodology

Considering the relatively low indium concentration in the solid, the assessment considered the possibility of treating only the richest fraction using the patented SCRIPT technology and valorizing the other one through building material production, without the previous indium recovery.
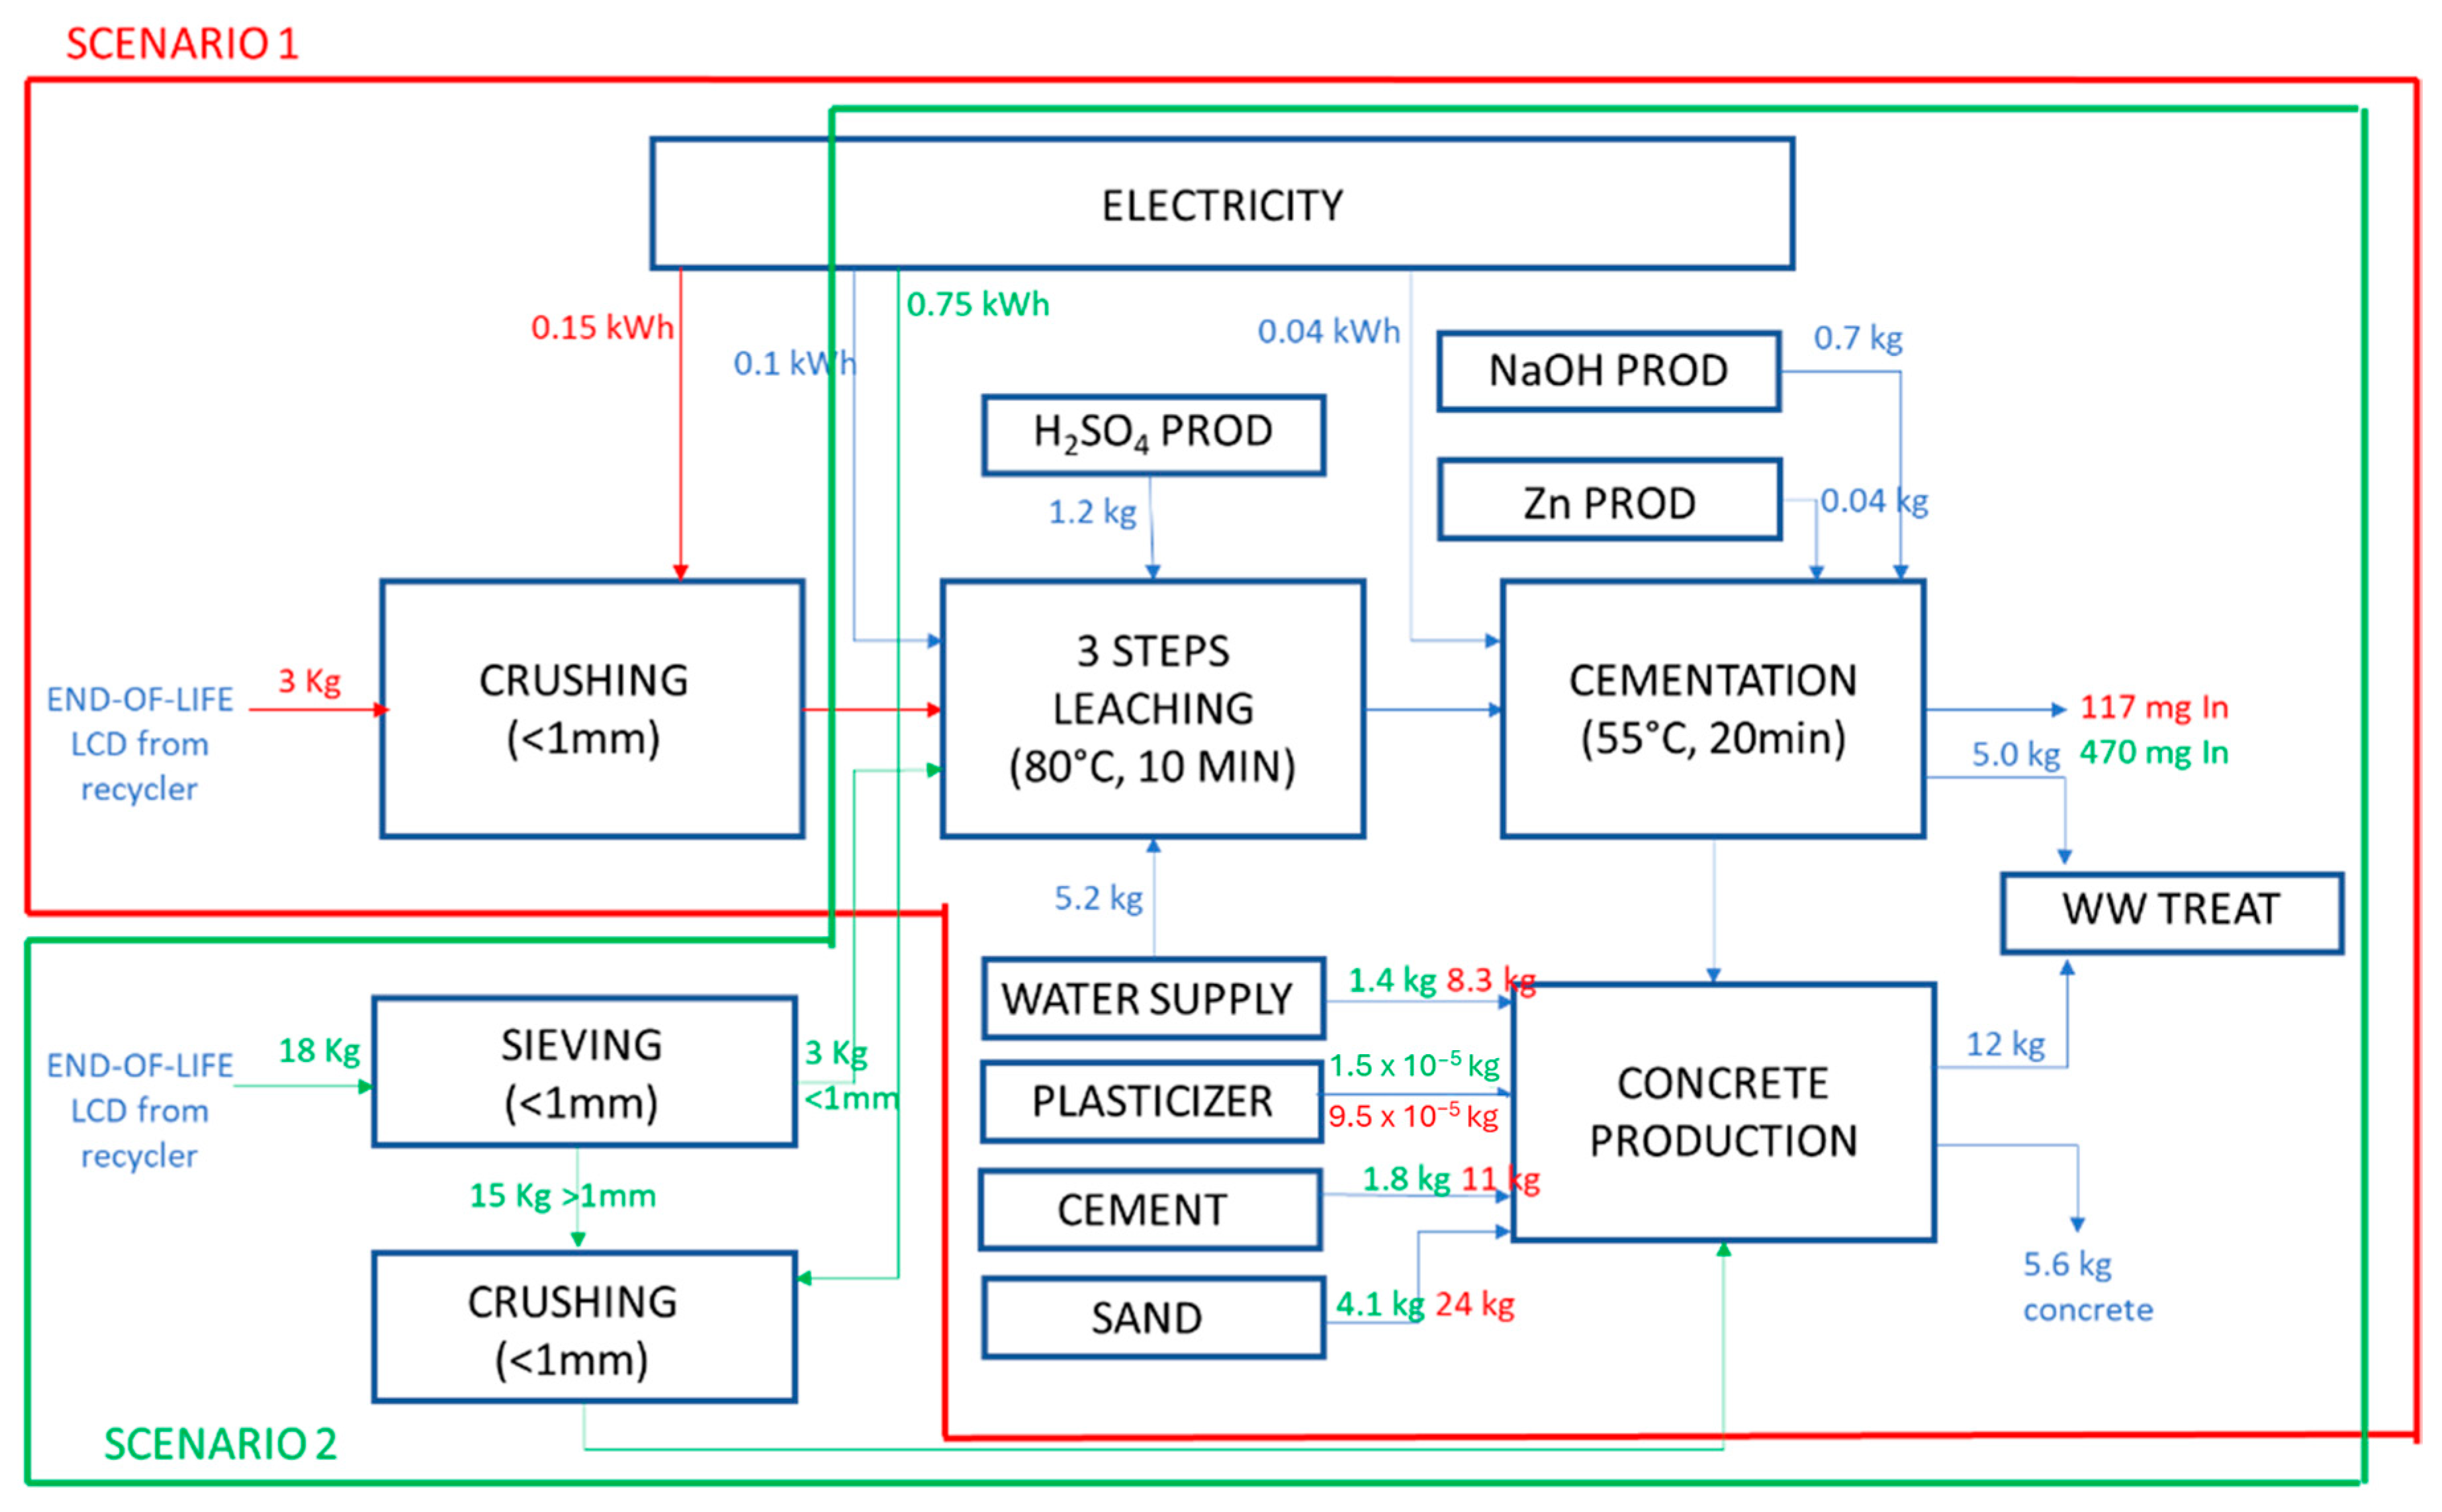
The functional unit selected for the comparison is a complete treatment (pre-treatment, 3 leaching steps, and recovery) performed in a 5 L bench scale plant. The present analysis includes the results of inventory analysis, classification and characterization (mandatory), and normalization and weighting (optional) phases. The software used for data collection is Thinkstep Gabi Professional, combined with the Database for Life Cycle Engineering (compilation 7.3.3.153; DB version 6.115). The method selected for the analysis is EF 3.0, which includes all the environmental categories and recommended models at midpoint, together with their indicators, units, and sources [36]. Figure 4 represents the system boundaries considered for the analysis, which include 2 pre-treatment scenarios:
  • Scenario 1: waste from recycler, with an average In concentration around 40 ppm, is crushed and sent to the patented technology SCRIPT.
  • Scenario 2: waste from recycler facility is sieved and only the finest fraction (<1 mm) with the highest In concentration (157 ppm) is sent to the patented technology SCRIPT. The <1 mm fraction represents about 17% of the waste; therefore, 18 kg of LCDs are sieved to separate 3 kg, necessary for the 3-step process. The remaining 83% can be crushed and mixed with the scraps for building material production. This option allows an In pre-concentration in the waste flow but also metal loss in the >1 mm fraction (with an In content around 15 ppm).
Further leaching and cementation steps follow the conditions described in the bench scale validation section. For the quantification of the electricity impact, a European electricity grid mix (which includes both renewable and not-renewable energy resources) is selected. Some assumptions have been performed for the analysis:
  • An environmental credit due to the avoided disposal in landfilling site has been included considering the current classification of end-of-life LCD panels as urban waste.
  • The environmental credit related to the recovered In has been estimated by the allocation of Zn metal value on economic basis (240 USD/kg for In vs. 4 USD/kg for Zn). This assumption was considered acceptable since the two elements are extracted from the same ore, sphalerite [37].

2.4. Optimization of the Patented SCRIPT Technology at Bench Scale

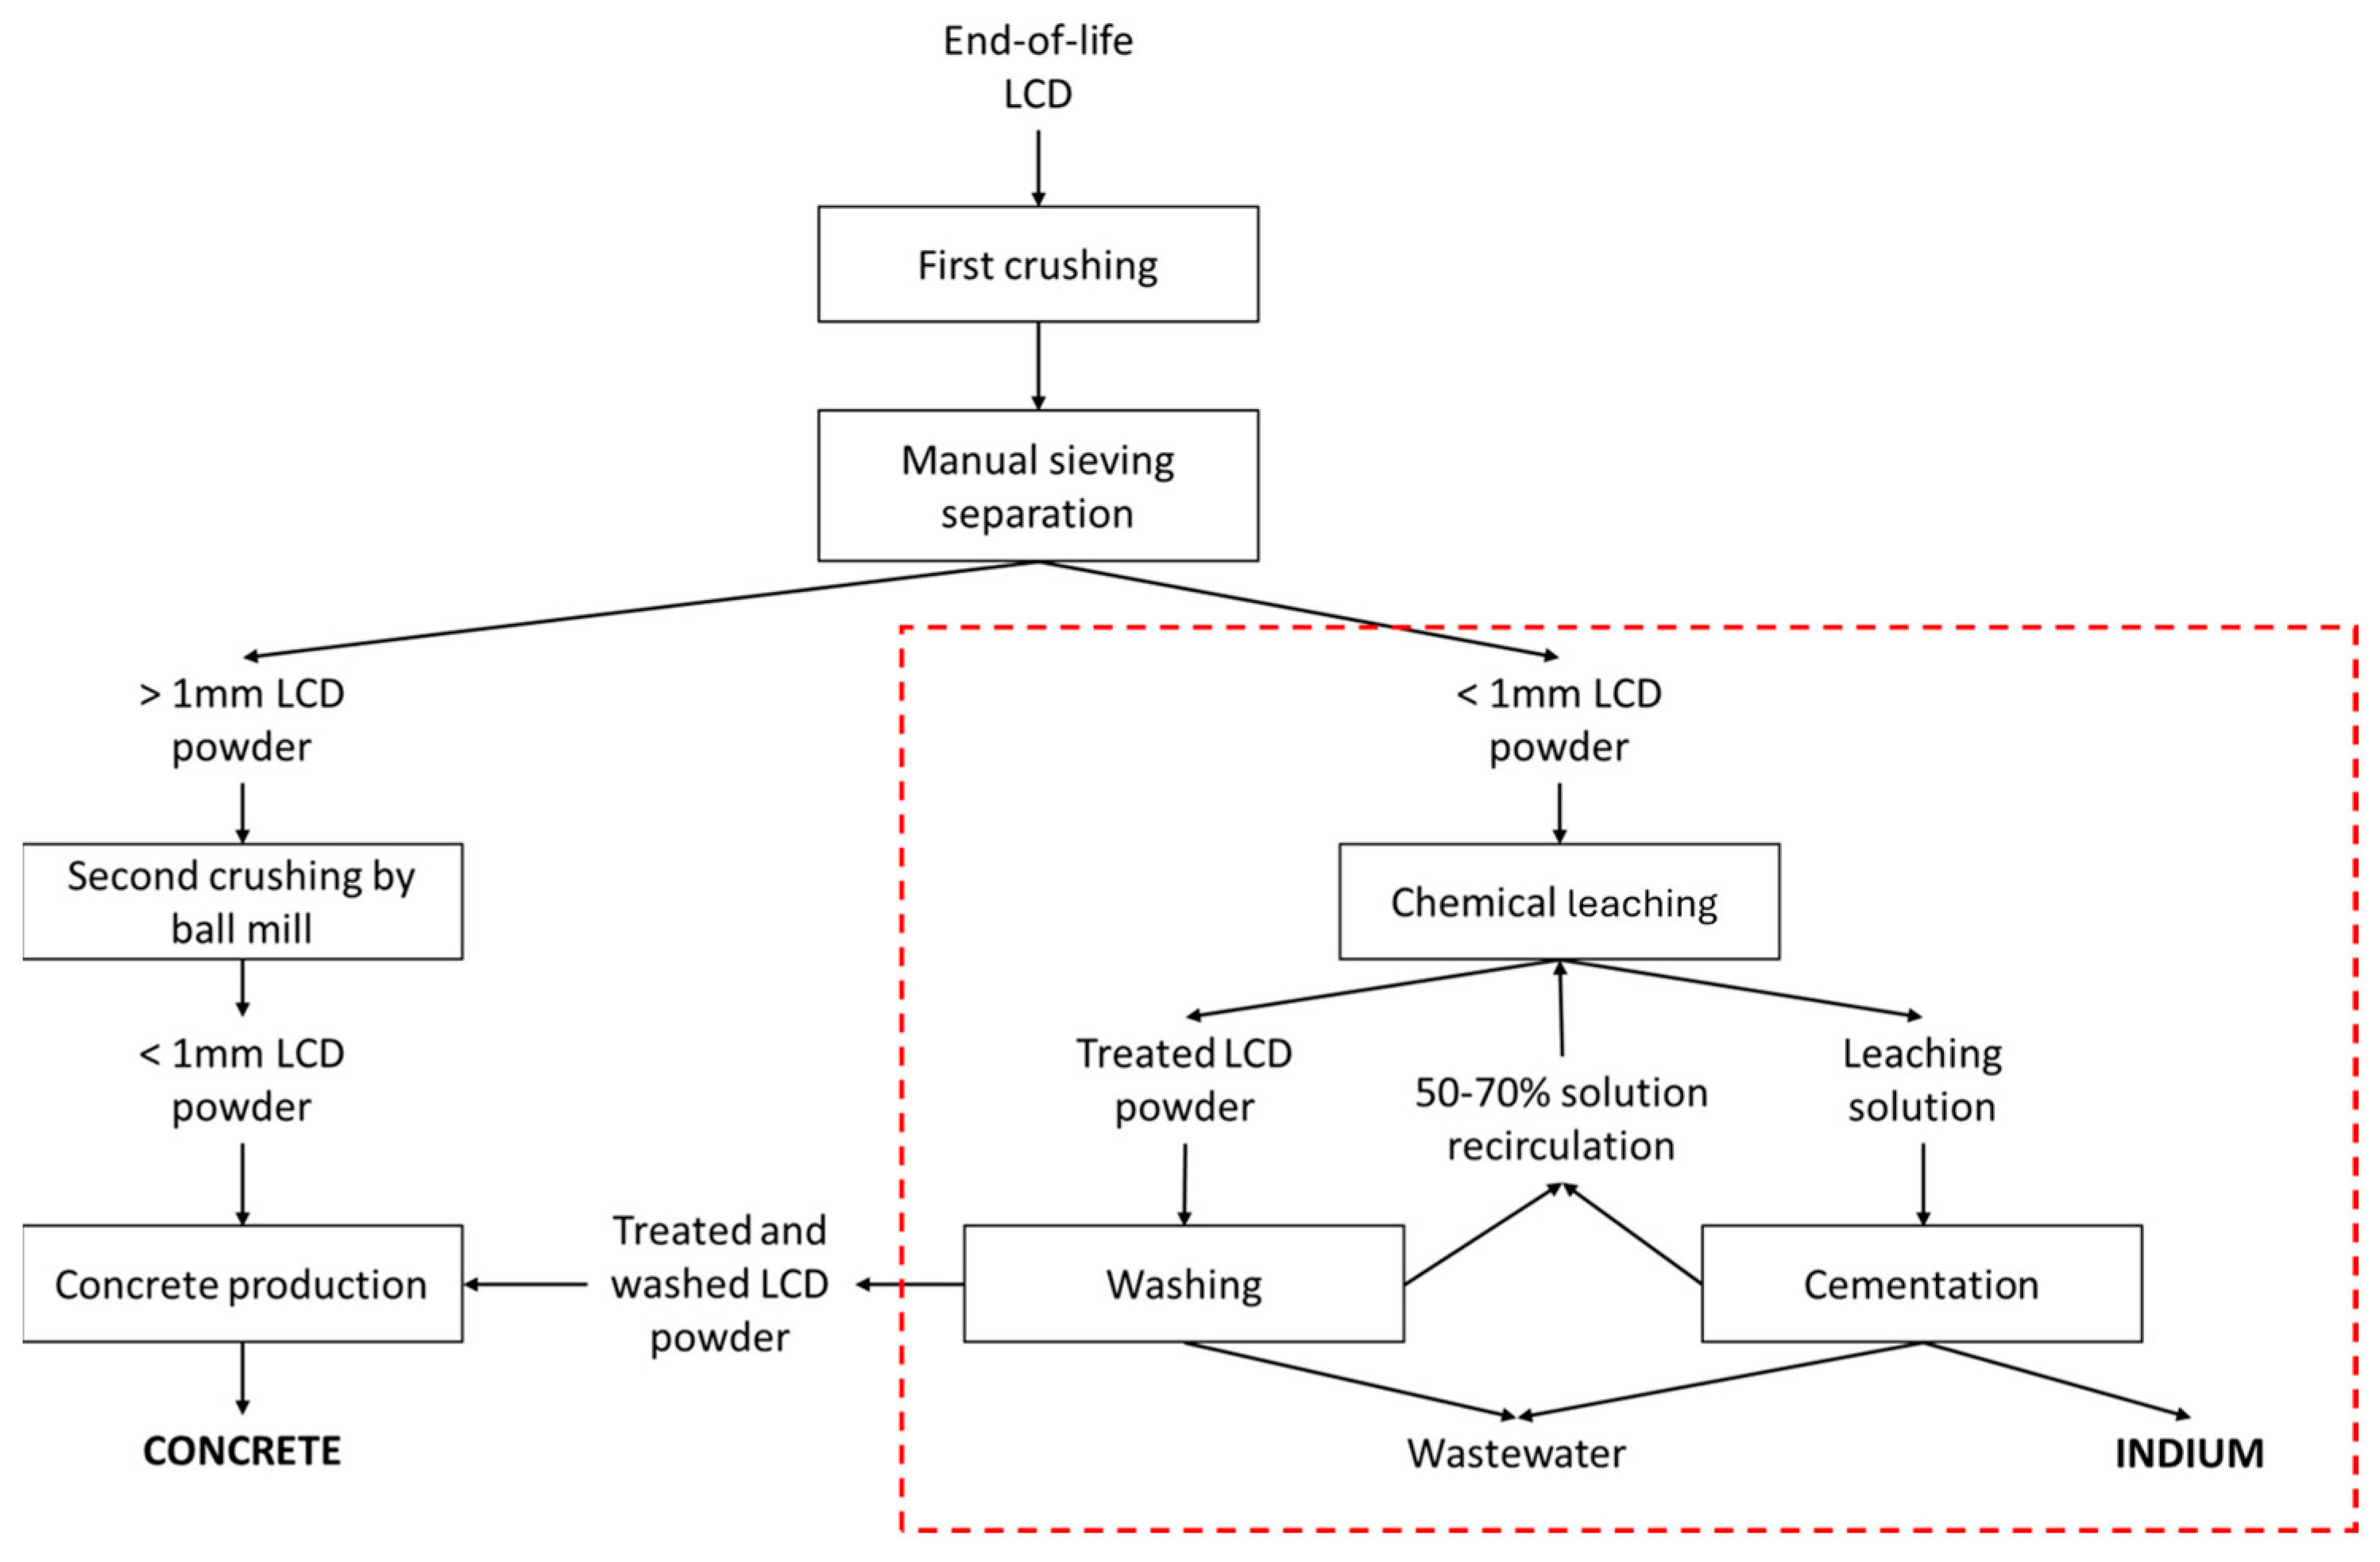
The optimization of the patented technology SCRIPT is driven by the sustainability assessment (Section 2.3), and it includes the wastewater recirculation system. Figure 5 reports the whole scheme of the process. Fixed conditions were selected considering the results previously achieved: use of the finest LCD fraction (<1 mm) to increase In concentration, a 3 step cross-current leaching process, cementation with 7.5 g/L of Zn, and a water/treated LCD wet ratio of 2:1 to remove chlorides and sulphates for concrete production [35]. Starting from these conditions, wastewater recirculation from both cementation and LCD washing (before concrete production) was studied to improve sustainability in the process.
In the first process cycle, leaching and cementation processes were carried out using only the finest fraction (<1 mm) of the sample. On the other hand, from the second cycle, the 2M leaching solution was composed of the following: 50% of solution after the cementation process, 44.5% of solution after the treated LCD washing step, and 5.5% of H2SO4 solution (96% v/v). After the first step of the cross-current leaching, 10% of the leaching solution (lost for both evaporation phenomena and filtration steps) was restored by a fresh solution of 2M H2SO4 produced by the wastewater from the washing process.

2.5. The Economic Assessment

Table 1 summarizes the updated unitary costs considered for the evaluation, including the price of the panel management, if disposed of as urban waste (after the preliminary removal of hazardous components).

3. Results and Discussion

3.1. Sample Characterizations

Table 2 presents the results of ICP-MS analysis, highlighting variations in indium concentrations based on sample sizes. Indium concentrations ranged from 2.5 ± 0.5 mg/kg, in the biggest fraction, to 160 ± 30 mg/kg in the smallest one, while gallium showed a more uniform distribution. These results confirm the observations of previous studies, which observed a decrease in indium concentration with the fragment dimension increase [12,29]. However, the size of the smallest fraction is not constant in all the works, depending on the different grinding methods, and it varies between 10 µm and 212 µm [19,21,23]. Given the high variability of the fractions used in the literature, the analysis of the correlation between particle size and indium concentrations was worthy of investigation.
Additionally, LCD composition is not homogeneous and can vary depending on the different production processes used (e.g., different brands), which explains the variable indium and other metal concentrations reported in the literature. Regardless of this aspect, all studies identify indium as the primary component of ITO, with higher content than the other metals [22]. Table 3 summarizes the indium concentrations measured in several works, along with the indication of other metals detected in the LCD panels. The variability related to the manufacturing peculiarities is in an acceptable range.

3.2. Validation of the Patented SCRIPT Technology at Bench Scale

Figure 6 shows the indium concentration achieved at the end of each stage of the cross-current leaching process, along with the concentration of three main interferents: Fe, Al, and Cu. The results confirmed those previously observed at the lab scale [12] and during the development of the SCRIPT patent. Regardless of the process scale-up, an almost complete In extraction was achieved across the three leaching steps, with moderate extraction of the interferents. Al, Fe, and Cu were extracted with efficiencies of 12%, 5%, and 1%, respectively (Figure 6b). The tests also showed a volume loss around 10% due to evaporation phenomena and filtration steps. Therefore, the volume was restored by a fresh solution of 2M H2SO4, before the second and the third steps. The leaching solution from the third step of the cross-current process was used to determine the best operative conditions for In recovery by cementation with Zn. As showed in Figure 7, In recovery showed efficiencies higher than 90% with a Zn concentration above 7.5 g/L. However, even Cu and Al exhibited recovery efficiency greater than 90% with Zn concentrations over 5 and 10 g/L, respectively. On the other hand, Fe recovery remained at around 20%, regardless of the Zn concentration.
The first set of experiments confirmed the high In recovery from LCD panels, irrespective of process scale-up, and proved the feasibility of using waste from a representative SME recycler. Overall, the best operative conditions identified include the use of the finest fraction (<1 mm) only to increase In concentration in the leaching solution to 90 mg/L, performing three-step cross-current leaching with 10% solution replenishment and the use of 7.5 g/L of Zn for the cementation process, to achieve an In recovery higher than 90% while minimizing impurities (especially Al and Fe).

3.3. Assessment of Advantageous Process Configuration through the Life Cycle Methodology—Life Cycle Impact Assessment (LCIA)

3.3.1. Classification and Characterization

The results in Figure 8 aim to identify the environmental differences between the two scenarios reported in Figure 4 to assess the advantage/disadvantage of sample pre-sieving to increase In concentration. The results of classification and characterization phases show variable results according to the impact category. The possibility of an In pre-concentration in the treated waste is emphasized in the categories of resource use, minerals and metals, and the ecotoxicity freshwater, for the avoided depletion of primary resources (Figure 8c,j). Overall, the environmental credit due to both the recovered In and the avoided disposal of LCD panels is insufficient to balance the environmental impact of the process, with the exception of Scenario 2, in the categories of climate change and eutrophication freshwater (Figure 8b,d). These positive results are mainly explained by the substantial benefit of the avoided disposal, which is able to balance the environmental burden of concrete production (the main issue of scenario 2). This burden arises from the impact of the cement required to ensure the material’s technical properties. It is evident that the difference between scenarios 1 and 2 is due to the LCD amount used (3 kg with a low In concentration in scenario 1, vs. 18 kg to obtain 3 kg of high In concentration to treat in scenario 2). The lowest impact of Scenario 2 in the climate change category is also confirmed by the comparison with other innovative approaches reported in the literature, such as bioleaching followed by solvent extraction described by Falke and Höck [38]. The advantage of the SCRIPT process is explained by the short reaction time, which results in lower energy demand than the biotechnology. The different LCD amounts explain the variation between the two scenarios in the categories of ozone depletion and ionizing radiation (Figure 8g,n), where the effect of the highest energy demand for crushing is highlighted. Another interesting aspect is related to the decrease in washing water/waste LCD ratio, which affects the results of wastewater treatment (WWT). Indeed, the >1 mm fraction from sieving is sent to concrete production, without preliminary washing for sulphate removal. This reduction in wastewater represents a significant achievement from a sustainability perspective, as water treatment is one of the major weaknesses of hydrometallurgical recycling techniques [39].

3.3.2. Normalization and Weighing

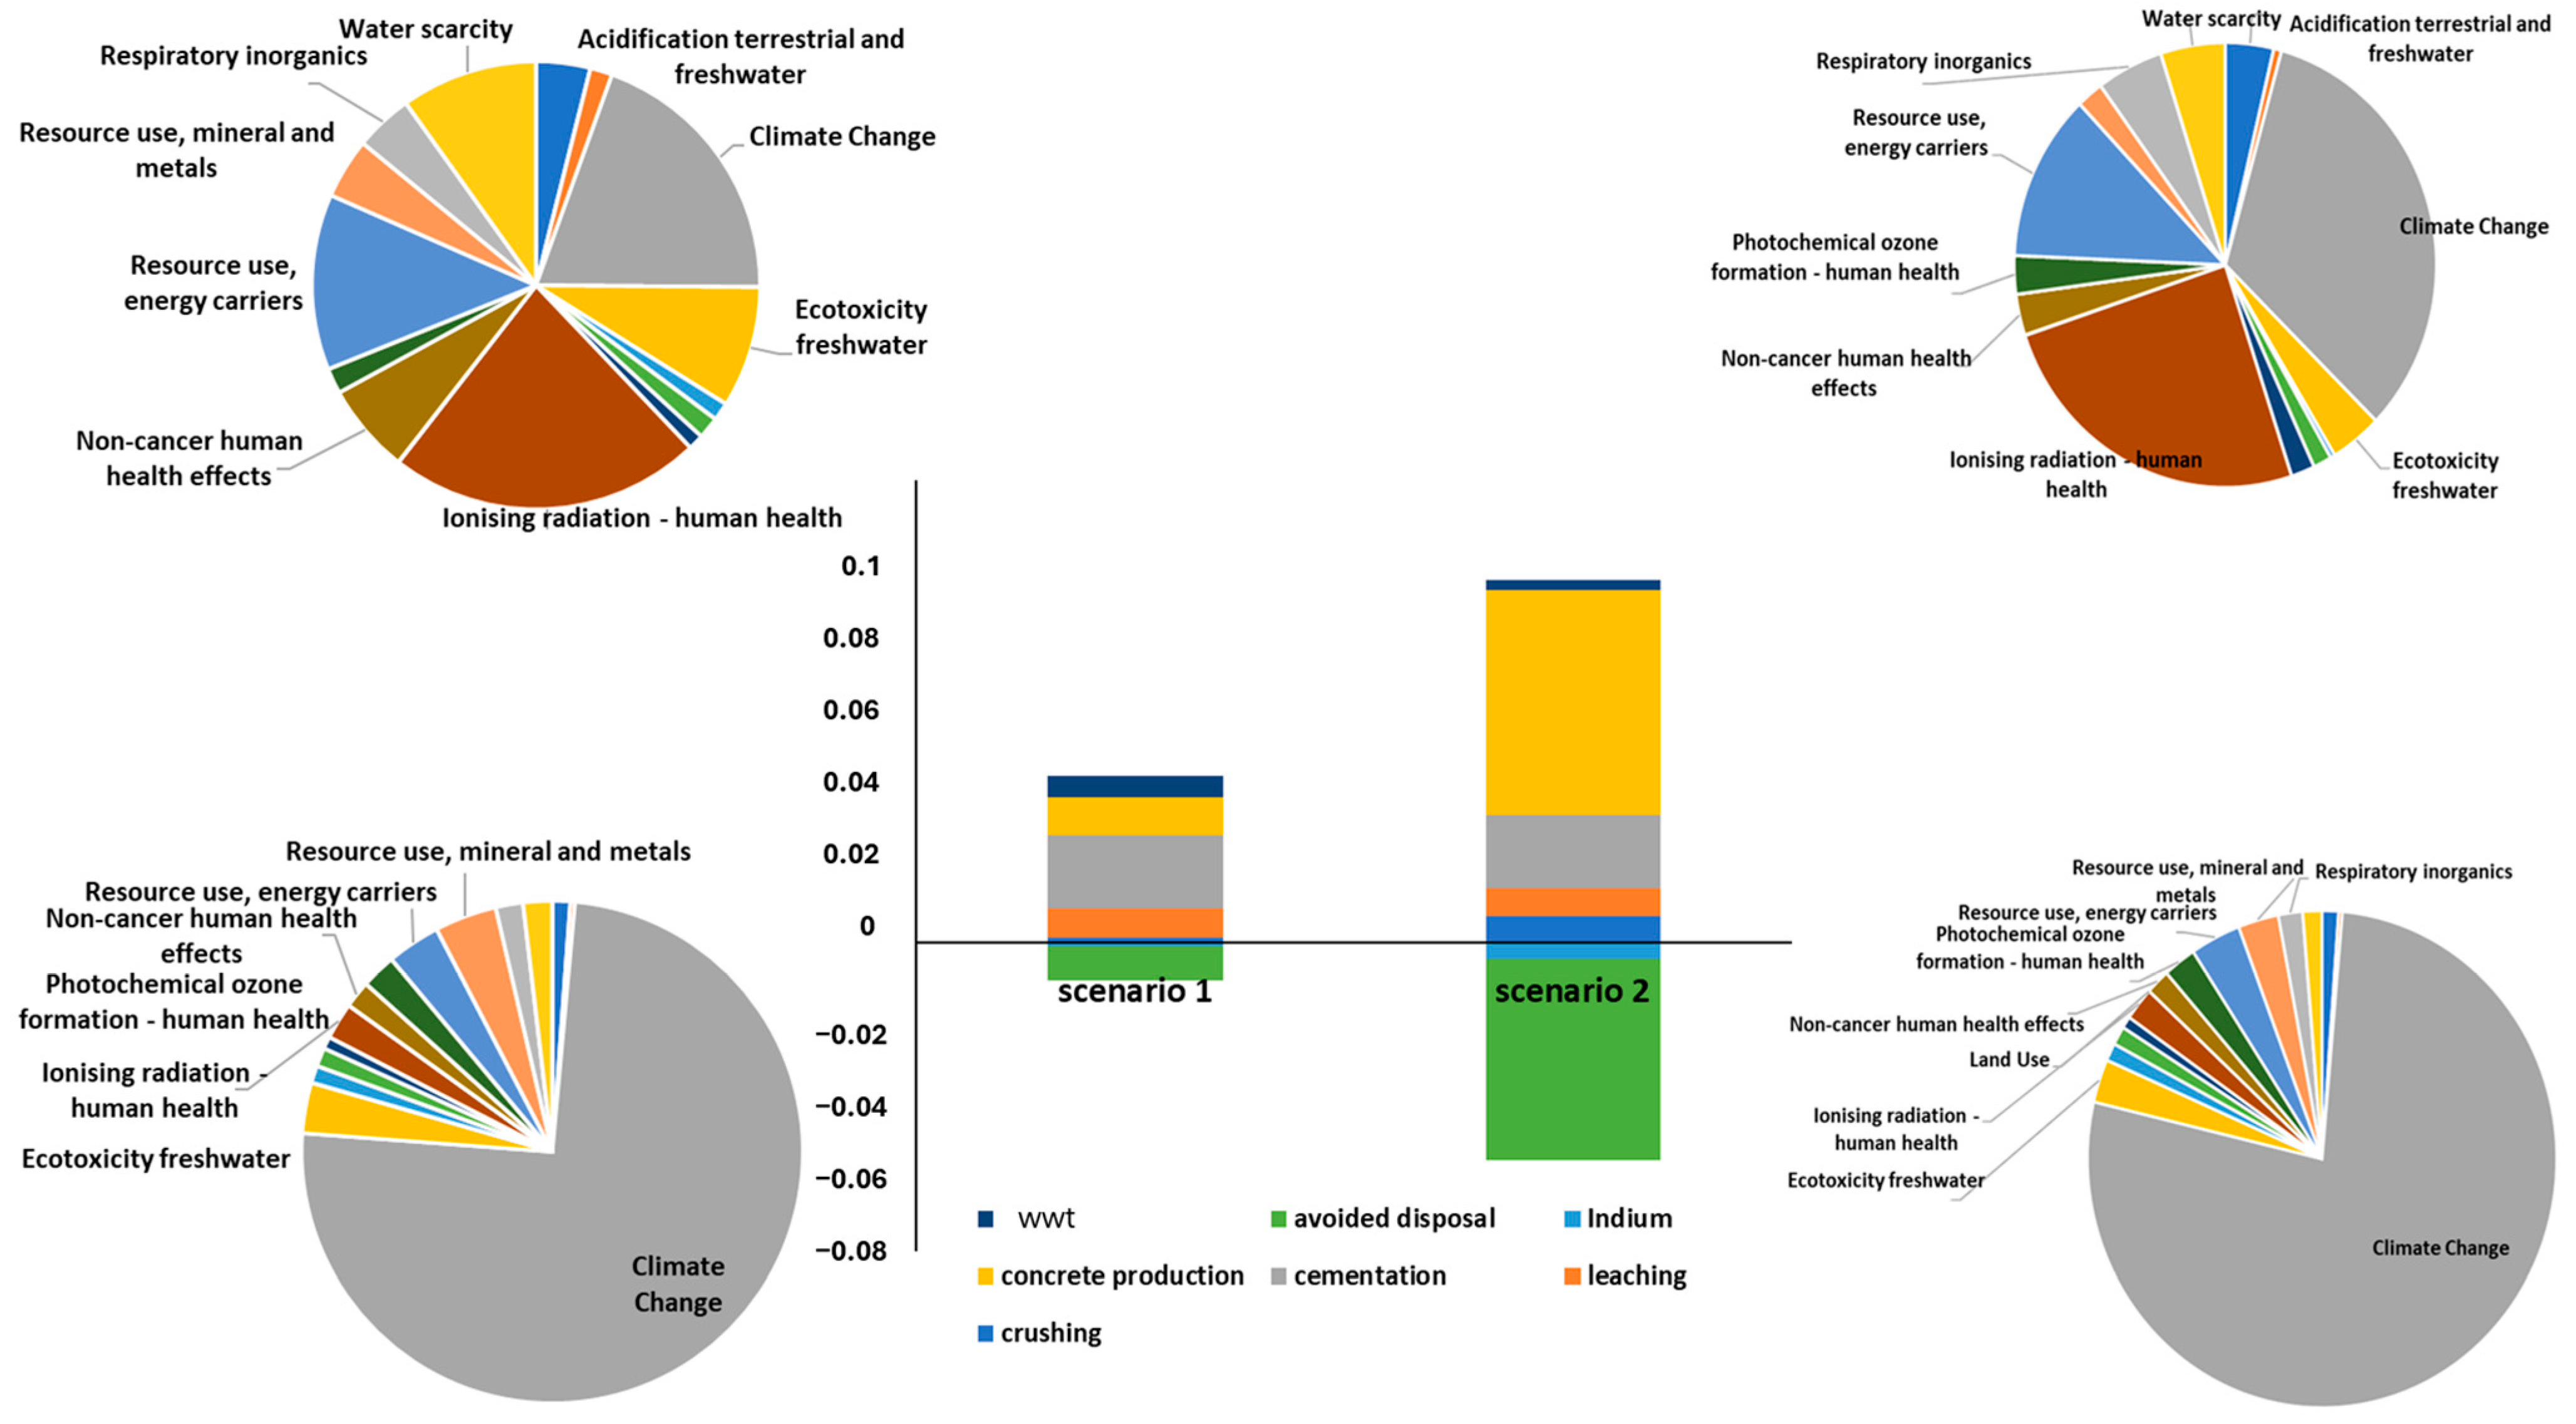
Considering the variability of results observed at the end of classification and characterization (described in Section 3.3.1), normalization and weighing phases were useful for providing a more complete process overview. Overall, the two options showed no relevant differences as concerns environmental aspects (Figure 9), as the higher electricity consumption for the waste pre-treatment is balanced by the benefits in both In recovery and avoided disposal. Furthermore, an additional environmental improvement of scenario 2, could be achieved at the end of optimization phase. The pie-charts in Figure 9 show relevant information about the high benefit of the environmental credit on the climate change category. On the other hand, the contribution of climate change and ionizing radiation on the impact of the whole process is due to both the NaOH used in the cementation step and the cement for concrete production. The possibility to reduce the NaOH consumption in the recovery step is discussed in Section 3.4.
The results described in Figure 8 and Figure 9 take into account the production of a building material that fully utilizes LCD scraps generated from the In recovery process.
The sustainability assessment highlights the advantage of In pre-concentration by sieving. This benefit is mainly highlighted in the category of climate change, a very important aspect considering the current reduction targets for CO2 emissions. The analysis proves that the In loss due to the avoided treatment of the >1 mm fraction does not affect the whole result. Overall, the main strength of the process is the possibility to fully exploit waste LCDs, avoiding their disposal. In recovery represents a highly interesting opportunity, especially considering its increasing market value, although its low concentration in waste remains a weakness in the process. Considering the described results, further optimization will be discussed in the next paragraphs, focusing on the recirculation system.

3.4. Results of Optimization of the Patented Technology SCRIPT at Bench Scale

We investigated the possibility to recirculate: 1. wastewater from the washing step of the treated LCD, and 2. the solution resulting from the cementation step, in the bench scale facilities described above.
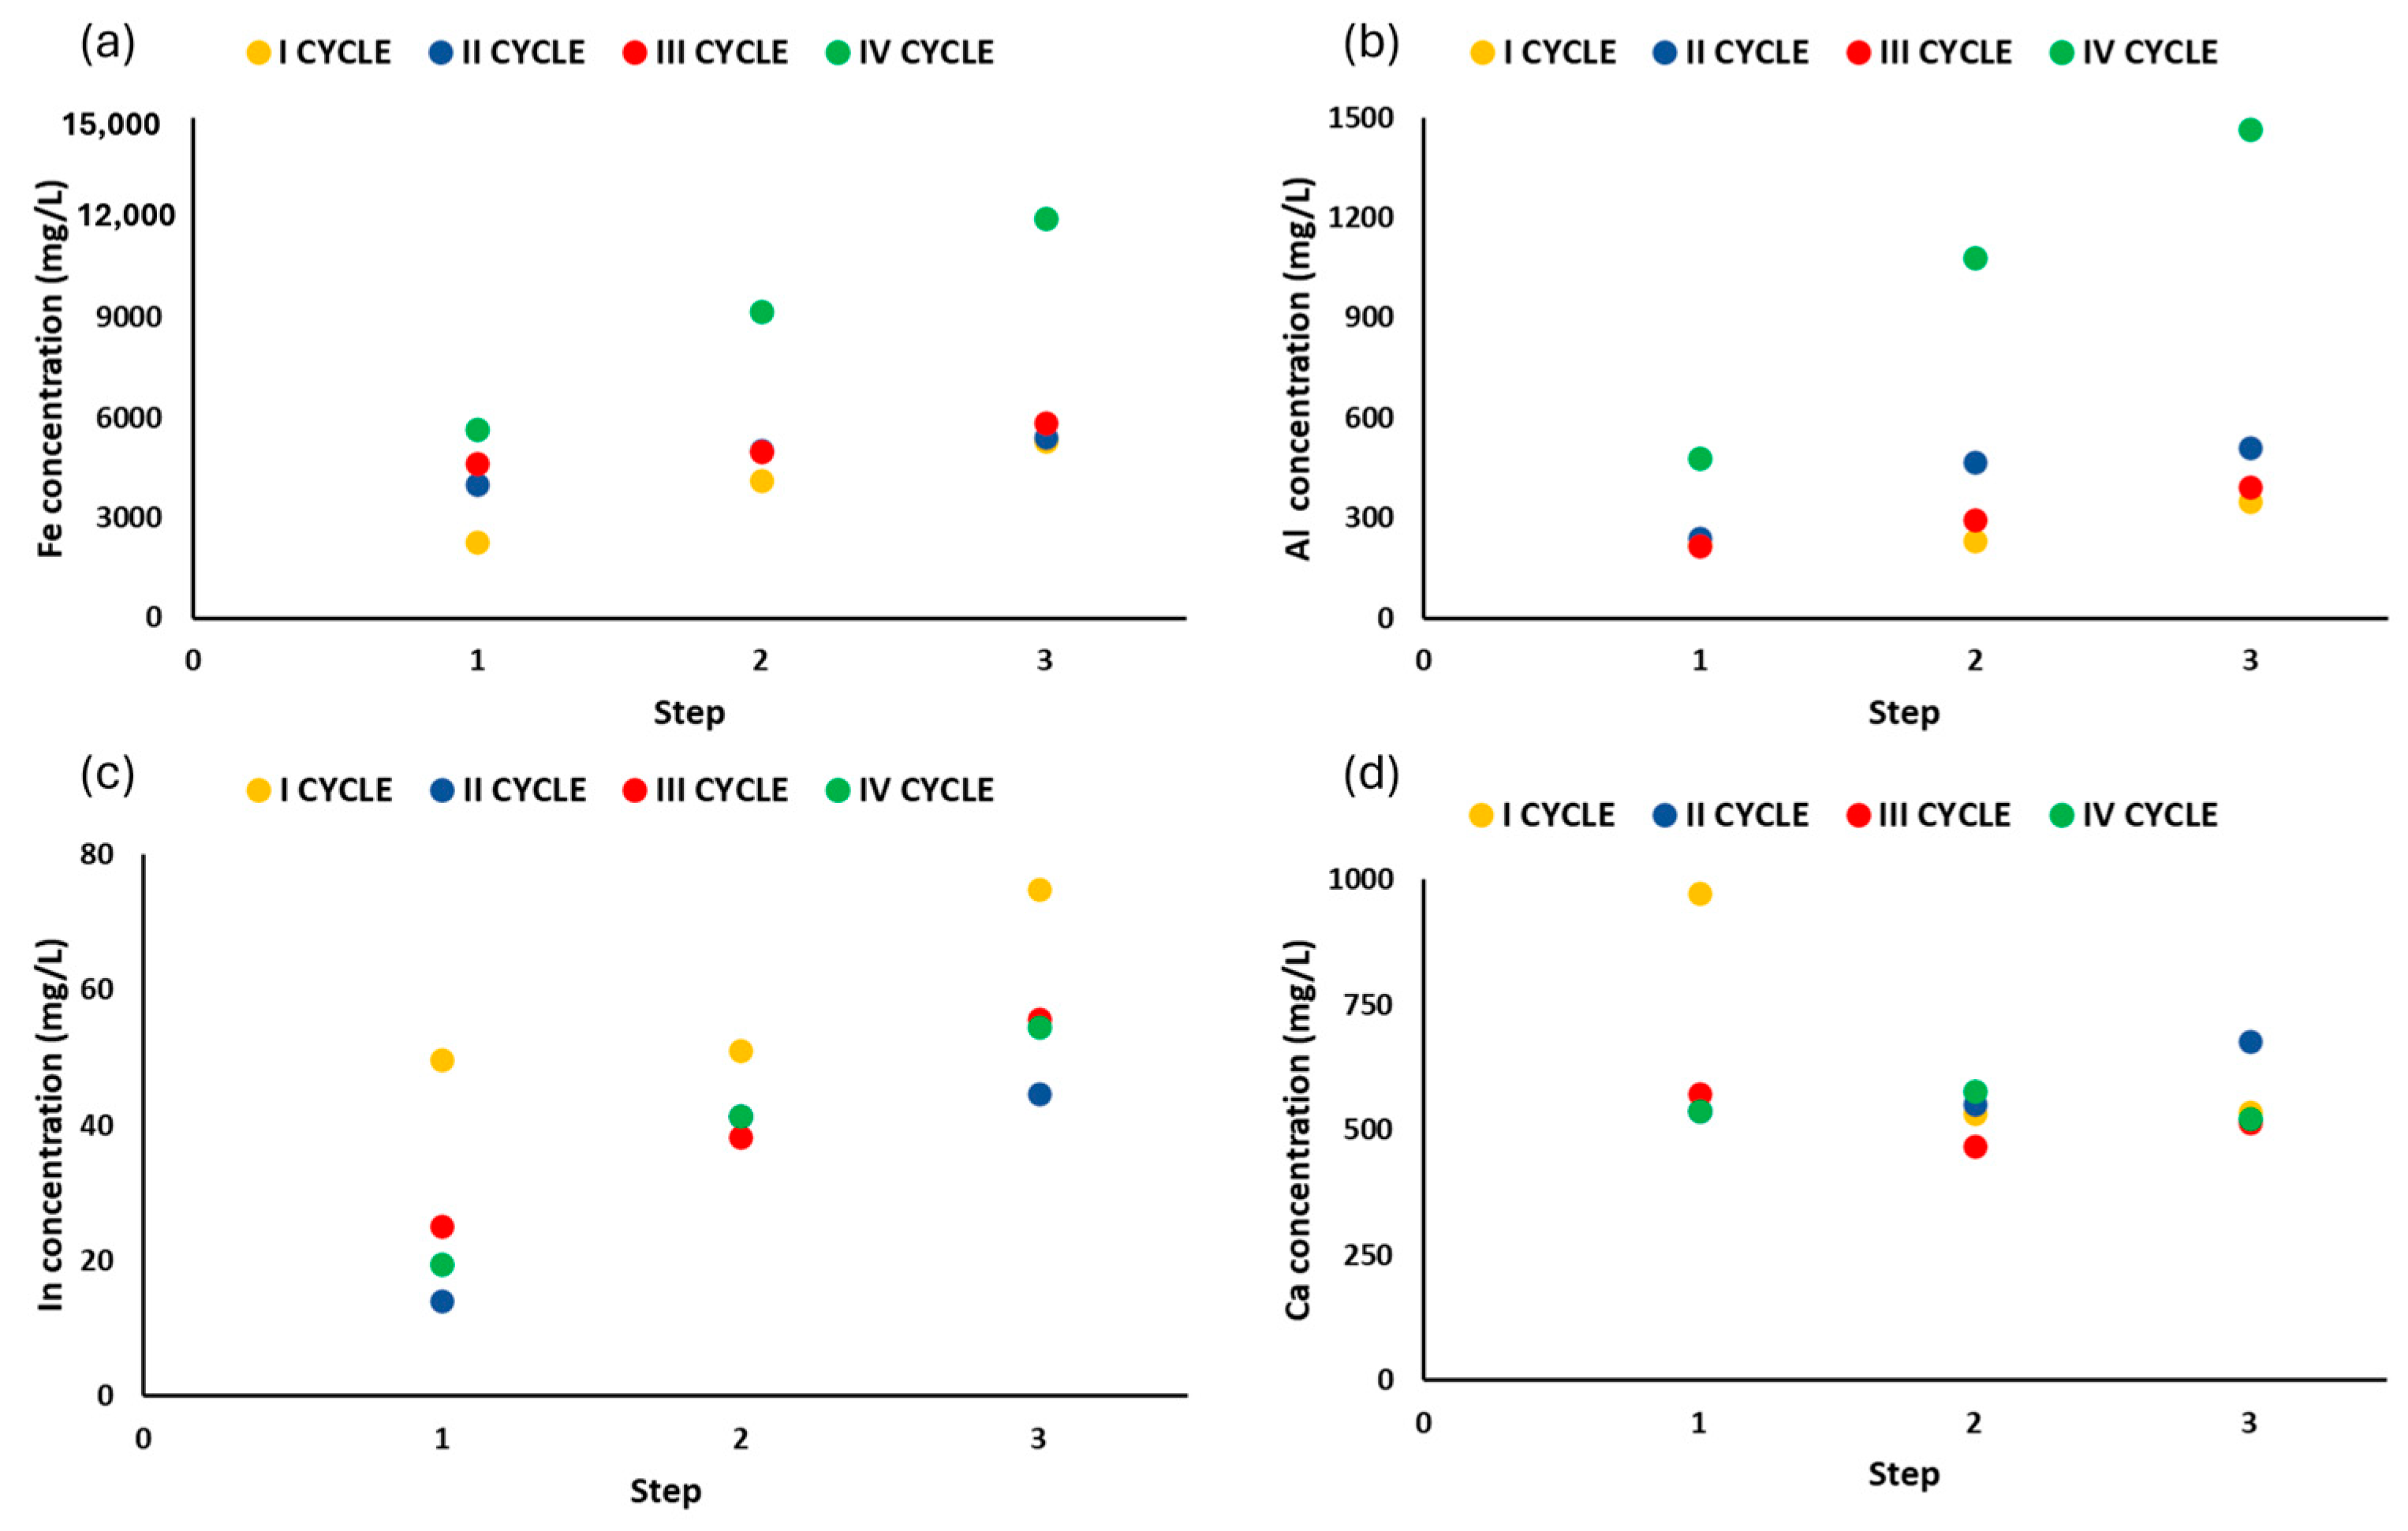
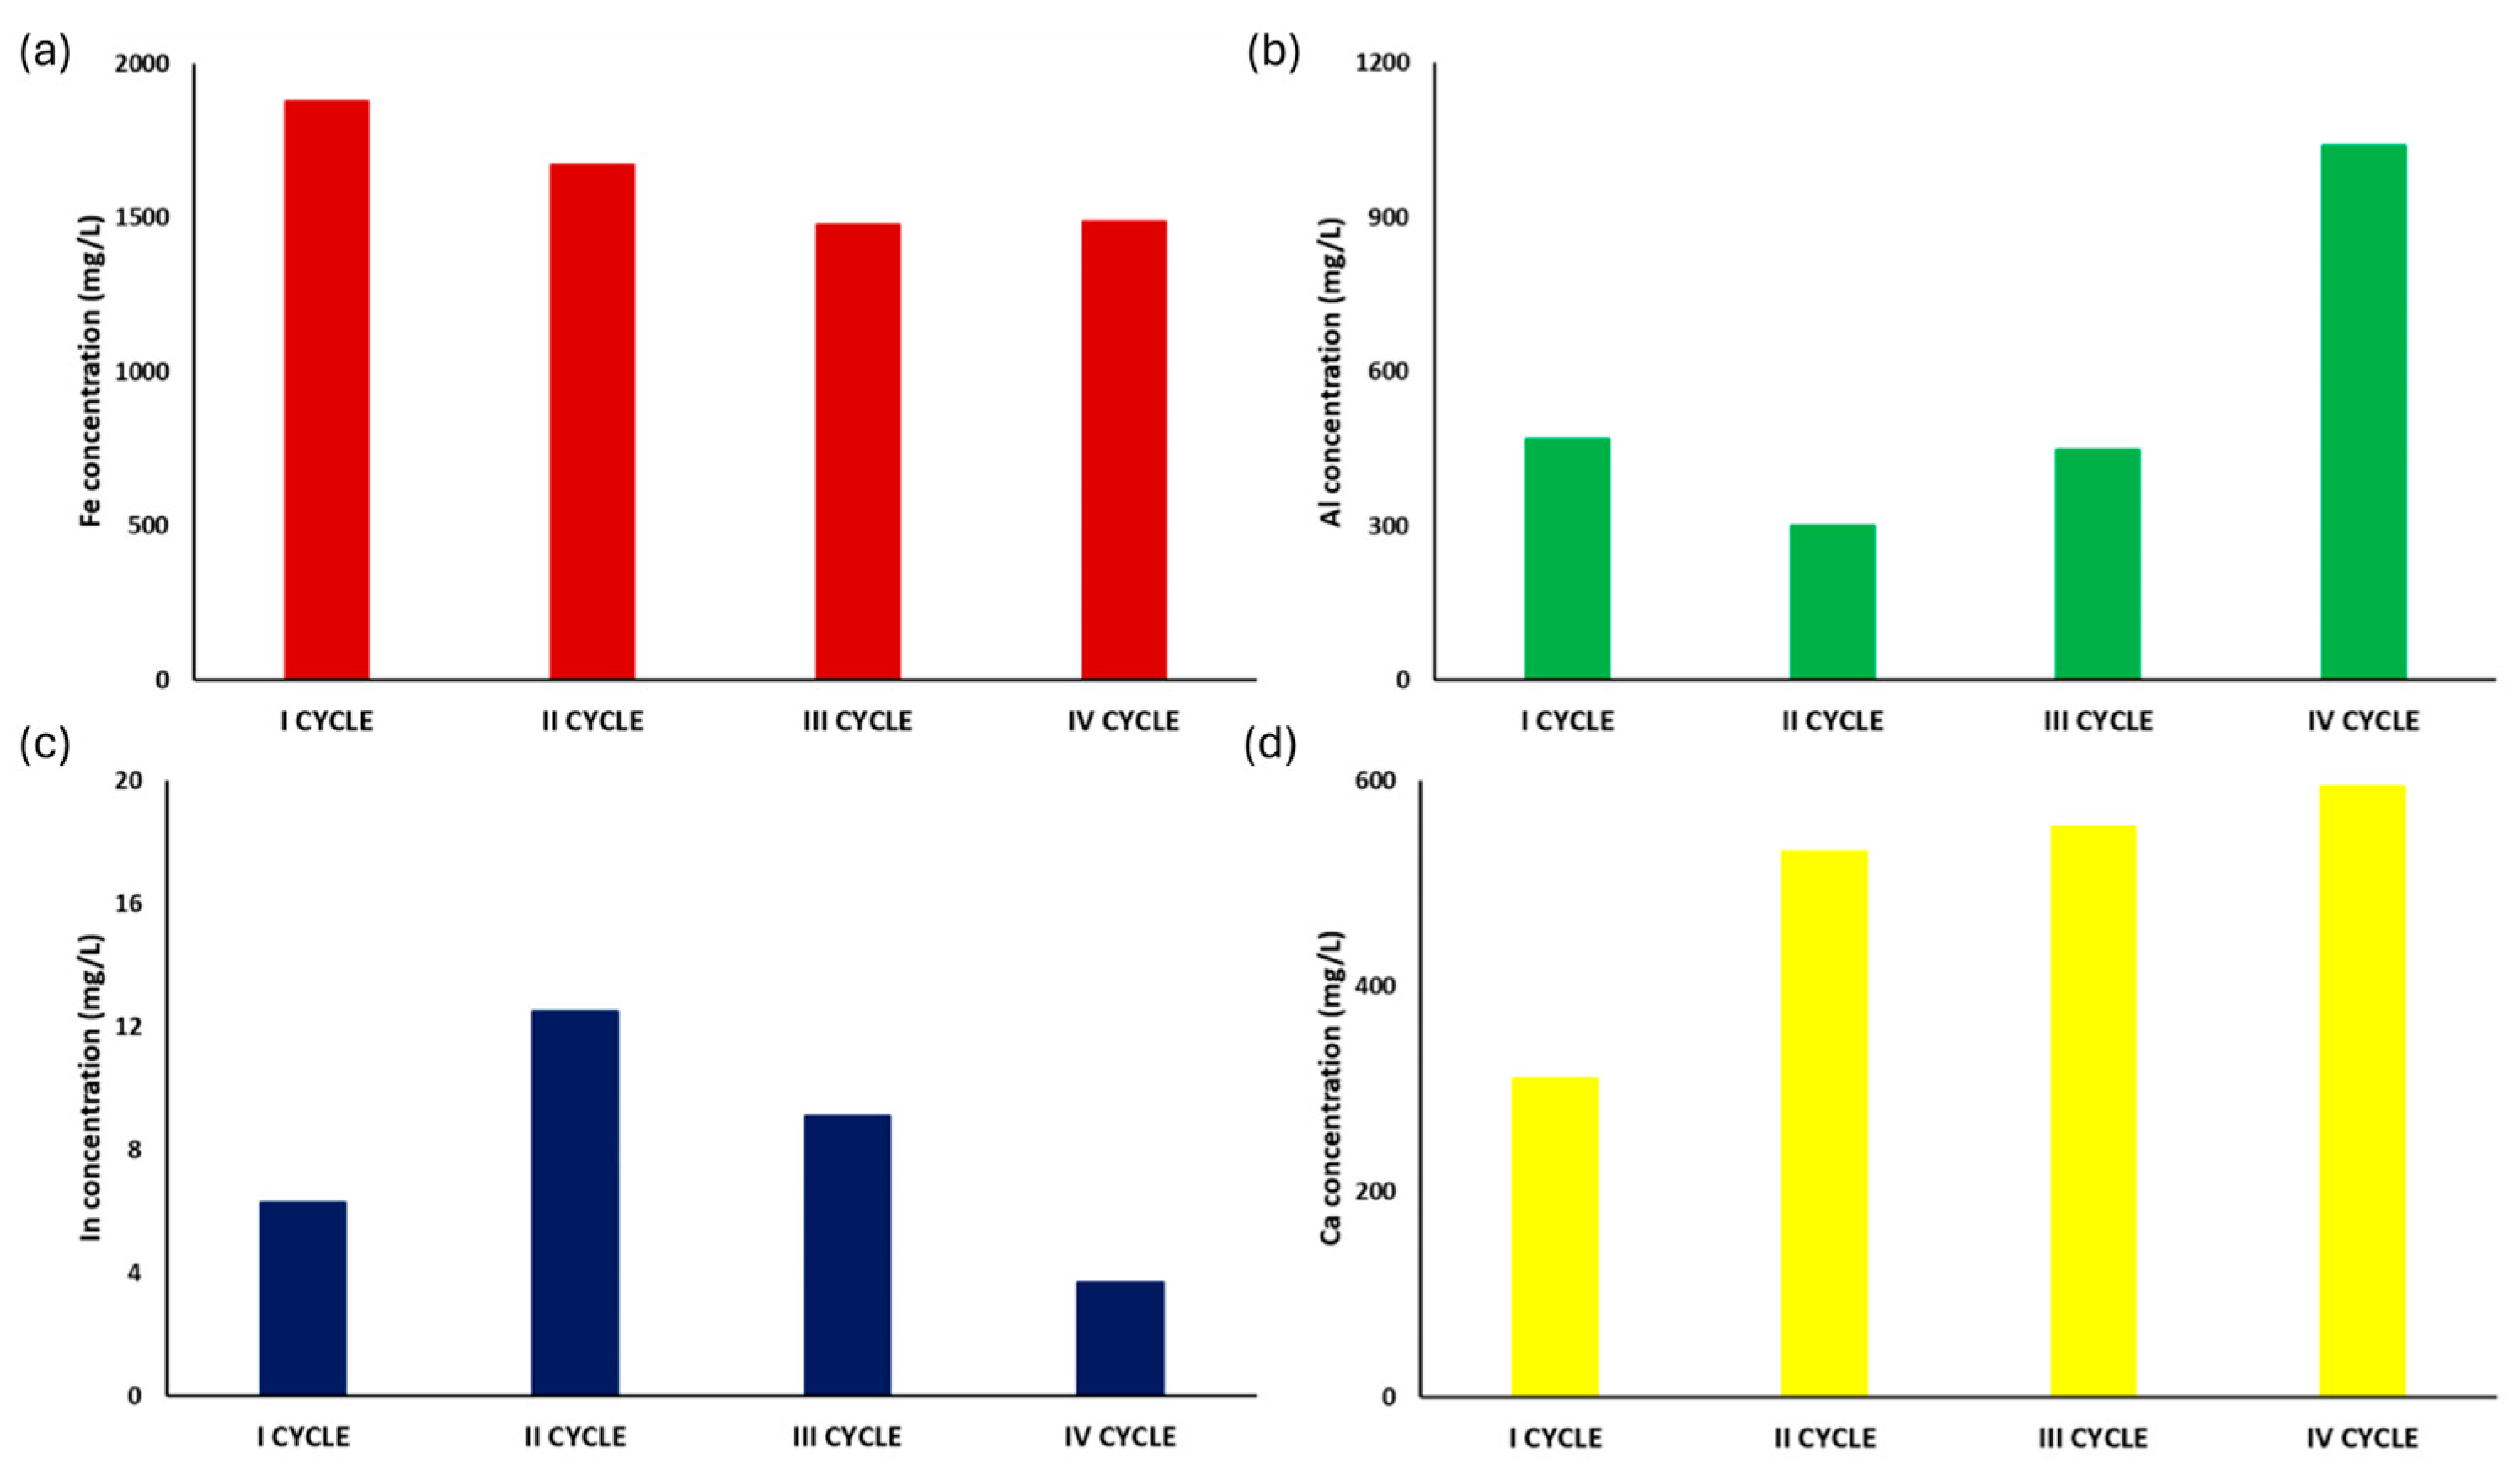
As shown in Figure 10, the In concentration in the leaching solution after three steps of the cross-current process was around 60 mg/L, for any cycle (Figure 10c). From these results, it is evident that the leaching efficiency was not affected by recirculation of cementation and washing wastewater. The same trend was observed for Ca, which showed the same concentration during the four cycles, around 500 mg/L (Figure 10d). On the other hand, Al and Fe concentrations grew in the fourth cycle, from around 5.5 and 0.5 g/L (in the first three cycles) to 12.0 and 1.5 g/L in the last cycle, doubling and tripling their concentrations, respectively. This increase is due to the metal intake from the washing solution, mainly for Al. The Fe and Al concentrations, in the resulting washing solution, were around 1.5 and 1.0 g/L in the fourth washing step, respectively (Figure 11a,b). On the other hand, In and Ca concentrations in the washing solution were constant around 5–10 mg/L and 500 mg/L, respectively (Figure 11c,d).
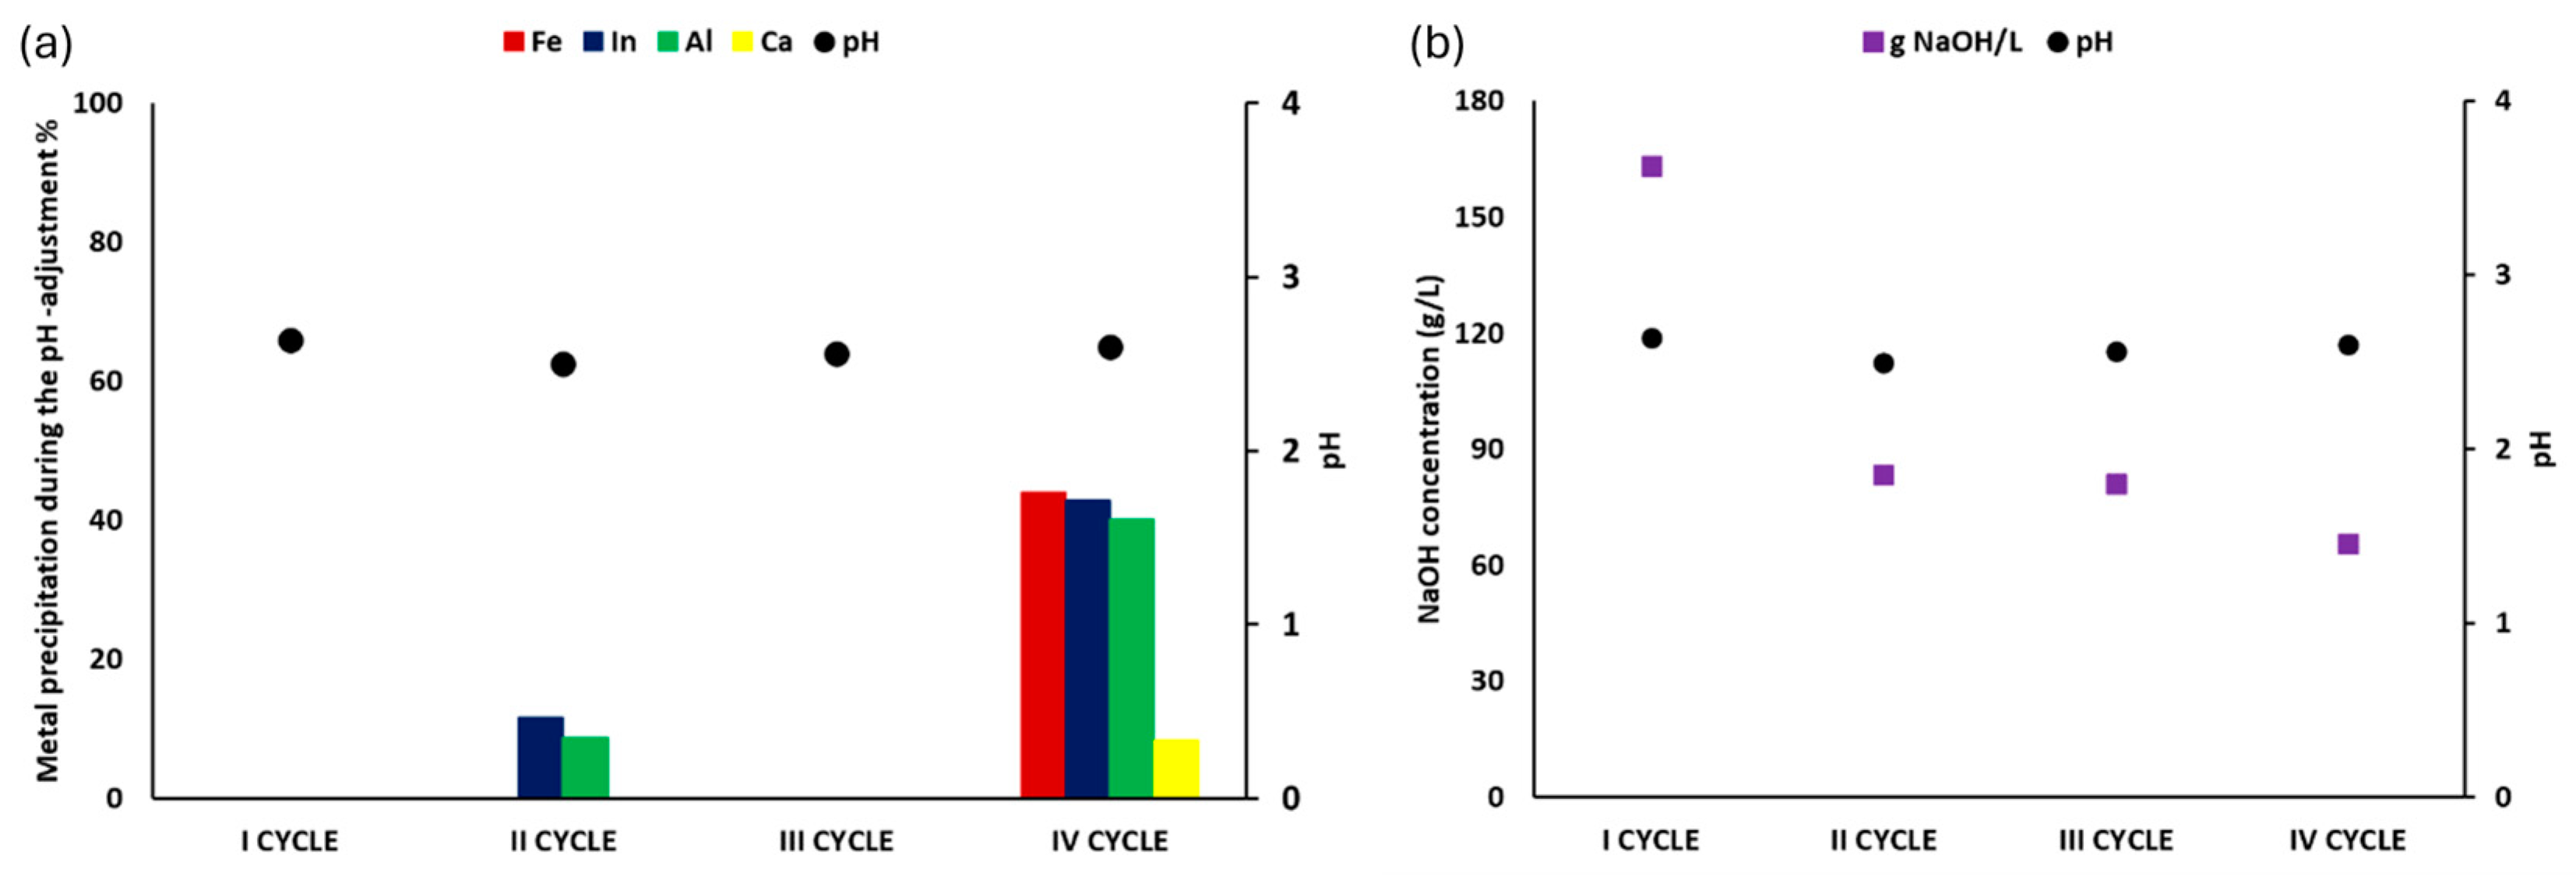
As concerns the further recovery steps, the results showed for the amount of NaOH necessary to increase the pH to the value of 2.5 decreased from 150 g/L, in the first step, to around 70–80 g/L in the second, third, and fourth cycles (Figure 12b). Furthermore, the amount of In that precipitated during the pH adjustment in the first three cycles was negligible (Figure 12a). On the other hand, in the fourth cycle, In recovery was around 40%, comparable to Al and Fe precipitation efficiencies.
The cementation process, with 7.5 g/L of Zn, achieved an In recovery efficiency higher than 90% across all the recirculation cycles tested; the same was obtained without recirculation (Figure 13a). In contrast, Al and Fe recovery efficiencies decreased from 95 to 40%, in the first three cycles, to 20 and 0% in the last cycle, respectively, increasing the In purity in the final product. This was probably due to a lower pH increase in the fourth cycle, reaching a value lower than four, instead of a value higher than six, in the first two cycles (Figure 13b).
These findings confirmed the possibility of recirculating cementation and washing wastewater flows, without reducing the leaching efficiency. The recirculation system allowed for reductions in both the water demand and the volume of wastewater flows to manage. Furthermore, the NaOH demand, for the pH adjustment before the cementation step, was halved due to the recirculation system.
Therefore, the advantage of reduced impurities in the final solid product is further enhanced by a relevant environmental benefit. In this regard, in a previous work, Amato et al. [40] estimated a decrease of 25% in process emissions by the effective wastewater recirculation system.

3.5. Economic Sustainability

The estimation of process costs represents essential information from the perspective of process scale-up. Considering the process peculiarities, its cost-effectiveness is strongly influenced by the market volatility of both metals and raw materials. In addition to economic aspects, the social and sociological issues of electronic waste recovery can be analyzed to cover all the sustainability spheres [38]. Indeed, the creation of an effective recycling system, supported by the legislation for environmental and communities protection, should allow for the social impacts of the mining activities to be avoided [39]. Furthermore, the positive social impact includes increased job opportunities, poverty reduction, and the promotion of economic development [38,41,42].
The economic sustainability analysis refers to a 1 m3 reactor, able to treat 800 kg of panels per day (four step process), for 210 treatments per year. In addition to In, we also considered the excess of Zn from the resulting product as valuable metal. The investment costs are not considered in the economic assessment: the relatively low concentration of In does not justify any investment being dedicated only to In recovery, and the idea is to use the same plant to recover different valuable metals from other residues. The simple design of the plant (a mill, a jacketed reactor, a stirred reactor, a filter press, capex around EUR 120,000) makes it suitable for the implementation of additional treatments; therefore, we considered the facility cost depreciated.
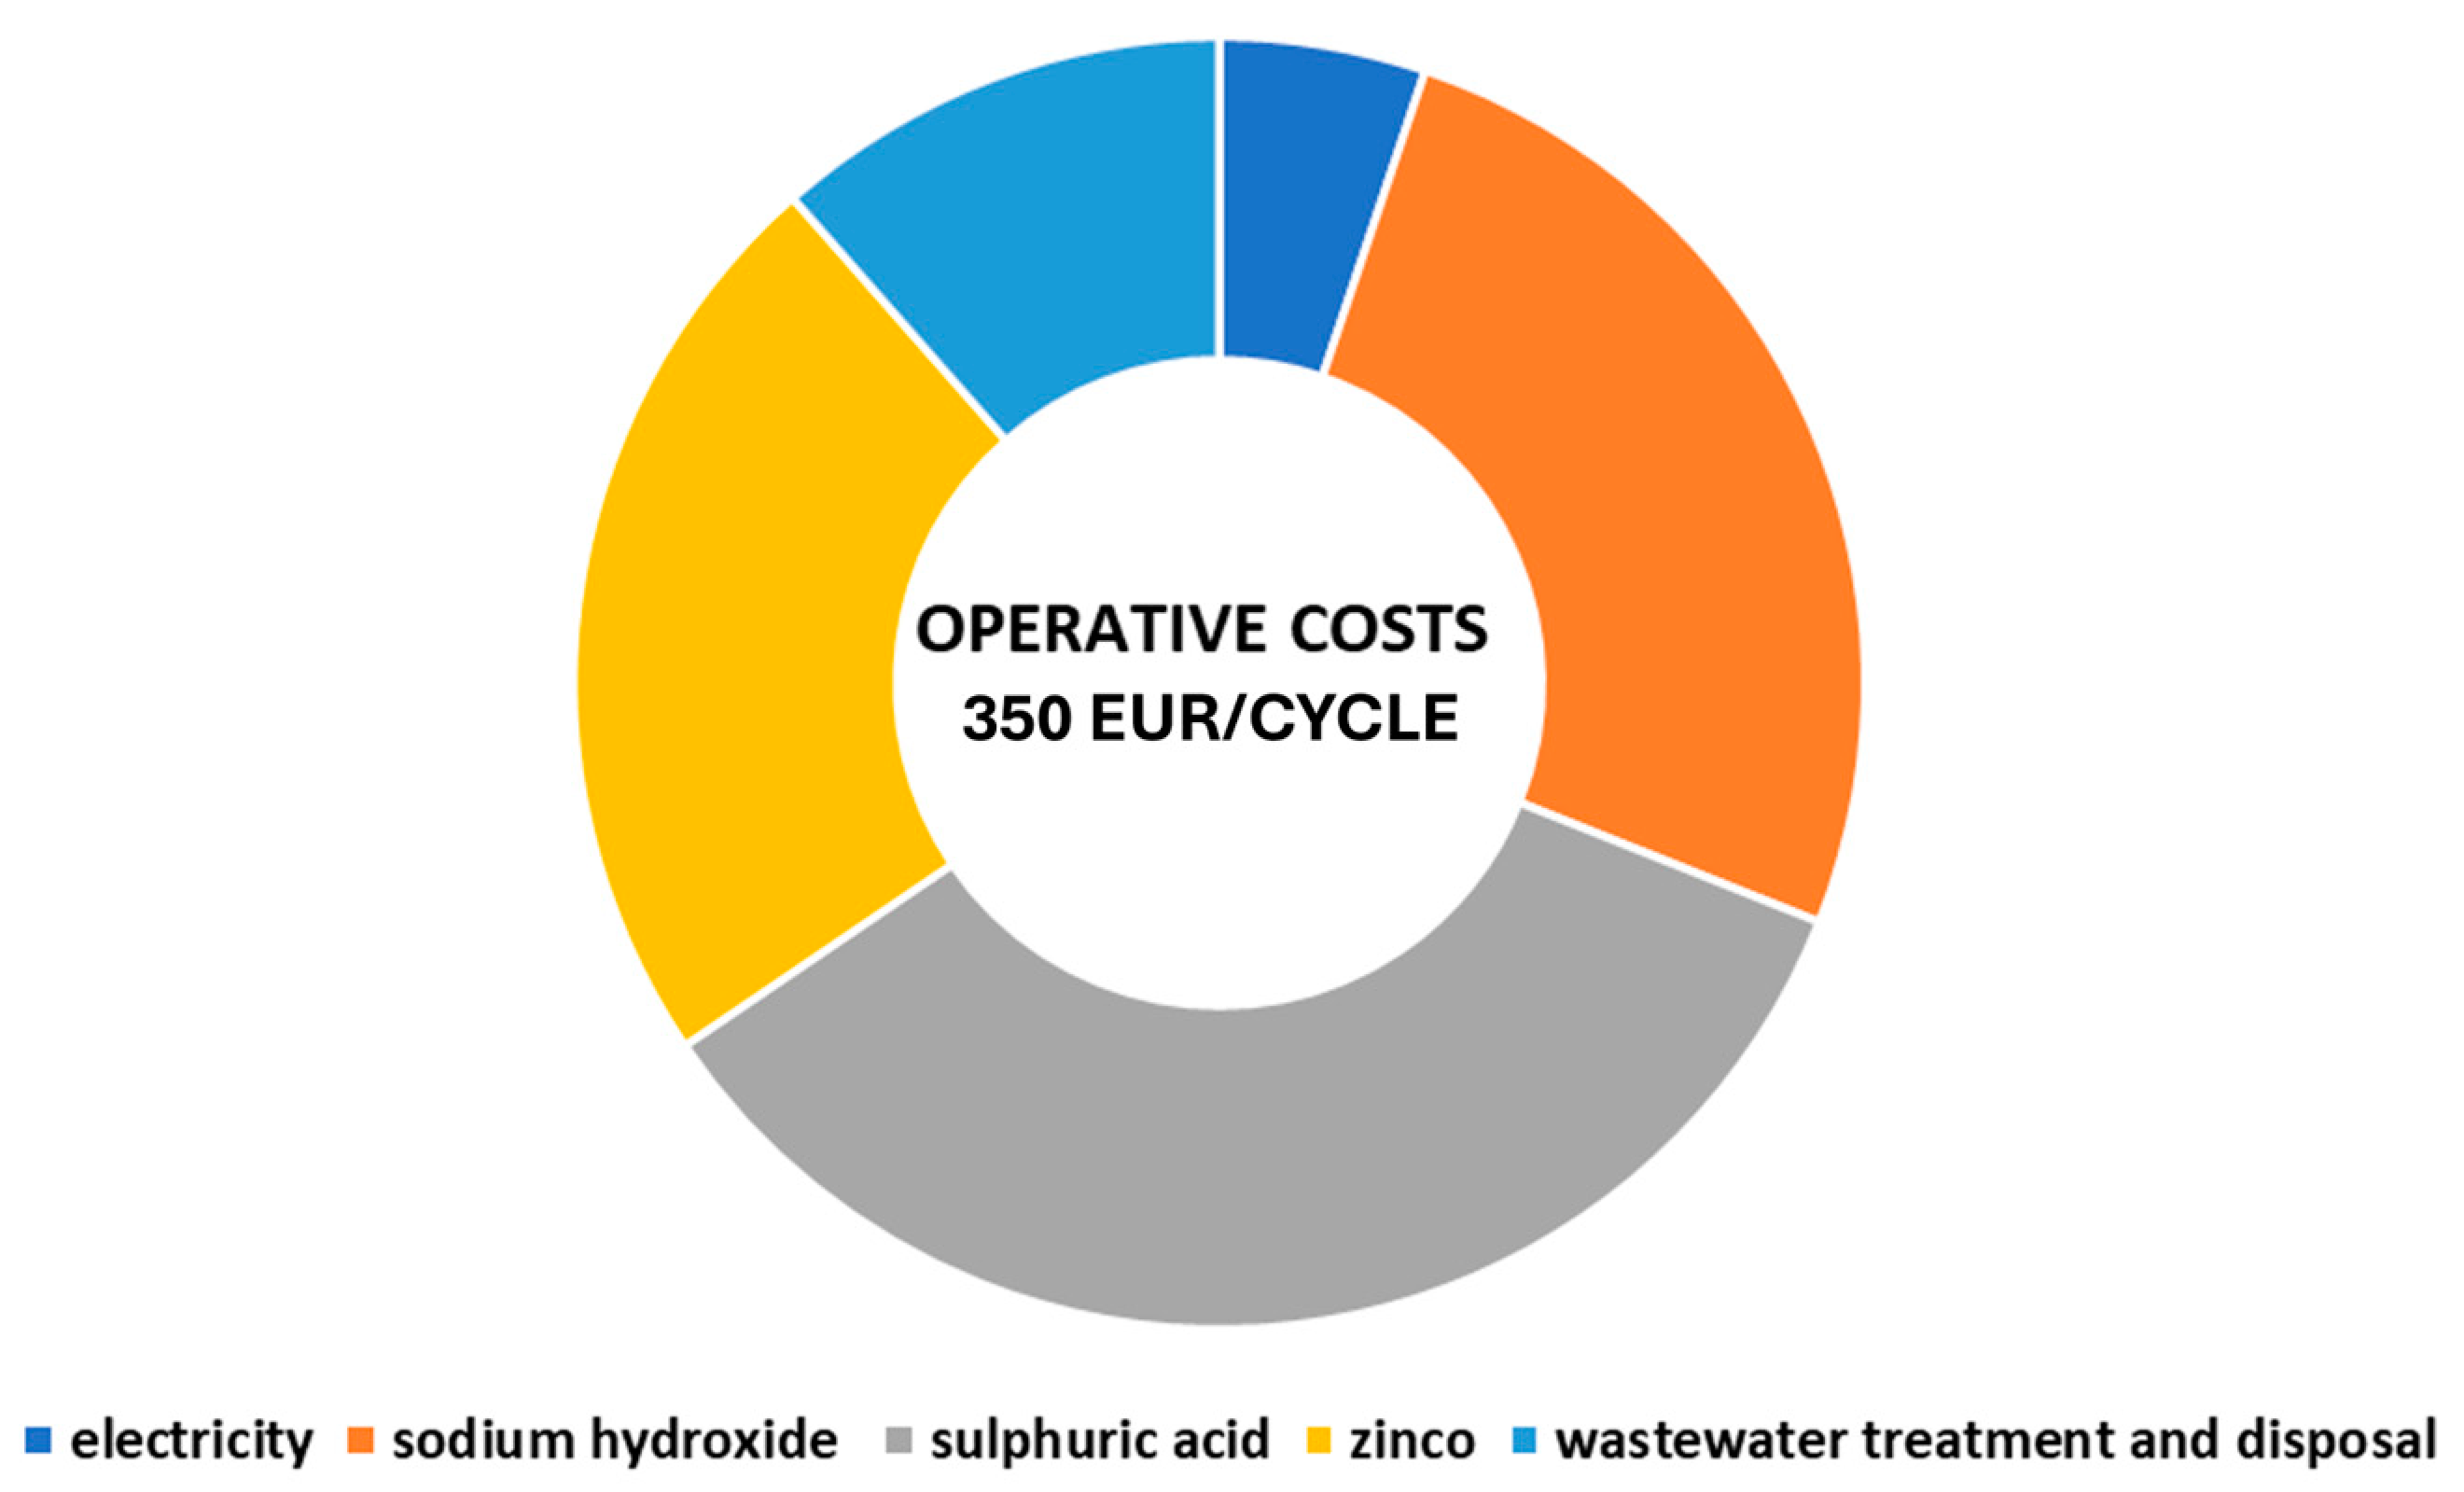
The economic assessment includes several variables, such as the energy and raw material costs and the fluctuations of the metal market. As concerns the operative costs, they were estimated around 350 EUR/cycle with four leaching steps, translated into 73,000 EUR/year, considering 210 cycles for year. The H2SO4 demand causes the highest contribution (34% of the OPEX), followed by NaOH and Zn (26% and 23%, respectively) (Figure 14). This cost distribution confirms the importance of wastewater recirculation, which increases the pH of the solution and decreases the NaOH demand. The additional recovery of Zn from the excess in the solid product could further reduce operating costs.
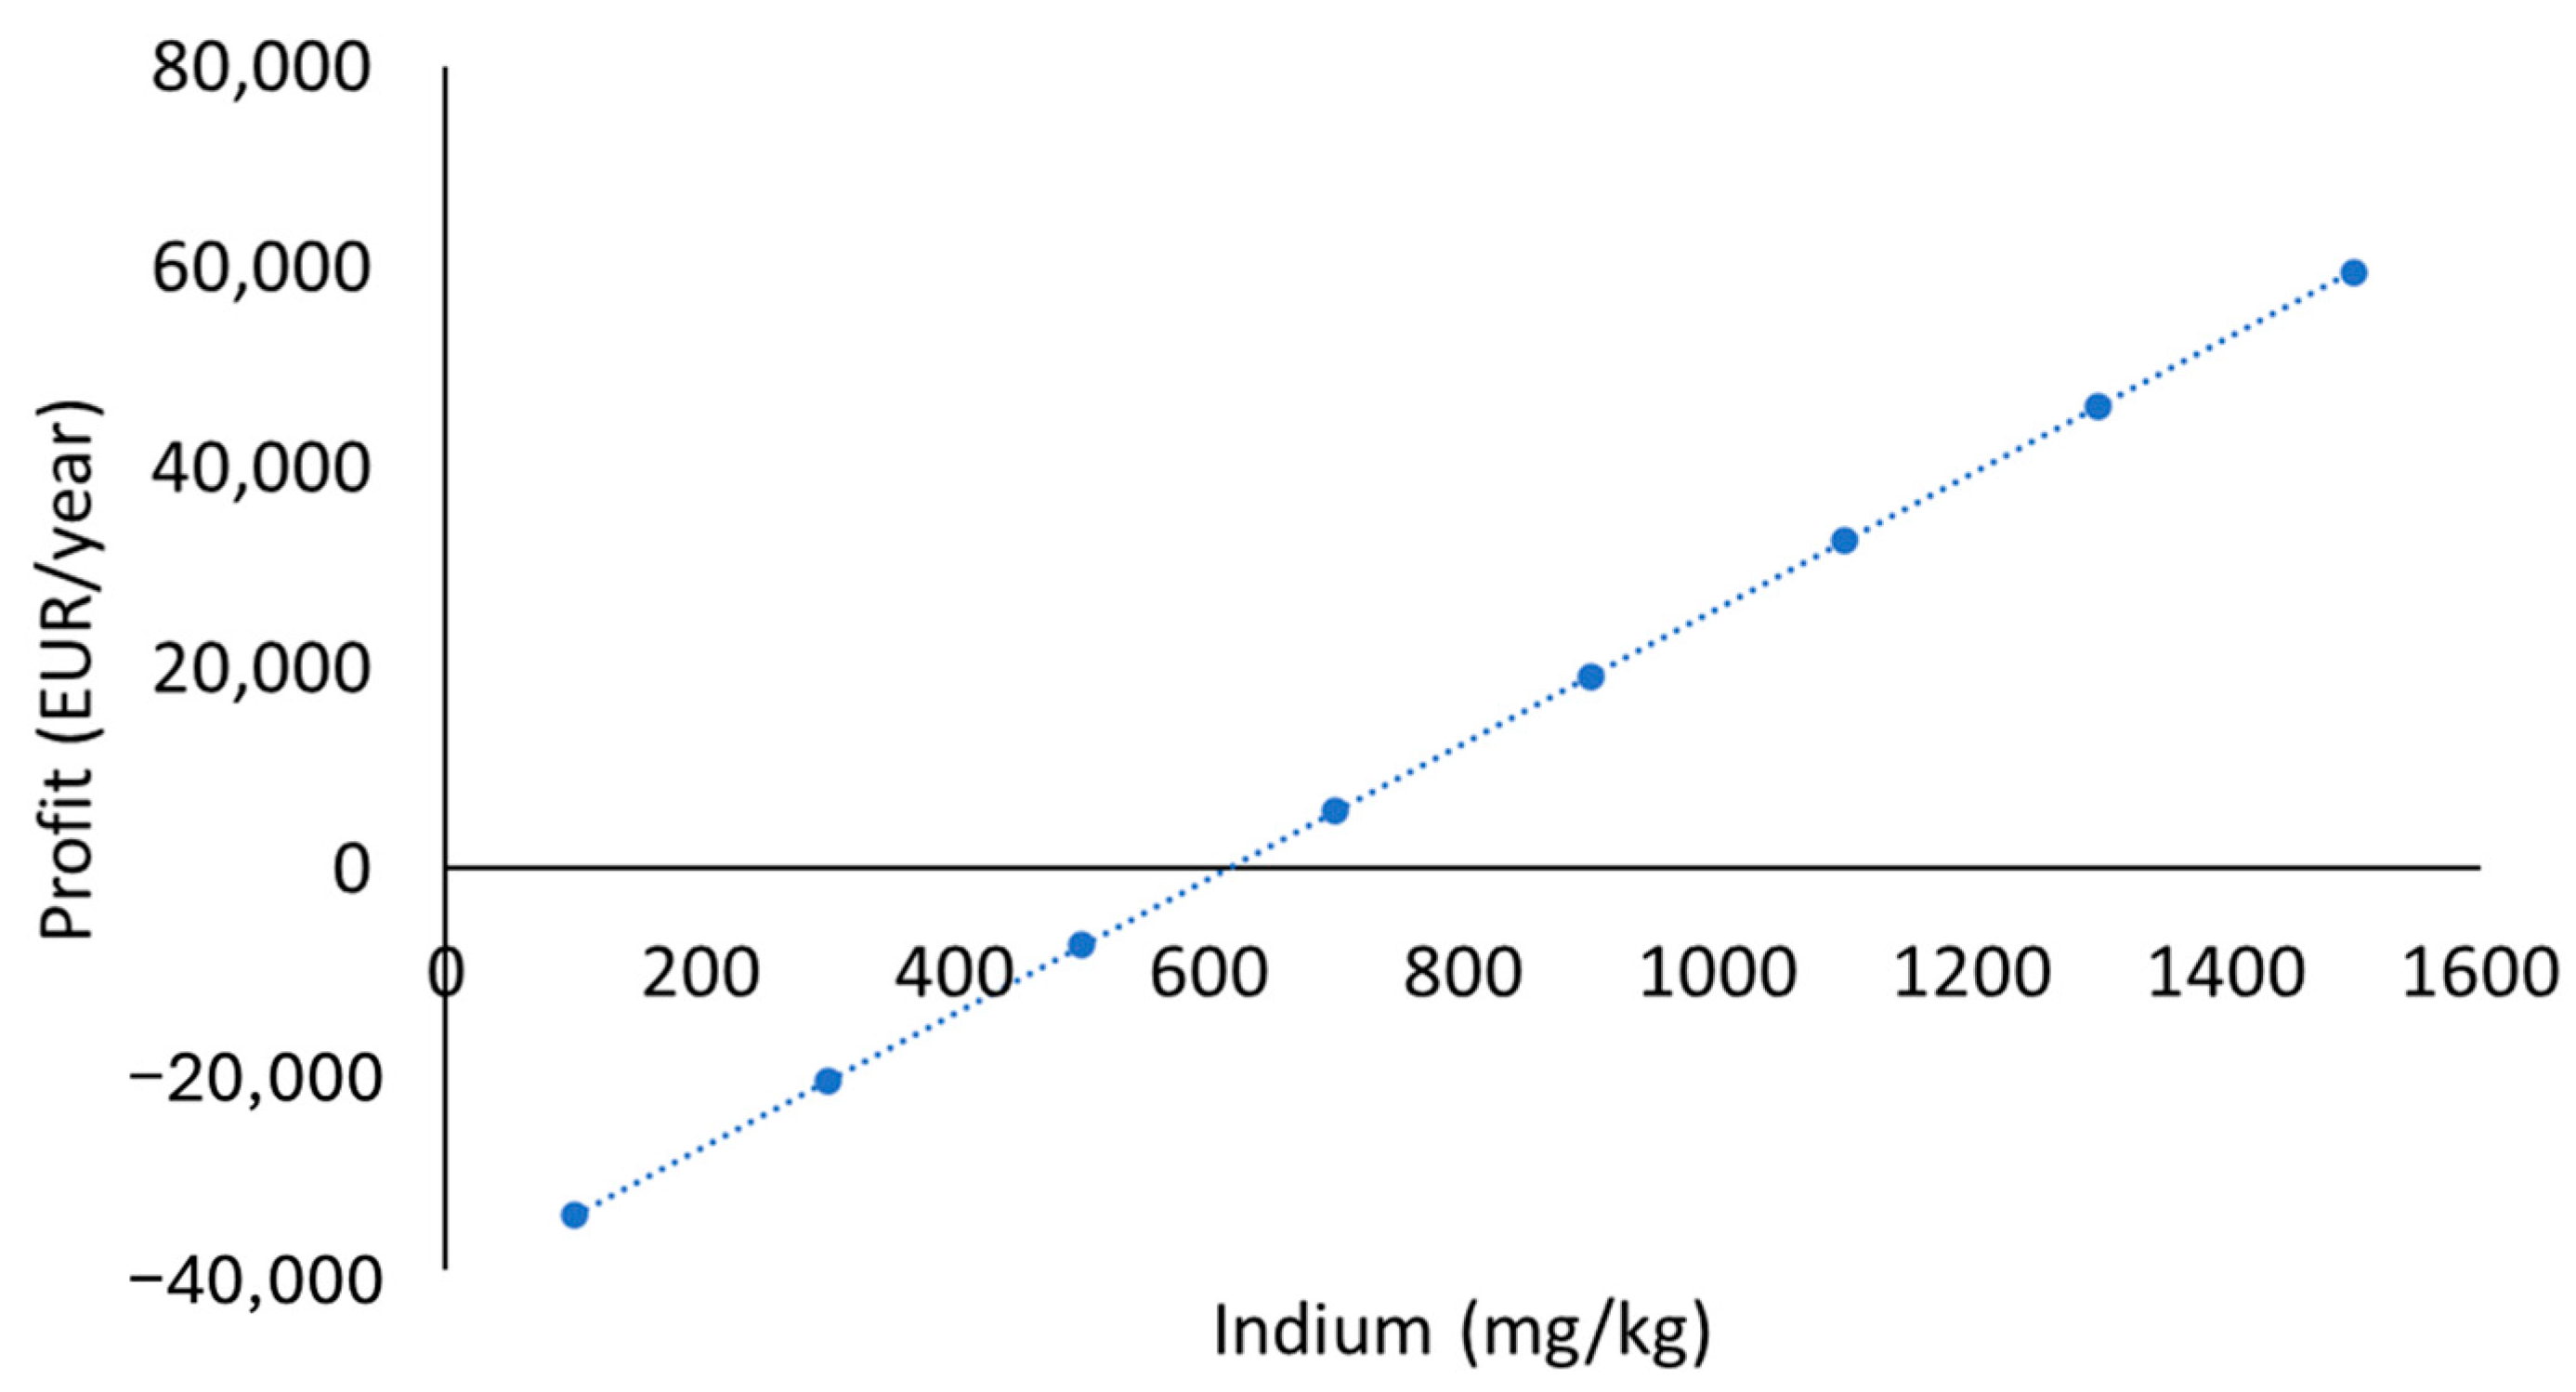
As previously observed, the cost-effectiveness of the process is connected to the In concentration in the starting waste. The trend in the ideal concentration, which makes the process sustainable, is closely linked to market fluctuations. For example, in recent years, the indium price fluctuated from 280 EUR/kg (requiring a concentration of 1200 ppm) to 400 EUR/kg in July 2024. Under these economic conditions, also described in paragraph 2.5, 600 ppm is the concentration able to produce a profit, making the innovative process sustainable from an economic point of view also (Figure 15). The recovery of other metals, such as Cu and Al, is not economically viable. Given the current price of around 9 EUR/kg for Cu and 2 EUR/kg for Al [43,44], the additional cost of integrating a process for Cu and Al recovery is not sustainable compared to In, which has a price 40 times higher. Considering the importance of the identification of sustainable strategies for In recovery, additional efforts should be made in pre-treatment to obtain a higher In pre-concentration (along with mixing different waste with relevant metal content). In the study by Savvilotidou et al. (2019) [45], several pre-treatment methods (mechanical crushing and sieving, pyrolysis, a gravimetric method, thermal shock) were compared based on In concentrations and potential economic savings. The findings indicated that thermal shock is the most effective pre-treatment technique, achieving a maximum In pre-concentration yield of 77.4% [46,47,48,49]. However, the economic analysis confirmed that mechanical crushing and sieving is the most cost-effective option, followed by thermal shock and pyrolysis. These results suggest that further incorporating a pre-sorting step (e.g., thermal shock to separate polarizers) could be a promising solution to increase the starting In concentration in the LCD waste.
The present evaluation confirms the necessity of combining the developed process with additional recycling treatments to reduce investment costs. Overall, our study is fundamental not only for boosting indium recycling in the world, but also to present a methodological approach to meet sustainability goals within circular economy approaches for strategic metals in complex matrices.

3.6. Obstacles to Scaling Up

Given the simple design proposed by the patent, we do not see significant obstacles to the process scale-up, apart from the typical market fluctuations for raw materials and products, which could affect the process sustainability. Nevertheless, these are common issues in any recycling process.
Another challenge could be linked to a variation in In concentration, in the event it will decrease in LCD devices.
In recent years, WEEE has become a pressing global issue, increasing at an annual rate of 3–4% due to economic growth and the expanding use of electronics in everyday life. By 2030, their amount is expected to exceed 74 million tons [50]. Although the weight of WEEE is not a definitive indicator, since its composition changes over time, an estimate of future WEEE composition can be made based on the types of products currently being introduced to the market [51], and LCDs represent a substantial portion of electronic waste [52]. Currently, as already reported, LCDs are widely used in televisions, laptops, desktops, and other devices, and contain 0.12–0.14% liquid crystals whose main ingredient is indium-tin oxide. Consequently, approximately 90% of the indium produced annually is used for LCD manufacturing [51], ensuring the availability of waste quantities to support the recycling industry.
Another issue in scaling up the process relates to the fluctuating cost of Zn used in the cementation process. Currently, this is not a major limitation, as Zn costs have decreased to a quarter of those reported in Table 1. Furthermore, an alternative solution could be the replacement of Zn powder cementation with an electrodeposition process, to reduce Zn consumption. The effectiveness of electrodeposition was already demonstrated in studies by Song et al., where a two-step electrodeposition process allowed the achievement of a 99.41% recovery rate for In [53,54].

4. Conclusions

Indium concentration in LCDs is higher than that in ores, making LCD scraps an attractive opportunity, given its growing market value. The SCRIPT patent offers a solution for In recovery from end-of-life LCDs, able to combine high technical performance, sustainability, and a simple design thought process considering industrial scale implementation. In this regard, the present paper shows how the integration of experimental activity and sustainability analysis (both environmental and economic) drives the validation and optimization of this innovative process. Overall, the results show In recovery efficiency over 90%, with excellent selectivity over the main interfering elements.
The general process scheme includes preliminary pre-treatment of crushing and sieving with the finest fraction (<1 mm), cross-current leaching in three steps with 10% refreshing of the leaching solution, and recovery by cementation with 7.5 g/L of Zn. An additional unit for wastewater recovery and recirculation was included to reduce water and raw material consumptions.
This study enhances environmental benefits due to the avoided disposal of the displays, and highlights the economic relevance of In concentration in treated waste, identifying >600 ppm as the threshold for process sustainability. Considering the simple design of the process, metal market fluctuations are identified as the main limitation in process scale-up; however, this is a common issue in all recycling processes. Additional advantages for society can be hypothesized thanks to the creation of new job positions and a regulated recycling system of waste LCDs, as an alternative to their illegal exportation towards poorer countries. The integration of all sustainability spheres (environmental, economic, and social) during the optimization of the recycling process represents an excellent example of circular economy implementation.

Author Contributions

Conceptualization, F.B. and A.B.; methodology, A.A.; validation; A.B. and G.M.; formal analysis, A.A.; investigation, A.B.; resources, F.B.; data curation, A.B.; writing—original draft preparation, A.B. and G.M.; writing—review and editing, A.B. and G.M.; visualization, G.M.; supervision, A.A.; project administration, F.B., funding acquisition, F.B. All authors have read and agreed to the published version of the manuscript.

Funding

This research was funded by the Italian Ministry of Economic Development (MISE) Proof of Concept 2020.

Institutional Review Board Statement

Not applicable.

Informed Consent Statement

Not applicable.

Data Availability Statement

Data are contained within the article.

Conflicts of Interest

The authors declare no conflicts of interest.

References

  1. Lokanc, M.; Eggert, R.; Redlinger, M. The Availability of Indium: The Present, Medium Term, and Long Term; National Renewable Energy Laboratory: Golden, CO, USA, 2015; pp. 1–90. Available online: https://www.nrel.gov/docs/fy16osti/62409.pdf (accessed on 30 July 2024).
  2. Illés, I.B.; Nagy, S.; Kékesi, T. The recycling of pure metallic indium from waste LCD screens by a combined hydro-electrometallurgical method. Hydrometallurgy 2022, 213, 105945. [Google Scholar] [CrossRef]
  3. Lin, K.L.; Chang, W.K.; Chang, T.C.; Lee, C.H.; Lin, C.H. Recycling thin film transistor liquid crystal display (TFT-LCD) waste glass produced as glass-ceramics. J. Clean. Prod. 2009, 17, 1499–1503. [Google Scholar] [CrossRef]
  4. Yuan, Z.; Shi, L. Improving enterprise competitive advantage with industrial symbiosis: Case study of a smeltery in China. J. Clean. Prod. 2009, 17, 1295–1302. [Google Scholar] [CrossRef]
  5. Rocchetti, L.; Amato, A.; Beolchini, F. Recovery of indium from liquid crystal displays. J. Clean. Prod. 2016, 116, 299–305. [Google Scholar] [CrossRef]
  6. Sethurajan, M.; van Hullebusch, E.D.; Fontana, D.; Akcil, A.; Deveci, H.; Batinic, B.; Leal, J.P.; Gasche, T.A.; Kucuker, M.A.; Kuchta, K.; et al. Recent advances on hydrometallurgical recovery of critical and precious elements from end of life electronic wastes—A review. Crit. Rev. Environ. Sci. Technol. 2019, 49, 212–275. [Google Scholar] [CrossRef]
  7. Zheng, K.; Benedetti, M.F.; van Hullebusch, E.D. Recovery technologies for indium, gallium, and germanium from end-of-life products (electronic waste)—A review. J. Environ. Manag. 2023, 347, 119043. [Google Scholar] [CrossRef]
  8. Zhang, K.; Wu, Y.; Wang, W.; Li, B.; Zhang, Y.; Zuo, T. Recycling indium from waste LCDs: A review. Resour. Conserv. Recycl. 2015, 104, 276–290. [Google Scholar] [CrossRef]
  9. Rocchetti, L.; Amato, A.; Fonti, V.; Vegliò, F.; Beolchini, F. Innovative method to extract indium from LCD panels. Chem. Eng. Trans. 2015, 43, 1–6. [Google Scholar] [CrossRef]
  10. Ma, E.; Xu, Z. Technological process and optimum design of organic materials vacuum pyrolysis and indium chlorinated separation from waste liquid crystal display panels. J. Hazard. Mater. 2013, 263, 610–617. [Google Scholar] [CrossRef]
  11. Amato, A.; Rocchetti, L.; Beolchini, F. Evaluation of different strategies for end-of-life liquid crystal displays (LCD) management. Environ. Eng. Manag. J. 2017, 16, 1651. [Google Scholar] [CrossRef]
  12. Rocchetti, L.; Amato, A.; Fonti, V.; Ubaldini, S.; De Michelis, I.; Kopacek, B.; Vegliò, F.; Beolchini, F. Cross-current leaching of indium from end-of-life LCD panels. Waste Manag. 2015, 42, 180–187. [Google Scholar] [CrossRef] [PubMed]
  13. Fontana, D.; Forte, F.; Pietrantonio, M.; Pucciarmati, S. Recent developments on recycling end-of-life flat panel displays: A comprehensive review focused on indium. Crit. Rev. Environ. Sci. Technol. 2021, 51, 429–456. [Google Scholar] [CrossRef]
  14. Gabriel, A.P.; Kasper, A.C.; Veit, H.M. Acid leaching of indium from the screens of obsolete LCD monitors. J. Environ. Chem. Eng. 2020, 8, 103758. [Google Scholar] [CrossRef]
  15. Zhang, K.; Li, B.; Wu, Y.; Wang, W.; Li, R.; Zhang, Y.N.; Zuo, T. Recycling of indium from waste LCD: A promising non-crushing leaching with the aid of ultrasonic wave. Waste Manag. 2017, 64, 236–243. [Google Scholar] [CrossRef]
  16. Pereira, E.B.; Suliman, A.L.; Tanabe, E.H.; Bertuol, D.A. Recovery of indium from liquid crystal displays of discarded mobile phones using solvent extraction. Miner. Eng. 2018, 119, 67–72. [Google Scholar] [CrossRef]
  17. Qin, J.; Ning, S.; Fujita, T.; Wei, Y.; Zhang, S.; Lu, S. Leaching of indium and tin from waste LCD by a time-efficient method assisted planetary high energy ball milling. Waste Manag. 2021, 120, 193–201. [Google Scholar] [CrossRef]
  18. Silveira, A.V.M.; Fuchs, M.S.; Pinheiro, D.K.; Tanabe, E.H.; Bertuol, D.A. Recovery of indium from LCD screens of discarded cell phones. Waste Manag. 2015, 45, 334–342. [Google Scholar] [CrossRef]
  19. Yen, F.C.; Chang, T.C.; Laohaprapanon, S.; Chen, Y.L.; You, S.J. Recovery of indium from LCD waste by solvent extraction and the supported liquid membrane with strip dispersion using D2EHPA as the extractant. Solvent Extr. Res. Dev. Jpn. 2016, 23, 63–73. [Google Scholar] [CrossRef]
  20. Savvilotidou, V.; Hahladakis, J.N.; Gidarakos, E. Leaching capacity of metals-metalloids and recovery of valuable materials from waste LCDs. Waste Manag. 2015, 45, 314–324. [Google Scholar] [CrossRef]
  21. Assefi, M.; Maroufi, S.; Nekouei, R.K.; Sahajwalla, V. Selective recovery of indium from scrap LCD panels using macroporous resins. J. Clean. Prod. 2018, 180, 814–822. [Google Scholar] [CrossRef]
  22. Lee, C.H.; Jeong, M.K.; Kilicaslan, M.F.; Lee, J.H.; Hong, H.S.; Hong, S.J. Recovery of indium from used LCD panel by a time efficient and environmentally sound method assisted HEBM. Waste Manag. 2013, 33, 730–734. [Google Scholar] [CrossRef] [PubMed]
  23. Cui, J.; Zhu, N.; Luo, D.; Li, Y.; Wu, P.; Dang, Z.; Hu, X. The Role of Oxalic Acid in the Leaching System for Recovering Indium from Waste Liquid Crystal Display Panels. ACS Sustain. Chem. Eng. 2019, 7, 3849–3857. [Google Scholar] [CrossRef]
  24. Argenta, A.B.; Reis, C.M.; Mello, G.P.; Dotto, G.L.; Tanabe, E.H.; Bertuol, D.A. Supercritical CO2 extraction of indium present in liquid crystal displays from discarded cell phones using organic acids. J. Supercrit. Fluids. 2017, 120, 95–101. [Google Scholar] [CrossRef]
  25. Li, Y.; Zhu, N.; Wei, X.; Cui, J.; Wu, P.; Li, P.; Wu, J.; Lin, Y. Leaching of indium from waste LCD screens by oxalic acid in temperature-controlled aciduric stirred reactor. Process Saf. Environ. Prot. 2020, 133, 137–148. [Google Scholar] [CrossRef]
  26. López-Yáñez, A.; Alonso, A.; Vengoechea-Pimienta, A.; Ramírez-Muñoz, J. Indium and tin recovery from waste LCD panels using citrate as a complexing agent. Waste Manag. 2019, 96, 181–189. [Google Scholar] [CrossRef] [PubMed]
  27. Dhiman, S.; Gupta, B. Cyphos IL 104 assisted extraction of indium and recycling of indium, tin and zinc from discarded LCD screen. Sep. Purif. Technol. 2020, 237, 116407. [Google Scholar] [CrossRef]
  28. Swain, B.; Mishra, C.; Hong, H.S.; Cho, S.S. Beneficiation and recovery of indium from liquid-crystal-display glass by hydrometallurgy. Waste Manag. 2016, 57, 207–214. [Google Scholar] [CrossRef]
  29. Zeng, X.; Wang, F.; Sun, X.; Li, J. Recycling Indium from Scraped Glass of Liquid Crystal Display: Process Optimizing and Mechanism Exploring. ACS Sustain. Chem. Eng. 2015, 3, 1306–1312. [Google Scholar] [CrossRef]
  30. Jowkar, M.J.; Bahaloo-Horeh, N.; Mousavi, S.M.; Pourhossein, F. Bioleaching of indium from discarded liquid crystal displays. J. Clean. Prod. 2018, 180, 417–429. [Google Scholar] [CrossRef]
  31. Sethurajan, M.; van Hullebusch, E.D.; Nancharaiah, Y.V. Biotechnology in the management and resource recovery from metal bearing solid wastes: Recent advances. J. Environ. Manag. 2018, 211, 138–153. [Google Scholar] [CrossRef]
  32. Xie, Y.; Wang, S.; Tian, X.; Che, L.; Wu, X.; Zhao, F. Leaching of indium from end-of-life LCD panels via catalysis by synergistic microbial communities. Sci. Total Environ. 2019, 655, 781–786. [Google Scholar] [CrossRef] [PubMed]
  33. Willner, J.; Fornalczyk, A.; Saternus, M.; Sedlakova-Kadukova, J.; Gajda, B. LCD panels bioleaching with pure and mixed culture of Acidithiobacillus. Physicochem. Probl. Miner. Process. 2022, 58, 15–23. [Google Scholar] [CrossRef]
  34. Cui, J.; Zhu, N.; Mao, F.; Wu, P.; Dang, Z. Bioleaching of indium from waste LCD panels by Aspergillus niger: Method optimization and mechanism analysis. Sci. Total Environ. 2021, 790, 148151. [Google Scholar] [CrossRef] [PubMed]
  35. Ruello, M.L.; Amato, A.; Beolchini, F.; Monosi, S. Valorizing end-of-life LCD scraps after indium recovery. Phys. Status Solidi 2016, 13, 1011–1016. [Google Scholar] [CrossRef]
  36. European Commission. European Platform on Life Cycle Assessment. Available online: https://eplca.jrc.ec.europa.eu/ (accessed on 24 September 2024).
  37. Moskalyk, R.R.; Alfantazi, A.M. Processing of vanadium: A review. Miner. Eng. 2003, 16, 793–805. [Google Scholar] [CrossRef]
  38. Ghisellini, P.; Passaro, R.; Ulgiati, S. Environmental and Social Life Cycle Assessment of Waste Electrical and Electronic Equipment Management in Italy According to EU Directives. Environment 2023, 10, 106. [Google Scholar] [CrossRef]
  39. Eynard, U.; Mancini, L.; Eisfeldt, F.; Ciroth, A.; Pennington, D. Social risk in raw materials extraction: A macro-scale assessment. In Proceedings of the 6th Social LCA Conference, People and Places for Partnership, Pescara, Itlaly, 10–12 September 2018. [Google Scholar]
  40. Amato, A.; Rocchetti, L.; Beolchini, F. Environmental impact assessment of different end-of-life LCD management strategies. Waste Manag. 2017, 59, 432–441. [Google Scholar] [CrossRef]
  41. Umair, S.; Björklund, A.; Petersen, E.E. Social impact assessment of informal recycling of electronic ICT waste in Pakistan using UNEP SETAC guidelines. Resour. Conserv. Recycl. 2015, 95, 46–57. [Google Scholar] [CrossRef]
  42. Abeliotis, K.; Chroni, C.; Lasaridi, K. Social Life Cycle Assessment for WEEE Reuse. In Proceedings of the XI Convegno della Rete Italiana LCA Resource Efficiency e Sustainable Development Goals: Il Ruolo del Life Cycle Thinking, Siena, Italy, 22–23 June 2017; Volume 2017. Available online: http://uest.ntua.gr/athens2017/proceedings/pdfs/Athens2017_Abeliotis_Chroni_Lasaridi.pdf (accessed on 24 September 2024).
  43. The London Metals Exchange, an HKEX Company. Available online: https://www.lme.com/en/ (accessed on 25 September 2024).
  44. Wang, F.; Li, Y.; Liu, M.; Pang, D.; Du, W.; Zhang, Y.; Cheng, X.; Gu, T.; Guo, W. Comprehensive Evaluation of the Performances of Heat Exchangers with Aluminum and Copper Finned Tubes. Int. J. Chem. Eng. 2023, 2023, 6666947. [Google Scholar] [CrossRef]
  45. Savvilotidou, V.; Kousaiti, A.; Batinic, B.; Vaccari, M.; Kastanaki, E.; Karagianni, K.; Gidarakos, E. Evaluation and comparison of pre-treatment techniques for recovering indium from discarded liquid crystal displays. Waste Manag. 2019, 87, 51–61. [Google Scholar] [CrossRef]
  46. Marra, A.; Cesaro, A.; Belgiorno, V. Hydrometallurgical recovery of critical metals from WEEE shredding dust. In Proceedings of the 15th International Conference on Environmental Science and Technology, Rhodes, Greece, 21–23 November 2017. [Google Scholar]
  47. Chancerel, P.; Meskers, C.E.M.; Hagelüken, C.; Rotter, V.S. Assessment of precious metal flows during preprocessing of waste electrical and electronic equipment. J. Ind. Ecol. 2009, 13, 791–810. [Google Scholar] [CrossRef]
  48. Yang, J.; Retegan, T.; Ekberg, C. Indium recovery from discarded LCD panel glass by solvent extraction. Hydrometallurgy 2013, 137, 68–77. [Google Scholar] [CrossRef]
  49. Ardente, F.; Mathieux, F.; Recchioni, M. Recycling of electronic displays: Analysis of pre-processing and potential ecodesign improvements. Resour. Conserv. Recycl. 2014, 92, 158–171. [Google Scholar] [CrossRef]
  50. Forti, V.; Baldè, C.P.; Kuehr, R.; Bel, G.; Monitor, T.G.E.-W. 2020: Quantities, Flows and the Circular Economy Potential; United Nations University (UNU): Tokyo, Japan; United Nations Institute for Training and Research: Geneva, Switzerland, 2020. [Google Scholar]
  51. Vučinić, A.A.; Šimunić, S.; Radetić, L.; Presečki, I. Indium Recycling from Waste Liquid Crystal Displays: Is It Possible? Processes 2023, 11, 1662. [Google Scholar] [CrossRef]
  52. Ferella, F.; Belardi, G.; Marsilii, A.; De Michelis, I.; Vegliò, F. Separation and recovery of glass, plastic and indium from spent LCD panels. Waste Manag. 2017, 60, 569–581. [Google Scholar] [CrossRef]
  53. Song, Q.; Liu, Y.; Zhang, L.; Xu, Z. Facile indium recovery from waste liquid crystal displays: Chloride-facilitated indium electroreduction and stepwise Cu/MoO2 and indium electrodeposition. J. Hazard. Mater. 2021, 415, 125599. [Google Scholar] [CrossRef]
  54. Song, Q.; Zhang, L.; Xu, Z. Indium recovery from In-Sn-Cu-Al mixed system of waste liquid crystal display panels via acid leaching and two-step electrodeposition. J. Hazard. Mater. 2020, 381, 120973. [Google Scholar] [CrossRef]
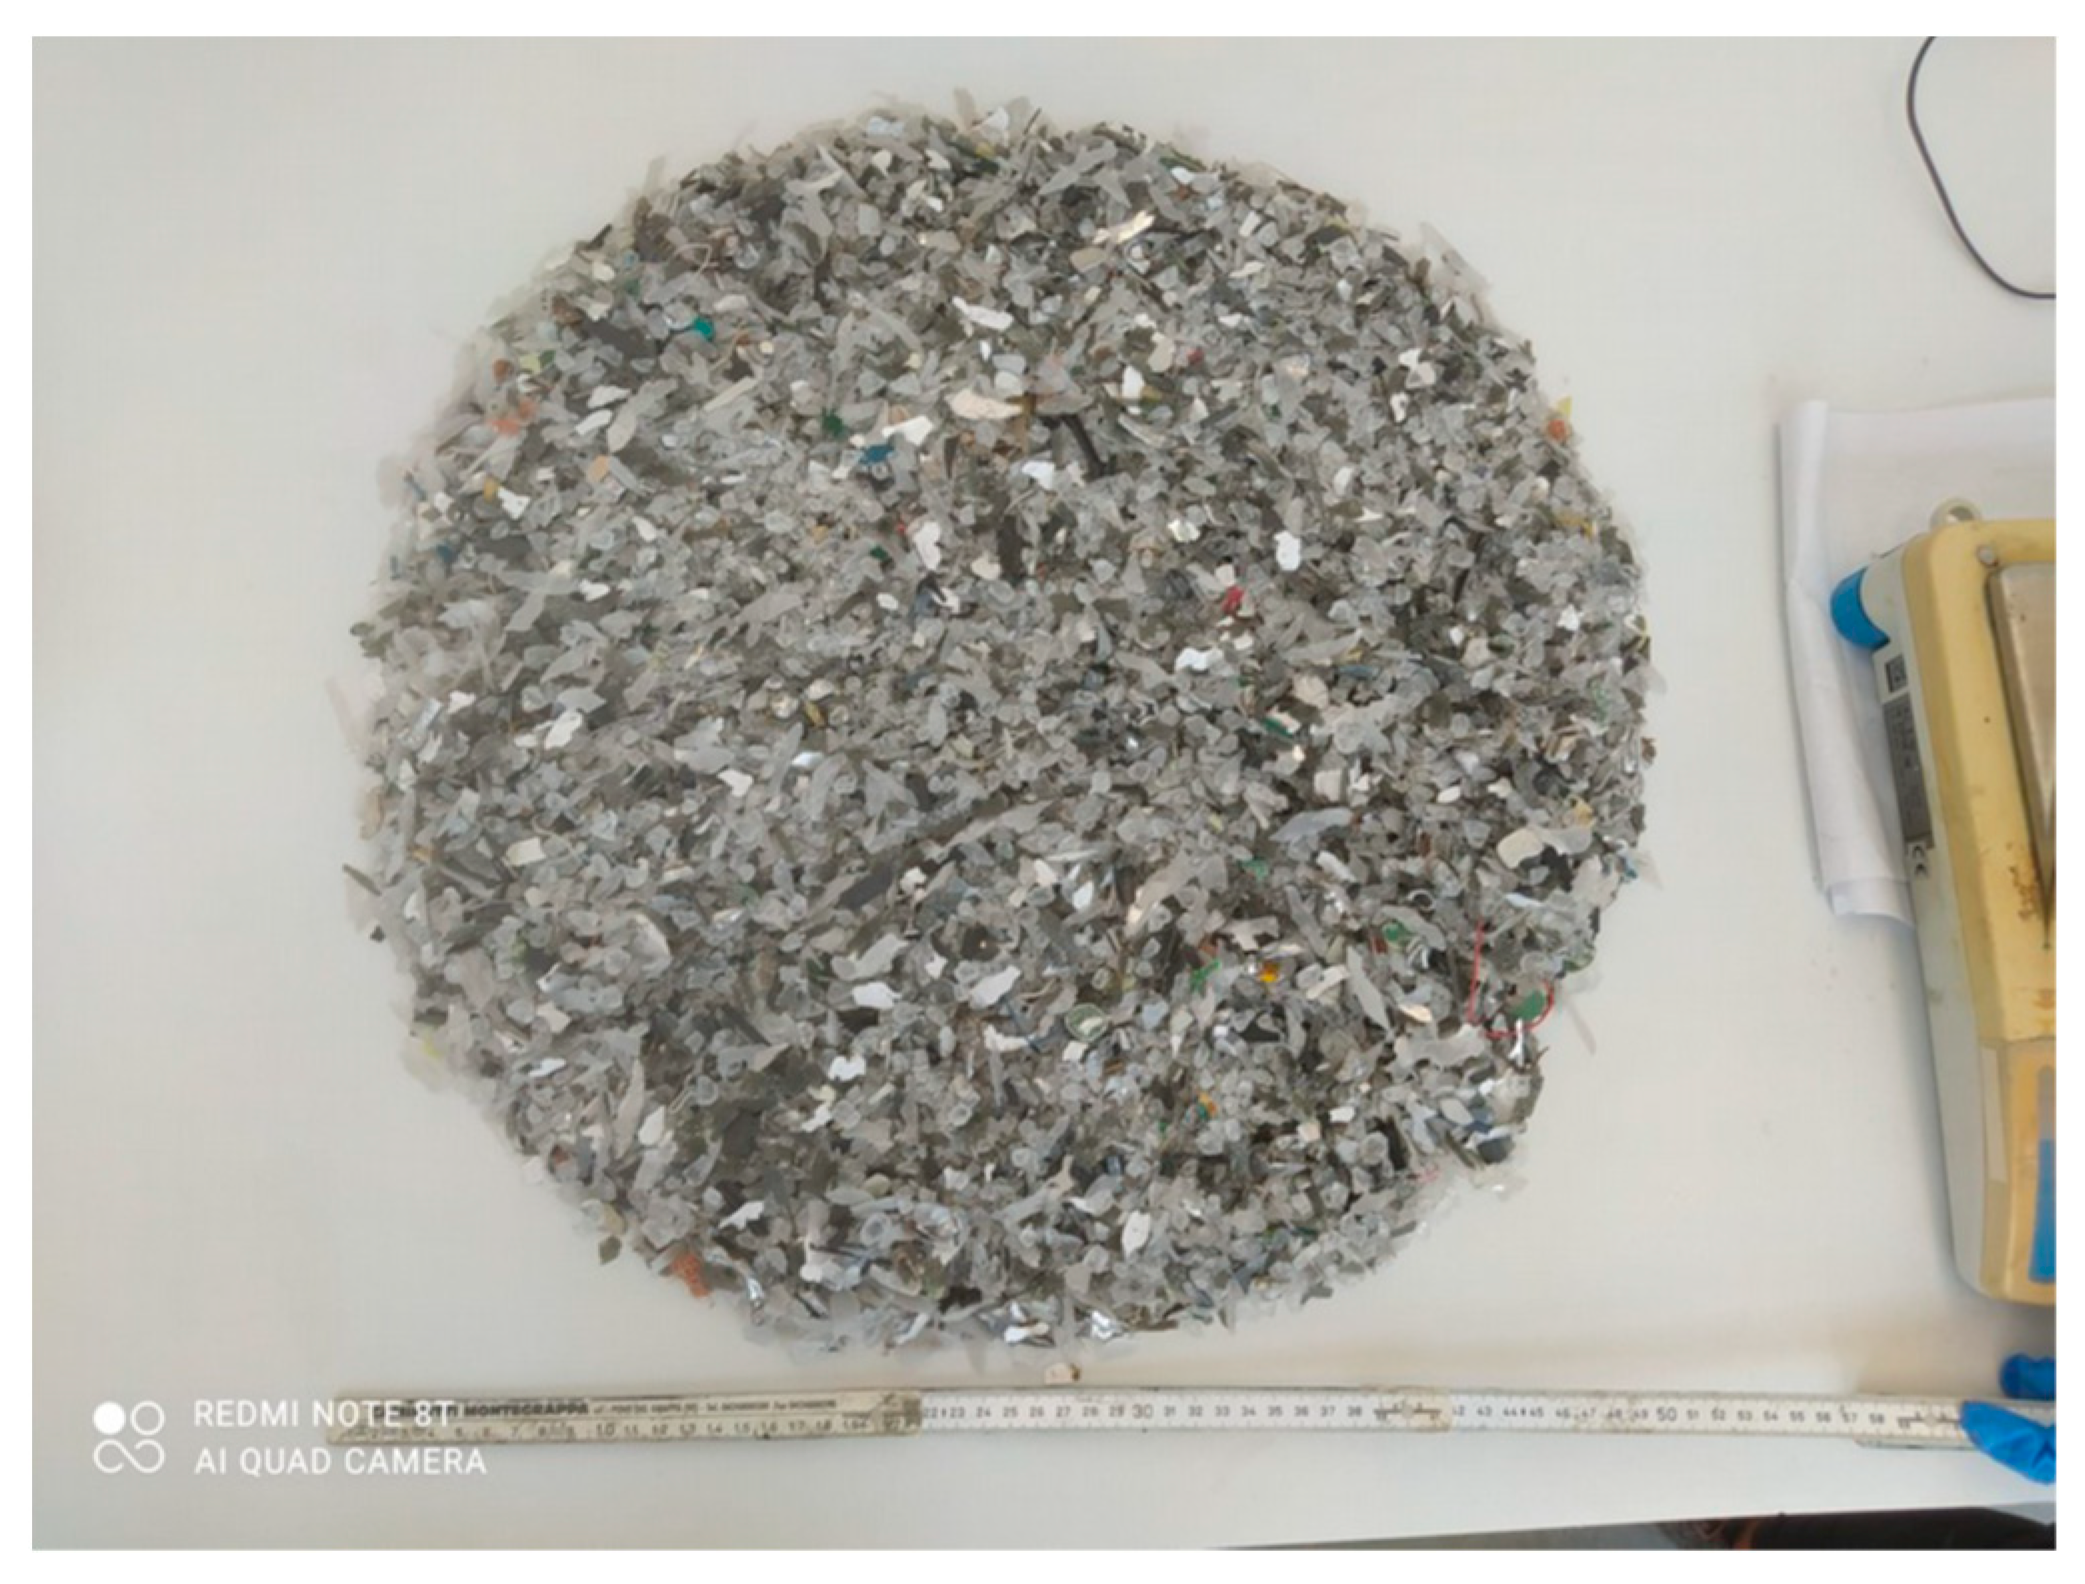
Figure 1. Waste supplied by a SME recycler in Central Italy.
Sustainability 16 08917 g001
Figure 2. Schematic representation of the leaching and cementation process and the related photo.
Sustainability 16 08917 g002
Figure 3. Schematic representation of the filter apparatus and the related photo.
Sustainability 16 08917 g003
Figure 4. System boundaries considered for the LCA (Functional unit, a whole treatment of end-of-life LCD in the 5 L reactor). The red quantities are referred to scenario 1, green quantities to scenario 2, blue quantities are common to both scenarios.
Sustainability 16 08917 g004
Figure 5. Schematic representation of the whole patent IT201800008207A1 process. The red box includes the process steps.
Sustainability 16 08917 g005
Figure 6. Metal concentrations (a) and extraction efficiencies (b) after each step during the bench scale cross-current leaching, using the finest fraction (<1 mm) (5 L leaching volume, 20% solid).
Sustainability 16 08917 g006
Figure 7. Metal recovery efficiencies observed in cementation treatments.
Sustainability 16 08917 g007
Figure 8. Results of classification and characterization steps (functional unit: a whole treatment of end-of-life LCDs in the bench scale reactor).
Sustainability 16 08917 g008aSustainability 16 08917 g008bSustainability 16 08917 g008c
Figure 9. Results of normalization and weighing steps (functional unit: a whole treatment of end-of-life LCD in the bench scale reactor). Pie charts report the percentage of impact categories mainly affected (environmental loads) and saved (environmental credits) in each scenario.
Sustainability 16 08917 g009
Figure 10. Metal concentrations ((a) Fe, (b) Al, (c) In, and (d) Ca) during the 3-step cross-current leaching process for the four tested recirculation cycles.
Sustainability 16 08917 g010
Figure 11. Metal concentrations ((a) Fe, (b) Al, (c) In, and (d) Ca) in the solution after treated LCD washing.
Sustainability 16 08917 g011
Figure 12. Metal recovery efficiencies (a) and NaOH concentration in the pH adjustment step (b).
Sustainability 16 08917 g012
Figure 13. Cementation efficiencies (a) and amount of Zn (b) used in cementation for In recovery.
Sustainability 16 08917 g013
Figure 14. Distribution of operative costs for the process (1 m3 reactor, four steps of cross-current leaching).
Sustainability 16 08917 g014
Figure 15. Process profit (EUR/year) vs. indium concentration in the feed material (plant capacity 160 t/y).
Sustainability 16 08917 g015
Table 1. Unitary costs considered for economic estimation.
FlowUnitary Cost (EUR/kg)
Electricity (EUR/kWh)0.1
NaOH1
H2SO40.5
Zn10
Wastewater treatment and disposal0.1
Solid waste disposal0.25
In400
Table 2. Chemical characterization of three representative fractions of the crushed LCD panel.
<11 < Ø < 5>5
S1
Sustainability 16 08917 i001Sustainability 16 08917 i002Sustainability 16 08917 i003
WasteDimension
(mm)
Metal Conc. (mg/kg)
InGa
S1 <1160 ± 306 ± 1
1 < Ø < 517 ± 56 ± 3
>52.5 ± 0.514 ± 2
Table 3. Summary of indium content in LCD panels (mg/kg) from literature data.
Indium ContentOther MetalsReference
100Al, Ca, Fe, Mn, Mo, and Sn[12]
261Sn[22]
576Si, Al, B, Ca, Sr, Fe, Mg, Ba, Sn, Cr, Na, K, and Cu[23]
120Al, Fe, In, Ca, Mg, Sr, and Mo[15]
30n.a. a[21]
n.a. aSn, Cu, Pb, and Al[33]
219Sn[10]
a Not available.
Disclaimer/Publisher’s Note: The statements, opinions and data contained in all publications are solely those of the individual author(s) and contributor(s) and not of MDPI and/or the editor(s). MDPI and/or the editor(s) disclaim responsibility for any injury to people or property resulting from any ideas, methods, instructions or products referred to in the content.