Abstract
The environmental influence of seasonal freezing and thawing forces the longitudinal shear effect of the bridge abutment, and the differential settlement between the subgrade and the bridge abutment will significantly affect traffic safety. In this work, based on the finite element simulation analysis method, the longitudinal push-out effect and differential settlement of the transition section caused by cycles are systematically investigated, and the treatment results under different control measures (buffer layer thickness) are compared and analyzed. The results show that changing the thickness of the buffer material in the transition section has no significant influence on the overall temperature field of the subsurface. The longitudinal displacement of the transition region will be obvious under the condition of seasonal cycle, and its longitudinal thrust effect on the abutment shows a typical periodic law with the seasonal change. As the depth of the lower soil layer from the surface increases, the pushing effect becomes weaker and weaker. The development of the different subsoil settlements in the transition section also showed periodic changes with the passage of seasons. The differential settlement of the transition section after the buffer layer treatment can be effectively controlled, and the maximum value of the surface settlement of the roadbed after the 5 cm thick buffer material is reduced by 35%, compared with the two deformations of frostshocked bridges, where differential settlement after the buffer material treatment creates only tip deformation. After using a 15 cm thick buffer layer material treatment, the maximum settlement value of the surface settlement of the road base is reduced from 0.2 m to 0.01 m, which will not affect safety and driving comfort. The research conclusions can provide a reference for the design of road and bridge transition sections in frozen areas.
1. Introduction
Various natural disasters have long hampered the sustainable development of many traffic projects [1,2,3,4,5,6,7,8,9,10]. Among them, in recent years, diseases have frequently occurred due to the horizontal longitudinal force caused by frost heaving of the background of the platform back subgrade and the uneven settlement of the pier foundation. The survey results of 447 bridges in the permafrost area show that there are obviously 161 bridgeheads with subsoil subsidence, with the majority of the subsidence being 20 to 30 cm, and the large subsidence being more than 1.0 m [11,12]. Affected by the uneven heat transport of different structures, subgrade fillers and foundation soil in the transition section of railway bridges in cold areas, the disease level of the bridgehead subgrade is much higher than that of the ordinary subgrades, which has become one of the main hidden dangers affecting the safe operation and future sustainable development of the railway in the permafrost area. Due to seasonal frost heave thawing and other reasons, the frost heave of the packing of the transition section of the railway road and bridge in the alpineproduces a pushing effect, which causes a chain reaction of the deformation and displacement of the pier girder, which has a great impact on the smoothness of the line and also poses major challenges to the normal operation and safety maintenance of rail transit in the cold area.
To ensure the sustainable use of bridges, experts and scientists from home and abroad have carried out relevant research work on the settlement and deformation of the transition section of railway roads and bridges in cold areas. Based on the research results of Penner [13], Williams [14], and Miller [15,16] on heat flux and mass flow in permafrost, Harlan [17] proposed a numerical solution to the problem of permafrost heat and mass transfer, which put forward the foundation for the study of the permafrost temperature field. In terms of the theoretical study of permafrost regions, Tian Qunshan [18] used numerical simulation to analyze the horizontal frost heave force of the transition section of the road and bridge using numerical simulations, and studied the mechanism and characteristics of the frost heave force. Xia Lijiang [19] analyzed the radiation of solar energy on the surface of the railway abutment in the cold region, and studied the heating system of the abutment. Niu Fujun [20] analyzed the freezing characteristics and spatiotemporal variation process of the subgrade soil in the transition section behind the platform, and provided a reference for the treatment of the subgrade at the bridgehead and the selection and laying method of the subgrade filler in the transition section of the culvert. Zhou Youlu and Niu Fujun [11,12] considered the special engineering conditions of railways in cold regions, classified the types of underground diseases in permafrost areas since the operation of the QinghaiTibet Railway, and predicted the thermal stability trend of underground engineering in permafrost areas. In addition, scholars at home and abroad [21,22,23,24,25,26,27,28,29,30,31,32] have also carried out systematic research on the differential settlement of road and bridge transition sections, and have achieved certain results, but there are relatively few studies on the longitudinal pushing effect of subgrade fillers in the transition section. In fact, the longitudinal pushing effect of subgrade fillers on the bridge abutment is a key issue that cannot be ignored in engineering construction and operation and maintenance. Only by solving this problem can the abutment be used safely and sustainably for a long time.
In view of the above, this paper uses numerical simulation research methods to systematically study the longitudinal push-out effect of the transition section of the road and bridge induced by freezing and thawing, and proposes corresponding technical measures. This paper compares the effects of buffer materials of different thicknesses on the longitudinal displacement effect and differential settlement of the transition section, in order to provide a reference for the design, operation, maintenance, and sustainable development of the transition section of the road and bridge in traffic engineering in cold areas.
2. Overview of Engineering Site Monitoring
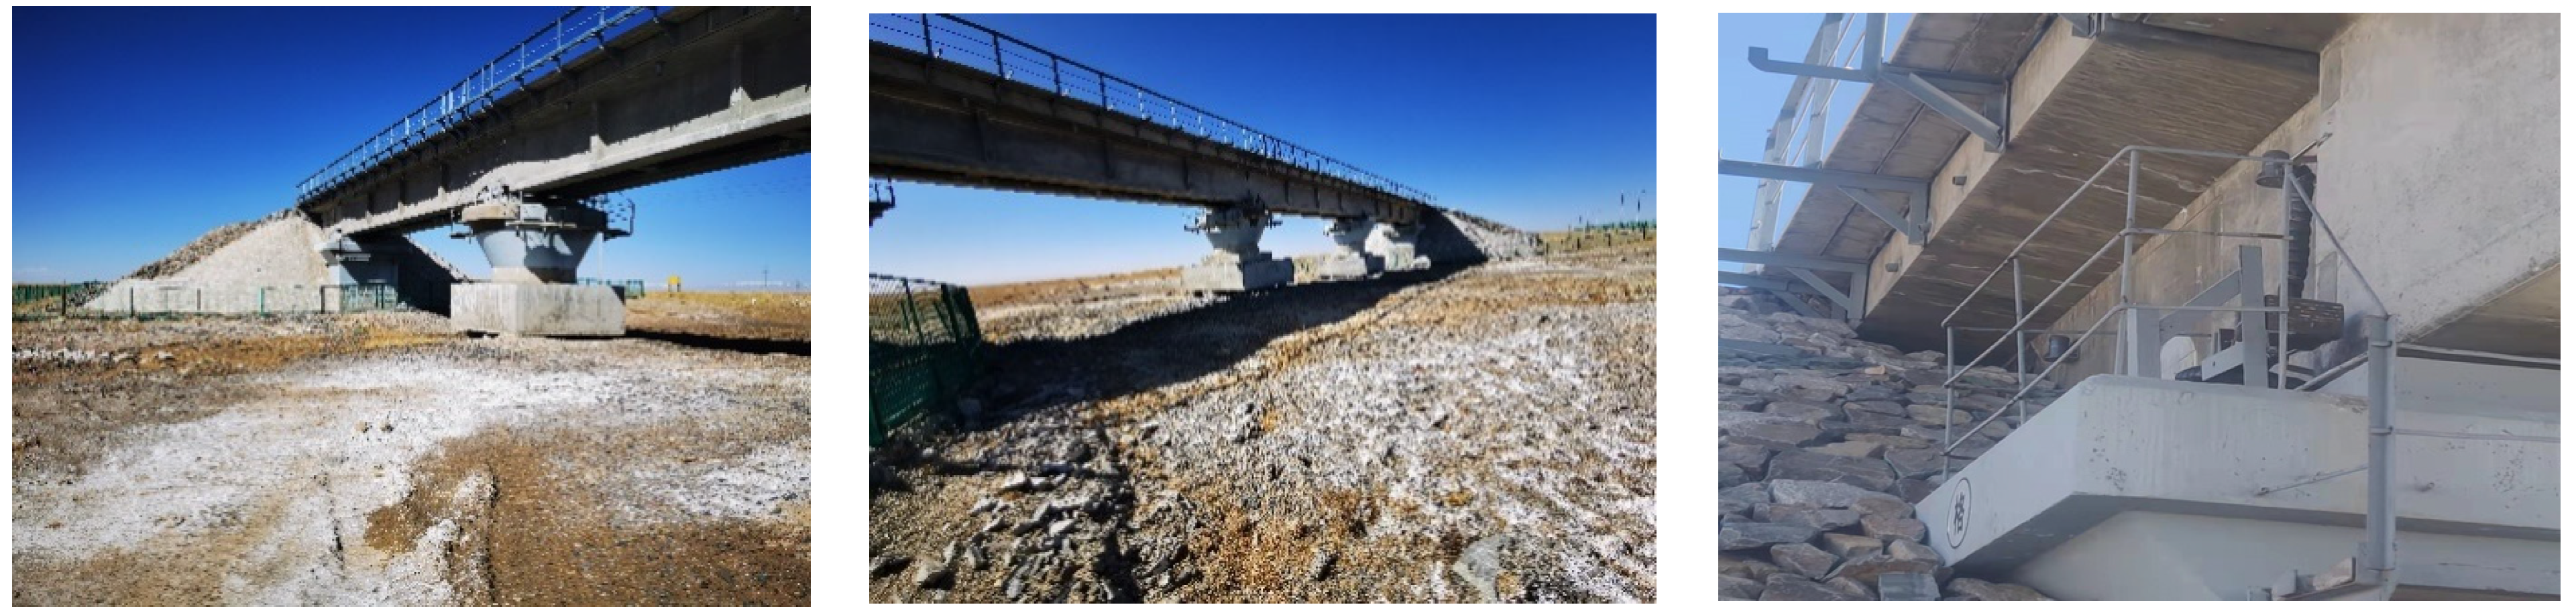
The general situation of the construction site is shown in Figure 1. The corresponding bridge No. 537 has a span style of “3–16 m general concrete T beam” with a total length of 60.04 m. There are water accumulation conditions on the surface of the grid station and the height of the retaining wall is about 0.7 m. The roadbed of the transition section is equipped with hot rod and chip slope protection.
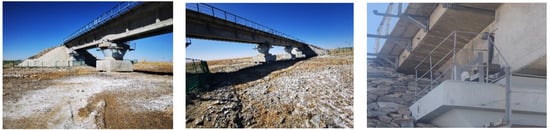
Figure 1.
K1013 + 358 grid station overview.
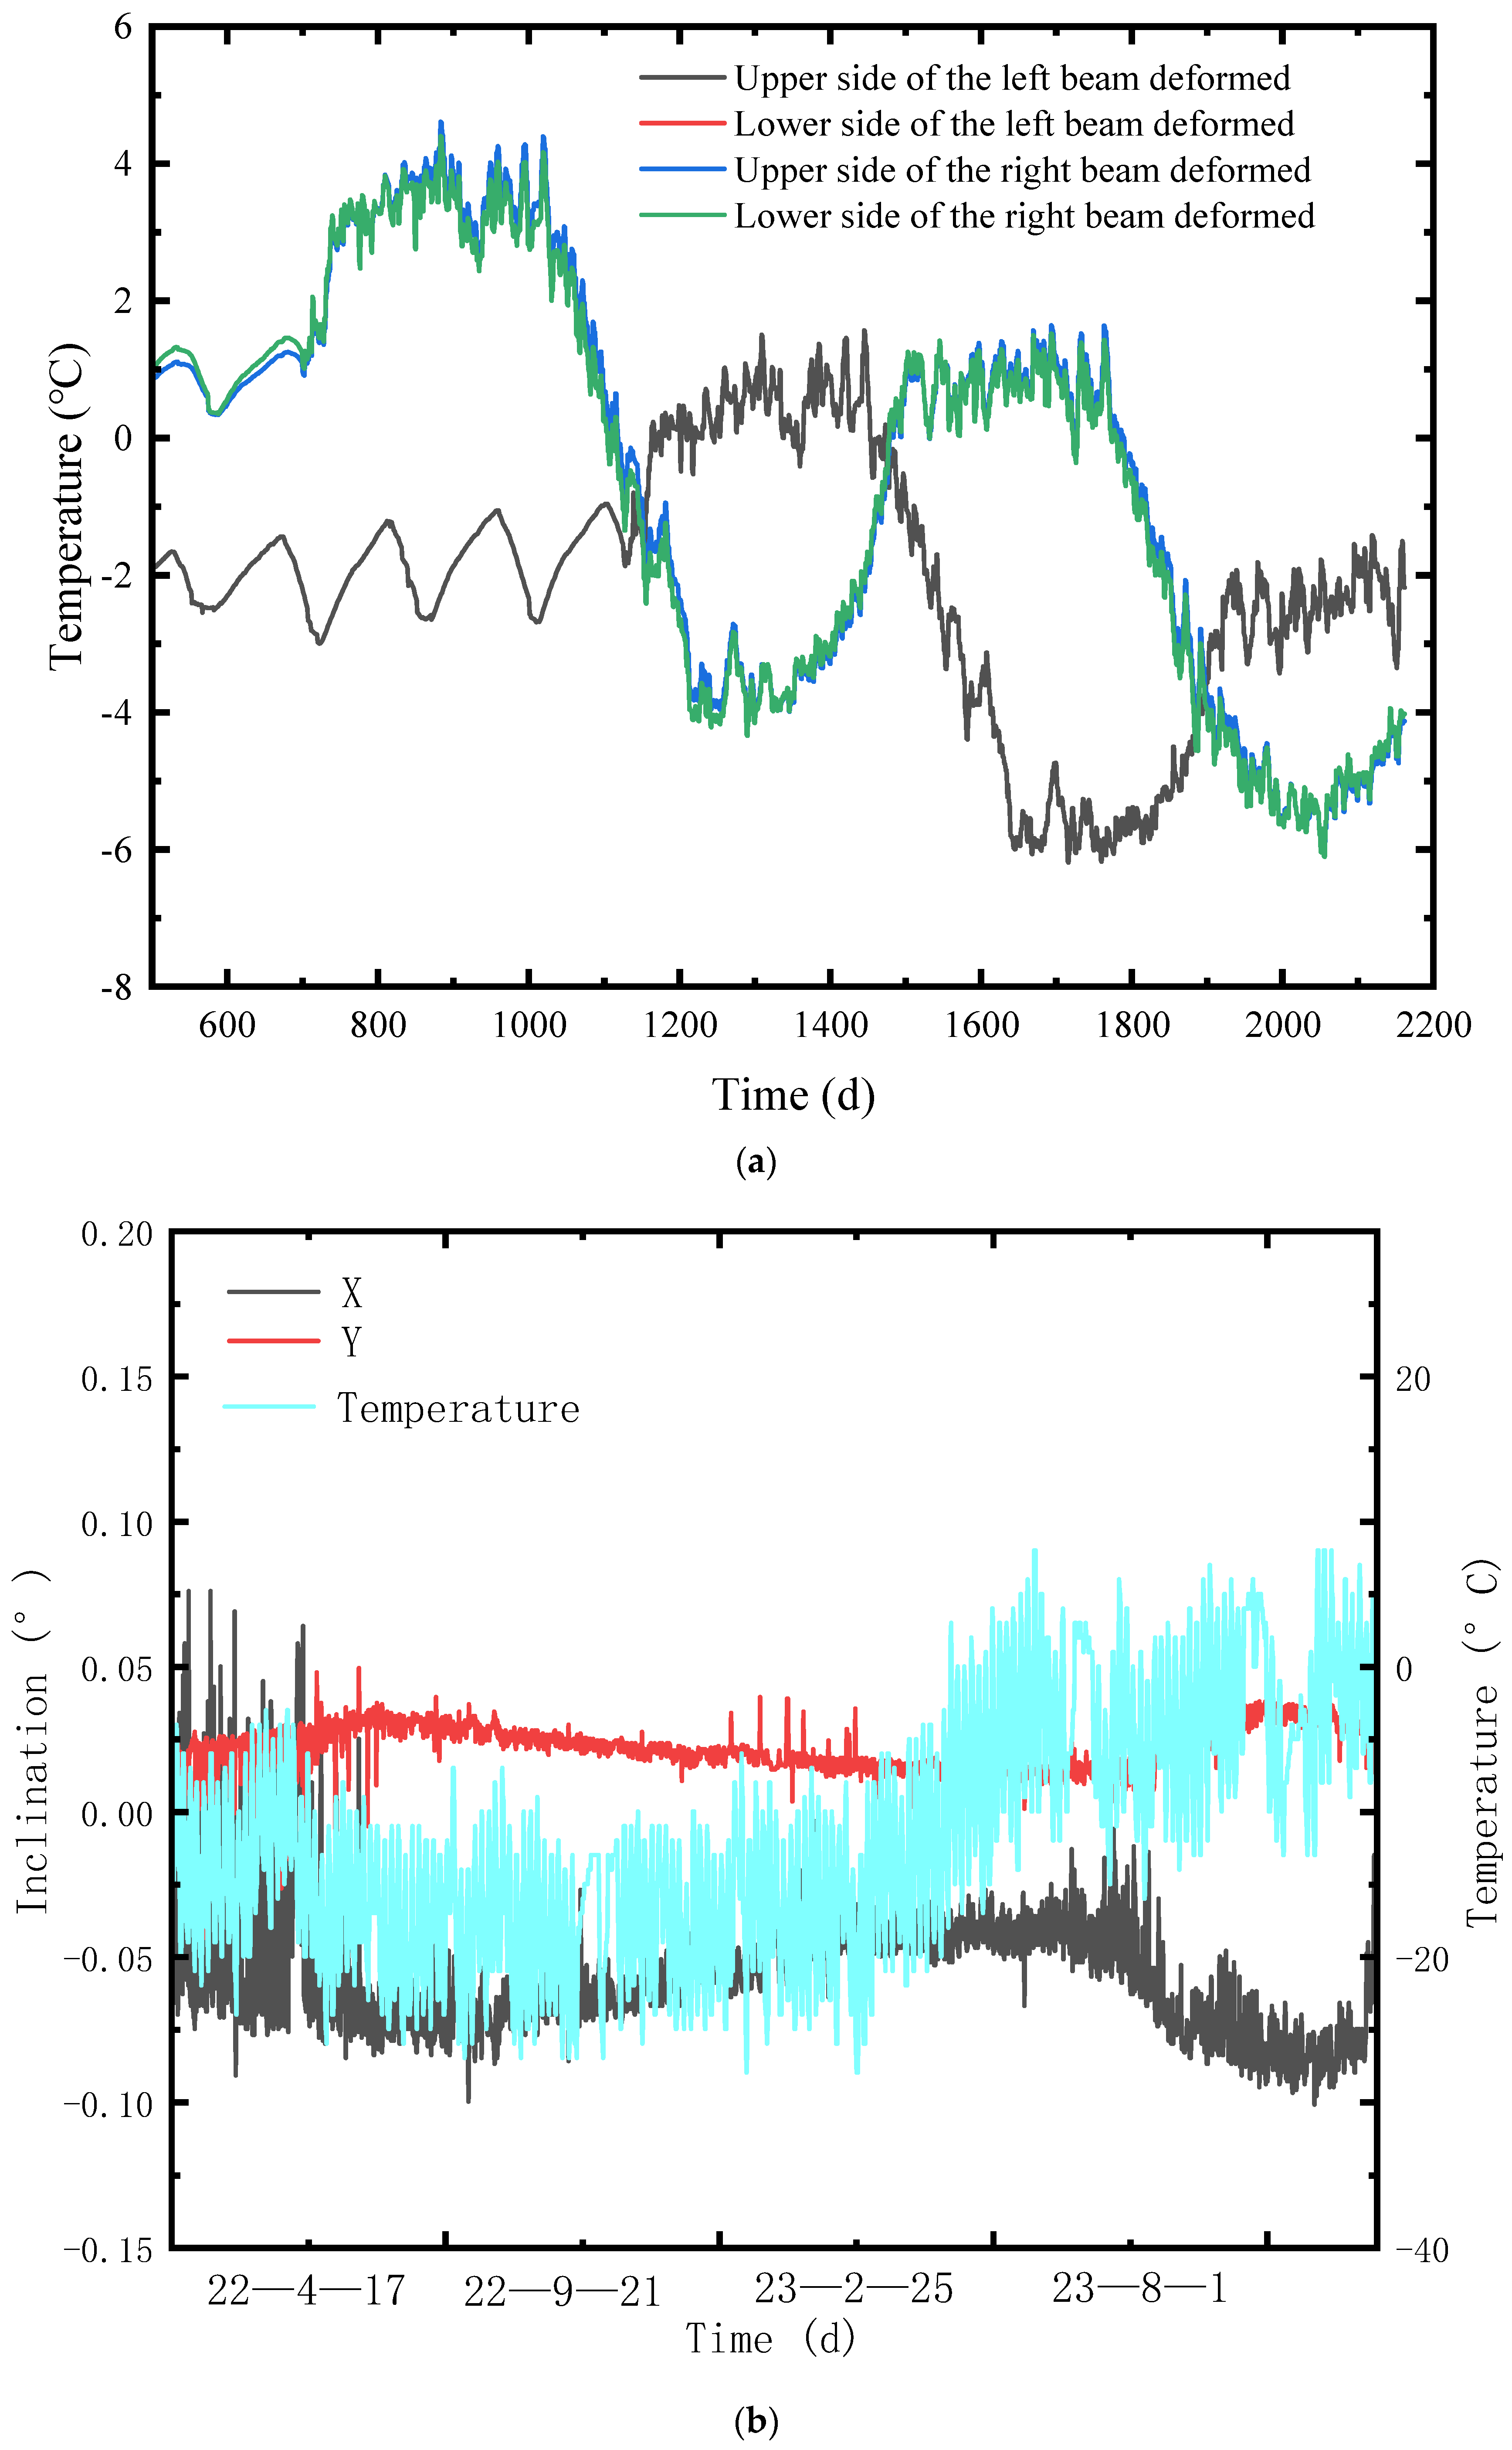
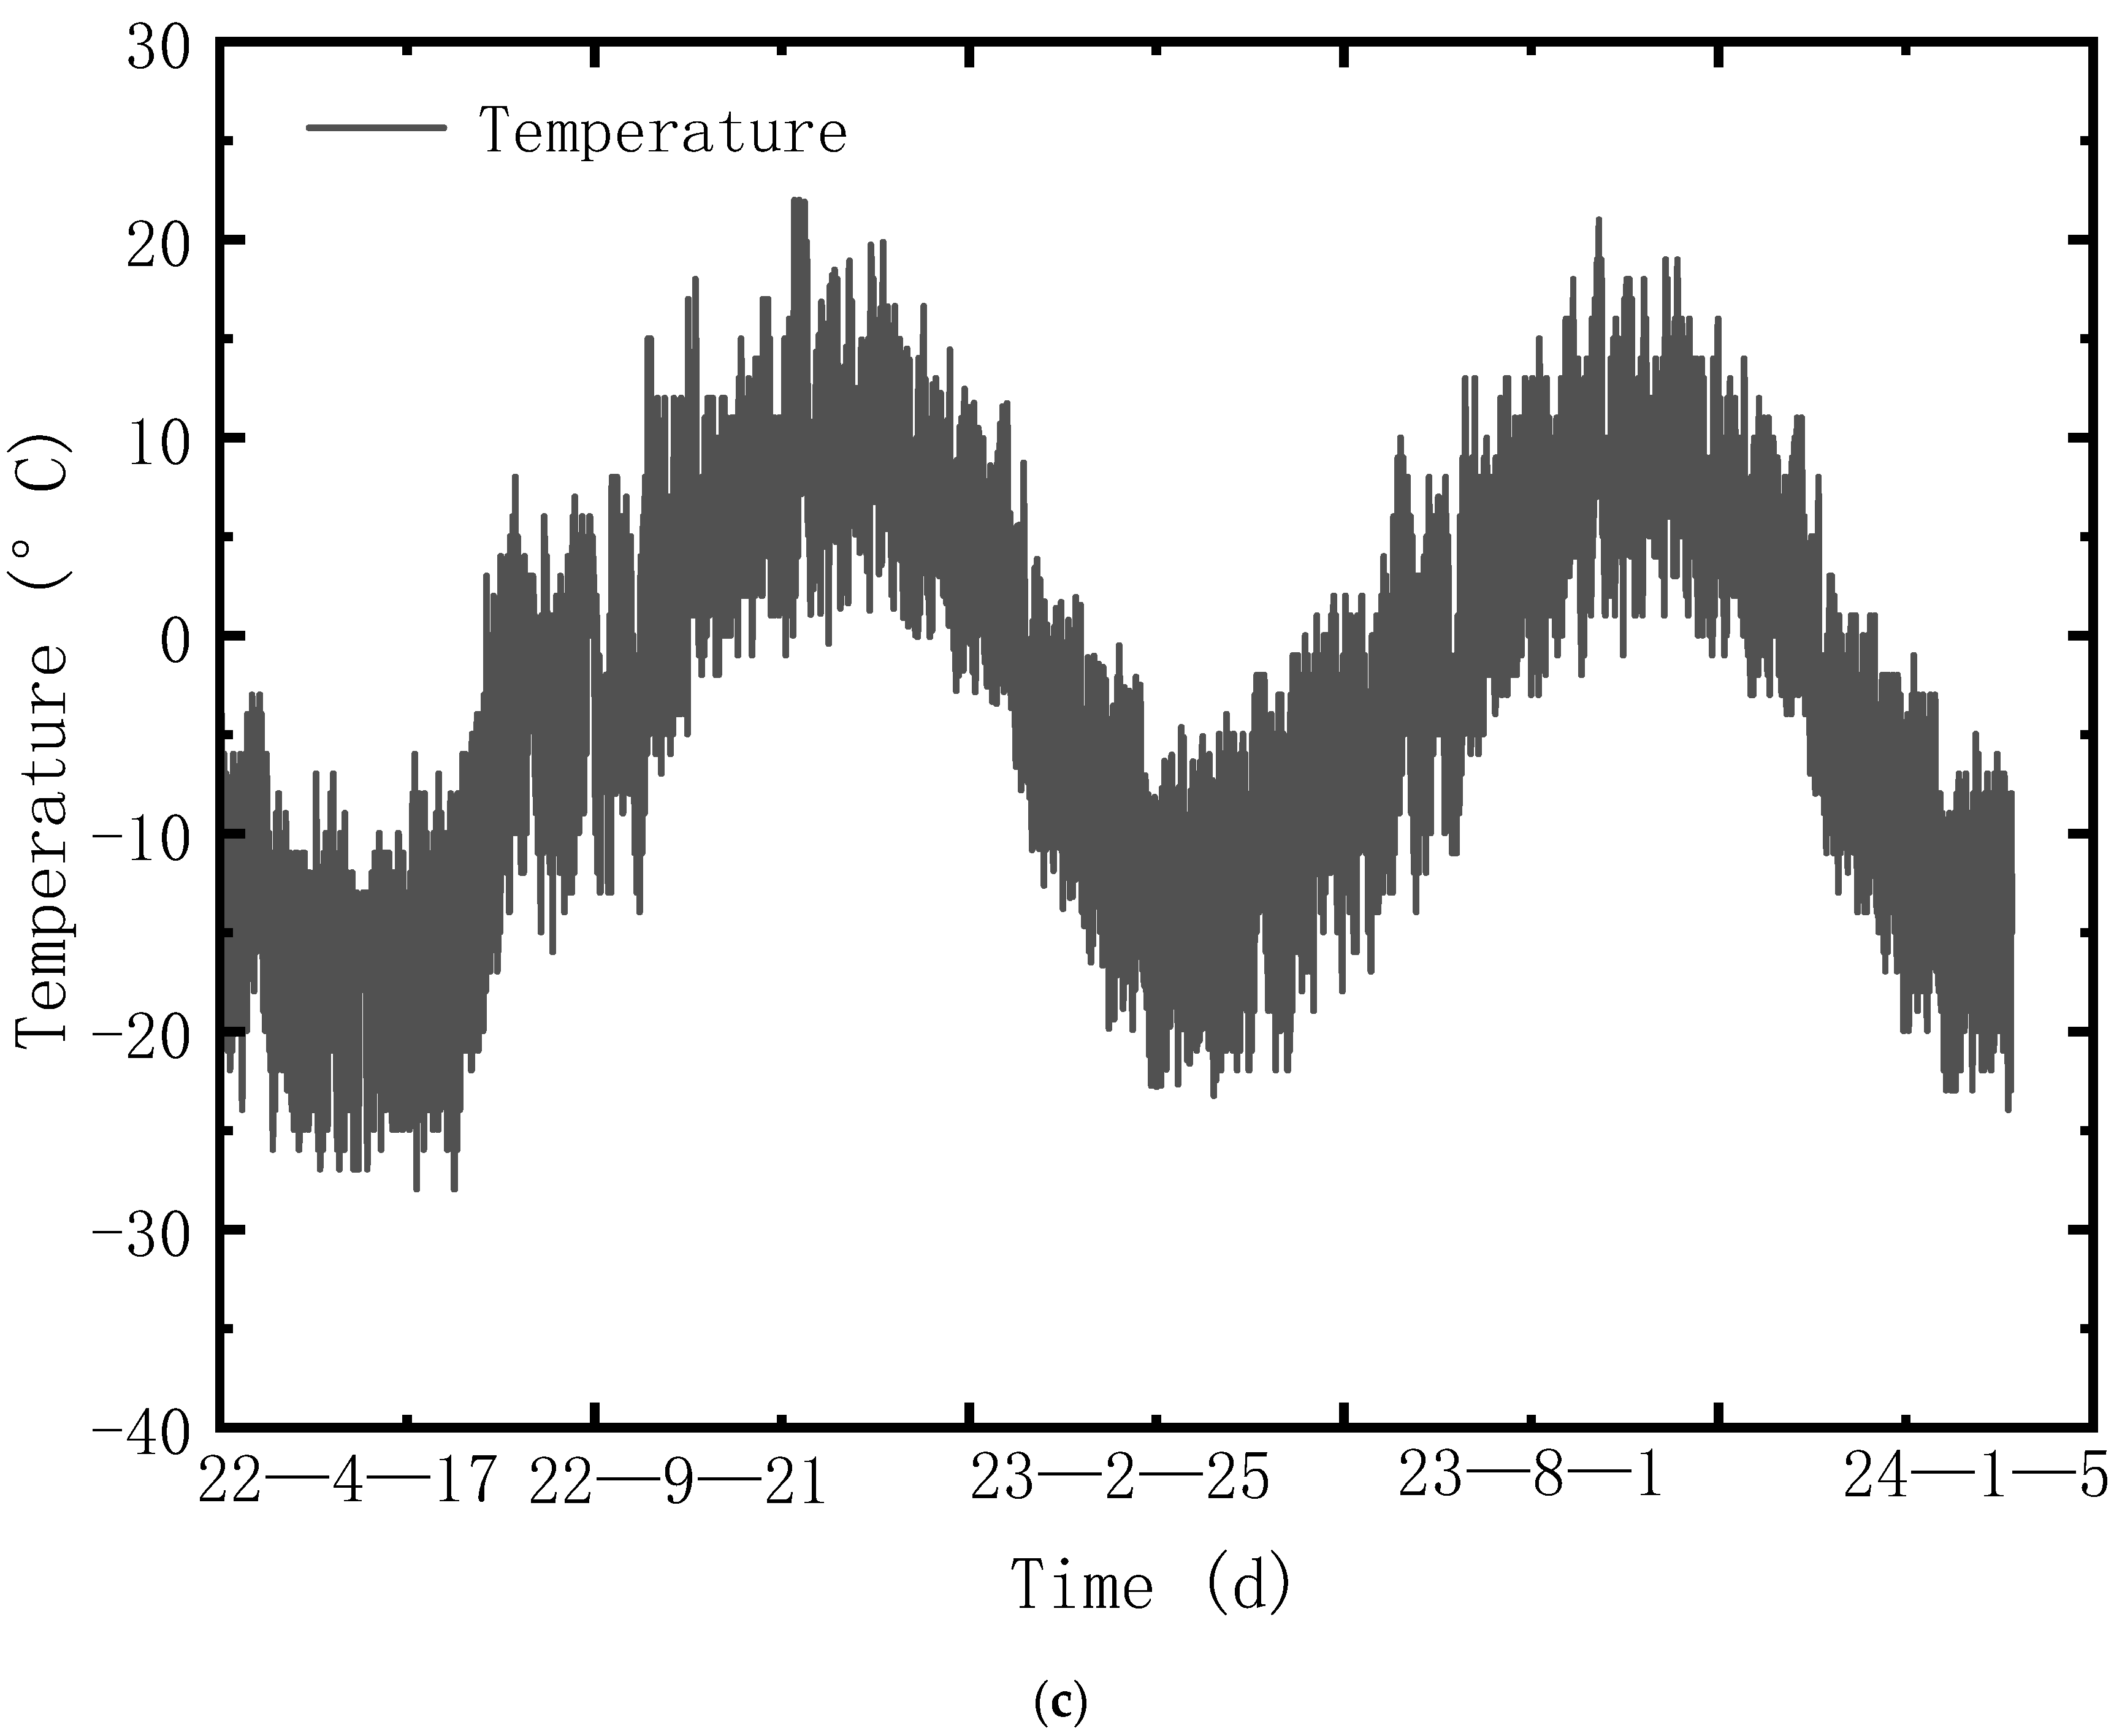
As shown in Figure 2, the monitoring results showed that the beam-joint space had a decreasing trend, and the beam joint on both sides decreased by about 1 cm between January 2019 and November 2020. With the continuous decrease of temperature, the relative deformation of the joint between the grid beam end and the abutment beam first increased and remained stable for a period of time, and the maximum relative deformation was 4.2 mm on the upper part of the right beam seam. With the increase of temperature, the relative deformation of the beam connection gradually decreases, and the minimum relative deformation is located at the lower part of the right beam joint, which is 7.9 mm. After two winter and summer cycles, the reduced relative deformation in summer is greater than the increased relative deformation in winter, and the joint spacing in 2023 is further reduced compared to that in 2022. The reason for the above phenomenon is that the cooling rate of the concrete beam body is obviously faster than that of the subgrade behind the platform, and the concrete beam body shrinks in advance, resulting in the relative deformation of the beam end-abutment connection. As the temperature continues to remain below zero and the ground temperature of the subgrade behind the platform gradually drops to below zero, there is a certain possibility of frost heave deformation, which may have a horizontal extrusion effect on the abutment. In the relative deformation of the beam joint of this abutment, it can be seen that the abutment has a certain horizontal displacement. After the temperature rise in late May 2022, the deformation of the beam itself gradually begins to recover. The relative deformation becomes smaller gradually, which is because the horizontal displacement caused by frost heave extrusion behind the abutment cannot be recompensated at low temperatures. According to the temperature−time history curve of the K1013 + 358 bridge, the temperature in November 2021 has entered temperatures below zero. From March 2022, the daytime temperature gradually rises above zero, and by the beginning of June, the temperature will be virtually above zero. The overall minimum temperature is below −27 °C, and the maximum temperature is above 20 °C.

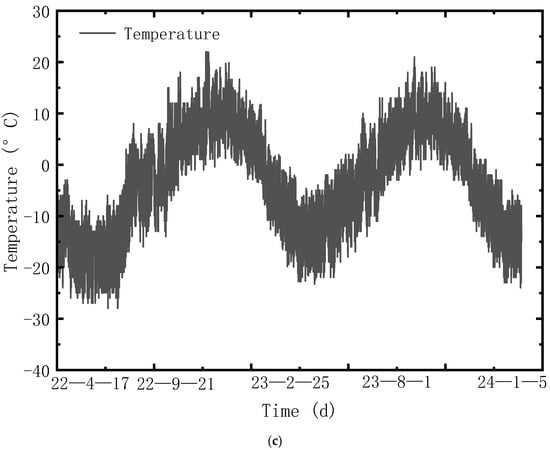
Figure 2.
Results of on-site monitoring. (a) Artificial observation results of beam-joint deformation of K1013 + 358 lattice platform. (b) The change of inclination angle of small mileage position on the right side of K1013 + 358 bridge platform. (c) Temperature curve of K1013+ 358 bridge.
In addition, we also monitored the inclination changes of the K1013 + 358 bridge platform. In general, in the process of continuous temperature decline, the K1013 + 358 bridge platform has a slight inclination angle, which is relatively consistent in the longitudinal direction of the line, and the longitudinal angles are about −0.08° and −0.05°, respectively. According to the calculation of the abutment height 6 m, when the abutment rotates around the pier bottom, there will be a horizontal displacement of 2.6~4.2 mm at the abutment, which is comparable to the change of the relative deformation value of the beam joint. This checks whether there is a certain longitudinal horizontal displacement at the abutment.
The monitoring results of the subgrade settlement behind the K1013 + 358 bridge platform show that the subgrade behind the platform continues to settle, and the subgrade has settled 1–5 mm behind the platform from November 2022 to December 2023.
3. Establishing the Frost Heave Model of Packing for the Road and Bridge Transition Section
3.1. Basic Information About the Temperature Field Model
In view of this, this paper selects the Harbin–Dalian high-speed railway, which has rich research results, as the engineering background, and uses numerical simulations to establish the numerical models of subgrade temperature fields and frost heave deformation, respectively, and verifies the reliability of the corresponding numerical modeling methods, which lays a foundation for the subsequent use of the same modeling methods to establish and further explore the change law of temperature fields in the transition section.
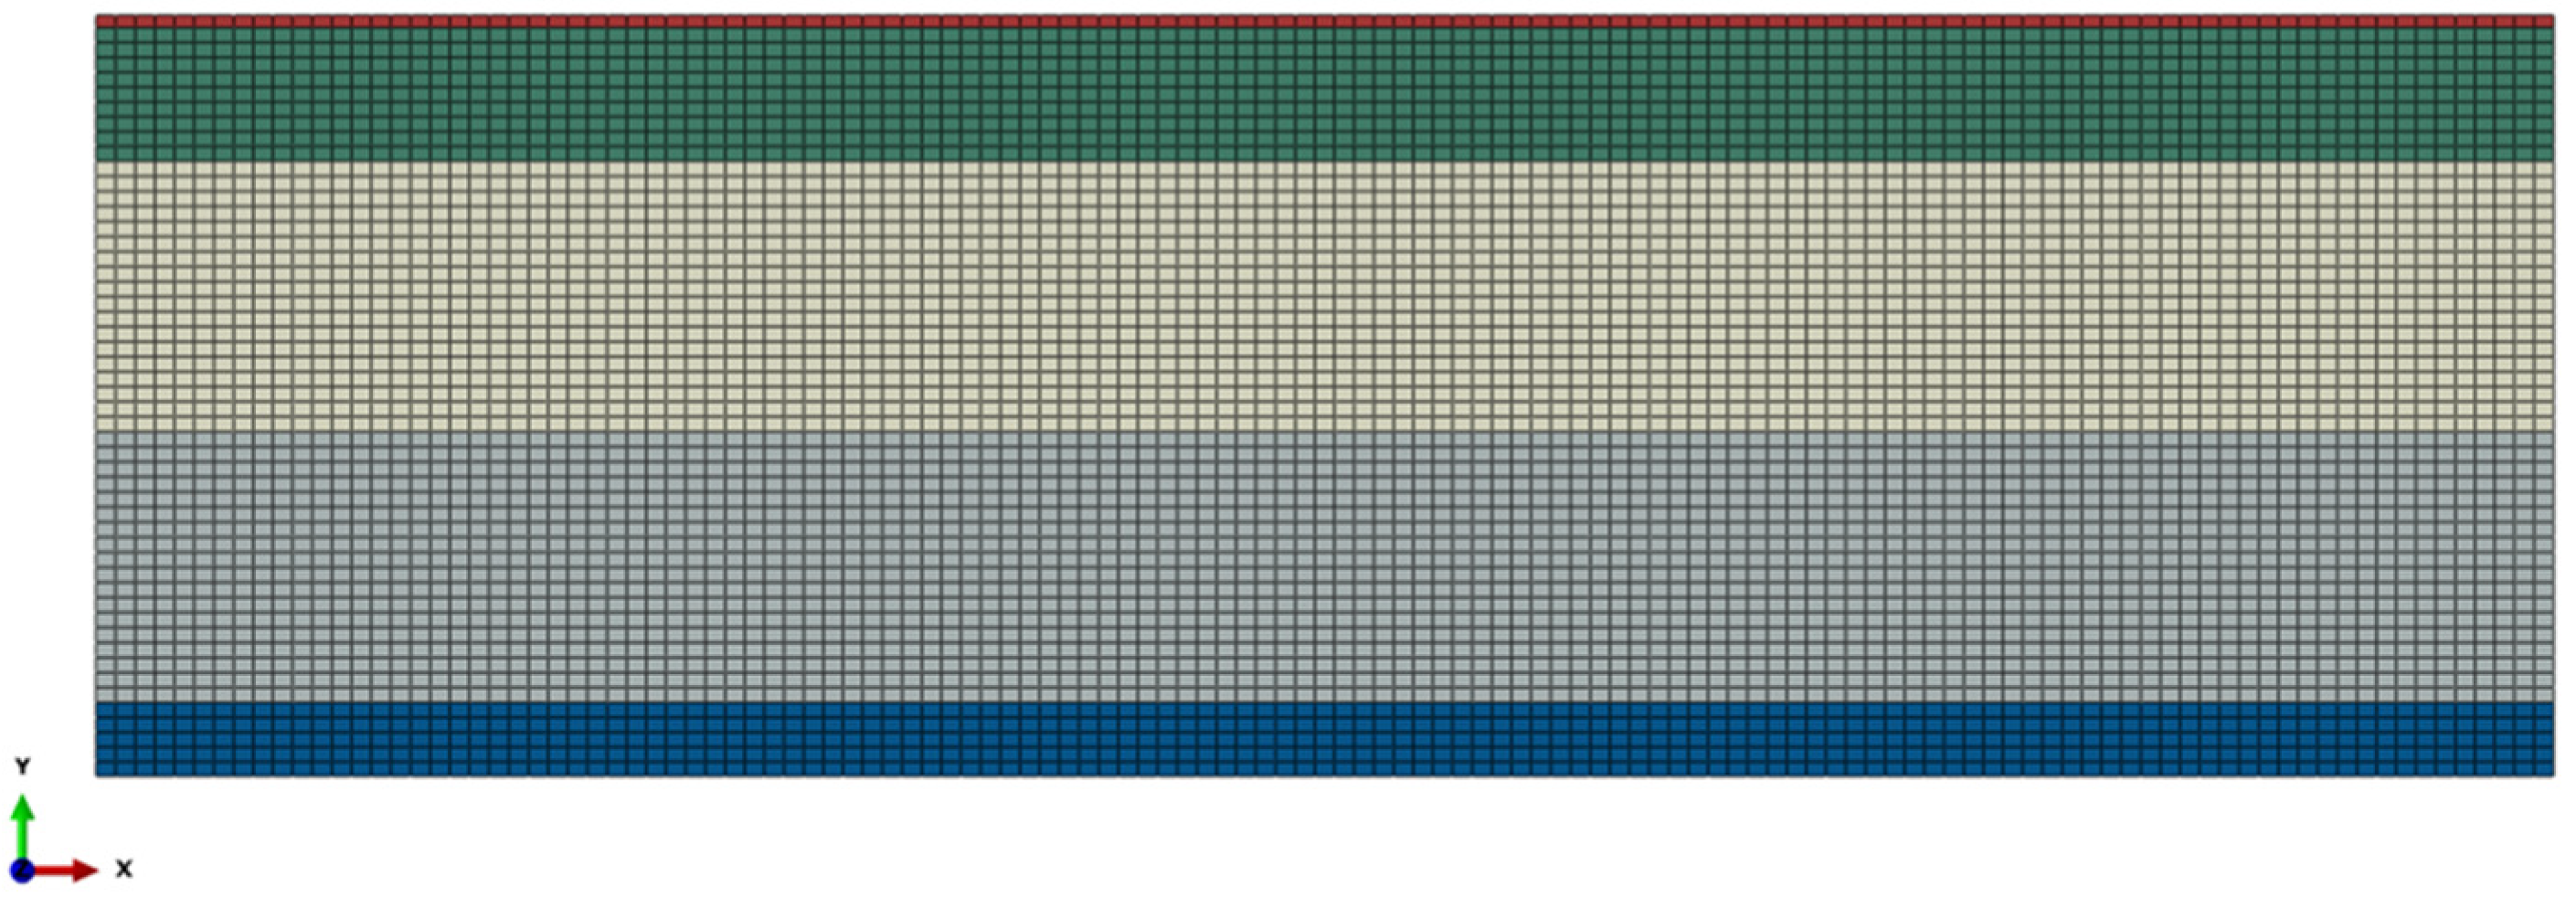
Assuming that the filler layer and the foundation soil layer are evenly distributed in the subgrade model, the two-dimensional numerical model of the subgrade temperature field as shown in the Figure 3 is established, which lays a foundation for the numerical simulation of the temperature field of the transition section of the Sichuan–Tibet railway road and bridge model. The roadbed is 100 m long along the longitudinal length, and the geothermal gradient of the deep soil of the roadbed generally does not fluctuate much, so given the depth of the roadbed is 30.93 m, the surface layer of the foundation bed is 0.5 m thick graded gravel, and the bottom layer of the foundation bed is A and B filler. From top to bottom, the types of soil below the original ground are clayey loess (11.93 m), silty clay (11 m), and silt (3 m).
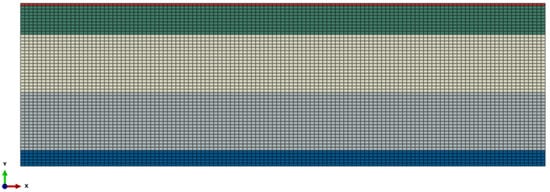
Figure 3.
Geometric dimensions and meshing of subgrade temperature field model.
In order to find the temperature field of the frozen soil subgrade, it is necessary to provide the thermal conductivity λ and specific heat capacity C of the soil in different freeze–thaw states, and in addition, in order to consider the phase transition of water in the soil, the latent heat L of the phase transformation of each soil layer and ice should also be determined.
According to the references, the thermal conductivity of this paper only considers the freeze–thaw state and ignores the influence of temperature, and and are the thermal conductivity of thawed soil and frozen soil, respectively. Since the specific heat of the soil is related to the content of unfrozen water in the soil, the higher the content of unfrozen water, the greater the specific heat. After the soil is frozen, not all liquid-phase water is transformed into solid ice, and the unfrozen water is related to the temperature and negatively correlates with temperature, so for a given soil:
Cu, and Cf are the specific heat of thawed soil and frozen soil, respectively (J/(kg·°C));
Csu and Csf are the specific heat of the thawed soil skeleton and the frozen soil skeleton, respectively (J/(kg·°C));
Ci, CW—the specific heat of ice and water (J/(kg·°C)): the specific heat of water is 4180 J/(kg·°C), and the specific heat of ice is 2090 J/(kg·°C);
W, Wu—the total water content and unfrozen water content of the soil (%).
3.2. Reliability Verification of the Numerical Model of the Temperature Field
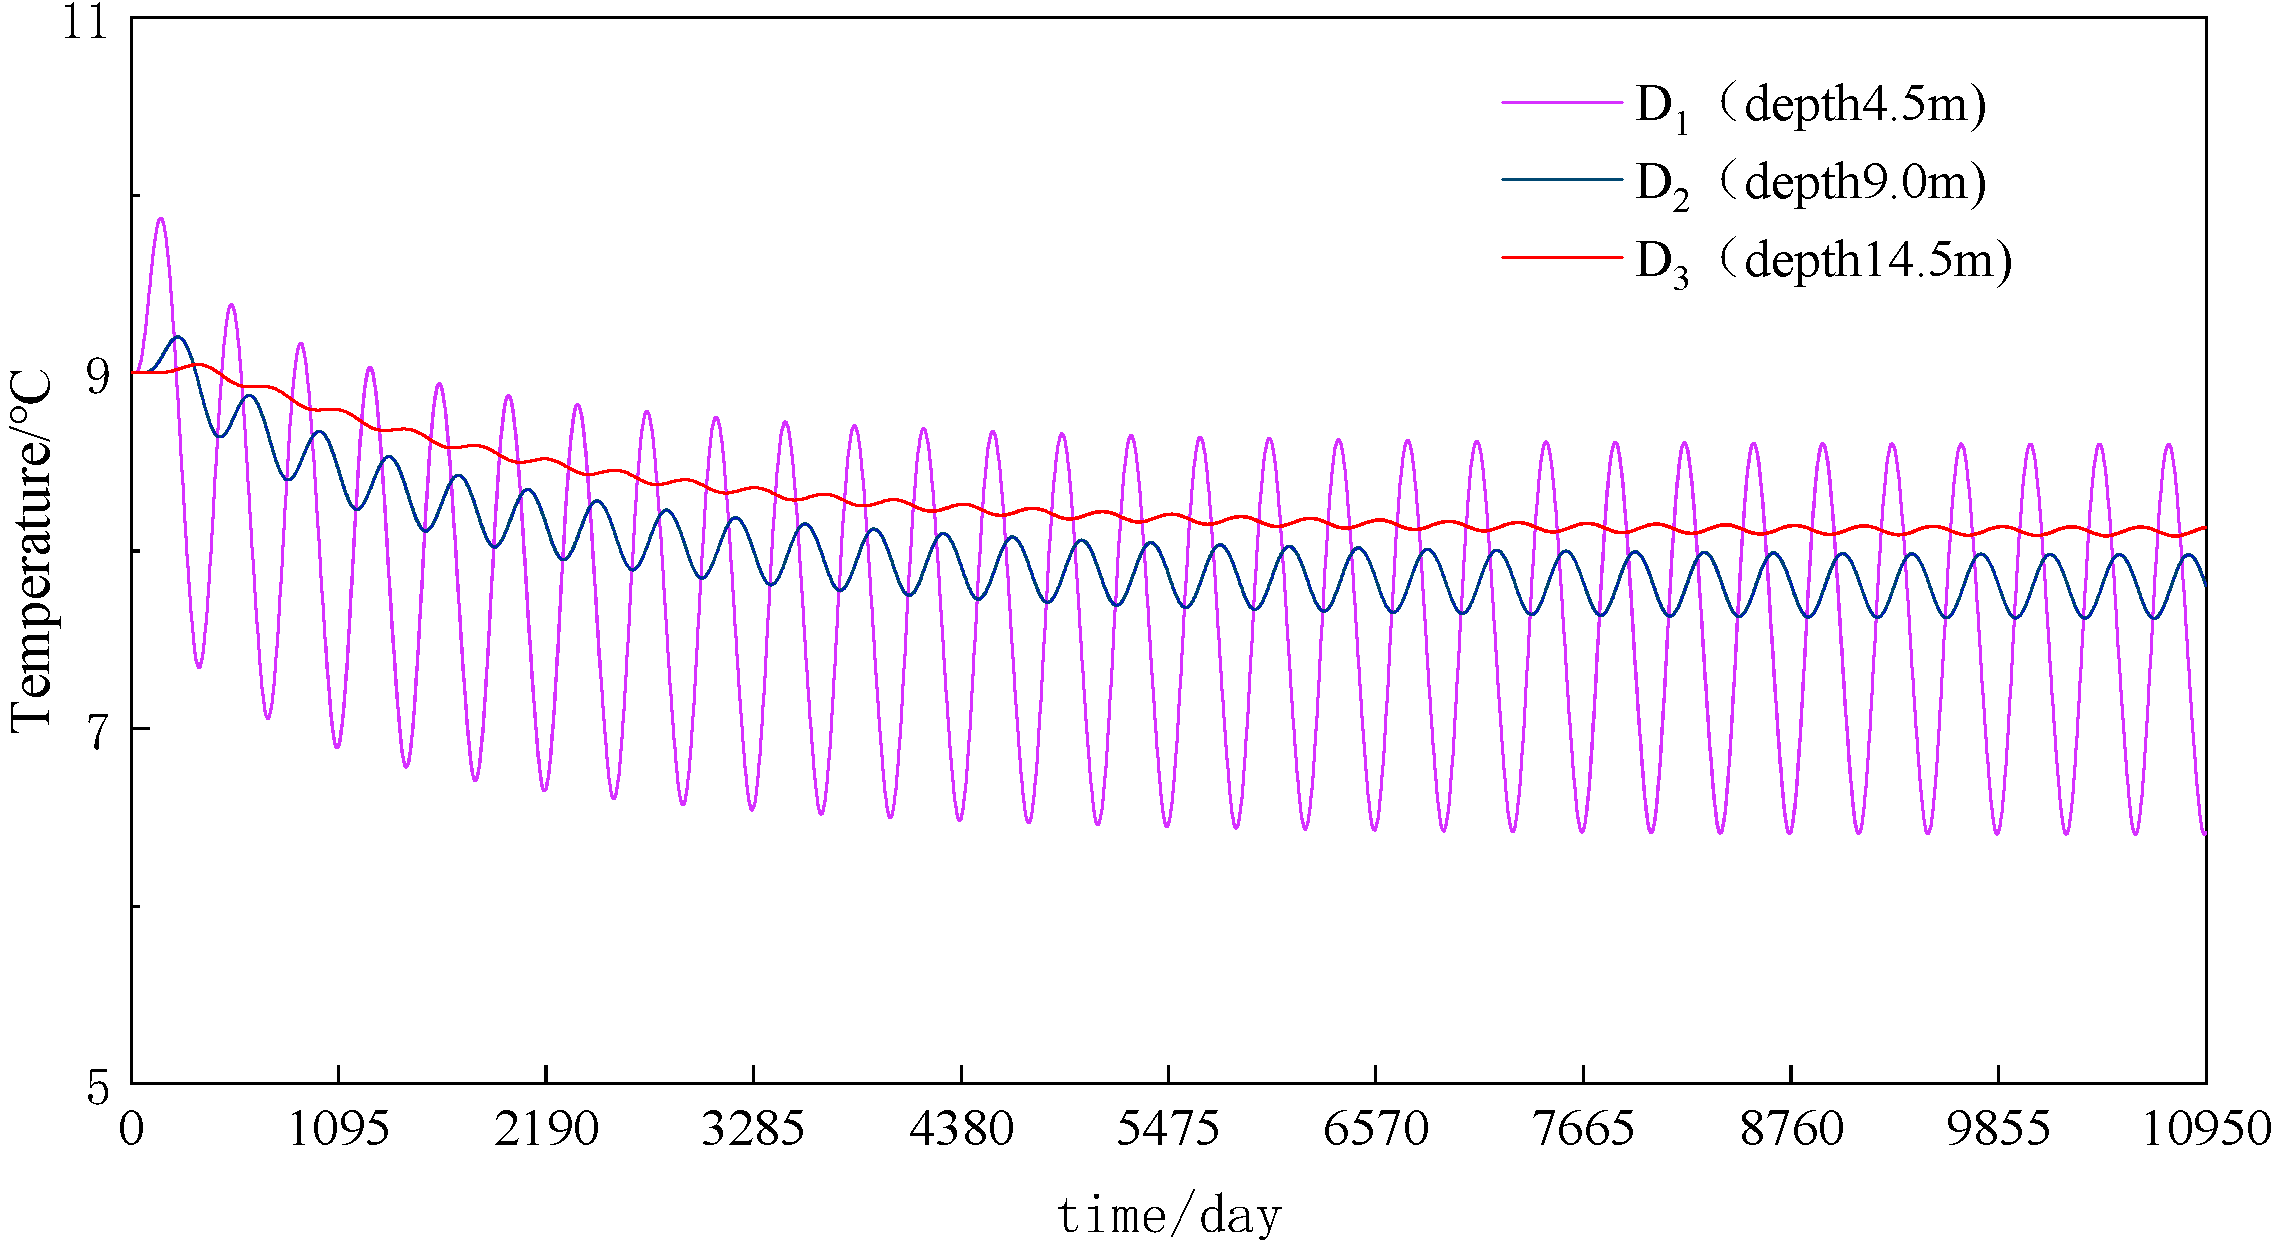
Due to the large difference between the initial temperature field and the actual temperature distribution of the subgrade, it takes a long equilibrium iteration to obtain a more balanced subgrade temperature field calculation result. In order to obtain a stable solution of the subgrade temperature field, the temperature field of the soil below the subgrade surface in 30 years was calculated without considering the temperature rise, and the three typical monitoring points D1, D2, and D3 in the middle and upper part of the subgrade model (located about 4.5 m, 9 m, and 14.5 m below the subgrade surface from the center line of the model, respectively) were taken as shown in Figure 4.
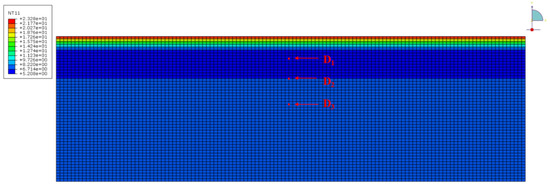
Figure 4.
Schematic diagram of the location of typical monitoring points of the temperature field along the depth direction of the roadbed centerline.
Figure 5 shows the temperature−time history curves of typical subgrade monitoring points D1, D2, and D3, and it can be seen that the annual variation of temperature at different buried depths below the surface of the subgrade gradually decreases after 15 years (day 5475), and the subgrade temperature field is basically stable. Therefore, the results of the temperature field calculation after 20 years and the corresponding time point when it reaches stability can be used as the initial temperature field in subsequent calculations. Comparing the monitoring data of D1, D2, and D3, it can be found that the time taken for shallow soil to reach relative equilibrium is shorter than that of deep soil, which is due to the fact that shallow soil is closer to the upper boundary of temperature, so the heat exchange is faster and it is relatively easier to reach the equilibrium state.

Figure 5.
Trend diagram of the equilibrium process of different typical monitoring points D1, D2, and D3.
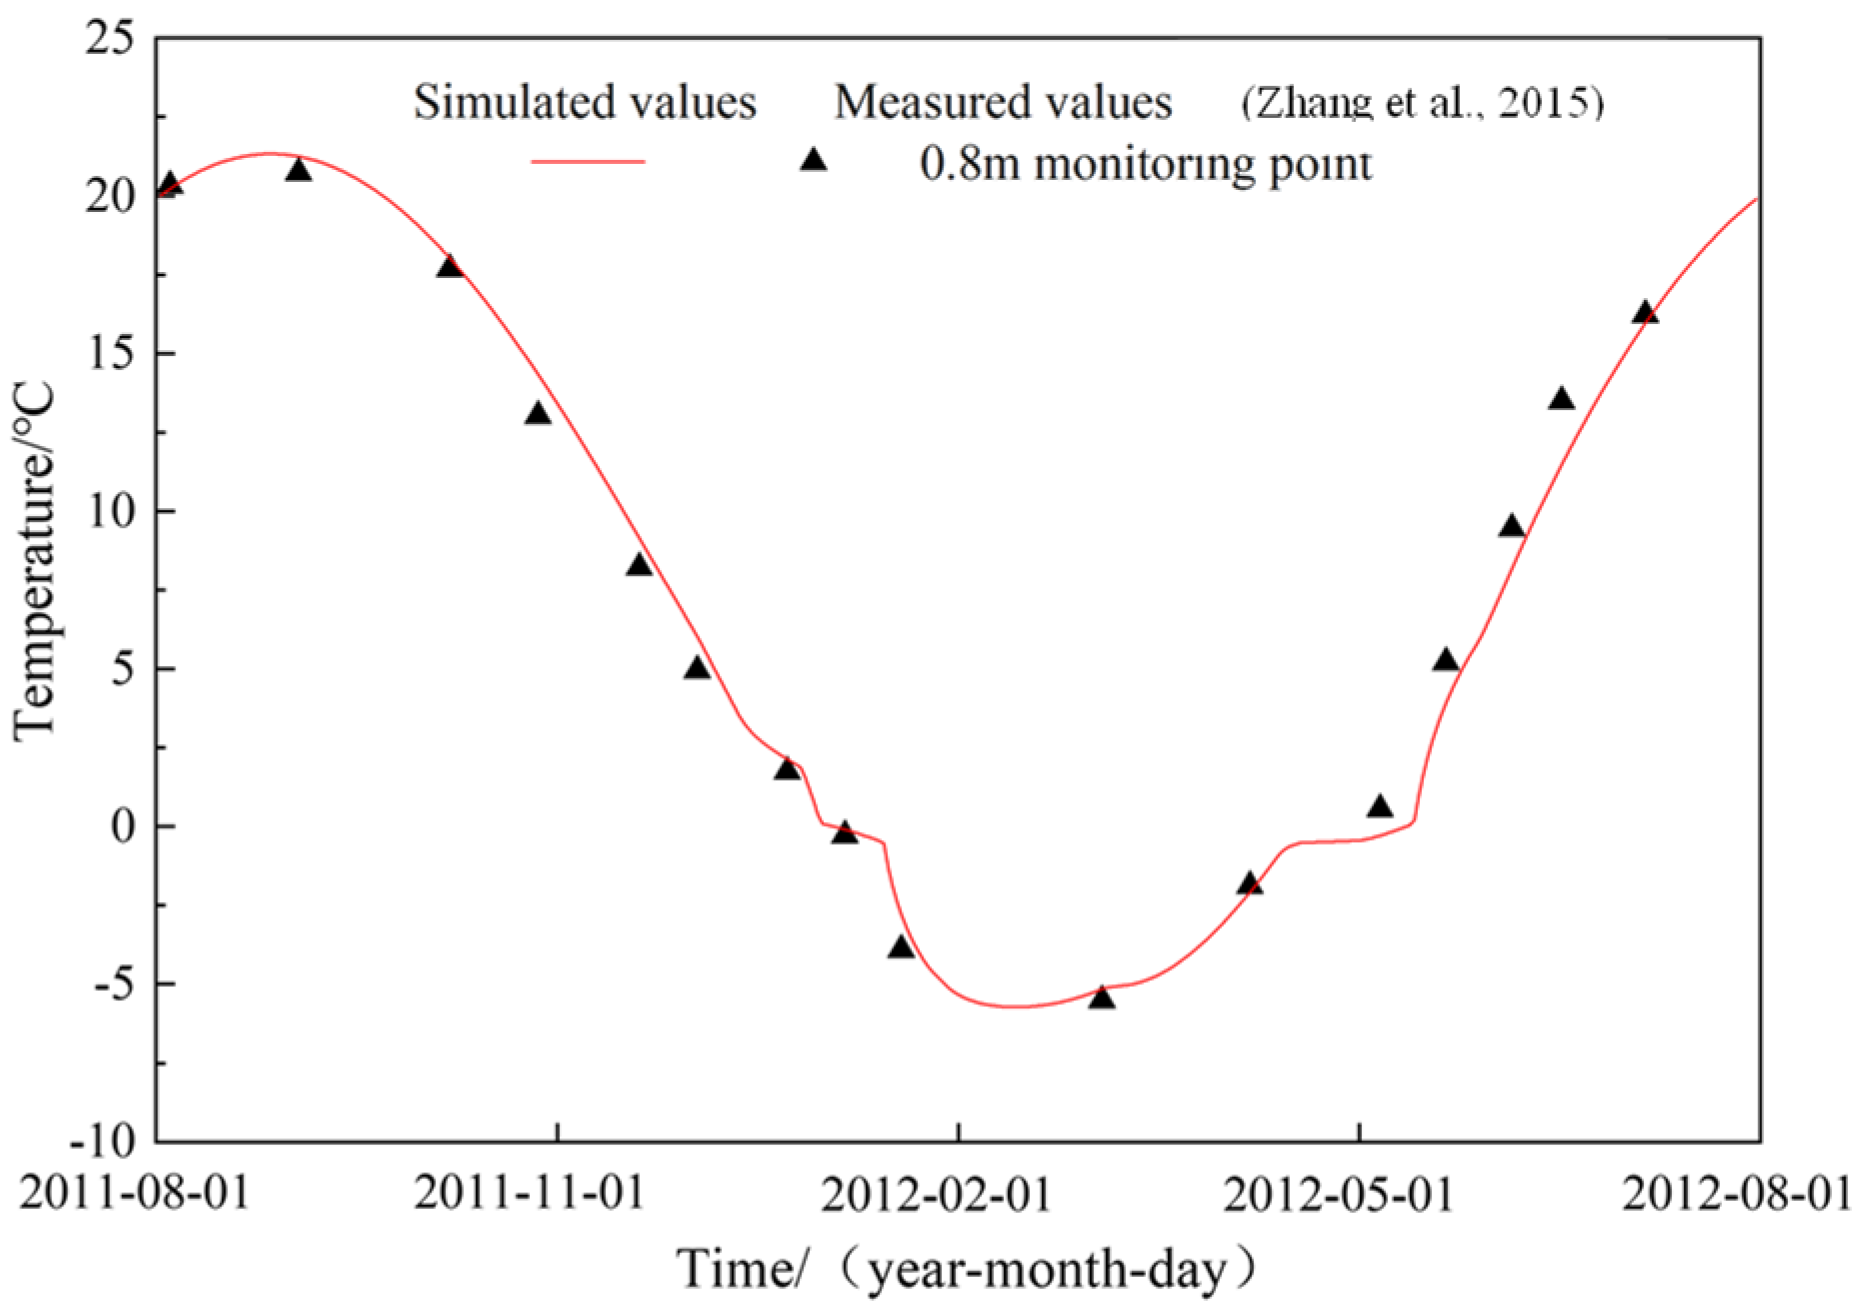
In order to reduce the workload, only the more representative simulation data are extracted for comparative analysis, and the numerical simulation results from 1 August 2011 to August 1 of the following year are taken to compare the calculated results with the measured data in Ref [33]. As shown in Figure 6, it can be seen that the temperature simulation results of the subgrade temperature field are not only basically consistent with the monitored temperature in numerical terms, but are also quite consistent with the monitored temperature in phase, indicating that the temperature field model established in this section is reliable and can simulate and reproduce the actual distribution of the subgrade temperature field.

Figure 6.
The monitoring data of 0.8 m below the center line of the roadbed is compared with the numerical simulation data [33].
3.3. Temperature Field Model
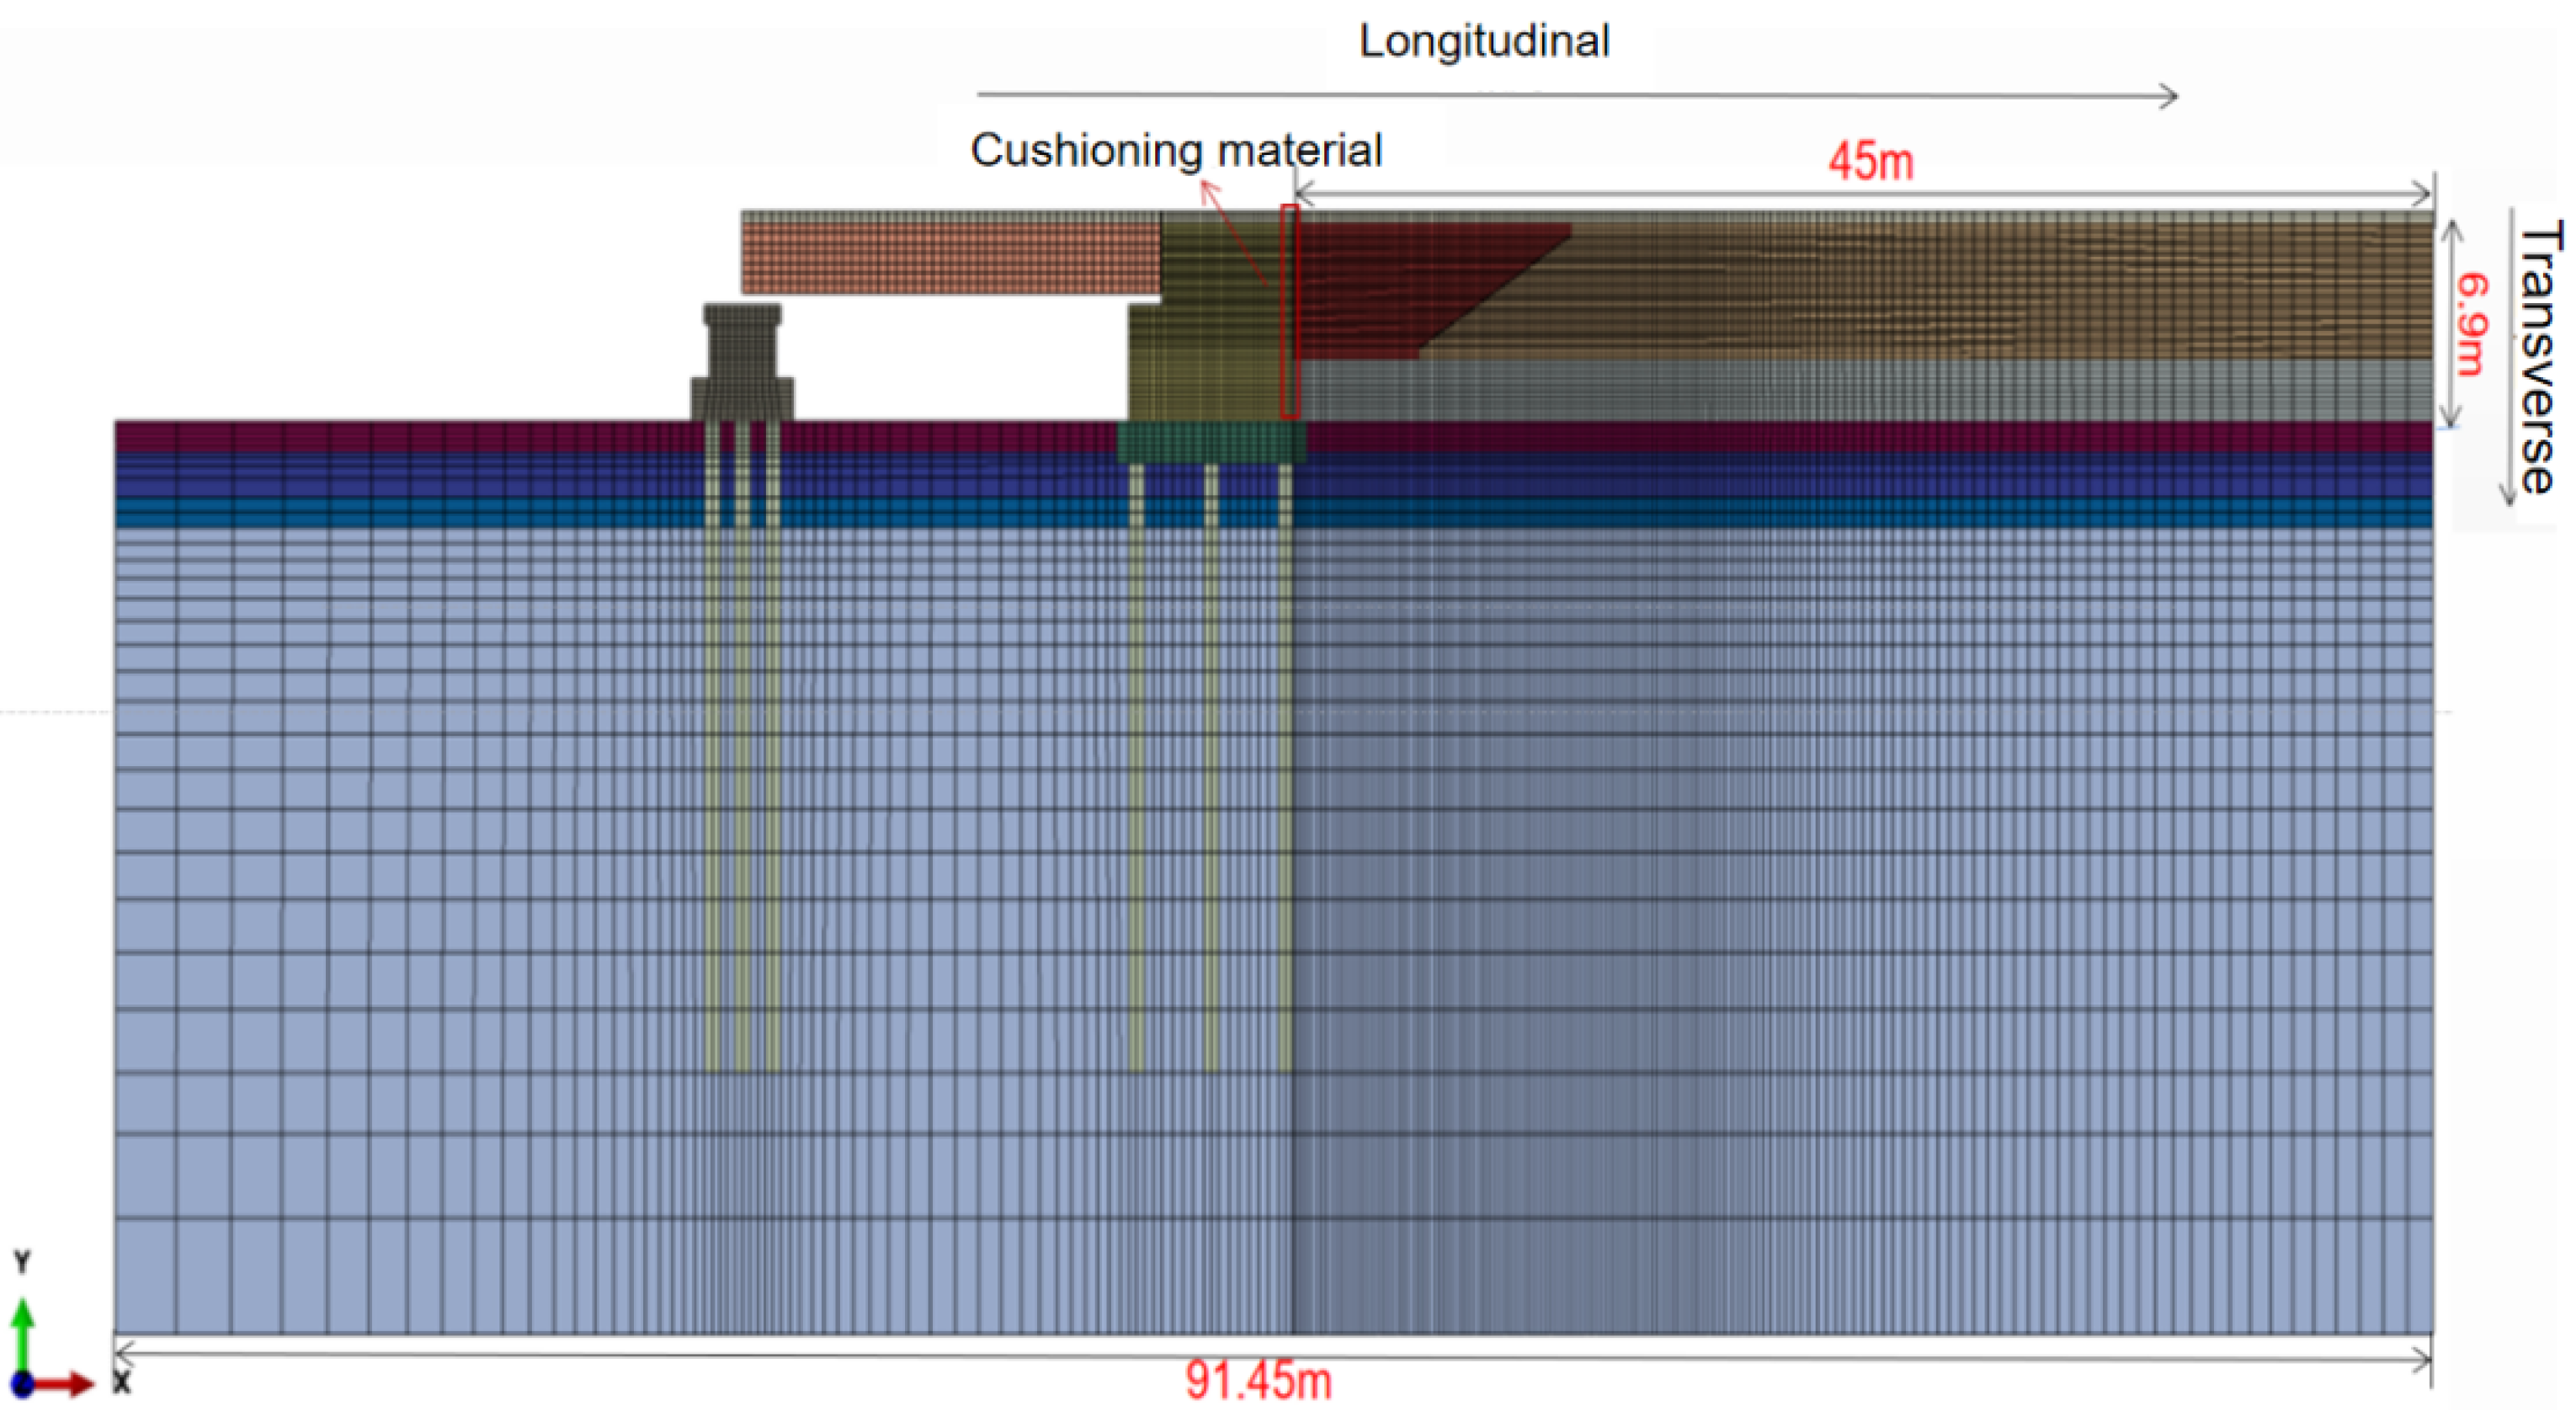
Assuming that the filler layer and the foundation soil layer are evenly distributed in the subgrade model, a two-dimensional numerical model of the subgrade temperature field is constructed based on reference as shown in Figure 7. It is established with reference [34], which lays the foundation for the numerical simulation of the temperature field of the road-bridge transition model. The roadbed is 100 m long along the longitudinal length, the depth of the roadbed is 30.93 m, the surface layer of the foundation bed is 0.5 m thick graded gravel, the bottom layer of the foundation bed is the roadbed filler, and the types of soil below the original soil, from top to bottom, are fine sand, subsoil, bottom-bearing ice, and mudstone. The thermodynamic and physico-mechanical parameters are listed in Table 1. There are many grid elements, with a total of about 14, 803 elements and 15, 337 nodes, and a long data extraction interval is set to store the calculation results in the calculation process of the exploration of the initial temperature field of the transition section to shorten the calculation time.
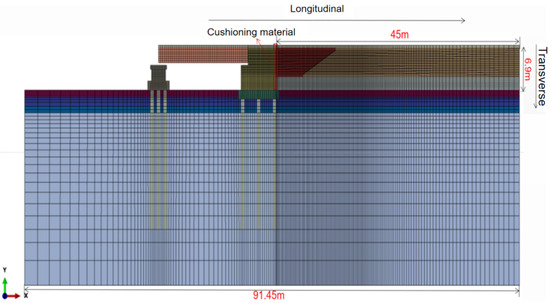
Figure 7.
Meshing of numerical model of road-bridge transition.

Table 1.
Thermal and physical parameters of numerical model of road-bridge transition section.
The specific geometric dimensions of the components in the model are as follows:
(1) Bridge I: 16.5 m long, 2.3 m high.
(2) Abutment II: height 6.5 m, top width 5.15 m, bottom width 6.45 m.
(3) Coarse-grained soil in the transition section III.: length a = 5 m, n = 2, length L = 11 m. (As shown in Figure 7, according to the specification, the length L of the transition section should not be less than 20 m.)
(4) Subgrade: total length of 45 m, depth of 6.9 m (of which (1) subgrade gravel filler IV.: 4.5 m; (2) gravel V: 2 m; (3) ballast VI.: 0.4 m).
(5) Pier VII: 3.8 m high, 4 m wide at the bottom, 3 m wide at the top.
(6) Cap VIII: height 1.4 m, width 7.5 m.
(7) Pile IX: pile diameter 0.6 m, pile spacing 0.6 m, pile length 20 m/21.4 m.
(8) Natural stratum X: 91.45 m long and 30 m deep.
3.4. Frost Heave Model
In order to realize the indirect coupling of heat and force, the geometric parameters of the subgrade frost heave model are the same as those of the meshing and the subgrade temperature field model, which are still set to be 100 m long and 30.93 m high along the longitudinal length. The surface layer of the subbed is 0.5 m thick graded gravel, the bottom layer of the subgrade bed is subgrade filler, and the types of soil below the original ground are fine sand, sub-clay, soil-bearing ice, and mudstone from top to bottom.
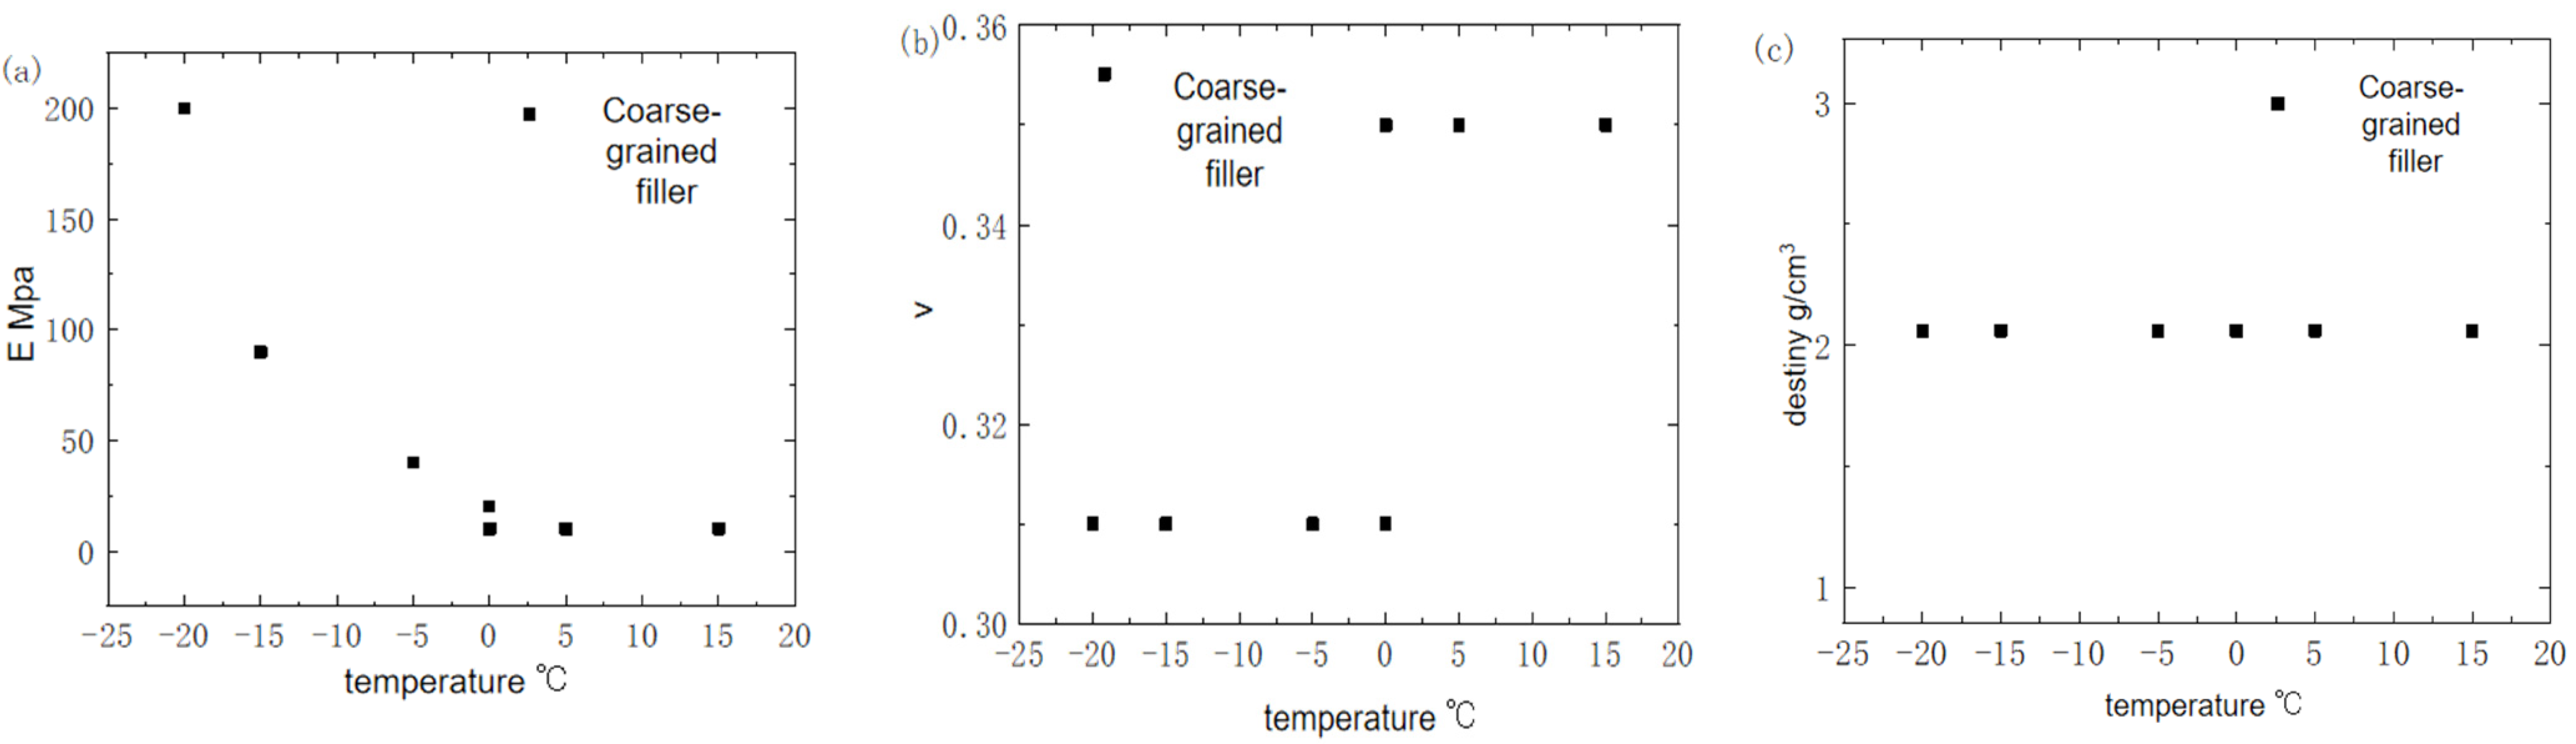
The bottom boundary of the frost heave model has both horizontal and vertical displacement and angular degrees of freedom, and only the horizontal degrees of freedom are fixed on the left and right sides of the frost heave model, and vertical free deformation is allowed. The subgrade temperature field model is stably destabilized to the predefined temperature field of the frost heave model, and the daily temperature field distribution will be automatically updated in the whole process of frost heave deformation calculation, so as to realize the indirect coupling of heat and force and obtain the frost heave deformation of the subgrade. The thermal parameters and physical and mechanical parameters of various materials in the numerical model of the road-bridge transition section are mainly based on the existing research, and the specific values are summarized in Table 2 and Figure 8.
Table 2.
Physical and mechanical parameters of the numerical model of the road-bridge transition section.
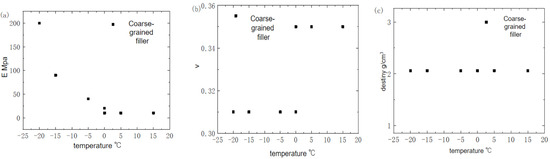
Figure 8.
Time-varying temperature of coarse-grained soil parameters in the transition section.(a) Coarse-grained soil parameters vary with temperature (b) Coarse-grained soil parameters vary with modulus (c) Coarse-grained soil parameters vary with density.
The stable calculation results of the temperature field model will provide a predefined temperature field for the subsequent frost heave calculation of the frost heave deformation model, so the meshing of the two numerical models needs to be completely consistent. When networking, the calculation accuracy and calculation time cost and the mesh of some areas that need to be analyzed is encrypted, and the grid is gradually sparsely transitioned for the vertical and horizontal directions. As shown in Figure 7, the numerical model of the road-bridge transition section is larger in size and has more mesh elements, totaling about 14,803 elements and 15,337 nodes.
The specific geometric dimensions of each component in the model are as follows: bridge I: length 16.5 m, height 2.3 m; (2) abutment II: height 6.5 m, top width 5.15 m, bottom width 6.45 m; (3) transition section coarse-grained soil III: length a = 5 m, n = 2, length L = 11 m; (4) roadbed: total length 45 m, depth 6.9 m (of which subgrade gravel filler IV: 4.5 m; block gravel V:2 m; ballast VI: 0.4 m); (5) pier VII: height 3.8 m, bottom width 4 m, top width 3 m; (6) cap VIII: height 1.4 m, width 7.5 m; (7) pile IX: pile diameter 0.6 m, pile spacing 0.6 m, pile length 20 m/21.4 m; (8) natural stratum X: 91.45 m long and 30 m deep.
4. Analysis of the Longitudinal Push-Out Effect of the Transition Section
The results of the temperature field, deformation field, and stress field of the transition section of the road and bridge were analyzed, and the longitudinal push-out effect of the transition section was analyzed under different control measures.
4.1. Temperature Field Analysis Results
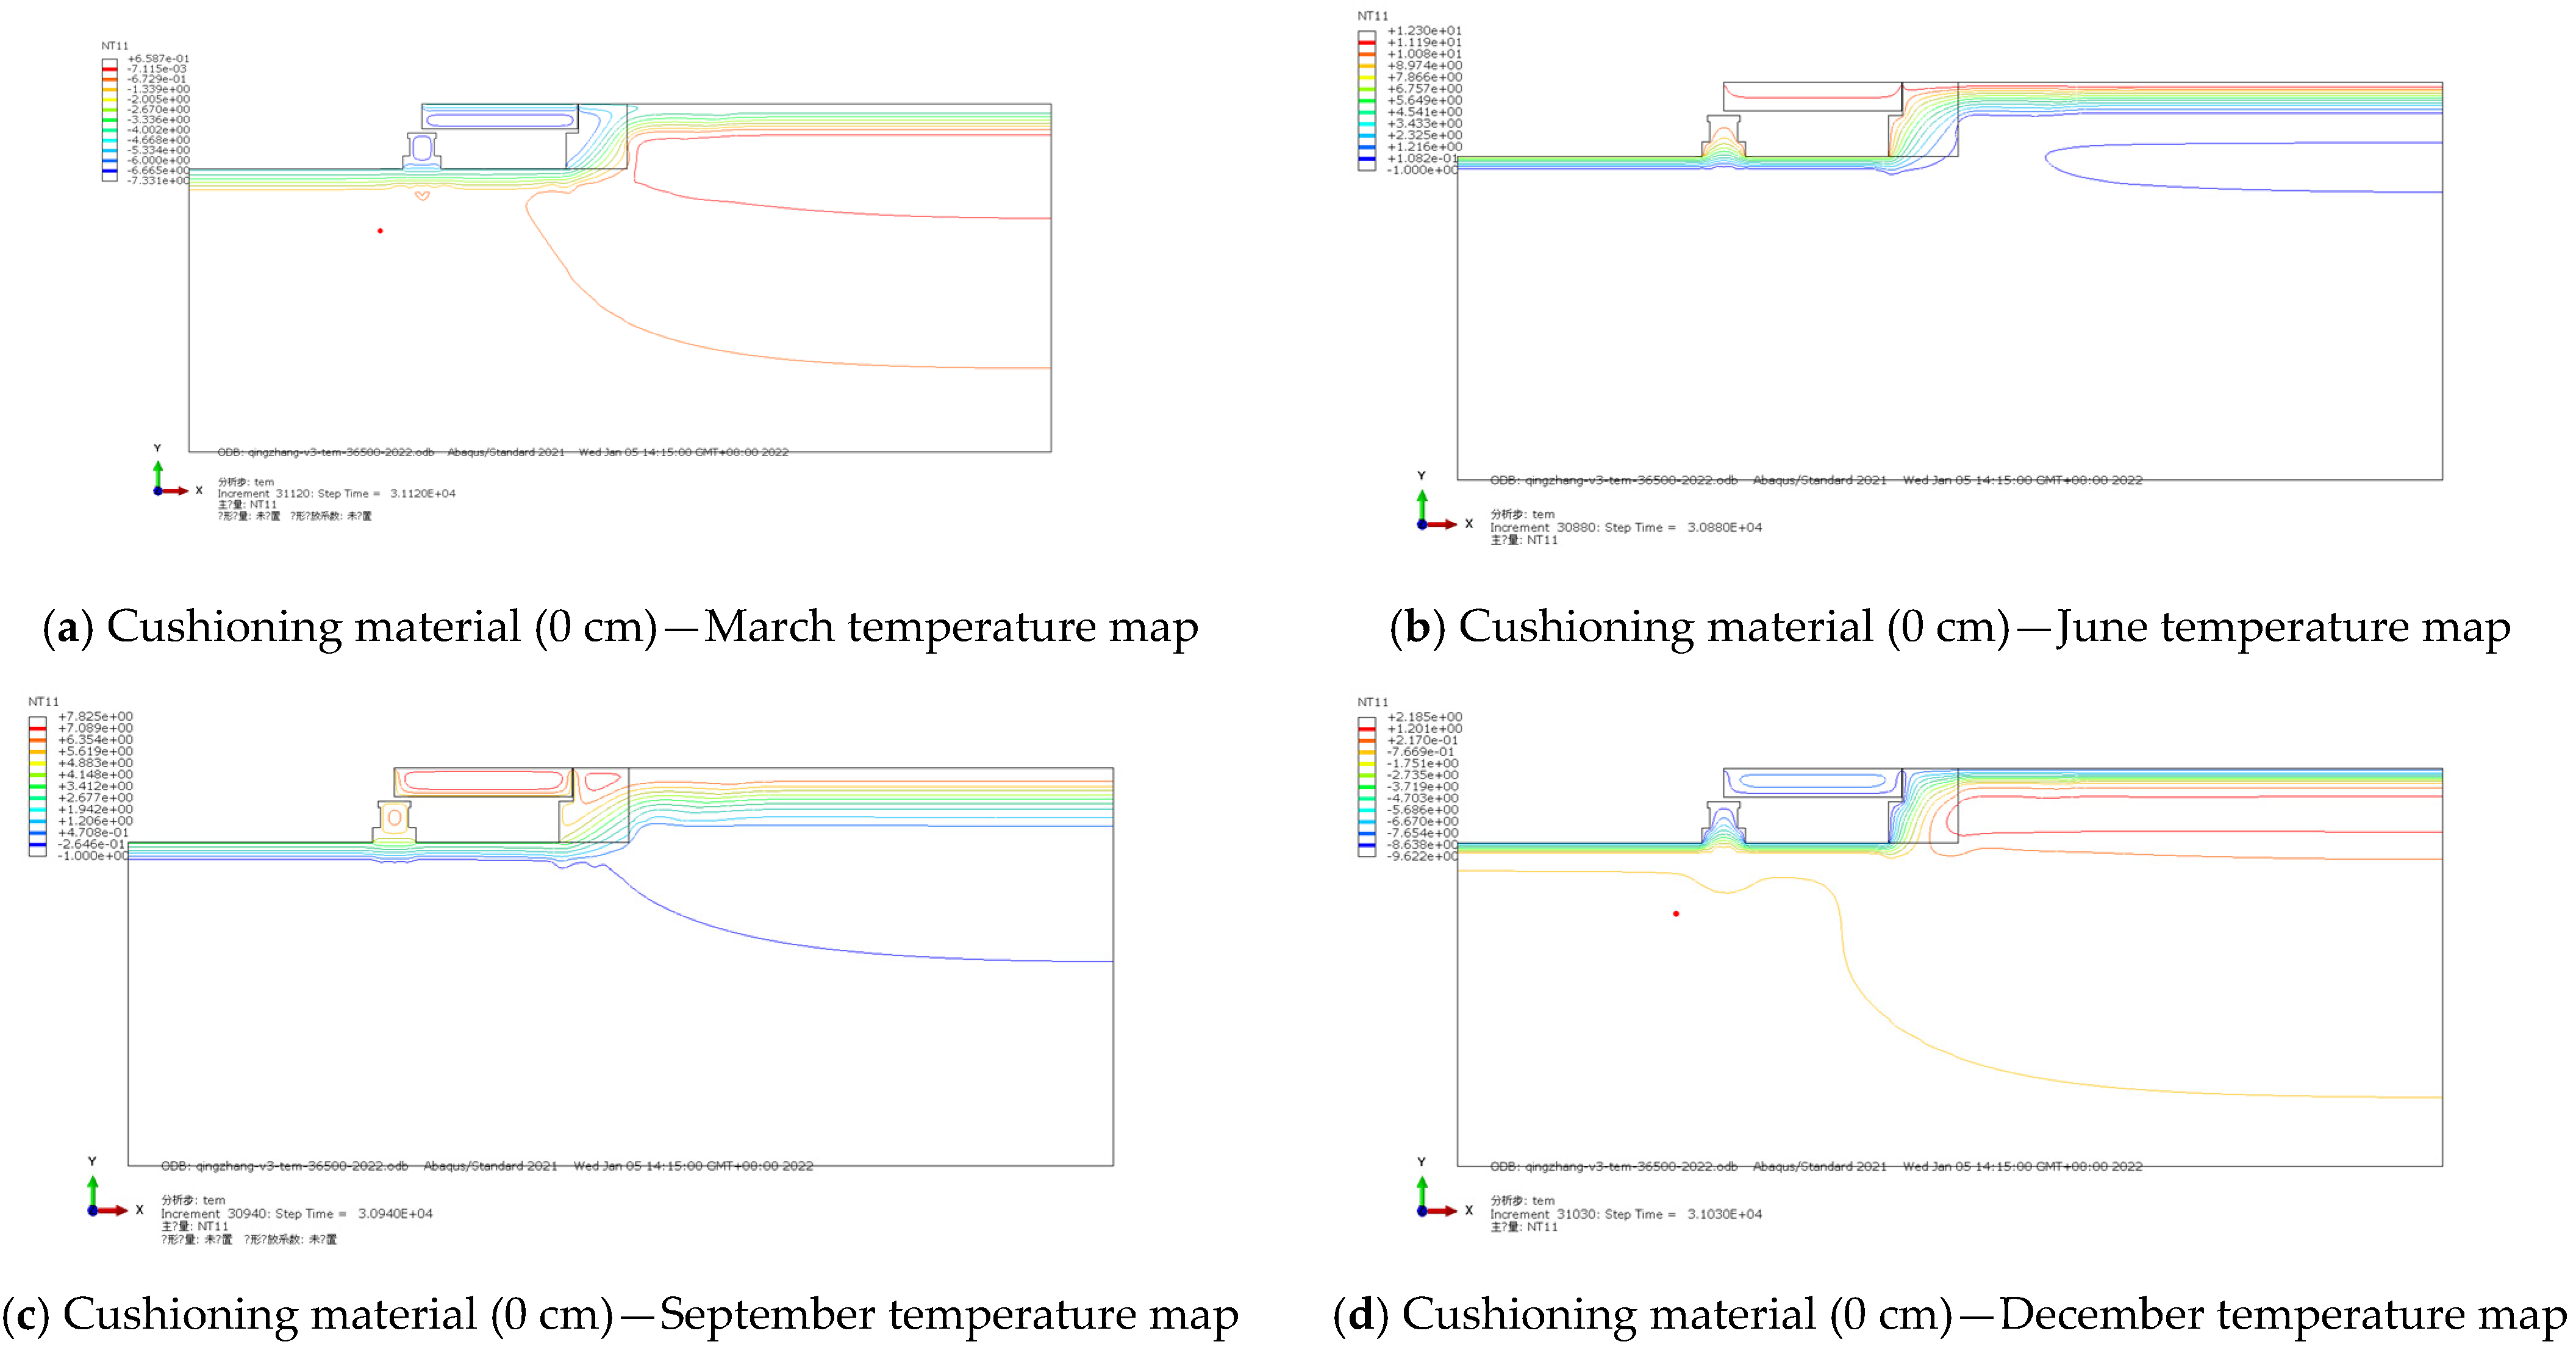
As shown in Figure 9, the simulation results of the temperature field of the transition section of the road and bridge are given in March, June, September, and December each year, with and without buffer material disposal measures (the thickness of the buffer material is 0 cm, 5 cm, 10 cm, and 15 cm).
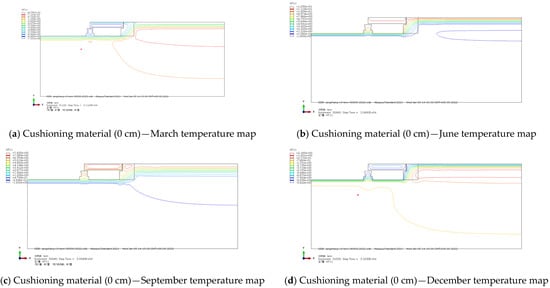
Figure 9.
Analysis of temperature field in different seasons of unbuffered materials in the transition period (the red line represents the isotherm of the abutment at different time calculation positions).
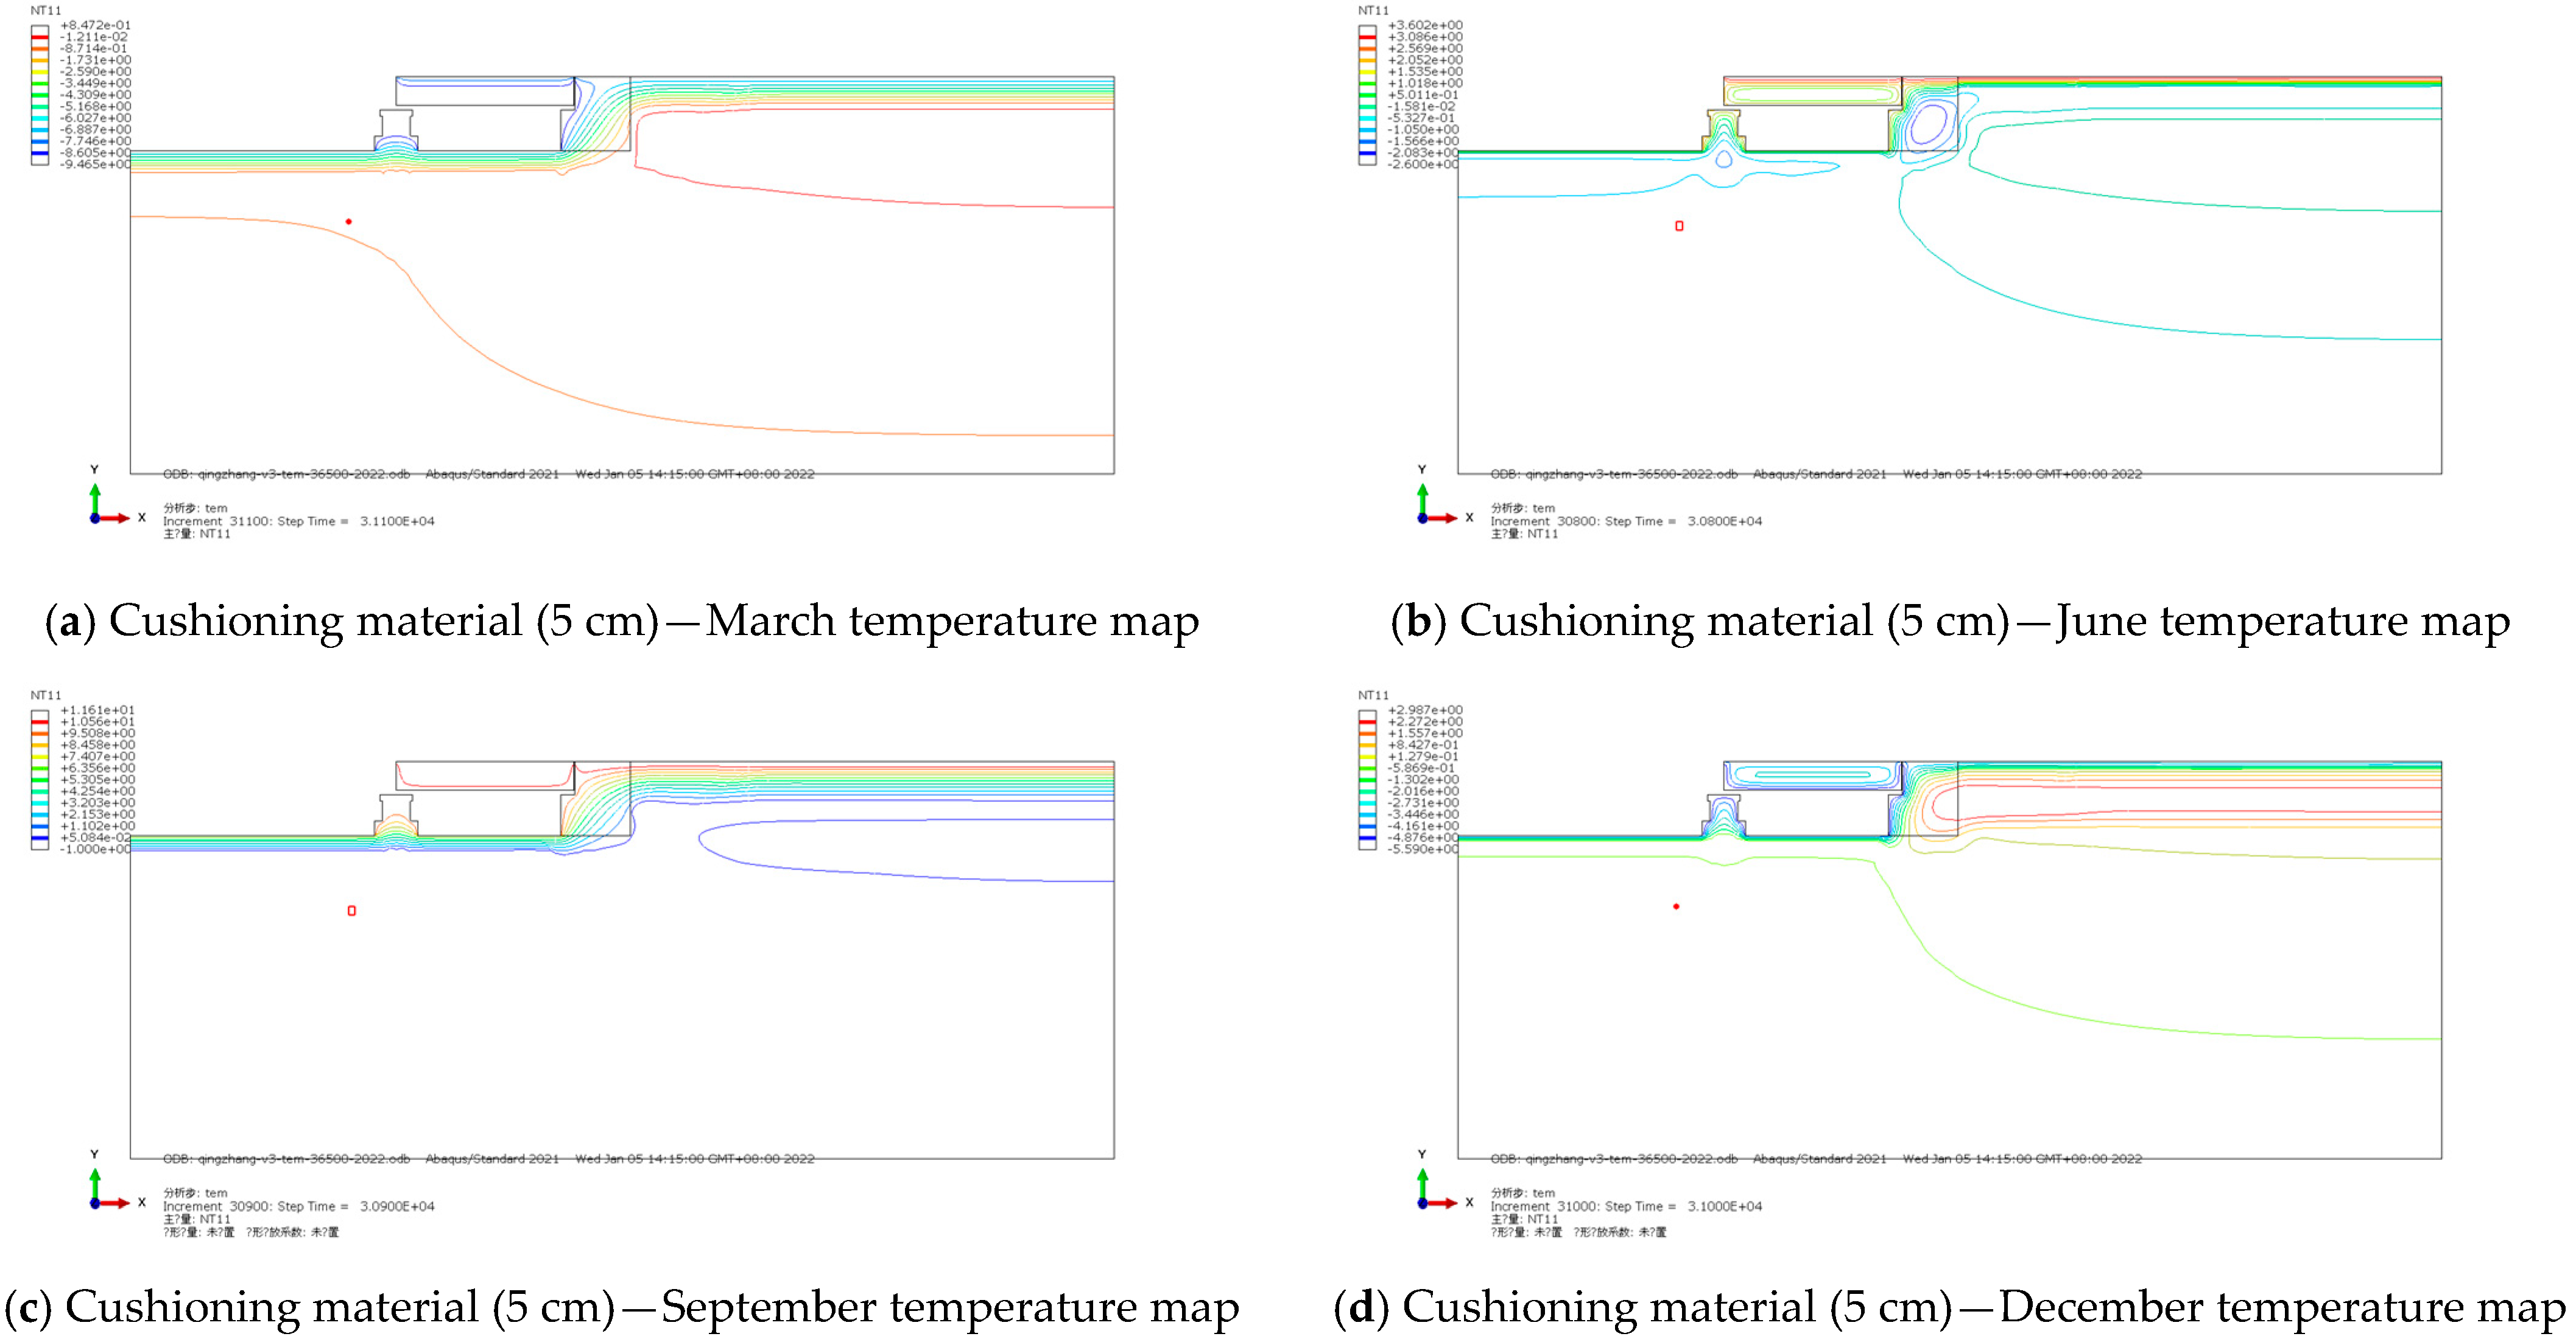
It can be seen from the cloud images of different seasonal temperature fields in Figure 9a–d that the periodic variation of atmospheric temperature at the upper boundary of the seasonal freeze–thaw zone has a significant impact on the overall geothermal field of the road and bridge crossing section. The temperature lines of 0 °C for the four typical months in the transition area are located at 7.2 m, 7.7 m, 7 m, and 7.5 m, respectively. As can be seen from Figure 10a–d, the change of buffer material does not have a significant effect on the temperature field of the road-bridge transition section, and the 0 °C temperature line is located at 7.2 m, 8.1 m, 7.15 m, and 7.6 m, respectively.
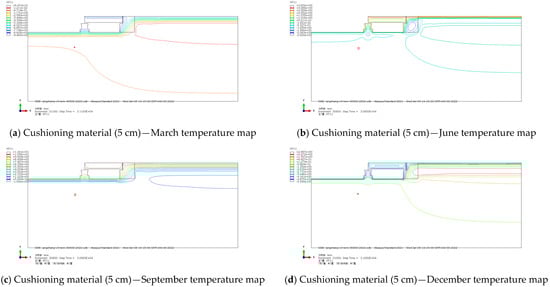
Figure 10.
Temperature field analysis of different seasons in the transition period with the buffer material at a thickness of 5 cm (the red line represents the abutment isotherm at different time calculation positions).
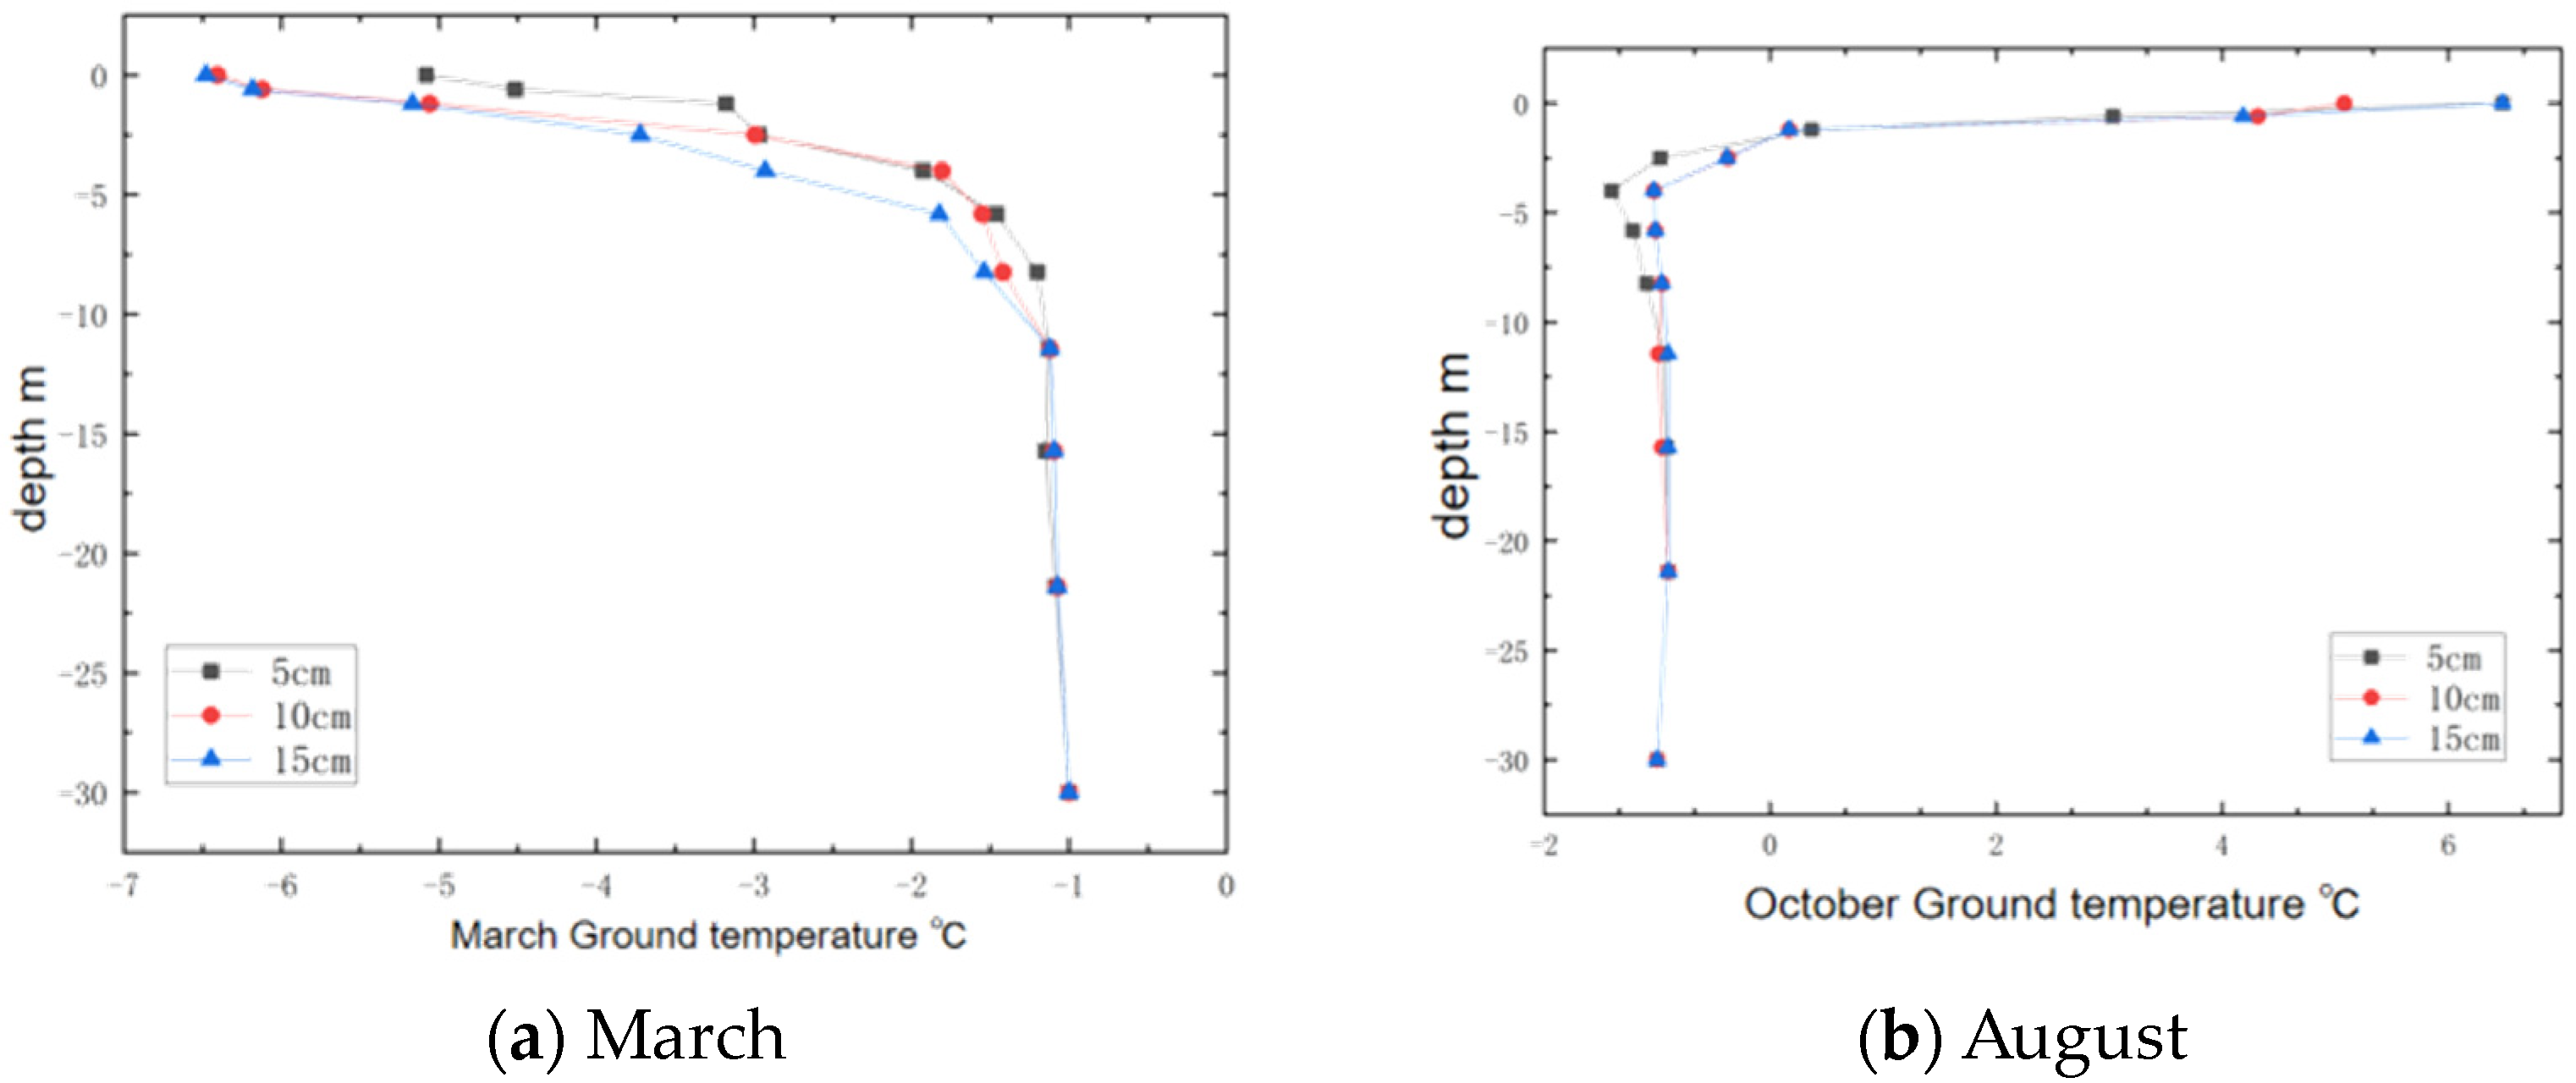
From Figure 6, it can be emphasized that March and August are the beginning stages of the increase and decrease of atmospheric temperature in the frozen area, but for the tundra temperature, March should be the season with the lowest cold temperature transfer from the cold season to the ground temperature below the surface, and August should be the season with the highest heat transfer from the warm season to the ground temperature below the surface. In addition, the simulation results show that the change of the thickness of the buffer material in the transition section has no significant effect on the overall temperature field, because the design and application of the buffer material mainly considers the absorption capacity of the longitudinal frost heave force. That is, the material stiffness is different from that of the ordinary subgrade filler, and there are no special ones with requirements for thermophysical properties.
4.2. Analysis of Longitudinal Push-Out Deformation of Road and Bridge Transition Section by Seasonal Variation
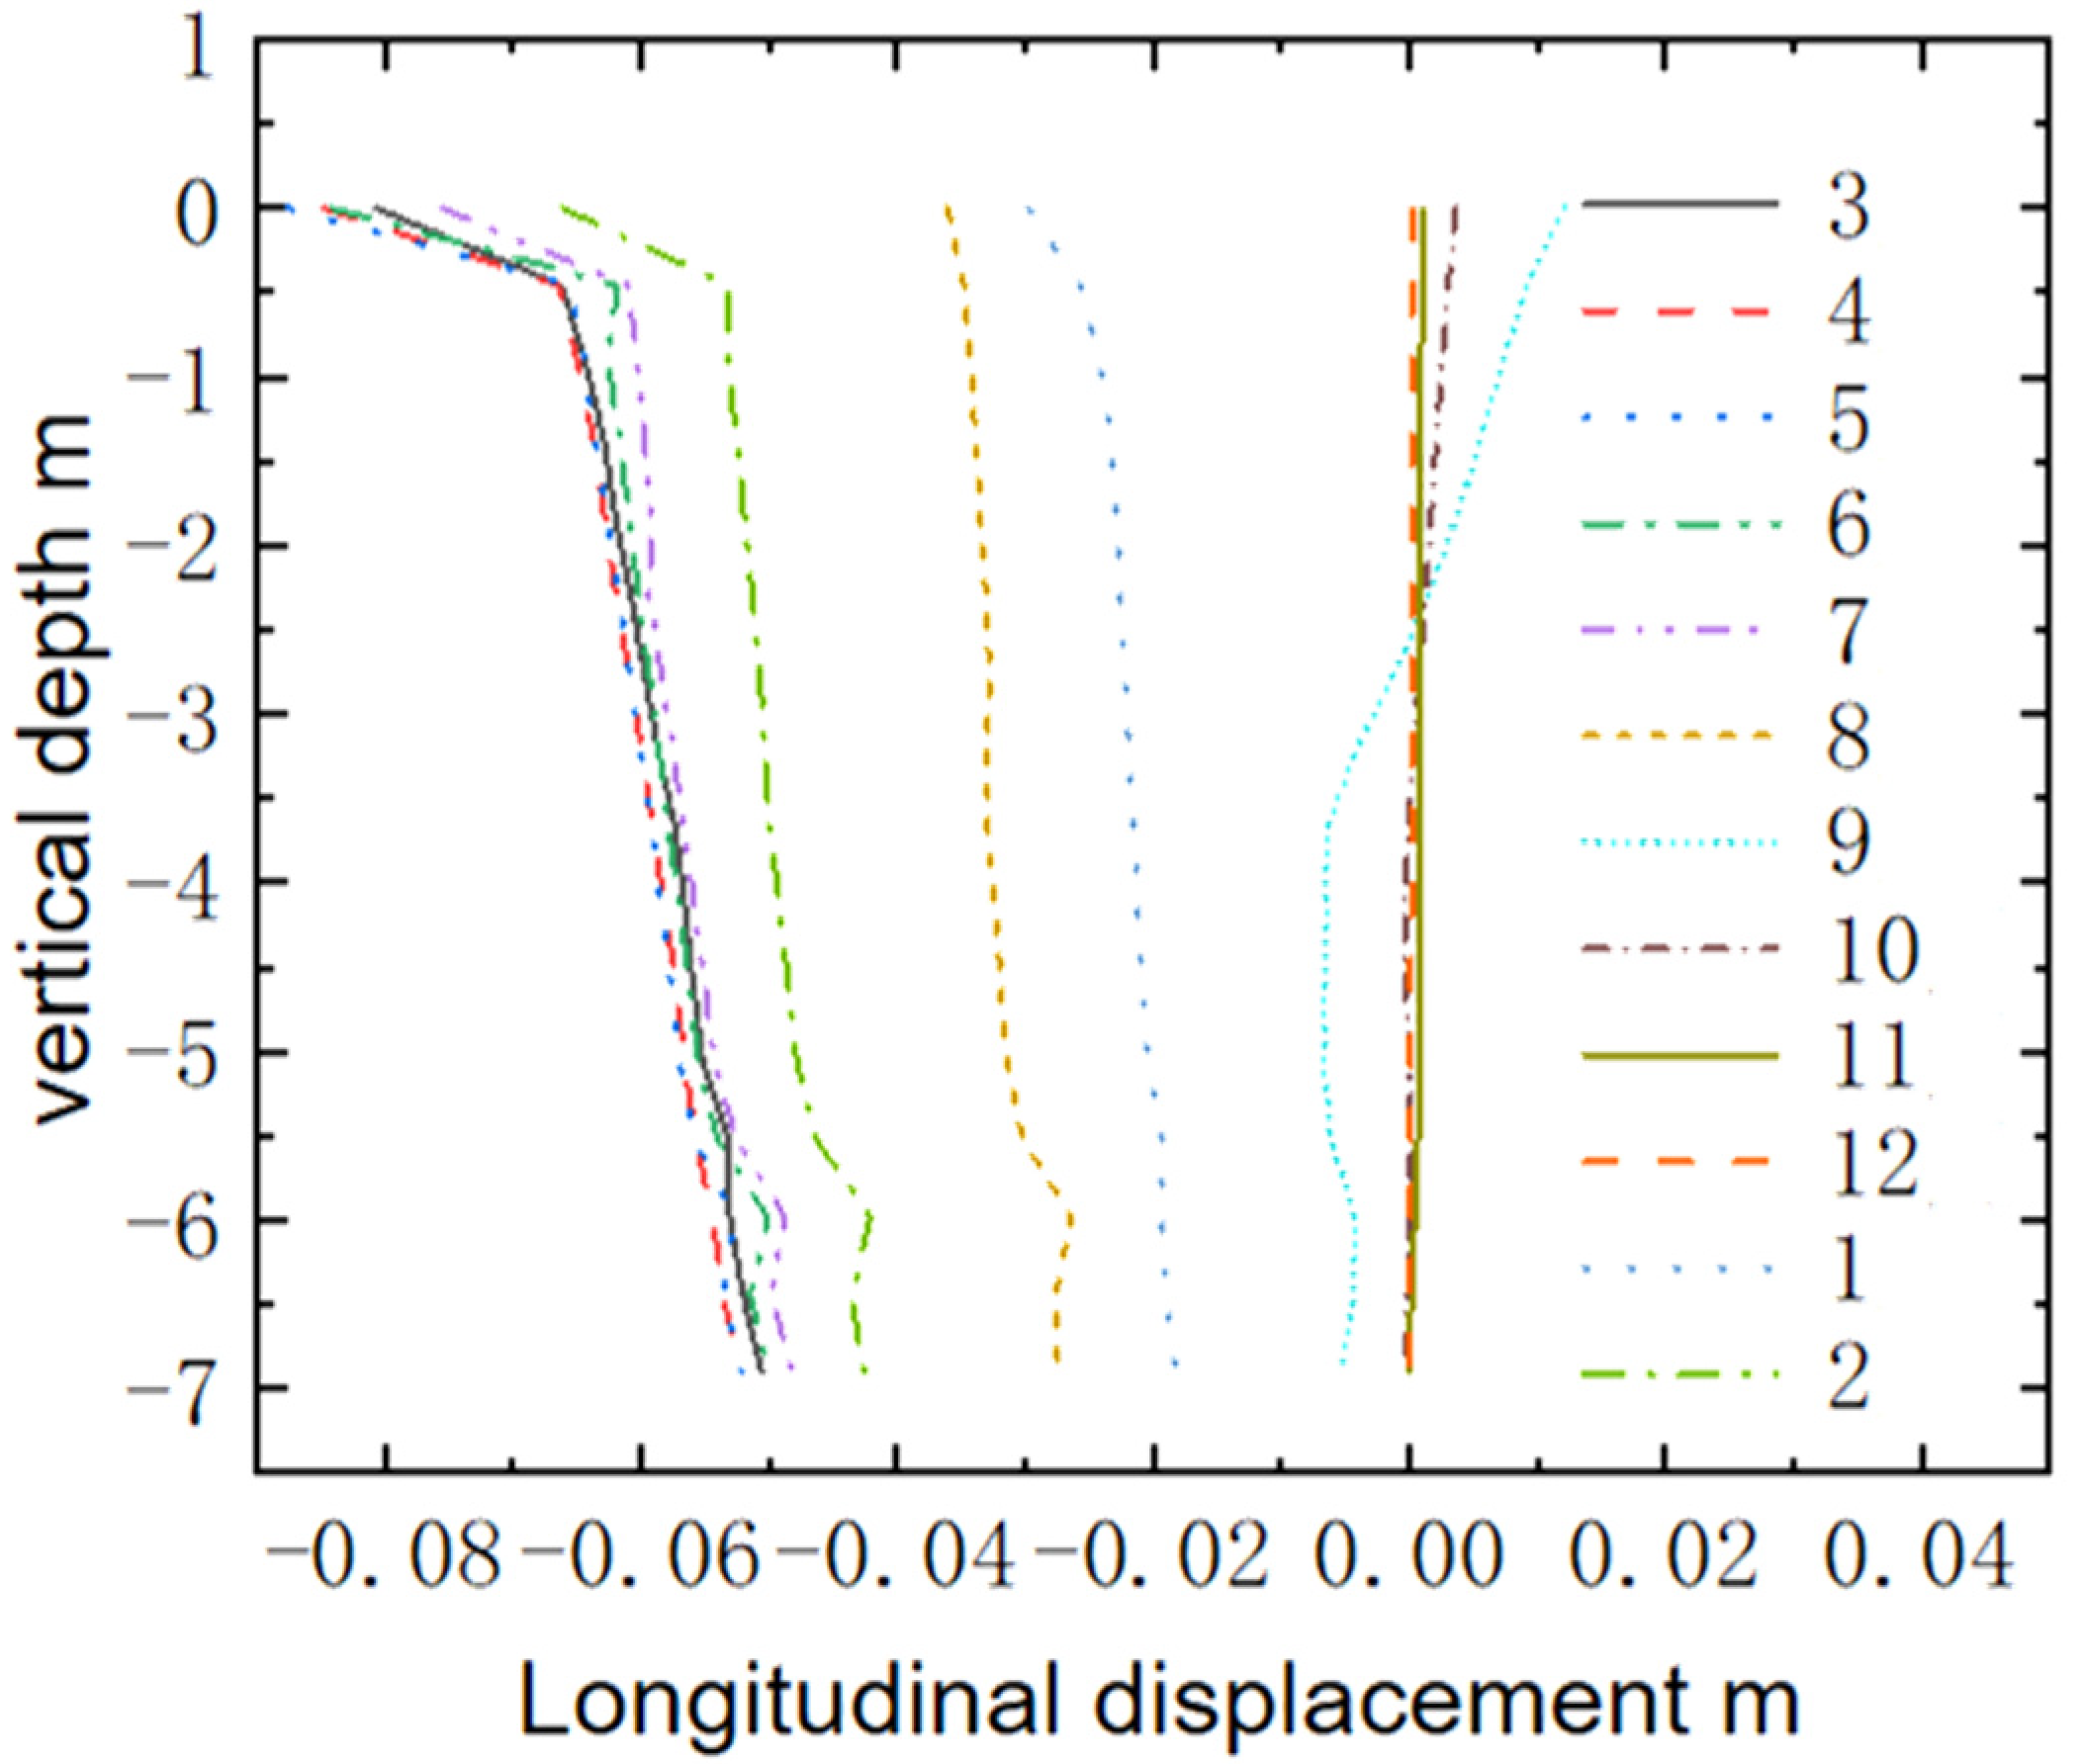
Figure 11 shows the distribution of longitudinal displacement along the depth direction during the freezing–thawing process of the roadbed in the transition area in different seasons. In the figure, the negative longitudinal displacement indicates the effect of longitudinal pressure on the abutment.
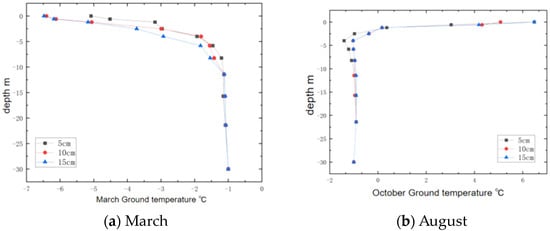
Figure 11.
Temperature variation of buffer materials with different thicknesses.
It can be seen from the figure that the longitudinal push-out deformation of the subgrade filler in the transition section will be obvious under the condition of the seasonal freeze–thaw, and the longitudinal push-out effect of the subgrade filler will show a typical periodic law with the change of seasons. In particular, it is closely related to the temperature field state and moisture field state of the roadbed. Among them, the longitudinal pushing effect of the roadbed is most obvious in March, April, and May, and the longitudinal pushing effect is weakened with the increase of the temperature of the roadbed, and the longitudinal pushing effect produced by the subgrade filler in January and February of the following year is highlighted again. In addition, with the deeper the depth of the lower soil layer, the longitudinal pushing effect becomes weaker and weaker, which is closely related to the subgrade-filling temperature field, and the soil temperature change at deeper positions is obviously weaker than that of shallow soil, so the frost heave force caused by the water–ice phase transformation frost-lifting power is naturally smaller.
4.3. Analysis of the Thickness of the Buffer Material on the Longitudinal Push-Out Deformation of the Transition Section
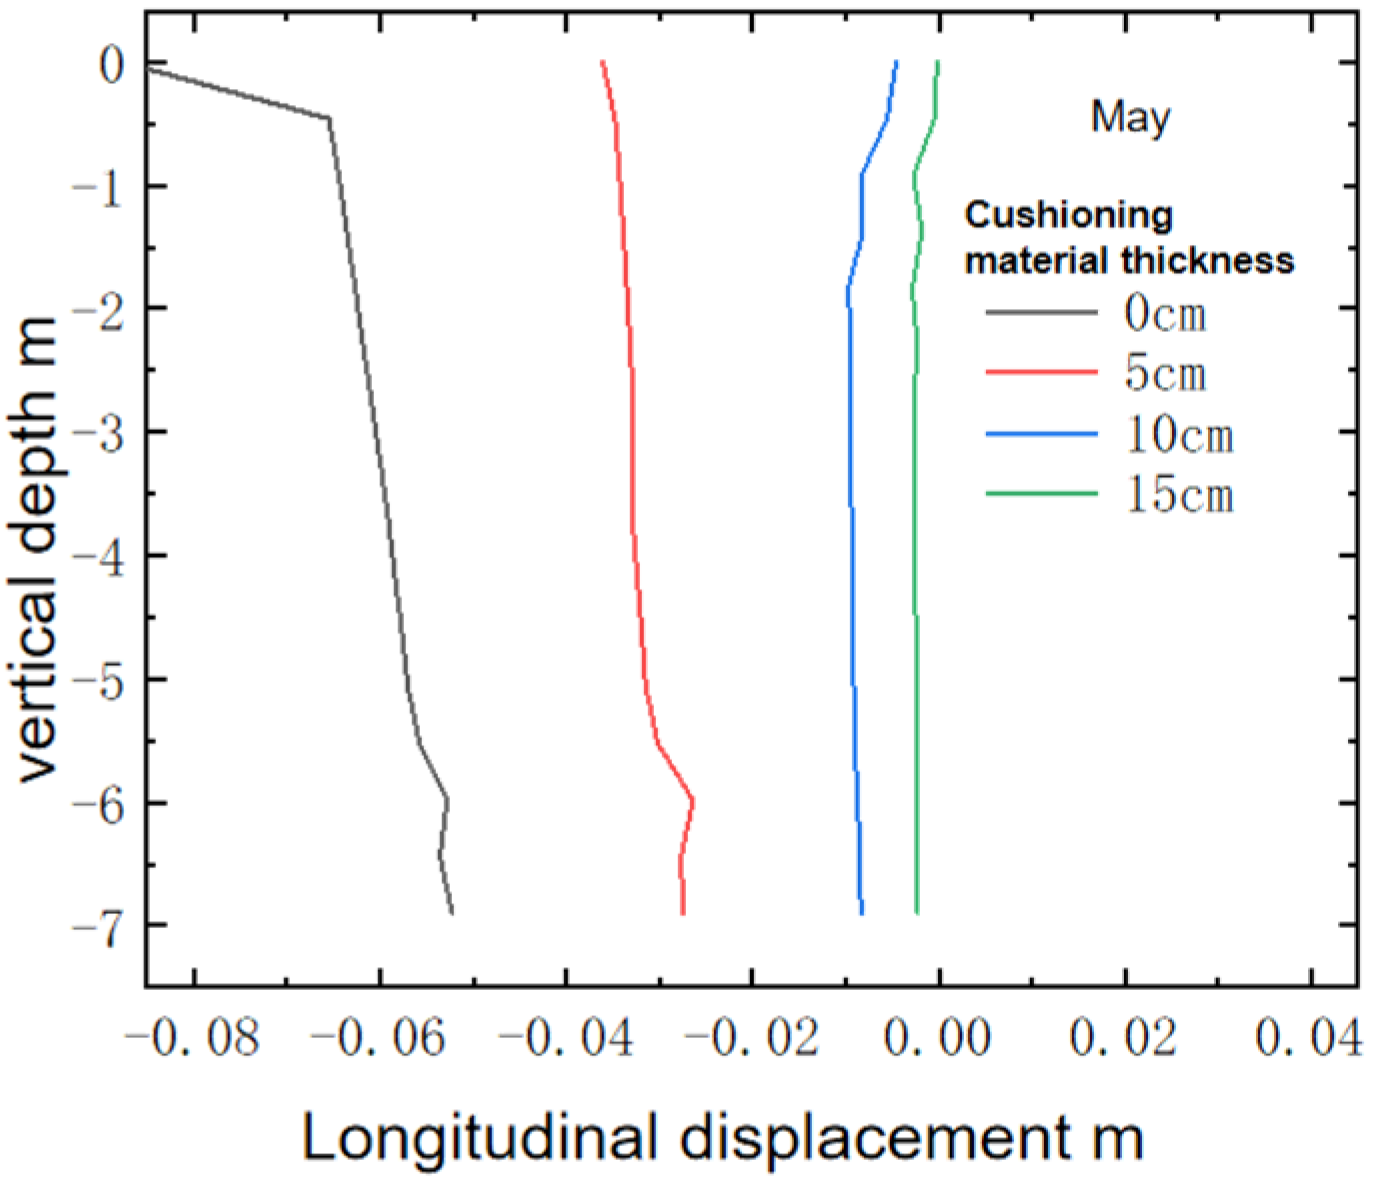
Figure 12 shows the distribution of longitudinal push-out effect in the transition section after treatment with buffer materials of different thicknesses.
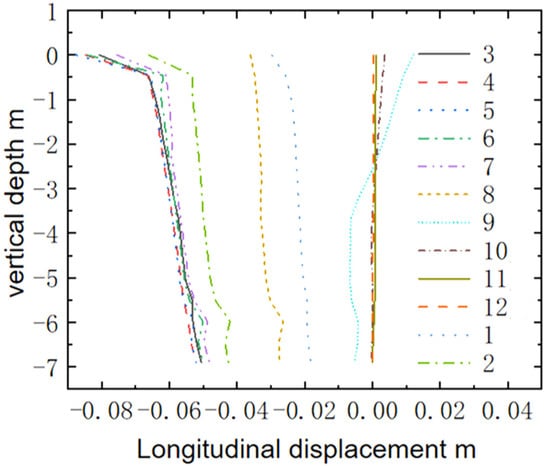
Figure 12.
Effect of the frost heave of the subgrade on longitudinal thrusting of the abutment in different months. (The straight lines of the different numbers represent the change in temperature with depth from January to December).
Taking the data from May as an example, the thickness of the buffer material has a good control effect on the longitudinal extension effect. It can be seen from the data in the figure that with the increase of the thickness of the buffer layer, the longitudinal pushing effect caused by the subgrade filler is gradually absorbed, which is manifested as a significant decrease in the longitudinal displacement of the subsoil in the transition section.
4.4. Analysis of the Influence of Seasonal Changes on the Differential Deformation of Road and Bridge Transition Sections
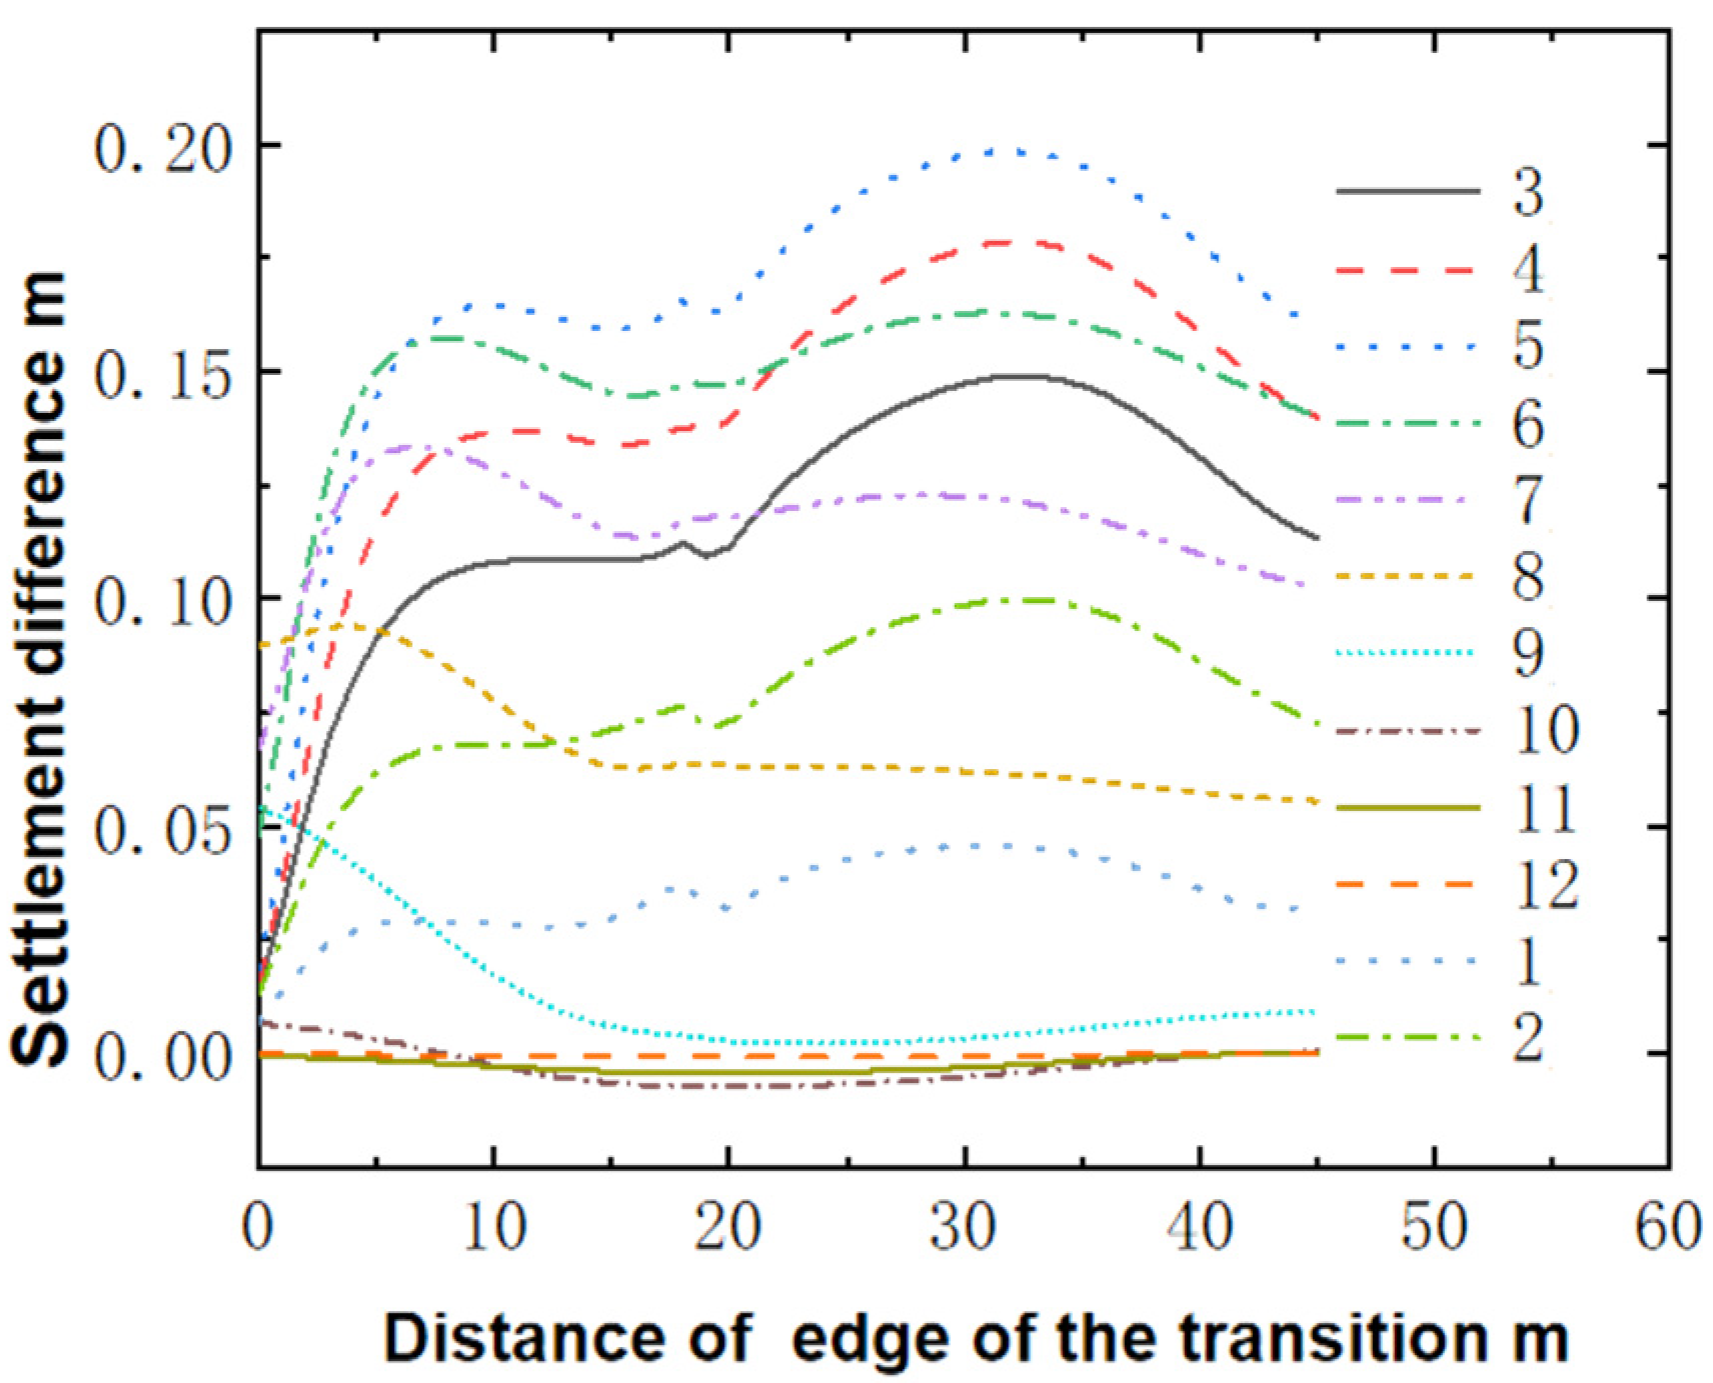
Figure 13 shows the distribution law of differential surface settlement in the transition section of the road and bridge in different seasons, and the surface shape within 45 m of the transition section is extracted for systematic analysis, and the basic law of deformation development in different seasons is compared.
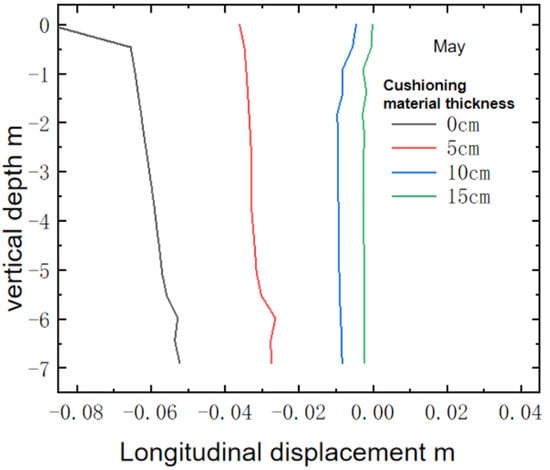
Figure 13.
Effect of different cushioning material thicknesses on the pushing effect of the abutment.
From the data in the figure (Figure 14), it can be seen that the differential deformation of the surface has different fluctuations of different degrees in the whole range of road and bridge transition sections. Overall, two distinct frost heaves formed at 10 m and 30 m from the edge of the transition section. The maximum differential settlement is close to 0.2 m, which will have a significant impact on driving safety and sustainable operation. In addition, with the seasonal change, the difference of surface deformation in the transition section is very obvious, which is manifested in the periodic change law of the overall deformation with the passage of seasons. The lower the ground temperature, the more obvious the deformation of the subsoil by the frost heave was and the higher the ground temperature, the more the subsoil showed a certain degree of thawing and settlement deformation, as shown in the results of October, November, and December.
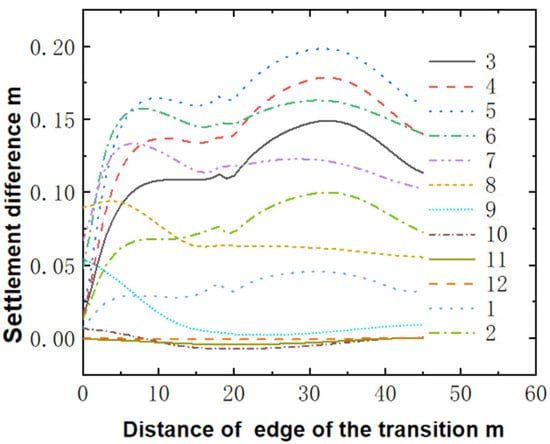
Figure 14.
Variation of differential settlement in different seasonal transition sections. (The straight lines of the different numbers represent the change in temperature with depth from January to December).
5. Conclusions
In order to provide guidance for the sustainable operation of the bridges, in view of the longitudinal push-out effect and differential settlement of the road and bridge section in the frozen area, this paper focuses on the comparison and analysis of the longitudinal push-out and differential settlement of the transition section after the treatment of the buffer material thickness in the transition section in different seasons and the transition section. The main conclusions are as follows:
- (1)
- The ground temperature was the lowest in a year due to the transfer of the cold volume below the surface in March, and the highest in a year due to the transfer of heat below the surface in the warm season in October, and the change in the thickness of buffer material thickness in the transition section had no significant effect on the overall temperature field.
- (2)
- The longitudinal displacement effect of the subgrade filler in the transition section will produce obvious longitudinal push-out deformation under the condition of the seasonal freeze–thaw cycle, and the longitudinal push-out effect of the subgrade filler presents a typical periodic law with the seasonal change, and the longitudinal push-out effect is weaker with the deeper the depth of the lower soil layer on the surface. The thickness of the cushioning material has a good control effect on the longitudinal pushing effect. With the increase of the thickness of the buffer layer, the longitudinal shear effect caused by the subgrade filler is gradually absorbed, and the longitudinal displacement of the subgrade in the transition section is significantly reduced.
- (3)
- At 10 m and 30 m away from the edge of the transition section, two clear frost foci protrusions are formed, and the maximum differential settlement is close to 0.2 m, which will have a significant impact on driving safety and sustainable operation. With the seasonal change, the difference of surface deformation in the transition section is very obvious, which is manifested as the periodic change of the overall deformation with the passage of seasons.
- (4)
- The different surface settlements in the transition section after the buffer layer treatment can also be effectively controlled. When the 5 cm thick cushioning material is used, the maximum settlement of the surface of the road base is reduced by 35%, and the two crest deformations are converted into only one crest deformation. When the material treatment of a buffer layer with a thickness of 15 cm is used, the maximum settlement value of the surface of the roadbed is reduced from 0.2 m to 0.01 m, which has basically no impact on driving safety and comfort. Therefore, adopting this solution can ensure the sustainable operation of the structure.
Author Contributions
Conceptualization, L.D.; Methodology, L.D.; Software, L.D.; Formal analysis, J.L., S.T. and Y.S.; Investigation, J.L.; Resources, J.L. and Y.S.; Writing—review & editing, K.W.; Visualization, K.W.; Supervision, K.W. and S.T. All authors have read and agreed to the published version of the manuscript.
Funding
This research received no external funding.
Institutional Review Board Statement
Not applicable.
Informed Consent Statement
Not applicable.
Data Availability Statement
Data are contained within the article.
Conflicts of Interest
Liang Dong and Yonghua Su were employed by China Academy of Railway Sciences. The remaining authors declare that the research was conducted in the absence of any commercial or financial relationships that could be construed as a potential conflict of interest.
References
- Yang, C.; Tong, X.; Chen, G.; Yuan, C.; Lian, J. Assessment of seismic landslide susceptibility of bedrock and overburden layer slope based on shaking table tests. Eng. Geol. 2023, 323, 107197. [Google Scholar] [CrossRef]
- Tong, X.; Lian, J.; Yang, C.; Zhang, L. Shaking table test on dynamic damage characteristics of bedrock and overburden layer slopes. J. Test. Eval. 2023, 51, 989–1009. [Google Scholar] [CrossRef]
- Choe, T.; Kim, J.; Shin, M.; Kim, K.; Kim, M. Complex disaster response framework to reduce urban disaster vulnerability. Sci. Prog. 2023, 106, 00368504231152770. [Google Scholar] [CrossRef] [PubMed]
- Kim, J.; Park, S.; Kim, M. Safety map: Disaster management road network for urban resilience. Sustain. Cities Soc. 2023, 94, 104650. [Google Scholar] [CrossRef]
- Yang, C.; Tong, X.; Wu, D.; Lian, J.; Ding, X. A new model for mechanical calculation of h-type anti-slide piles. Structures 2023, 56, 104891. [Google Scholar] [CrossRef]
- Lin, C.; Lai, Y.; Wu, S.; Mo, F.; Lin, C. Assessment of potential sediment disasters and resilience management of mountain roads using environmental indicators. Nat. Hazards 2022, 111, 1951–1975. [Google Scholar] [CrossRef]
- Tong, X.; Lian, J.; Zhang, L. Damage evolution mechanism of rock-soil mass of bedrock and overburden layer slopes based on shaking table test. J. Mt. Sci. 2022, 19, 3645–3660. [Google Scholar] [CrossRef]
- You, J.; Muhammad, A.S.; He, X.; Xie, T.; Wang, Z.; Fan, X.; Chen, L.; Wang, C. PANDA: Predicting road risks after natural disasters leveraging heterogeneous urban data. CCF Trans. Pervasive Comput. Interact. 2022, 4, 393–407. [Google Scholar] [CrossRef]
- Xu, Q.; Feng, S.; Sun, Q.; Zhu, X.; Chen, R.; Lihua, X.; Wu, B. A Method of Planning Disaster Emergency Rescue Paths in Road-Free Environment. Comput. Intell. Neurosci. 2022, 2022, 2987852. [Google Scholar] [CrossRef]
- Zhang, M.; Yu, J.; Zhang, Y.; Yu, H. Programming model of emergency scheduling with combined air-ground transportation. Adv. Mech. Eng. 2017, 9, 1687814017739512. [Google Scholar] [CrossRef]
- Zhang, D. Research on the New Technology of the Deformation Remediation of Bridge Head Subgrade in Qinghai-Tibet Railway Permafrost Section. Constr. Des. Proj. 2018, 20, 74–75. [Google Scholar] [CrossRef]
- Wang, J.; Wang, S. Research on Treatment Technology of Bridgehead Subgrade Diseases in Permafrost Region of Qinghai-Tibet Railway. In Proceedings of the Seiminar on Construction Technology of Sichuan-Tbet Railway Proiect, Xi’an, China, 17 April 2019; pp. 423–430. [Google Scholar]
- Penner, E. Pressures Developed during the Unidirectional Freezing of Water-Saturated Porous Materials: Experiment and Theory. Phys. Snow ICE Proc. 1967, 1, 1401–1414. [Google Scholar]
- Williams, P. Properties and Behaviour of Freezing Soils (Tech. Rep. 72); Norwegian Geotechnical Institute: Oslo, Norway, 1967. [Google Scholar]
- Miller, R.D. Freezing and heaving of saturated and unsaturated soils. Highw. Res. Rec. 1972, 393, 1–11. [Google Scholar]
- Miller, R.D. Freezing phenomena in soils. In Applications of Soil Physics; Elsevier Inc.: Amsterdam, The Netherlands, 1980. [Google Scholar]
- Harlan, R.L. Analysis of coupled heat-fluid transport in partially frozen soil. Water Resour. Res. 1973, 9, 1314–1323. [Google Scholar] [CrossRef]
- Tian, Q. Analysis of Horizontal Frost Heaving Force of Abutment in Permafrost Region. Master’s Thesis, Lanzhou Jiaotong University, Lanzhou, China, 2017. [Google Scholar]
- Ma, W.; Wang, D. Frozen Soil Mechanics; Science Press: Beijing, China, 2014. [Google Scholar]
- Xia, L.; Zhou, G.; Liu, Y.; Wang, T.; Yin, Q. Analysis of solar radiation of bridgehead surfaces in permafrost region. Prog. Geophys. 2015, 30, 435–440. [Google Scholar]
- Niu, F.; Liu, H.; Niu, Y. Experimental study of freeze characteristics in roadbed culvert transition along a high-speed railway. Chin. J. Rock Mech. Eng. 2014, 33, 639–647. [Google Scholar]
- Zhou, Y.; Xiong, Z.; Li, T. Reason Analysis and Treatment Measures of Subgrade Defects at Bridgehead in Permafrost regions along Qinghai-Tibet railway. Railw. Stand. Des. 2013, 10, 40–44. [Google Scholar]
- Siddharthan, R.V.; El-Gamal, M.; Maragakis, E.A. Influence of freefield strains on nonlinear lateral abutment stiffnesses. In Proceedings of the Seventh Canadian Conference on Earthquake Engineering, Montréal, QC, Canada, 5 June 1995. [Google Scholar]
- Zhai, W.M.; True, H. Vehicle-track dynamic on a ramp and on the bridge: Simulation and measurement. Veh. Syst. Dyn. 2000, 33, 605–615. [Google Scholar]
- Martin, G.R.; Lam, I.P.; Yan, L.P.; Kapuskar, M.; Law, H. Bridge abutments modelling for seismic response analysis. In Proceedings of the 4th Caltrans Seismic Research Workshop, Sacramento, CA, USA, 9–11 July 1996. [Google Scholar]
- Martin, G.R.; Yan, L.P.; Lam, I.P. Development and Implementation of Improved Seismic Design and Retrofit Procedures for Bridge Abutment. Final Report on a Research Project Funded by the California Department of Transportation; UC Berkeley Transportation Library: Berkeley, CA, USA, 1997. [Google Scholar]
- Hayashi, K.; Suzuki, T.; Toyota, K. Study on the shape of freezing front and frost heave damage of C-box structure. In Current Practices in Cold Regions Engineering; ASCE: Reston, VA, USA, 2006; pp. 1–14. [Google Scholar]
- Yang, G.; Liu, X.; Ye, Q. Analysis of technical measures for the transition section between subgrade and bridge of high-speed railway. Railw. Stand. Des. 1999, 38–39. [Google Scholar]
- Zhao, T.; Fu, S. FEA on the Form of Transition Zone between Bridge and Embankment in Hanyi Railway Project. J. Xuzhou Inst. Technol. 2012, 27, 78–84. [Google Scholar]
- Tian, Y.; Liu, J.; Peng, L. Experiment on Ground Temperature Field and Deformation of Bridge subgrade Transition Section in Permafrost Regions. China J. Highw. Transp. 2007, 20, 19–24. [Google Scholar]
- Liu, J.; Bao, W.; Han, X. Observation and Analysis of a New Type Embankment-Bridge Transition Section in Permafrost Regions. Glacial Permafr. 2004, 26, 800–805. [Google Scholar]
- Niu, F.; Lin, Z.; Lu, J. Study of the influencing factors of roadbed settlement in embankment-bridge transition section along Qinghai-Tibet Railway. Geomechanics 2011, 32, 372–377. [Google Scholar]
- Zhang, Y.; Du, Y. Temperature distribution analysis of high-speed railway roadbed in seasonally frozen regions based on empirical model. Cold Reg. Sci. Technol. 2015, 114, 61–72. [Google Scholar] [CrossRef]
- Liu, J.; Qian, H.; Xu, P. Research on the influencing factors and control measures of the construction period of the Sichuan-Tibet Railway. Railw. Stand. Des. 2022, 66, 1–8. [Google Scholar]

Disclaimer/Publisher’s Note: The statements, opinions and data contained in all publications are solely those of the individual author(s) and contributor(s) and not of MDPI and/or the editor(s). MDPI and/or the editor(s) disclaim responsibility for any injury to people or property resulting from any ideas, methods, instructions or products referred to in the content. |
© 2024 by the authors. Licensee MDPI, Basel, Switzerland. This article is an open access article distributed under the terms and conditions of the Creative Commons Attribution (CC BY) license (https://creativecommons.org/licenses/by/4.0/).