Article

Techno-Economic Factors Impacting the Intrinsic Value of Behind-the-Meter Distributed Storage

School of Engineering, Edith Cowan University, Joondalup, WA 6027, Australia
*
Author to whom correspondence should be addressed.
Sustainability 2024, 16(23), 10432; https://doi.org/10.3390/su162310432
Submission received: 22 October 2024 / Revised: 23 November 2024 / Accepted: 24 November 2024 / Published: 28 November 2024

Abstract

:
With the increasing adoption of renewable energy, there is a growing need for efficient storage solutions. Battery storage is becoming an essential tool for maintaining grid reliability and handling the variable nature of renewable energy sources. This research focuses on behind-the-meter, grid-connected household systems in Western Australia, adopting a consumer perspective to evaluate the financial viability of residential batteries. Using the HOMER Grid for techno-economic modeling, eight factors influencing financial viability were analyzed, with results validated through two external case studies. The findings suggest that photovoltaic (PV) systems paired with batteries can be cost-effective at current prices, depending on load profiles, tariffs, and grid sale limits. However, many factors lie outside the consumer’s control, contributing to significant financial uncertainty and limiting widespread battery adoption. Eliminating flat tariffs could make PV + Battery systems financially viable, although this may negatively affect other consumers on the grid. Even with a 30% reduction in battery price, PV-only systems remain optimal for many households. This study concludes that addressing and reducing consumer uncertainty is essential for encouraging the wider adoption of residential battery storage systems. At the same time, non-financial motivations such as energy independence or environmental concerns may drive early adopters in the interim.

1. Introduction

As global warming continues to pose a critical threat, the world is increasingly moving toward renewable energy sources to reduce carbon emissions and create more sustainable energy systems [1,2,3]. In response to this, the electricity industry is transforming globally from a ‘load-following’ approach [4], which reliably delivered power for decades, into a ‘generation-following’ approach [5] to address the needs of decarbonization and bi-directional power flow [6]. This shift is driven by technological advancements such as smart grids [7], smart meters [8], smart appliances [9], demand response mechanisms [10], demand dispatch [11], time-of-use (TOU) pricing [12], and vehicle-to-grid (V2G) [13] power integration. At the core of this transition is the changing role of consumers. Households can now generate and store their energy, participate in community batteries or virtual power plants (VPPs) [14], or even disconnect entirely from the grid. This shift presents opportunities for early adopters and environmentally conscious consumers to engage in the energy transition actively. As illustrated in Figure 1, the energy storage system (ESS) provides various benefits across different power system segments, from generation to residential consumers [15]. In the generation sector, ESS aids in generation offset and peaking power reduction, contributing to lower emissions and enhanced sustainability [16]. ESS reduces transmission congestion, defers investments, and improves voltage stability and power quality in transmission and distribution. For retailers, ESS enhances customer engagement, opens new revenue streams, and supports demand response programs, enabling more efficient grid management. On the residential side, ESS offers multiple advantages, including lower bills, improved reliability, cost stability, and enabling participation in VPPs [17]. This research is part of a larger project investigating distribution-level storage from a consumer perspective, specifically focusing on ‘behind-the-meter’ storage. The primary goal is to explore the financial viability of residential batteries for households in Western Australia.

1.1. Background and Motivation

Western Australia is uniquely positioned to serve as a case study for renewable energy integration due to its abundant natural resources, including solar, wind, tidal, wave, and geothermal energy. It is also home to one of the most extensive isolated electricity grids globally, the South-West Interconnected System (SWIS) [18]. As the penetration of renewable energy increases, mainly from rooftop solar, Western Australia provides a rich context for studying the impacts of renewable adoption on electricity networks [19].
Rooftop solar has rapidly become the largest source of electricity generation on the SWIS, with distributed photovoltaic (DPV) systems increasing in popularity [20]. Western Australia has some of the highest installed capacity of DPV globally [21]. Recently, Western Australia set new records for renewable energy generation, with nearly 40% of the state’s electricity coming from renewable sources and an instantaneous renewable penetration level reaching 80%, of which 60% was contributed by rooftop solar. These milestones continue to be surpassed as renewable energy adoption accelerates [22,23].
However, this rapid uptake of rooftop solar has introduced significant challenges for grid security and reliability. In response, network operators in Western Australia were granted the authority to disconnect new photovoltaic (PV) installations as a last resort in 2022 [24]. The growing share of renewable energy introduces new complexities in grid management, especially in isolated systems like SWIS, where balancing supply and demand becomes increasingly difficult. One of the significant challenges facing Western Australia’s energy system is the “duck curve” effect, where high levels of solar generation during the day lead to low net demand, followed by sharp increases in the evening when solar output decreases, but demand remains high [20,25]. This effect is not unique to Western Australia; similar duck curves are also found elsewhere in Australia.
Fast-responding battery storage can mitigate these issues, and understanding its feasibility from a consumer perspective is critical in regions like Western Australia, where renewable adoption is rapidly advancing. The integration of fast-responding battery storage is emerging as one of the leading solutions for managing the intermittency and grid stability issues caused by high penetration of renewables [26].

1.2. Energy Storage Options

Battery storage is considered one of the most cost-effective options in Western Australia [27]. This research focuses on two main types of distribution-level energy storage solutions. The first type is behind-the-meter residential batteries installed at the household level. These systems help reduce energy bills, provide backup power during outages, and offer the potential for energy independence [28]. Residential batteries are already being integrated into the longer-term system planning in Western Australia, with expectations that battery costs will decrease significantly by 2030 [29,30]. The second type of energy storage solution involves community batteries and Virtual Power Plants (VPPs) [31]. These systems allow multiple households to share energy storage resources and contribute to grid stabilization by offering services such as frequency regulation. Community battery pilot programs in Western Australia have been well-received, and network operators view them as a promising solution to both consumer and grid-related challenges [32,33]. These shared storage solutions can potentially address issues related to renewable energy intermittency while enhancing the overall resilience of the energy network. Nevertheless, challenges remain in terms of tariffs, viability, and ownership structures [34,35].

1.3. Challenges and Current State of Residential Battery Adoption

Although battery storage is embedded in long-term system planning in Western Australia, residential battery adoption has lagged behind rooftop solar. Like elsewhere in Australia, residential battery take-up is still in its early adopter phase [36,37]. This slow adoption is primarily attributed to the high cost of installing batteries, resulting in payback periods that often exceed the warranty period [38,39]. Initiatives such as TOU import tariffs and lower time-based export tariffs have been introduced to improve battery price signals. For example, the original export tariff in Western Australia was 0.40 AUD/kWh, but like elsewhere in Australia, this has since dropped substantially, and new customers now receive 0.10 AUD/kWh during peak periods (3–9 pm) and 0.025 AUD/kWh at other times [40,41]. Nevertheless, these tariff reductions and the lack of battery subsidies in Western Australia further complicate the financial case for residential batteries. Households may invest in batteries for various reasons, including reducing energy bills, ensuring backup power during outages, moving off-grid, or for broader environmental and sustainability motivations [42,43]. However, research indicates that financial criteria, such as payback periods, play a more significant role in decision-making than expected [44]. This is relevant given that there are no subsidies for residential batteries in Western Australia, and similar programs across the country are being scaled back [30,45,46].

1.4. Literature Review

To the best of our knowledge, no comprehensive techno-economic studies have focused explicitly on behind-the-meter residential battery systems in Western Australia. However, several studies from other regions of Australia offer valuable insights and can serve as reference points for understanding the potential of residential battery storage in Western Australia. The study by [47] found a positive return on investment for battery storage in only one load scenario. In contrast, [48] concluded that a PV + Battery system was profitable under TOU tariffs for all customer load profiles analyzed. The study of [49] argued that a 50% reduction in battery prices would be necessary to make PV + Battery systems financially viable. The study in [50] focused on the impact of tariff structures on battery sizing and concluded that TOU tariffs consistently offer higher financial returns than flat tariffs. They also determined that optimal battery sizing depends on the tariff structure and the energy management approach. In [51], the study employed an integrated modeling approach to examine household battery systems’ network and residential benefits. This study’s findings indicated that residential batteries are not yet financially profitable for households but offer substantial benefits to the network by deferring the need for network augmentation. This research advocates for a collaborative approach between network operators and prosumers (producing consumers), wherein households would be rewarded for contributing to grid resilience. In the study of U.S. consumers [52], found that while PV systems were financially attractive for most households, adding batteries generally reduced the financial appeal. However, the financial attractiveness of PV + Battery systems improves when feed-in tariffs (FIT) are reduced and electricity prices rise.
Several other studies have examined different aspects of battery energy storage systems, particularly focusing on the factors that influence consumer choices [53,54,55]. One of the primary factors is the dramatic price drop in lithium-ion batteries, which have decreased by 97% over the past thirty years [56]. Table 1 compares the key motivations for adopting residential battery storage.
The literature has identified several challenges associated with residential battery storage, particularly regarding financial viability and market complexity. These challenges affect the adoption of battery storage systems and influence residential consumers. Table 2 compares the key challenges, highlighting the insights and impacts drawn from various studies. These underscore the need for significant cost reductions and a more transparent market structure to make battery storage more attractive to consumers.

1.5. Highlights and Contribution

This research investigates the critical techno-economic factors that influence the intrinsic value of residential battery storage from a consumer perspective, focusing on Western Australia. This study makes several significant contributions to the field by evaluating the financial viability of residential battery systems under both current and projected battery prices. Additionally, it analyzes the impact of various tariff structures, including export, TOU, and flat tariffs, on the financial returns from battery storage. Beyond financial considerations, the research also explores non-financial drivers for residential battery adoption, such as the need for backup power during outages and environmental motivations. Key highlights of the study include the following:
  • Assessment of the financial viability of residential battery systems in fluctuating battery prices;
  • Examination of the role of import tariff structures (TOU vs. flat), export, feed-in tariffs (FIT), and restrictions in determining the economic returns from residential battery storage;
  • Investigating non-financial motivations such as backup power reliability and environmental sustainability in consumer decision-making;
  • Consideration of the possible impact on consumer motivation and confidence in the energy transition.
The structure of this paper is as follows: Section 2 describes the research methodology, including the case study reproduction, sensitivity analyses, and modeling techniques employed. Section 3 presents the results, offering a detailed analysis of the financial viability of residential battery storage systems. Finally, Section 4 concludes the paper by summarizing the key findings and insights drawn from the research.

2. Methodology

This research employed a robust multi-step modeling approach to evaluate the financial viability of residential battery systems in Western Australia. The methodology involved using three different modeling programs, each serving a distinct purpose in validating the results and conducting detailed sensitivity analyses. The modeling focused on determining under which conditions residential batteries become financially viable, particularly regarding the Net Present Cost (NPC) metric. Below is a detailed breakdown of the methodology employed:

2.1. Case Study Reproduction for Model Validation

The initial step in the modeling process involves validating the methodology by reproducing results from two established case studies based in Western Australia. These case studies were selected for their focus on residential battery applications in Perth, enabling a direct comparison of financial and technical outcomes. Validation is a critical process, as it ensures that the chosen methodology, tools, and assumptions can accurately replicate results, thereby establishing the reliability of the approach for subsequent analysis. Successful replication of these outcomes lays a solid foundation for further advanced sensitivity analyses.

2.1.1. Selection of Case Studies

  • Case Study A [63]: This study examines the payback periods of residential battery systems across eight Australian capital cities, including Perth. It considers a variety of scenarios based on three household load profiles and two tariff structures (flat and time-of-use, or TOU). The study’s financial viability criterion is that the battery system must recoup its costs within its warranty period. This comprehensive assessment allows a thorough understanding of the factors influencing payback times;
  • Case Study B [64]: Focusing on a typical household in Perth (two adults and two children), this study compares three energy configurations: grid-only, grid combined with a 6 kW PV system, and grid with a 6 kW PV system plus a 7 kWh battery. It provides detailed information on system costs, load profiles, and operational parameters, making it an ideal candidate for model validation. The comprehensive data from this study supports a robust analysis of the financial returns on residential battery systems.

2.1.2. Modeling Tools and Software

The modeling is conducted using HOMER Grid Version 1.8.2, a widely recognized software tool for optimizing behind-the-meter distributed generation systems, particularly those that involve renewable energy and storage components. HOMER Grid offers comprehensive capabilities for simulating energy systems, optimizing component sizing, and analyzing economic performance under various tariff structures, export tariffs, restrictions, and load conditions. It allows for detailed modeling of residential PV and battery systems, making it well-suited for this research. The tool’s optimization features are particularly useful in identifying the most cost-effective system configurations, and its ability to model real-world tariff structures, such as TOU and flat rates, provides the necessary flexibility for this study. A custom Excel-based economic modeling tool was also developed specifically for this research. This tool provided two key advantages:
  • Verification of HOMER Grid results: The Excel model was used to cross-check the outputs from HOMER Grid to ensure accuracy and consistency;
  • Additional analysis: Certain economic analyses that were not feasible within HOMER Grid were conducted using the Excel tool, such as more detailed examinations of tariff impacts and battery replacement scenarios.

2.1.3. Data Inputs and Assumptions

Specific data inputs and assumptions are adopted to replicate the selected case studies. The load profiles for each household type, as provided in the original case studies, are directly input into the HOMER Grid. These profiles reflect typical daily energy consumption patterns for the corresponding household types in Perth. System configurations, including PV and battery capacities, are set to match the specifications in the original reports. For example, Case Study A includes configurations such as a 5 kW PV system with a 3.5 kWh battery for one load profile. In contrast, Case Study B considers a 6 kW PV system with a 7 kWh battery. Capital, operational, maintenance, and replacement costs are also incorporated per the original studies, ensuring consistency in cost parameters. The residential batteries modeled in this study were assumed to be Lithium-Ion batteries, with an initial installed cost of 1000 AUD/kWh, as cited in various studies [65]. The replacement battery cost was modeled at 500 AUD/kWh to account for expected future reductions in battery costs. This price decline assumption aligns with cost trends in other renewable energy technologies, such as solar panels. The installed cost of PV panels is modeled at 900 AUD/kW [66]. Each simulation was conducted over a 25-year project lifetime, which required the inclusion of at least one battery replacement, typically around the 10-year mark. This long-term perspective ensured the economic analysis captured the systems’ total lifecycle costs and benefits. Flat and TOU tariffs are also modeled according to the rates reported in the case studies, enabling an accurate comparison of financial performance under different tariff structures. Technical parameters, such as system efficiency, battery depth of discharge, lifespan, and degradation rates, are also aligned with the original case study data.

2.2. Sensitivity Analysis

Building upon the insights from the case study reproduction, the next step is a comprehensive sensitivity analysis to investigate the financial viability of residential batteries in Western Australia. This stage represents most of the research and explores various economic and operational factors that could impact the NPC of residential battery systems. Eight key parameters are identified and analyzed:
  • Battery Price Reduction: A range of cost multipliers from 0.5 to 1.0 is applied to both new and replacement battery prices. This reflects potential future declines in battery costs, similar to trends observed in other renewable technologies such as solar PV;
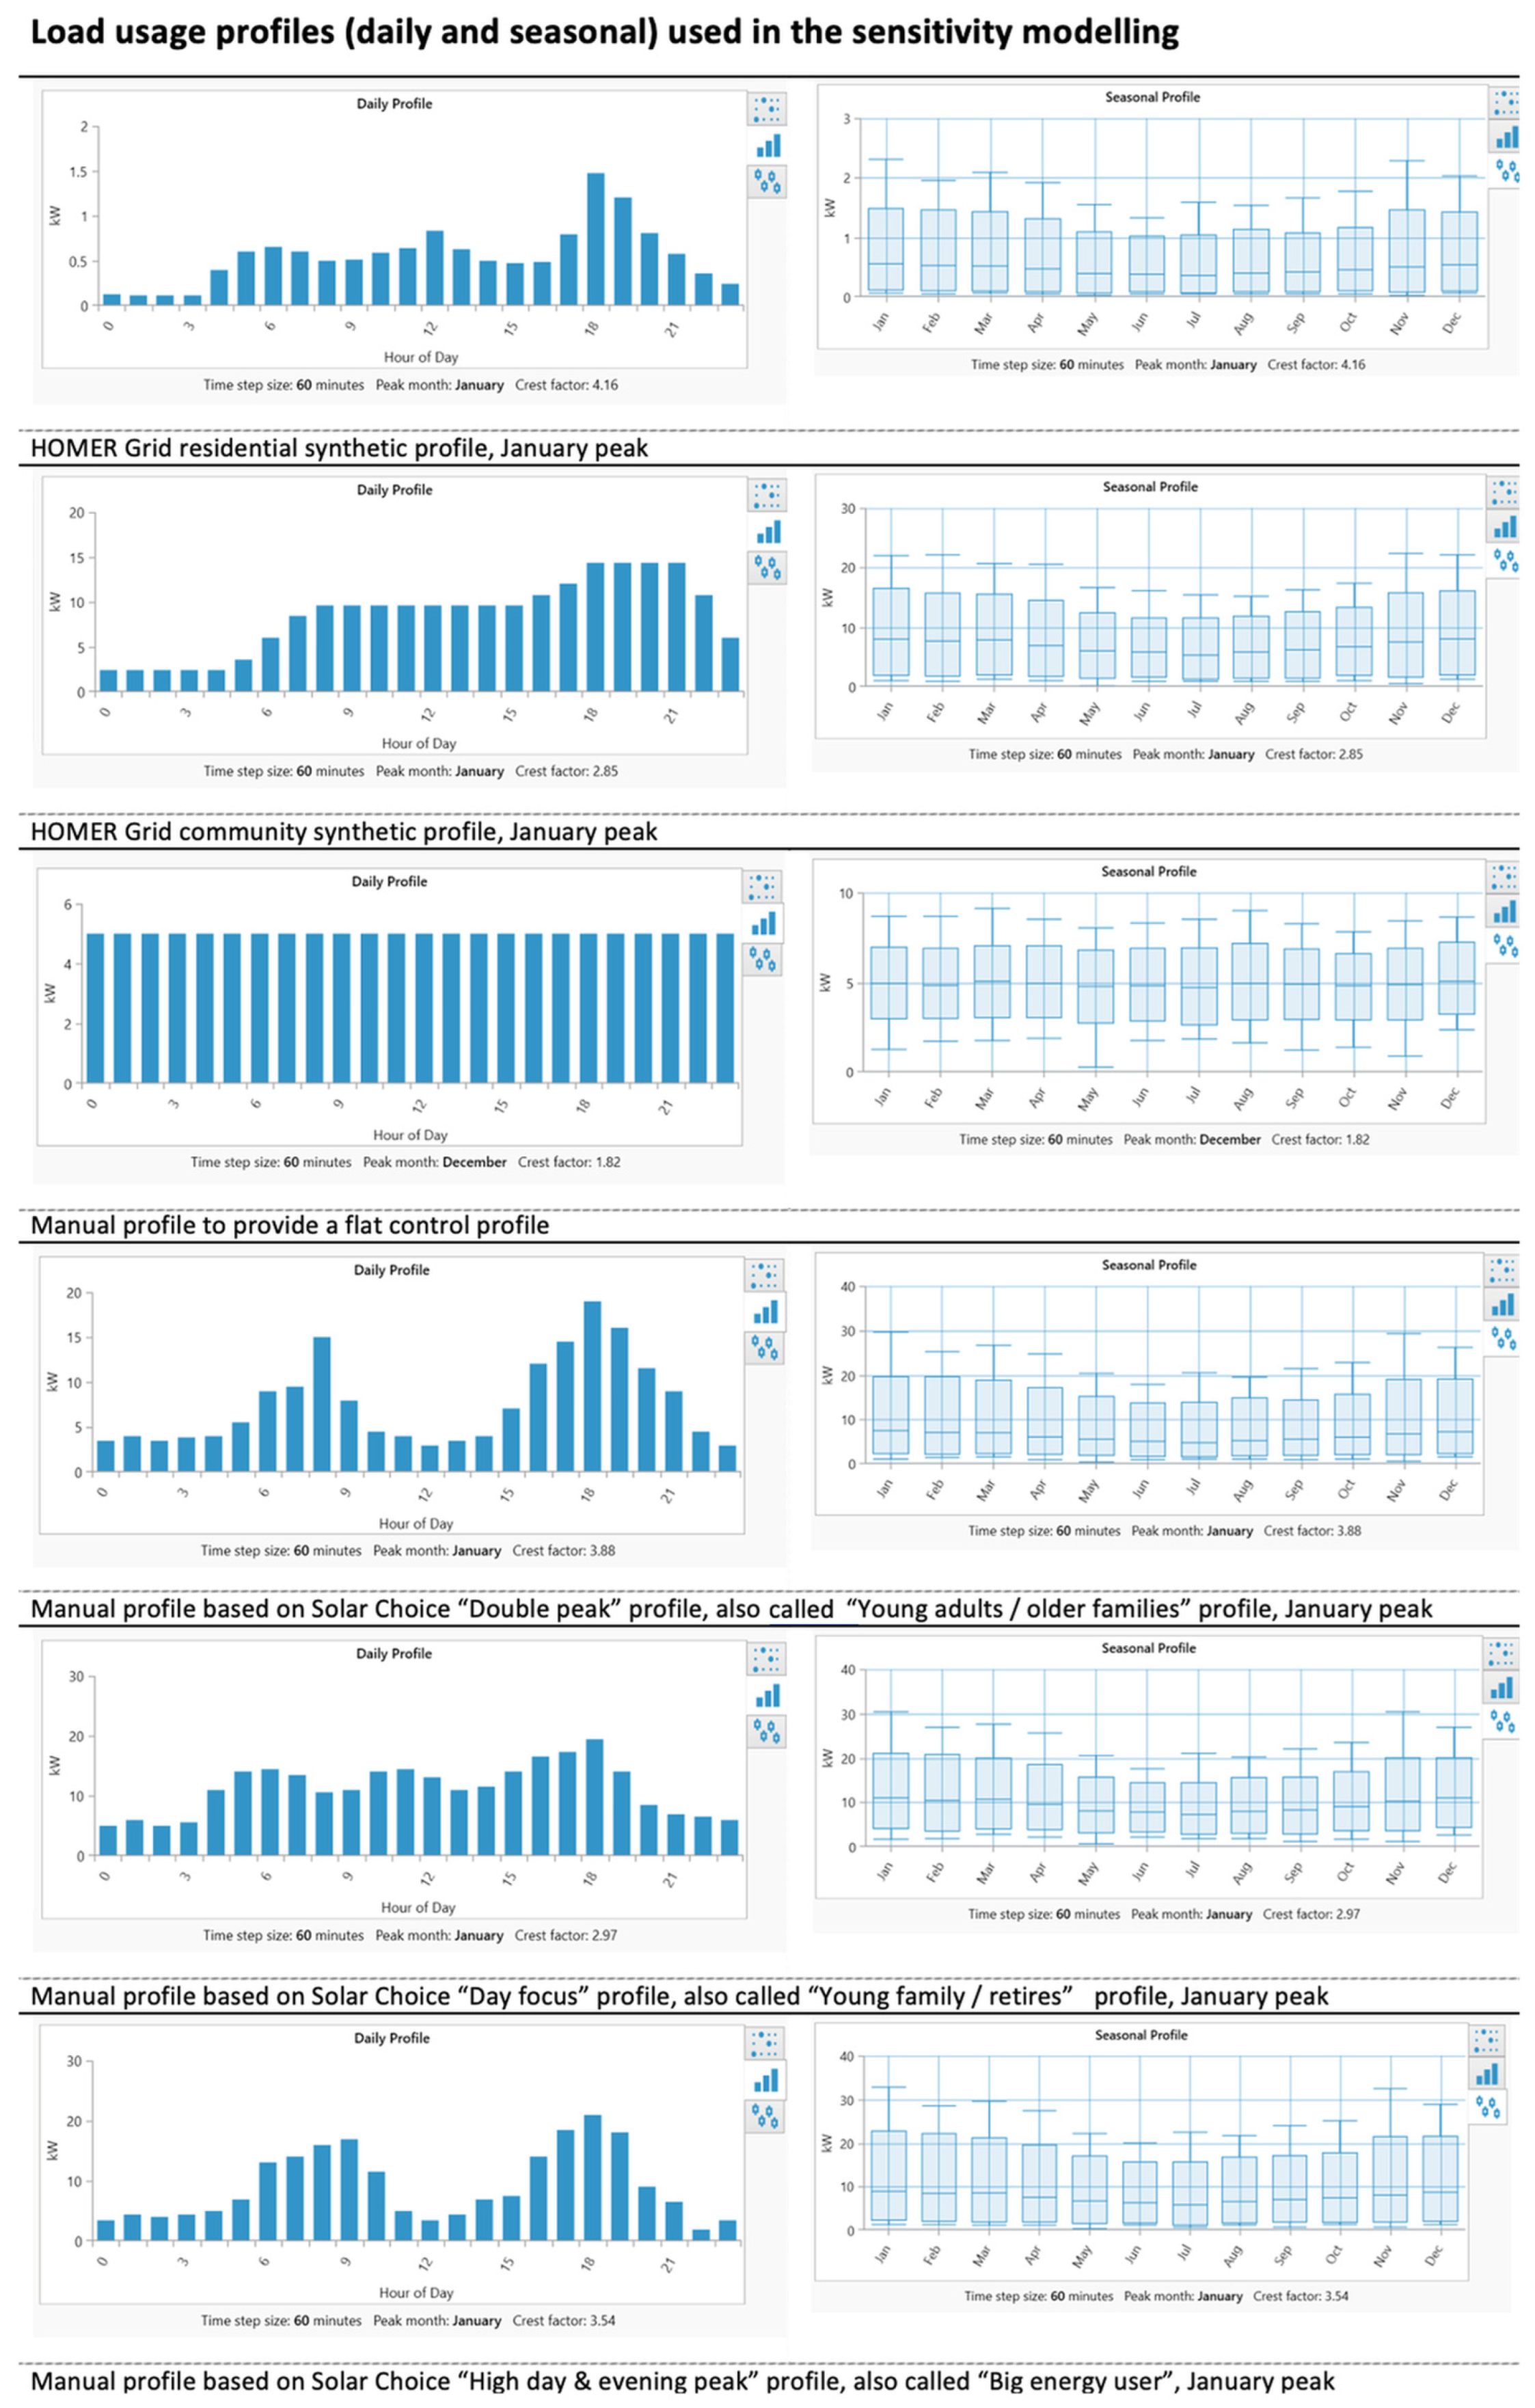
  • Load Profiles: Six different residential load profiles simulate different household energy consumption patterns, accounting for energy demand variations that could influence battery systems’ performance and financial return;
  • Average Daily Load: The analysis examines a range of daily load values, from 10 kWh/day to 70 kWh/day, to account for households with varying energy needs;
  • Tariff Structures: Three different tariff structures are modeled based on Synergy’s 2022 tariffs: A1 (flat tariff), Smart Home, and Midday Saver (TOU tariffs). The Western Australia Distributed Energy Buyback Scheme (DEBS) export tariff is also included. Sensitivity simulations are conducted to explore the effects of tariff changes, such as removing the Smart Home tariff and adjusting the DEBS export tariff’s non-peak component;
  • Grid Sales Limit: This parameter varies from 0 kW to 15 kW to examine how limits on the amount of electricity sold back to the grid affect financial outcomes;
  • Discount Rates: Discount rates ranging from 0% to 15% are incorporated to reflect different perspectives on the time value of money, which is critical for long-term investment decisions;
  • Carbon Emissions Penalty: A range of carbon dioxide emissions penalties from 0 AUD/t to 150 AUD/t is modeled to assess the impact of potential future carbon pricing on the financial viability of battery systems;
  • Optimal System Sizing: Each simulation evaluates the optimal sizing of the battery and PV systems to minimize the NPC while meeting household demands.
Table 3 shows the variables used in the different simulations. This analysis aims to identify the specific conditions under which residential battery systems become financially viable in Western Australia. It mainly focused on balancing upfront costs, ongoing savings, and tariff structures. The simulations assume a 25-year lifespan and a PV cost of 900 AUD per kW across all scenarios. The simulations use a standard initial battery cost of 1000 AUD per kWh, except in specific scenarios (10A and 10B), where this cost is reduced to AUD 700, or (10C), where the initial battery cost is reduced to 800 AUD per kWh.

2.3. Economic Analysis for Early PV Adopters

The third stage of the research involves a high-level economic analysis of early adopters of rooftop PV systems in Western Australia. The initial high feed-in tariffs (FITs) offered to early PV adopters were instrumental in driving the uptake of solar systems in the region despite the high upfront costs at the time. This analysis explores whether lessons from the early PV adoption experience can be applied to adopting residential battery systems. Specifically, the research investigates whether similar incentives or tariff structures could accelerate battery adoption like FITs boosted rooftop solar uptake.

3. Results and Discussion

This paper presents a detailed techno-economic model designed to assess the financial viability of residential battery systems in the near term, focusing on Western Australia. The model explores key factors affecting the economic feasibility of battery storage, including various household load profiles and tariff structures.

3.1. Modeling Case Studies

3.1.1. Case Study A

Case Study A analyzed 48 scenarios across eight Australian capital cities, exploring three load profiles and two tariff structures (flat and TOU). The primary criterion used by this case study was that a battery system should, at a minimum, pay for itself within its warranty period. This study found that only four scenarios had payback periods shorter than the warranty period, with the best-performing cases being in Perth. This research focused on all six Perth-based scenarios, which examined three different load profiles, including 20 kWh/day (“Young Adults/Older Family”), 30 kWh/day (“Young Family/Retirees”), and 50 kWh/day (“Big Energy User”) under both flat and TOU tariffs. The results of this research reproduced the Case Study A findings for the Perth-based scenarios, as shown in Table 4. Key results include the following:
  • Under TOU tariffs, the battery system’s payback period was shorter than the warranty period for the “Big Energy User” (50 kWh/day) and “Young Family/Retirees” (30 kWh/day) load profiles, indicating that the battery was financially viable in these scenarios;
  • For the remaining cases, the payback period exceeded the battery warranty under flat tariffs, where the financial performance of the battery was less favorable.
In addition to reproducing Case Study A results, this research further analyzed whether the financial viability of batteries remains optimal even when considering alternative system configurations. The system component sizes were adjusted using the HOMER Grid optimization tool to identify the most cost-effective solution. When optimizations were applied, only the “Young Family/Retirees” (30 kWh/day) load profile retained the PV + battery configuration as the most cost-effective solution. The HOMER Grid optimization selected a significantly more extensive PV array (15.9 kW instead of 6.6 kW) and a smaller battery (4 kWh instead of 6.6 kWh), demonstrating that a larger solar array and smaller battery improved the system’s overall financial performance. According to Table 5, the fixed system sizes from Case Study A suggested that a PV + battery system would yield the best financial return for the “Big Energy User” (50 kWh/day) profile.
HOMER Grid’s optimization identified a 21.9 kW PV-only system as the most financially optimal solution, offering the lowest NPC and LCOE of 0.0925 AUD/kWh, as shown in Table 6. The second-best system included a 1 kWh battery with a similarly sized PV array, offering marginal financial benefits. The third-best system included a larger 10 kWh battery, which resulted in an AUD 11,000 increase in NPC compared to the top-ranking PV-only system. The analysis further compared the original fixed system sizes with the optimized results. Adding a small 1 kWh battery to the system provided minimal benefit, while the third-best system, which included a larger 10 kWh battery, resulted in significantly higher costs, with an LCOE of 0.104 AUD/kWh.

3.1.2. Case Study B

For Case Study B, the research focused on a typical Perth household (two adults and two children) and compared three configurations: grid-only, grid + 6 kW PV, and grid + 6 kW PV + 7 kWh battery. Case Study B concluded that the blended average price of electricity over ten years would decrease from 0.315 AUD/kWh for the grid-only solution to 0.25 AUD/kWh for the PV-only configuration and 0.213 AUD/kWh for the PV + battery setup. The model developed for this research successfully replicated the results for both the grid-only and PV-only configurations. However, for the PV + battery configuration, this research found that the PV-only system remained the most cost-effective solution, contrary to the findings of Case Study B. The divergence in results underscores the importance of considering specific local factors, such as variations in load profiles and system component sizing, when evaluating the battery’s financial viability.

3.2. Sensitivity Analysis

Modeling Program 2 built on the findings from the external case studies, using sensitivity modeling to identify the impact of the eight factors on battery financial viability. The modeling incorporated six synthetic load profiles: three derived from Case Study A profiles, two inbuilt HOMER Grid profiles (residential and community profiles), and a flat control profile. The six synthetic load profiles can be seen in Figure 2. Three sensitivity simulations explored the inter-relationship between the battery price, grid export limits, discount rate, and CO2 emissions penalty. The objective was to understand the boundaries for when a PV + Battery configuration is optimal. Over 50 HOMER Grid simulations were run, with each simulation providing complex, multivariable outputs. After considering and trialing various alternatives, a “mosaic diagram” concept was developed to analyze the trends from the simulation results. Each diagram comprises “tiles” of graphical 3-variable outputs from comparable sets of HOMER simulations.

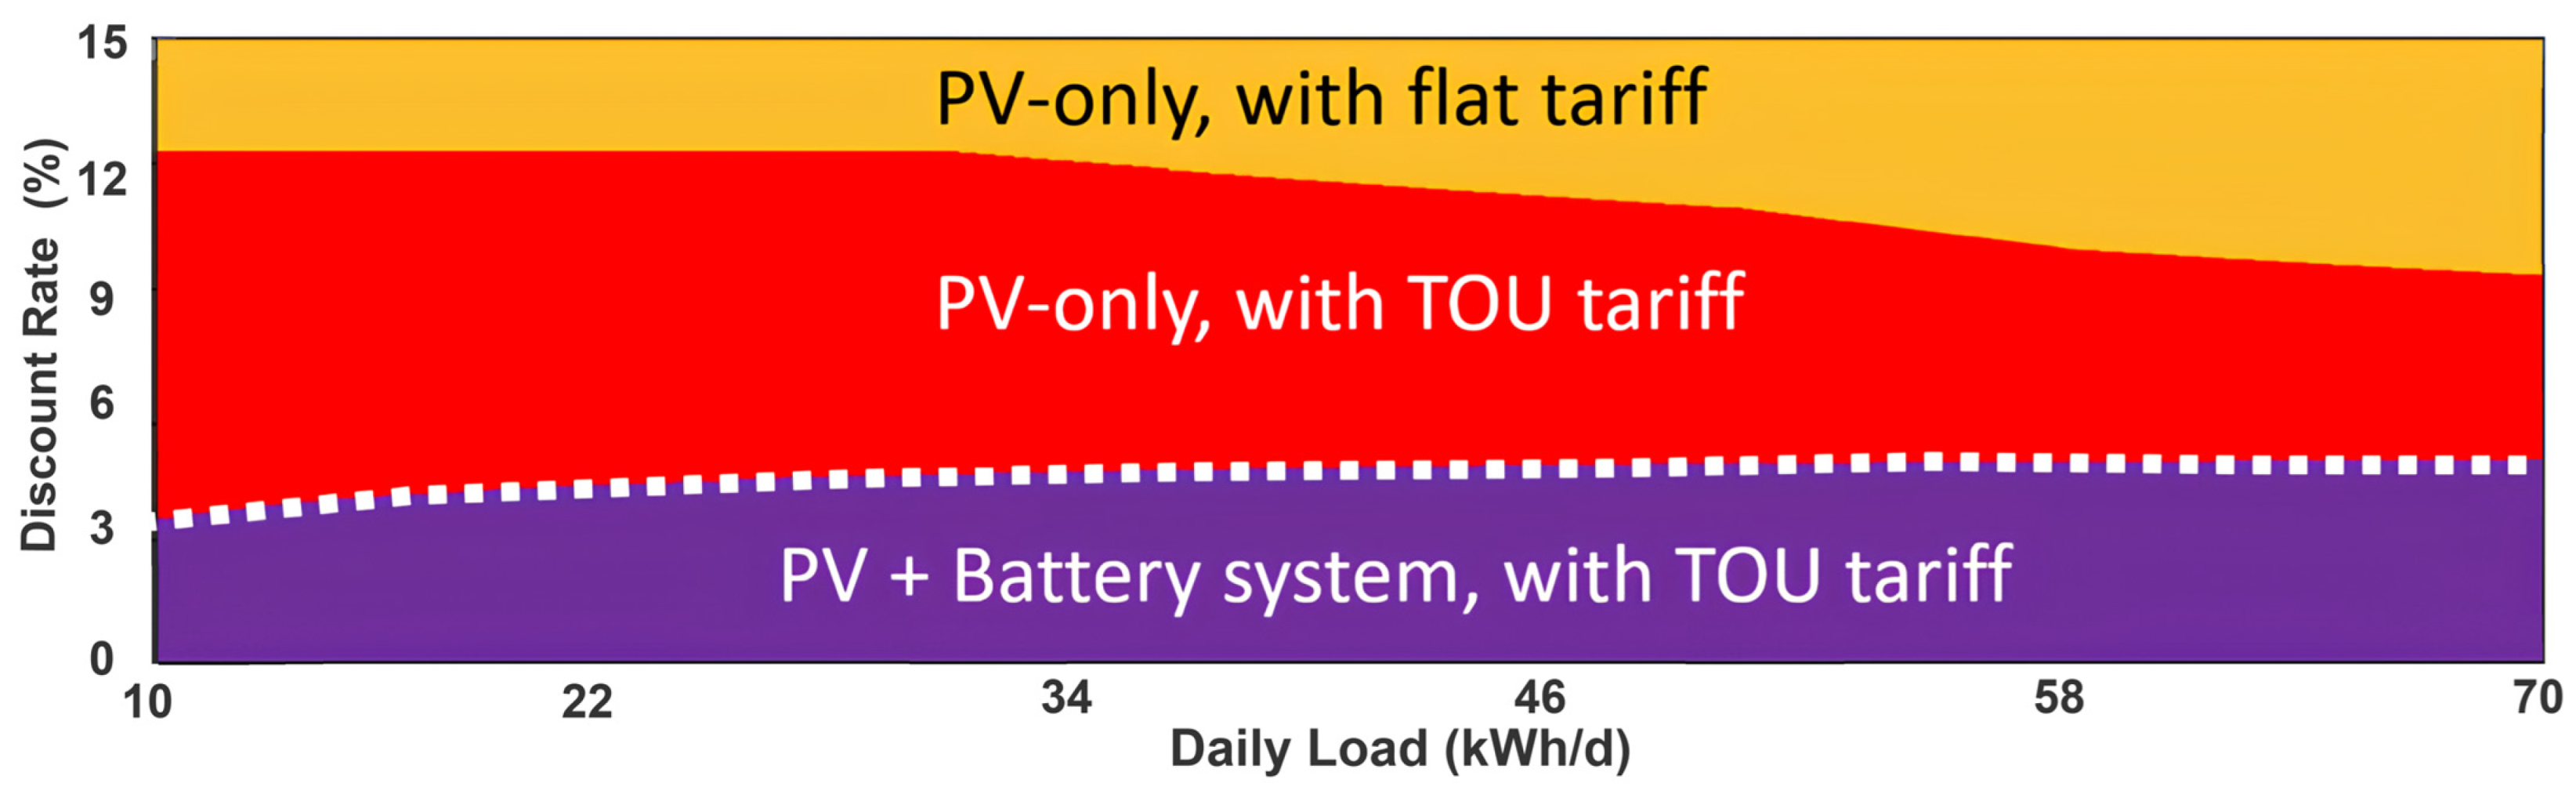
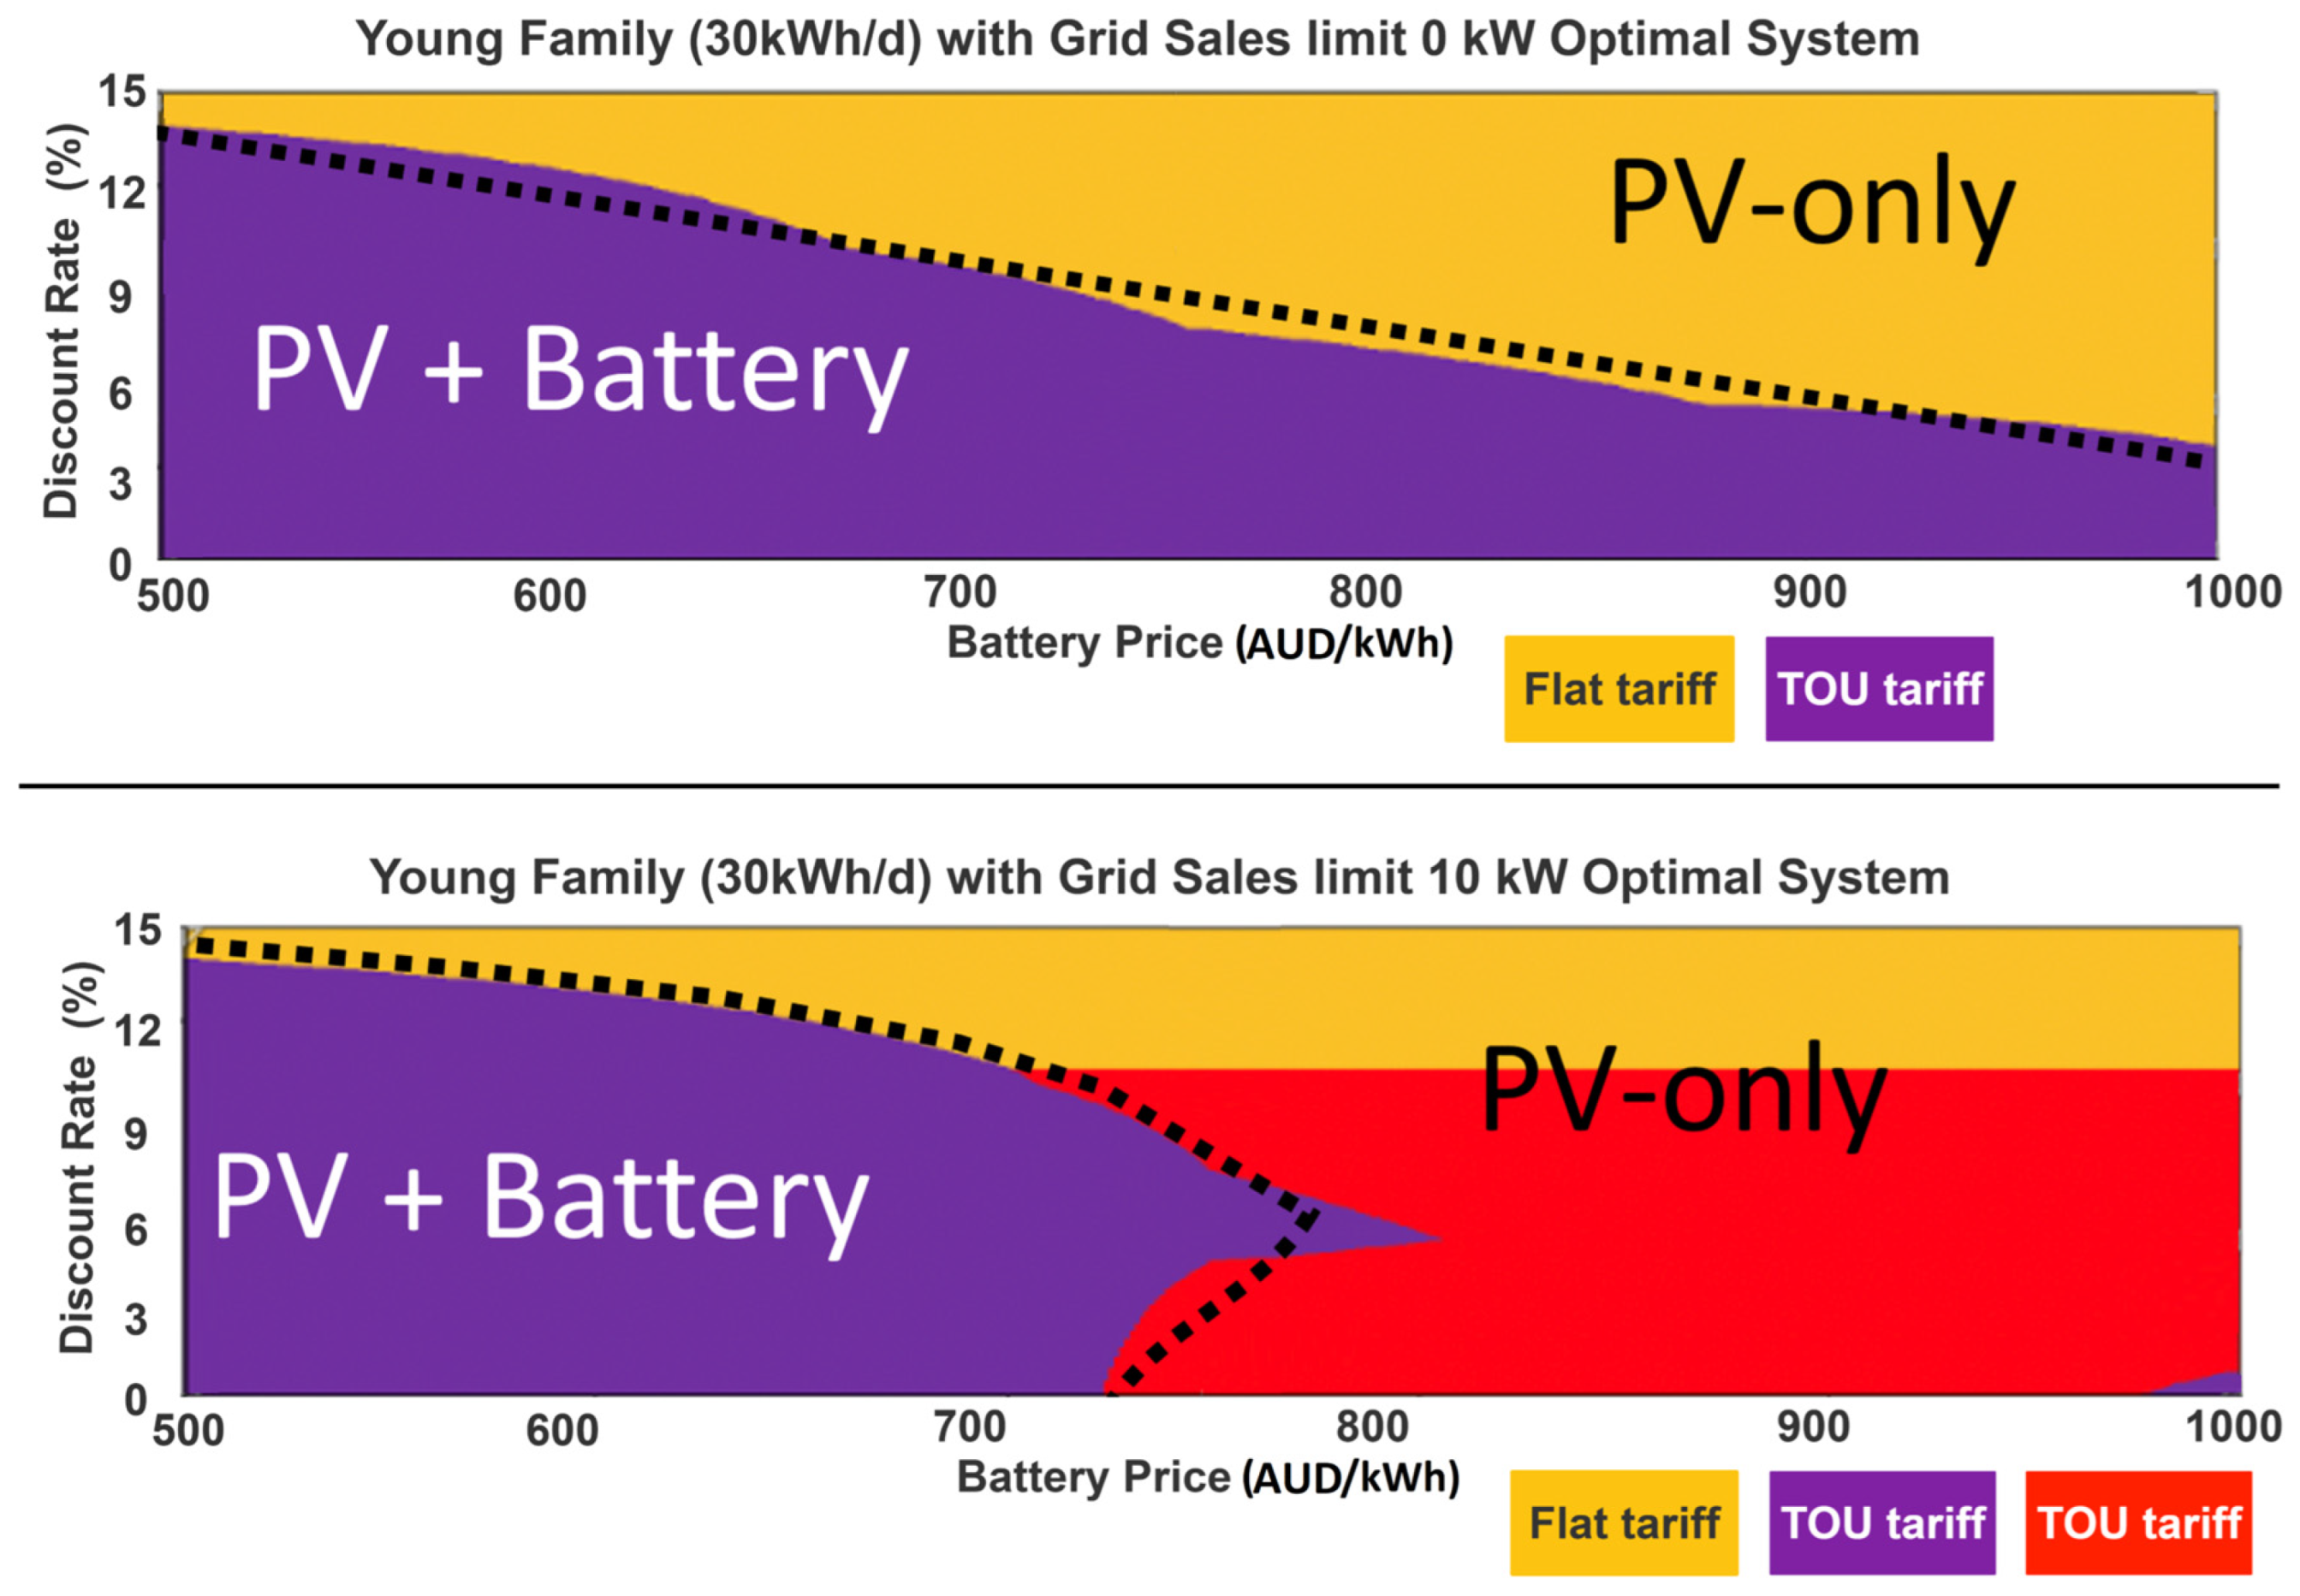
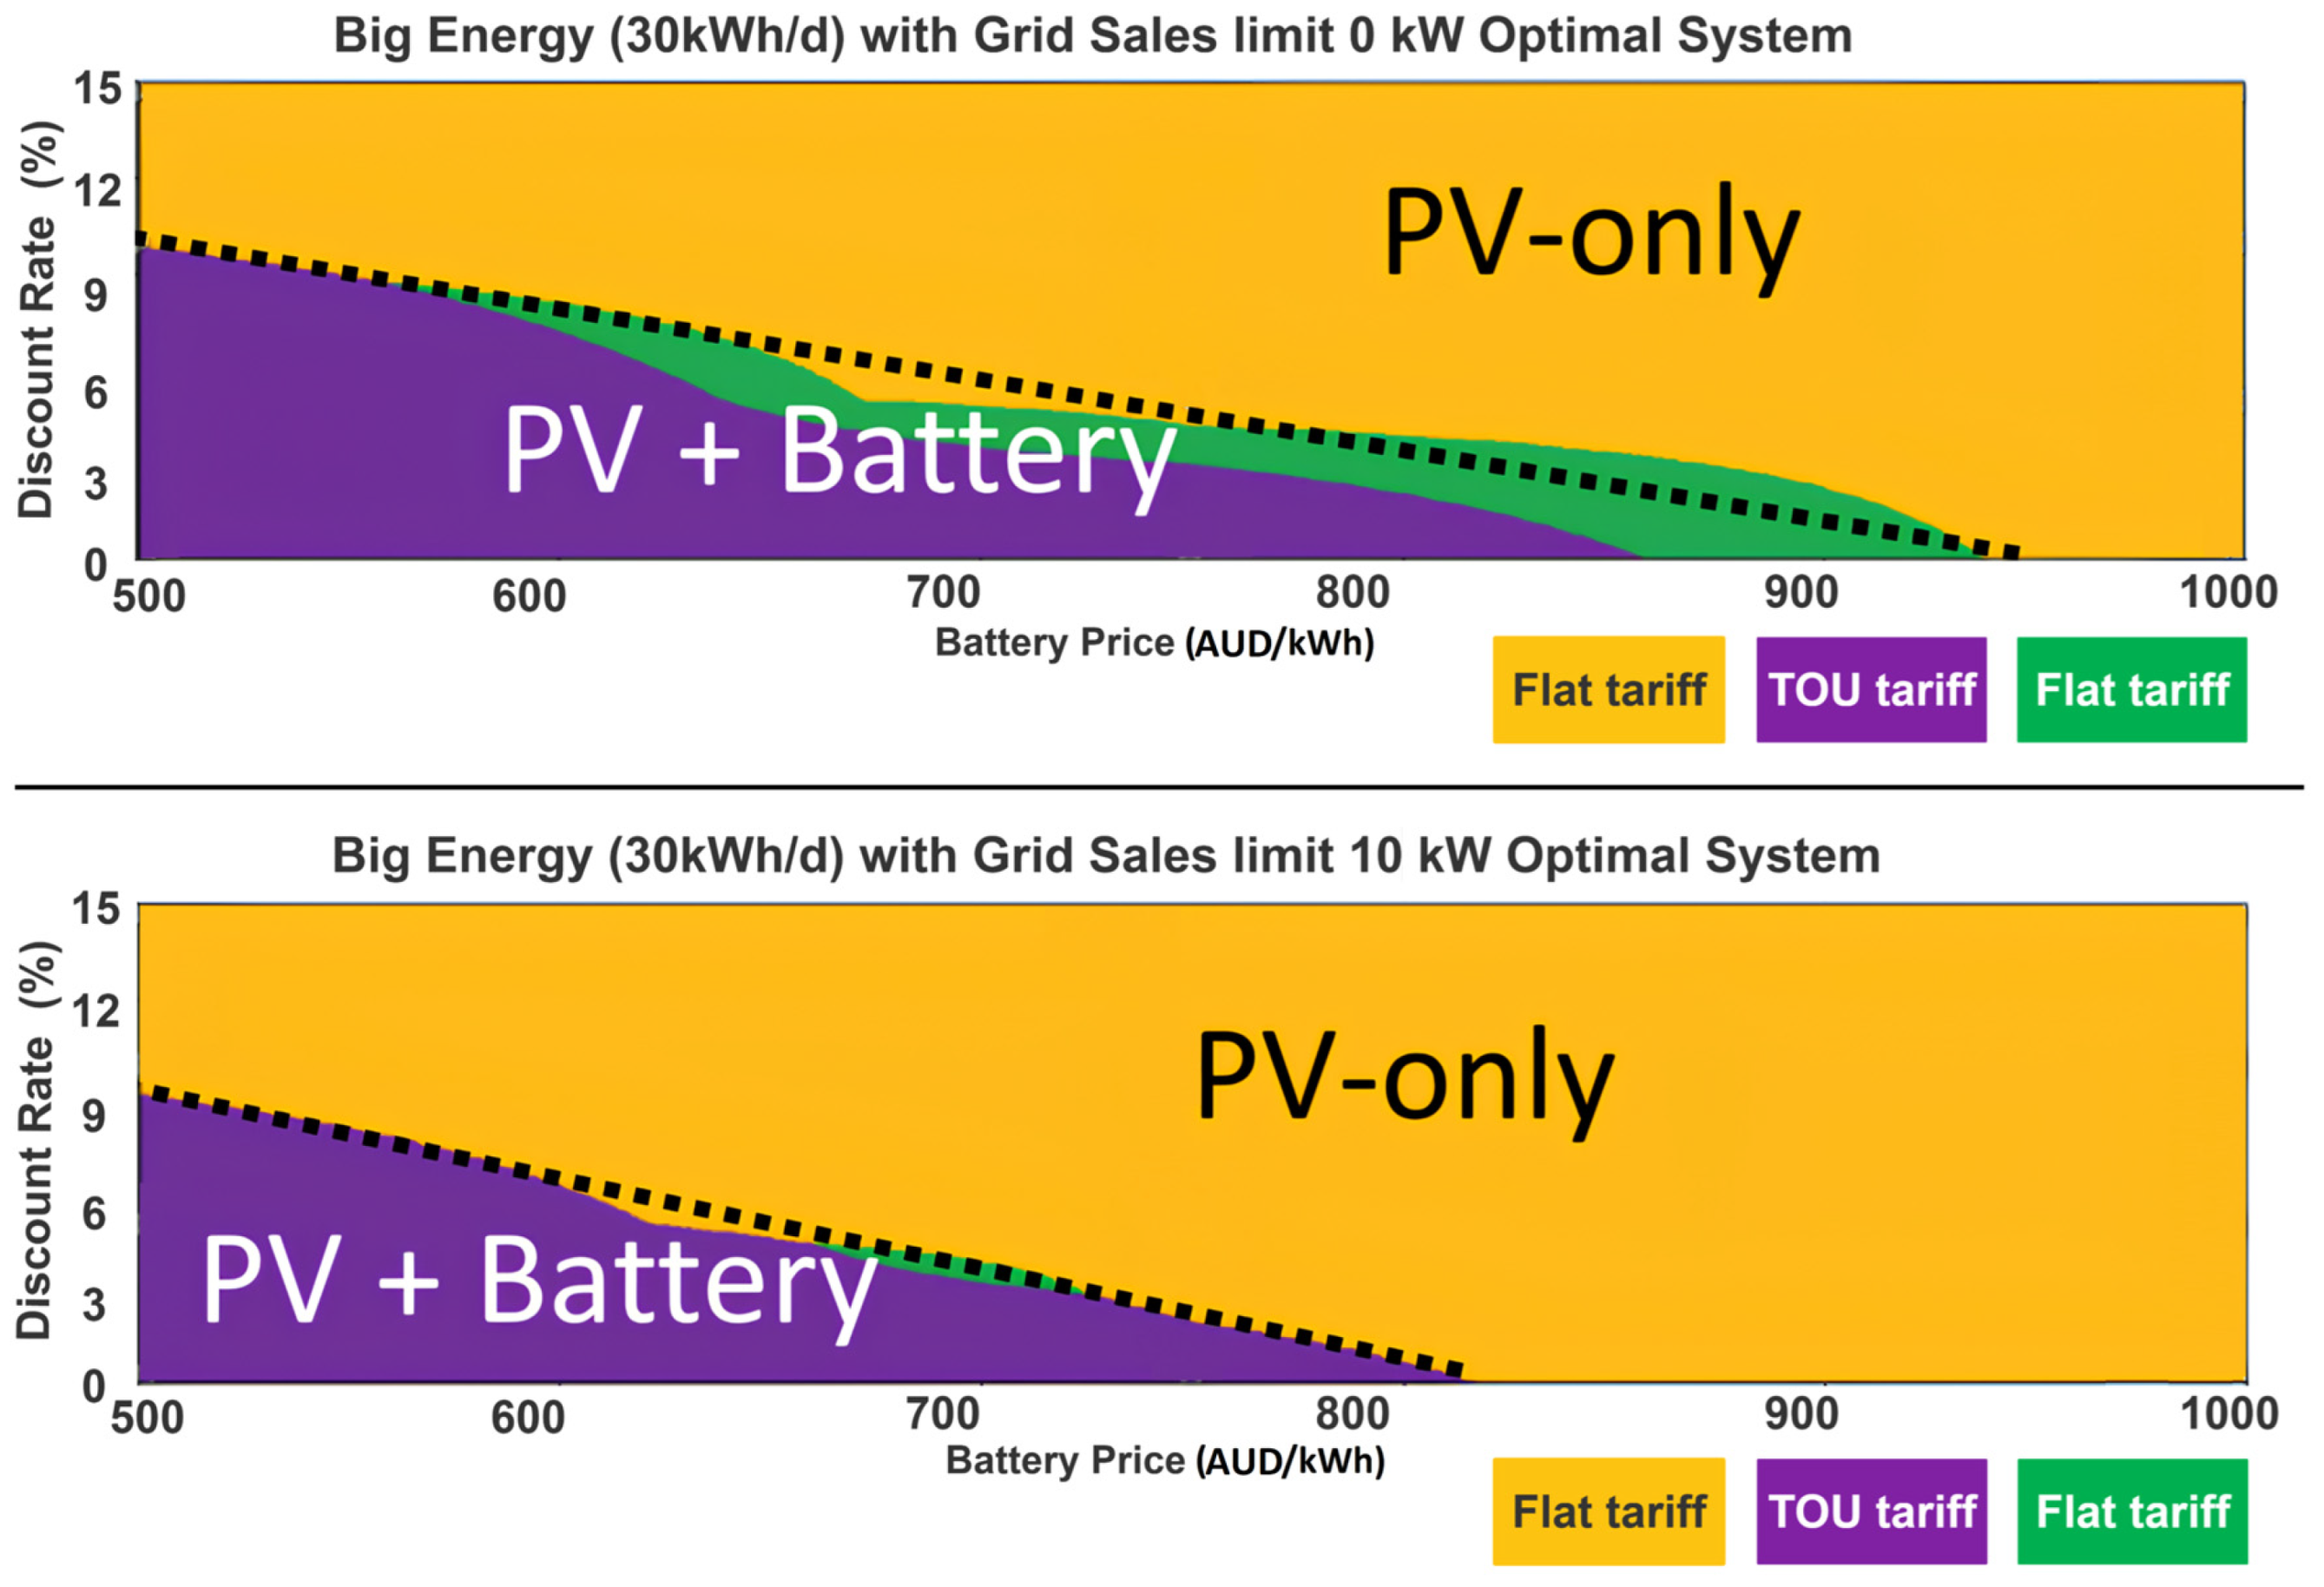
3.2.1. Sensitivity Series 1: Impact of Load Profiles and Grid Export Limits

The load profiles illustrated in Figure 2 provide a comprehensive basis for assessing the behavior of PV + Battery systems under varying conditions. The main goal of this sensitivity series is to explore how load profiles and grid export limitations influence the optimum system configuration and financial feasibility. In this series, three key variables of battery price, grid export limits, and load profiles were systematically varied across several simulations to determine when a PV + Battery system becomes the most financially viable option. The discount rate was fixed at 0%, and the CO2 emissions penalty was set to zero. These conditions created a controlled environment to focus on the impact of load and grid export constraints on system performance. The results of this series are presented using a mosaic diagram as illustrated in Figure 3, which visually represents the optimal system configurations based on NPC across different load profiles, battery prices, and grid sales limits (0 kW, 5 kW, and 10 kW).
Figure 3 illustrates the relationship between daily energy load, battery cost, and the optimal system configuration for the Big Energy User profile at a grid sales limit of 10 kW. The x-axis represents the average daily load in kWh/day, ranging from 10 kWh/day to 70 kWh/day, capturing a spectrum of household energy consumption levels. The y-axis shows the battery cost multiplier, ranging from 1.0 (current market price of 1000 AUD/kWh) at the top to 0.5 (500 AUD/kWh) at the bottom, simulating potential future battery price reductions. The figure is divided into distinct regions indicating the most financially viable system configurations:
  • The yellow region at the top represents scenarios where a PV-only system with a flat tariff is optimal. This is typically the case when battery costs are high and daily energy consumption is low;
  • The purple region at the bottom signifies scenarios where a PV + Battery system with a TOU tariff becomes the preferred option. This occurs when battery prices decrease, and daily energy consumption increases.
The transition boundary between these regions highlights the conditions under which adding a battery becomes financially advantageous. As daily loads increase (moving right along the x-axis) and battery prices decrease (driving down the y-axis), the economic benefits of battery storage become more pronounced. For example, at higher daily loads (e.g., 50–70 kWh/day) and reduced battery prices (e.g., 800 AUD/kWh), the PV + Battery system under a TOU tariff becomes financially optimal. This suggests that households with higher energy demands can benefit more from battery storage, especially as battery costs decline. This analysis demonstrates how the combination of decreasing battery costs and increasing energy consumption shifts the financial viability in favor of PV + Battery systems.
A mosaic diagram (see Figure 4) has been compiled from the sensitivity series simulation results to show the overview and trends. The diagram consists of individual tiles of HOMER results for all six load profiles at three grid sale limits (0 kW, 5 kW, and 10 kW). The load profiles have been arranged in the order in which their characteristics change. Figure 3 above, for the Big Energy User profile at a grid sale limit of 10 kW, is the fourth tile from the top, in the right-hand column in the mosaic diagram in Figure 4.
Figure 3 illustrates the strong impact of the load usage profile on the optimum system configuration for the simulation parameters being investigated. For the Flat control profile, the purple color shows that the PV + Battery (with TOU tariff) configuration is the preferred solution for all situations except at the current battery price, at a grid sales limit of 10 kW, for very low daily loads when PV-only solution is optimal (red color).
The Young Family profile outcome is similar to the Flat control outcome, even though the load profiles look very different. The main difference occurs at a grid sales limit of 10 kW where, for smaller daily loads, the winning systems include PV-only solutions (with TOU tariff). This can be seen in the optimal system plot’s distinctive ‘red’ color. This PV-only component means that for some cases, the battery price needs to be reduced to around AUD 750 in some cases before a PV + Battery solution is optimal. (Note that the Flat Control profile also shows this PV-only aspect at low loads, but it is only seen at the current battery price, i.e., at the very top of the image).
The Community profile shows a clear battery price limit for all three grid sales limits. A PV-only system is preferred at the 0 kW grid limit until the battery price reduces to around 900 AUD/kWh. With the grid limits of 5 kW and 10 kW, the battery price must drop to below 900 AUD/kWh. This trend continues with the other Big Energy, Older Family, and Residential profiles. From a battery system perspective, the worst case is the Residential profile. At a grid sales limit of 0 kW, the required battery price is 900 AU/kWh, decreasing to under 800 AUD/kWh for grid sales limits of 5 kW and 10 kWh. Note that both the green and purple colors represent PV + Battery systems, with the green showing HOMER selected a flat tariff as the optimum solution rather than the TOU tariff. Figure 4 also demonstrates the impact of the grid sales limit. The zero grid sales increased the tolerable level of battery price to support a battery + PV winning solution, i.e., closer to the current price. Under the modeled assumptions (including a 0% discount rate), a battery price reduction of 900 AUD/kWh was sufficient to make a PV + Battery system the optimal financial choice. At a load export of 5 kW, the required battery price was typically around 800 AUD/kWh before a PV + Battery solution became financially optimal. There was no noticeable change with the export of 10 kW for these modeling conditions. The following points regarding the impact of the tariffs are observed in Figure 4. For the same load profile, the tariff associated with an optimal PV + Battery system varies according to the battery price, the grid sales limit, and the average daily load. This also applies to the simulation points where HOMER selected a PV-only system as the optimal outcome: again, the preferred tariff for PV-only systems is usually the flat tariff, but in some cases, e.g., Flat control and Young Family profiles at 10 kW grid limit, the preferred solution includes a zone of PV-only systems coupled with the TOU tariff. This tariff variability was typically dependent on the average daily load. As a result, the required battery price for a PV battery system to rank as the winning system varies from the current price of 1000 AUD/kWh to around 800 AUD/kWh, depending on load profile and grid sales limits.

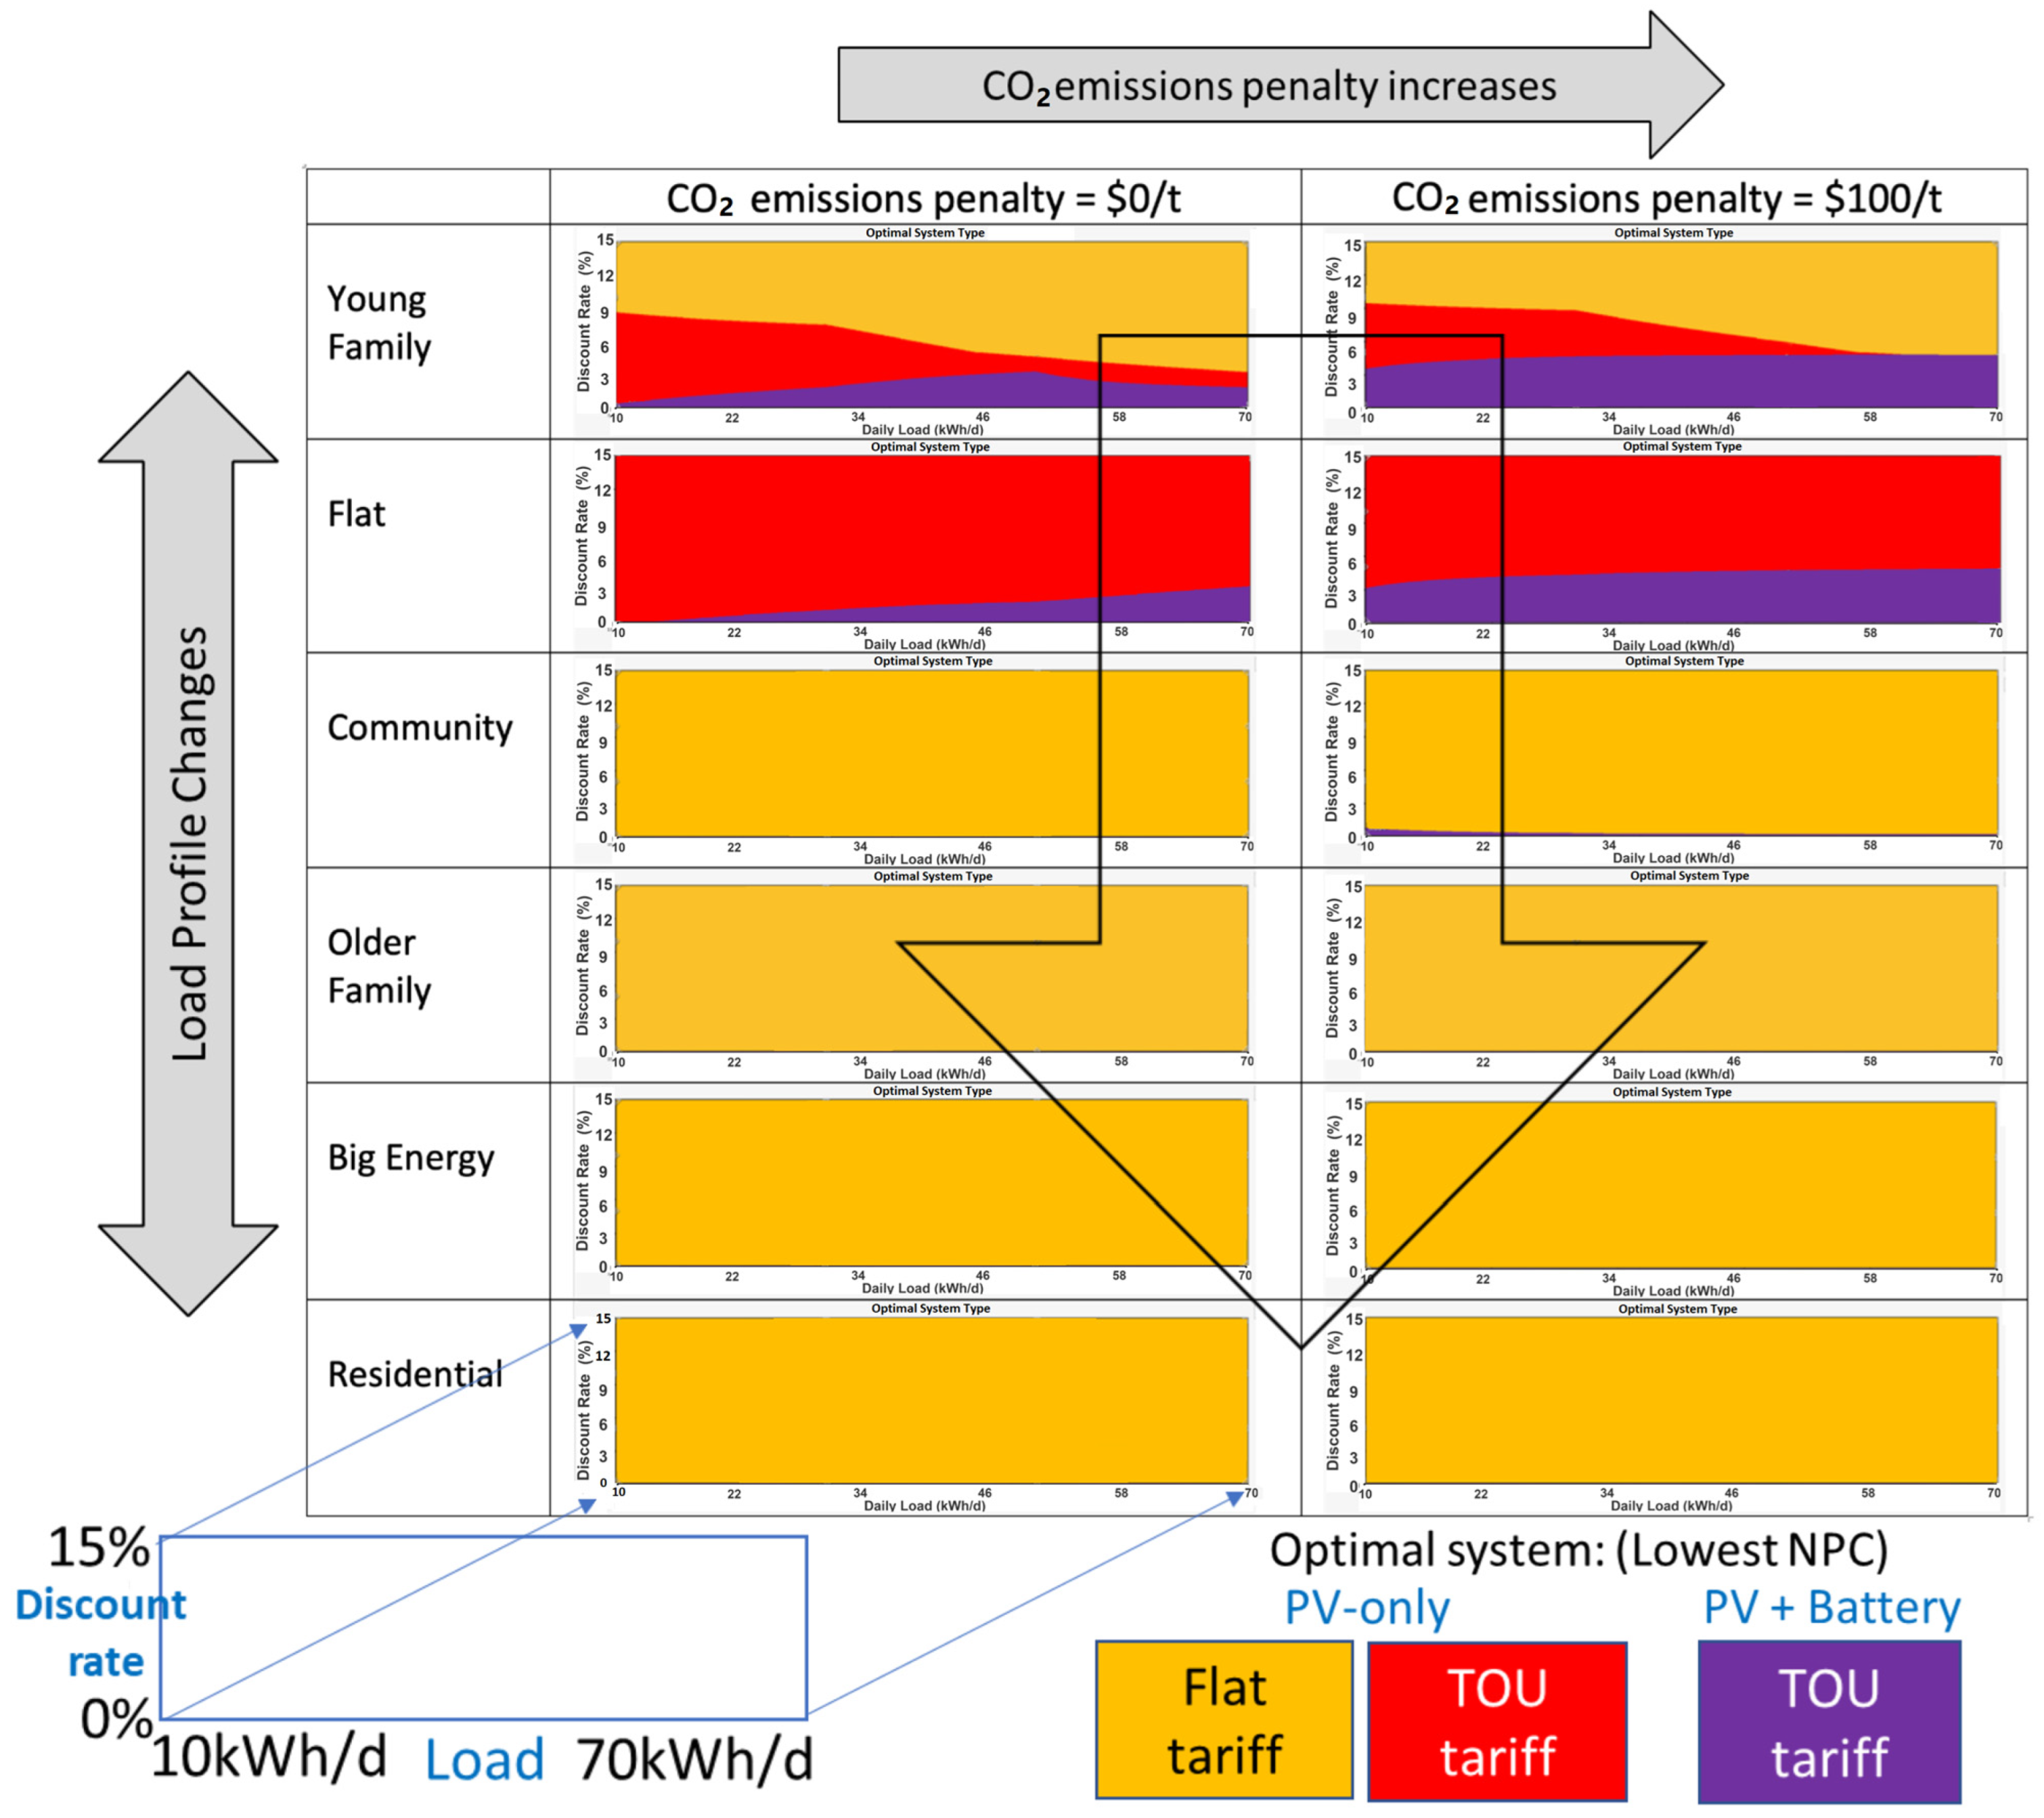
3.2.2. Sensitivity Series 2: Impact of CO2 Penalties and Discount Rates

In Sensitivity Series 2, the objective is to examine how variations in CO2 emissions penalties and discount rates influence the financial viability of PV + Battery systems. Two new variables are introduced: the CO2 penalty, which varies between 0 AUD/ton and 100 AUD/ton, and the discount rate, which ranges from 0% to 15%. These factors are analyzed across six synthetic load profiles with the grid sales limit fixed at 5 kW. The battery price remains constant at 1000 AUD/kWh, allowing for a focused analysis of how economic conditions like discount rates and carbon pricing impact system configurations. Figure 5 focuses on the Young Family Profile under a CO2 penalty of 100 AUD/ton, showing how the nominal discount rate and load size affect the preferred system configuration.
Figure 5 shows that the optimal configuration includes battery storage at low discount rates (e.g., 0–3%). However, as the discount rate rises above 5%, the financial advantage shifts towards PV-only systems, even when a carbon penalty is applied. This shift indicates that discount rates have a much stronger impact on system configuration than carbon pricing alone. As the discount rate increases, the economic advantage of PV + Battery systems diminishes, and PV-only configurations become more financially attractive. For most load profiles, PV-only solutions are optimal at higher discount rates due to the higher upfront costs of batteries and the reduced present value of future savings. This effect is particularly noticeable in profiles such as Young Family and Flat Control, where PV + Battery systems are only viable at lower discount rates (below 5%).
Figure 6 supports this observation, showing that higher discount rates consistently favor PV-only solutions across all six load profiles. The transition from PV + Battery to PV-only occurs more rapidly for profiles with variable or lower energy consumption, such as the Residential Profile, compared to profiles like Flat Control, where more consistent energy usage can better use battery storage. When a CO2 penalty of 100 AUD/ton is applied, there is a slight shift in favor of PV + Battery systems at lower discount rates (e.g., 0–5%), particularly for profiles like Young Family and Flat Control. However, as the discount rate increases, the financial benefits of battery storage become less significant, and PV-only configurations dominate most profiles.
Figure 6 shows that even with a CO2 penalty of 100 AUD/ton, PV + Battery systems are only viable at low discount rates. The influence of carbon pricing is more pronounced in load profiles with higher and more consistent energy demand, such as the Flat Control Profile, where battery systems can be used more effectively to reduce NPC. As with previous sensitivity analyses, the choice of tariff structure, whether TOU or flat rate, also plays a vital role in determining the optimal system configuration. Figure 6 uses color coding to differentiate between tariff structures, with red representing the “Smart Home” TOU tariff. For specific profiles, such as Young Family and Flat Control, TOU tariffs are more favorable for PV + Battery systems at lower discount rates, particularly when a CO2 penalty is applied. However, as the discount rate rises, the influence of tariff structures diminishes, and flat tariffs become more common for PV-only solutions. This analysis shows that tariff structures, while important, are secondary to the impact of discount rates and CO2 penalties. At high discount rates, the choice of tariff has less impact on the overall system configuration, as the economic benefits of battery storage are outweighed by the costs associated with higher discounting of future savings.

3.2.3. Sensitivity Series 3: Combined Sensitivity Analysis of Series 1 and Series 2

Sensitivity Series 3 combines the parameters from Series 1 (impact of load profiles and grid export limits) and Series 2 (impact of CO2 penalties and discount rates) into a single simulation to explore their inter-relationships and combined effects. This analysis is limited to two profiles: Big Energy and Young Families/Retirees. It focuses on how the combined impact of discount rates, grid sales limits, and battery prices affects the financial viability of PV + Battery systems. By integrating the parameters from the previous two series, the boundary conditions under which a PV + Battery configuration becomes the optimal solution can be examined in greater detail. The simulations for Series 3, shown in Figure 7 (Young Families profile) and Figure 8 (Big Energy profile), assume an average daily load of 30 kWh/day and a fixed CO2 emissions penalty of 0 AUD/ton. These figures include a dotted line representing the boundary between scenarios where PV + Battery systems are optimal (below the line), and PV-only solutions prevail (above the line). Changes in discount rates, grid export limits, and battery prices influence this boundary. Both Figure 7 and Figure 8 show that as the discount rate increases, a lower battery price is required for a PV + Battery system to become the preferred solution. At a grid sales limit of 0 kW and a discount rate of 0%, the Young Family shows that a PV + Battery system is the winning configuration at the battery price of 1000 AUD/kWh. However, for the Big Energy profile, a lower battery price of around 950 AUD/kWh is needed for the PV + Battery system to be financially viable under these conditions.
An increase in the grid sales limit to 10 kW exacerbates the trend, further reducing the acceptable battery price for a PV + Battery system to be optimal. This is demonstrated in Figure 8 for the Big Energy profile, where the boundary between PV-only and PV + Battery systems shifts downward as the grid sales limit increases. Under these conditions, the battery price must drop even more (e.g., below 750 AUD/kWh) for the PV + Battery system to remain competitive, especially at higher discount rates. Interestingly, the Young Family profile in Figure 7 presents a more irregular pattern. While increasing the grid sales limit to 10 kW generally follows the same trend, there is a discontinuity in the profile where PV-only systems dominate until the battery price falls below 800 AUD/kWh. At lower discount rates (e.g., below 5%), a PV + Battery system becomes financially viable at higher battery prices in the Young Family profile than the Big Energy profile, indicating that the load profile is critical in determining battery viability. Furthermore, for the Young Family profile at a 10 kW grid sales limit, PV-only solutions at discount rates up to 10% are often associated with a TOU tariff (Synergy Smart Home tariff) rather than the more typical flat tariff (Synergy A1 tariff).
The analysis further shows that the interaction between load profiles and tariff structures influences the optimal system configuration. The Big Energy profile reveals instances where the PV + Battery system is combined with a flat tariff (green, representing the Synergy A1 tariff) to achieve the most cost-effective solution. However, for most simulation points, the PV + Battery configuration is better than a TOU tariff (purple, representing the Synergy Smart Home tariff). This indicates that, depending on the load profile and other conditions, the tariff structure can either enhance or detract from the financial performance of battery systems. Similarly, in the Young Family profile, the TOU tariff is often favored at grid sales limits of 10 kW, especially at higher discount rates, even when the battery price decreases. This shows that while battery price and discount rate are significant factors, the choice of tariff is another layer of complexity that needs to be considered when determining the financial viability of PV + Battery systems.

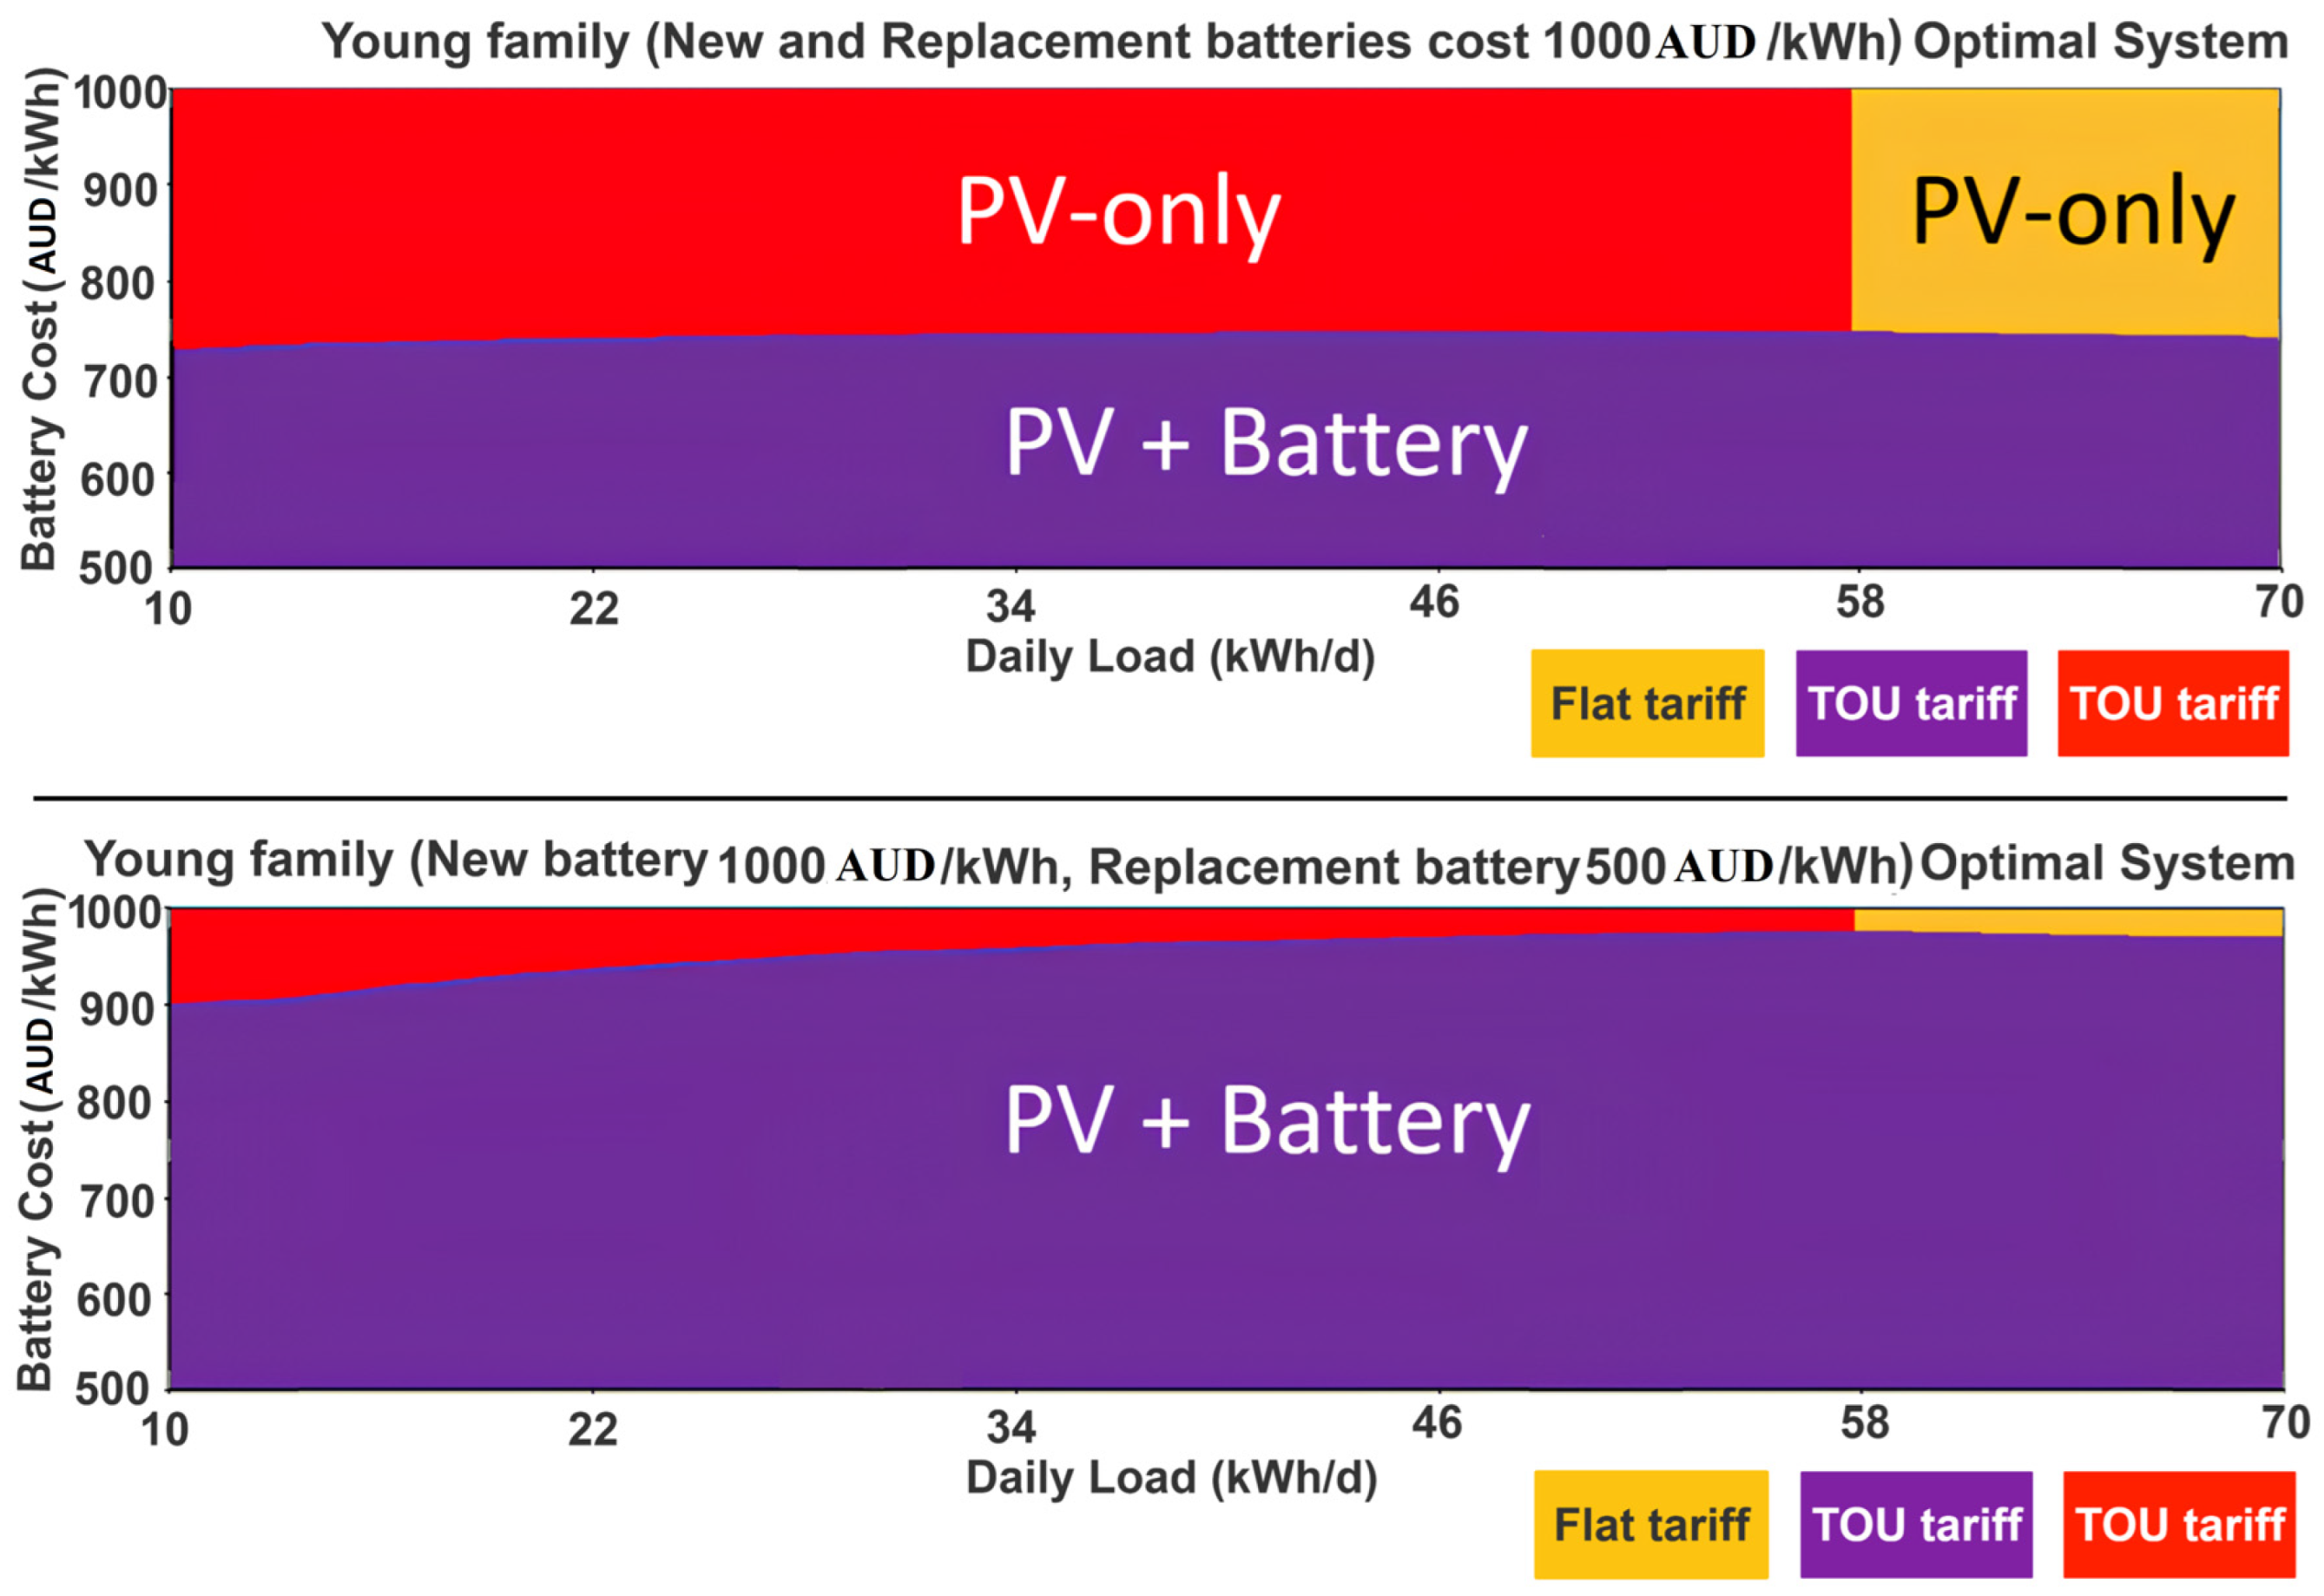
3.2.4. Sensitivity Series 4: Refinement of Battery Costs

Sensitivity Series 4 focuses on the effect of lower battery replacement costs on the financial viability of PV + Battery systems. The analysis compares the replacement cost of 500 AUD/kWh with the cost of new batteries set at 1000 AUD/kWh. This investigation is carried out for two representative load profiles, Young Family and Big Energy User. Given the ongoing trend of declining battery prices, this sensitivity analysis reflects the expected market evolution, where replacement batteries are likely to be significantly cheaper than new batteries. The difference in price between new and replacement batteries is considered large enough to warrant specific modeling, as it can substantially impact the financial feasibility of battery solutions. The primary outcome of this analysis is that the reduction in battery replacement costs makes PV + Battery systems more competitive compared to PV-only configurations. As expected, lower replacement costs shift the boundary where battery systems become financially viable, allowing PV + Battery configurations to emerge as the optimal solution at a wider range of price points. In the Young Family Profile, shown in Figure 9, the boundary between PV-only and PV + Battery solutions improves when the battery replacement cost is reduced. For example, at a grid sales limit of 5 kW, a discount rate of 10%, and a CO2 penalty of 100 AUD/ton, HOMER selects a PV + Battery solution at a higher battery price when replacement costs are lower. Specifically, the optimal battery cost boundary shifts upward, approaching the current market price of 1000 AUD/kWh. The Y-axis in Figure 9 illustrates the battery price multiple, which ranges from 0.7 (equivalent to 700 AUD/kWh for both new and replacement batteries) to 0.9 (equivalent to 900 AUD/kWh for a new battery and 450 AUD/kWh for a replacement battery after 10 years). When the battery price reaches this level, HOMER identifies a PV + Battery configuration as the most cost-effective solution, whereas previously, the model favored PV-only systems. This indicates that lower replacement costs improve the long-term financial attractiveness of battery storage, as the reduced cost of replacing batteries offsets the initial investment, making the system more viable over the entire lifecycle.
The Big Energy User Profile results are consistent with those observed in the Young Family profile. Reducing replacement battery costs shifts the financial boundary in favor of PV + Battery systems, particularly at higher daily loads where battery storage can be more effectively utilized. Although the specific numbers differ due to the higher energy consumption in the Big Energy profile, the general trend remains the same: as battery replacement costs decrease, the economic appeal of battery systems improves, particularly when grid sales are allowed. In both profiles, the HOMER model demonstrates that the threshold for battery price viability increases at lower replacement costs, allowing PV + Battery systems to compete more effectively with PV-only configurations. This finding underscores the importance of considering future battery cost reductions when assessing the long-term financial feasibility of energy storage solutions.

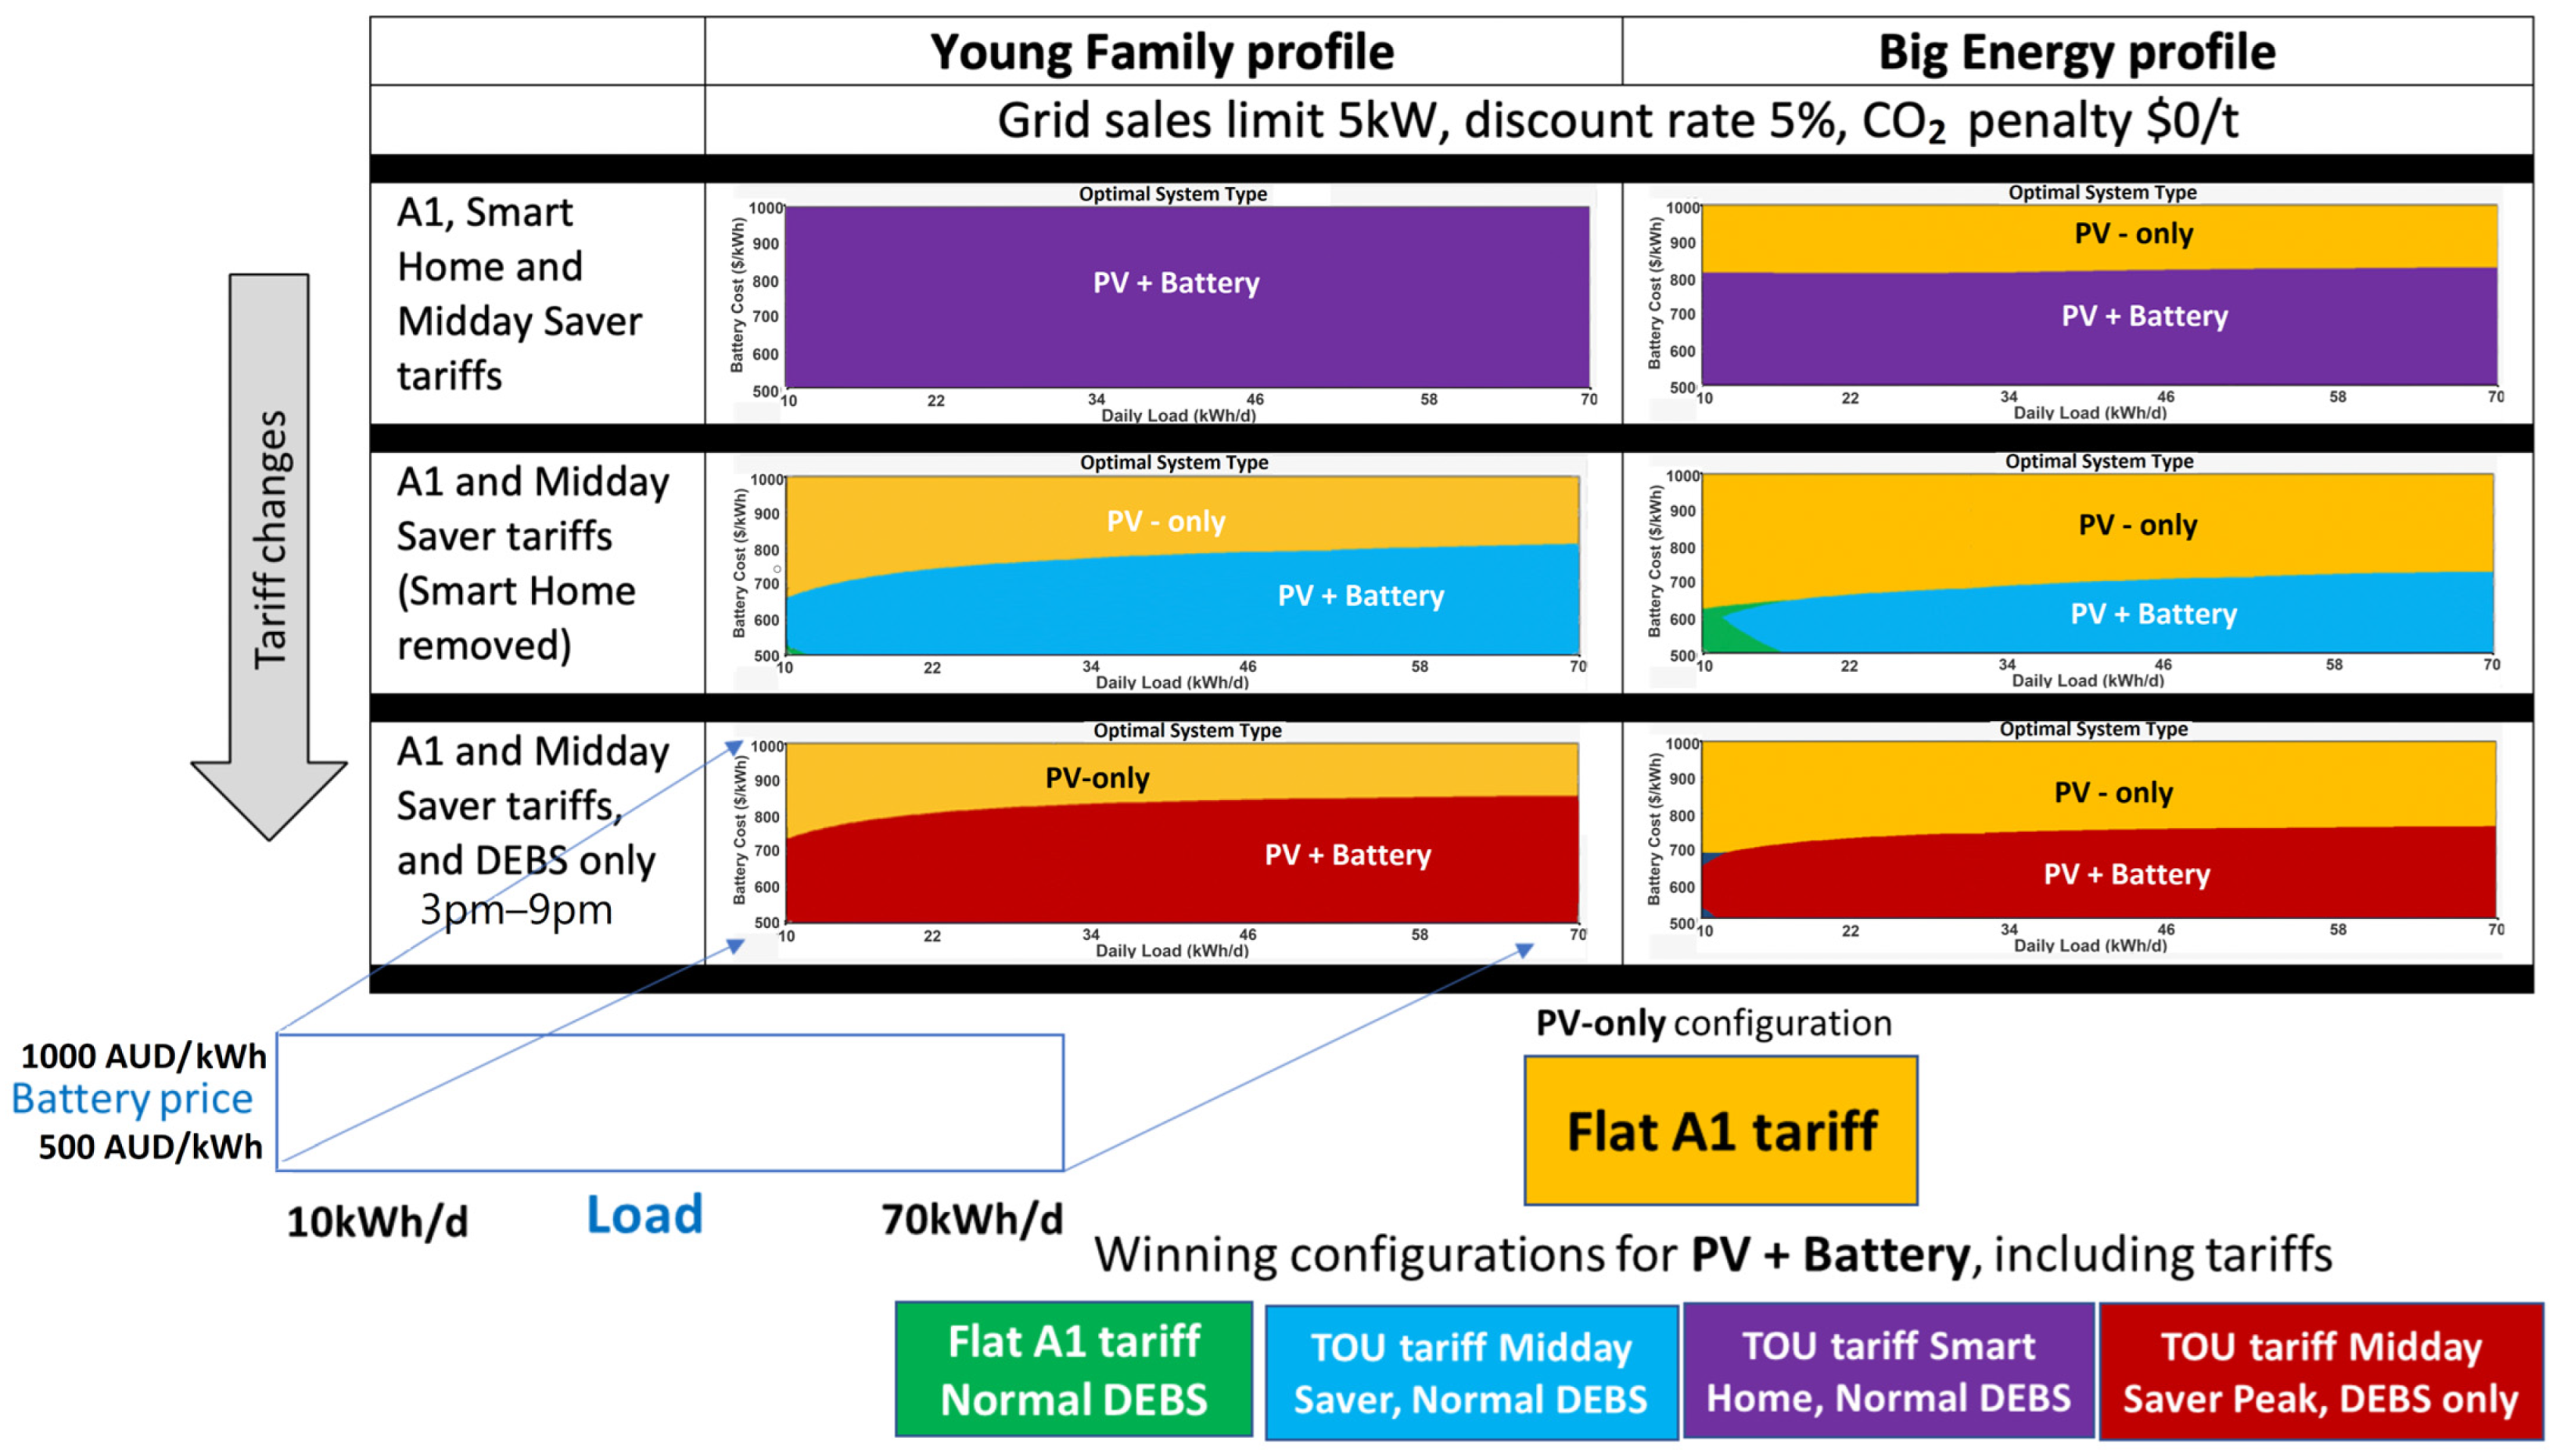
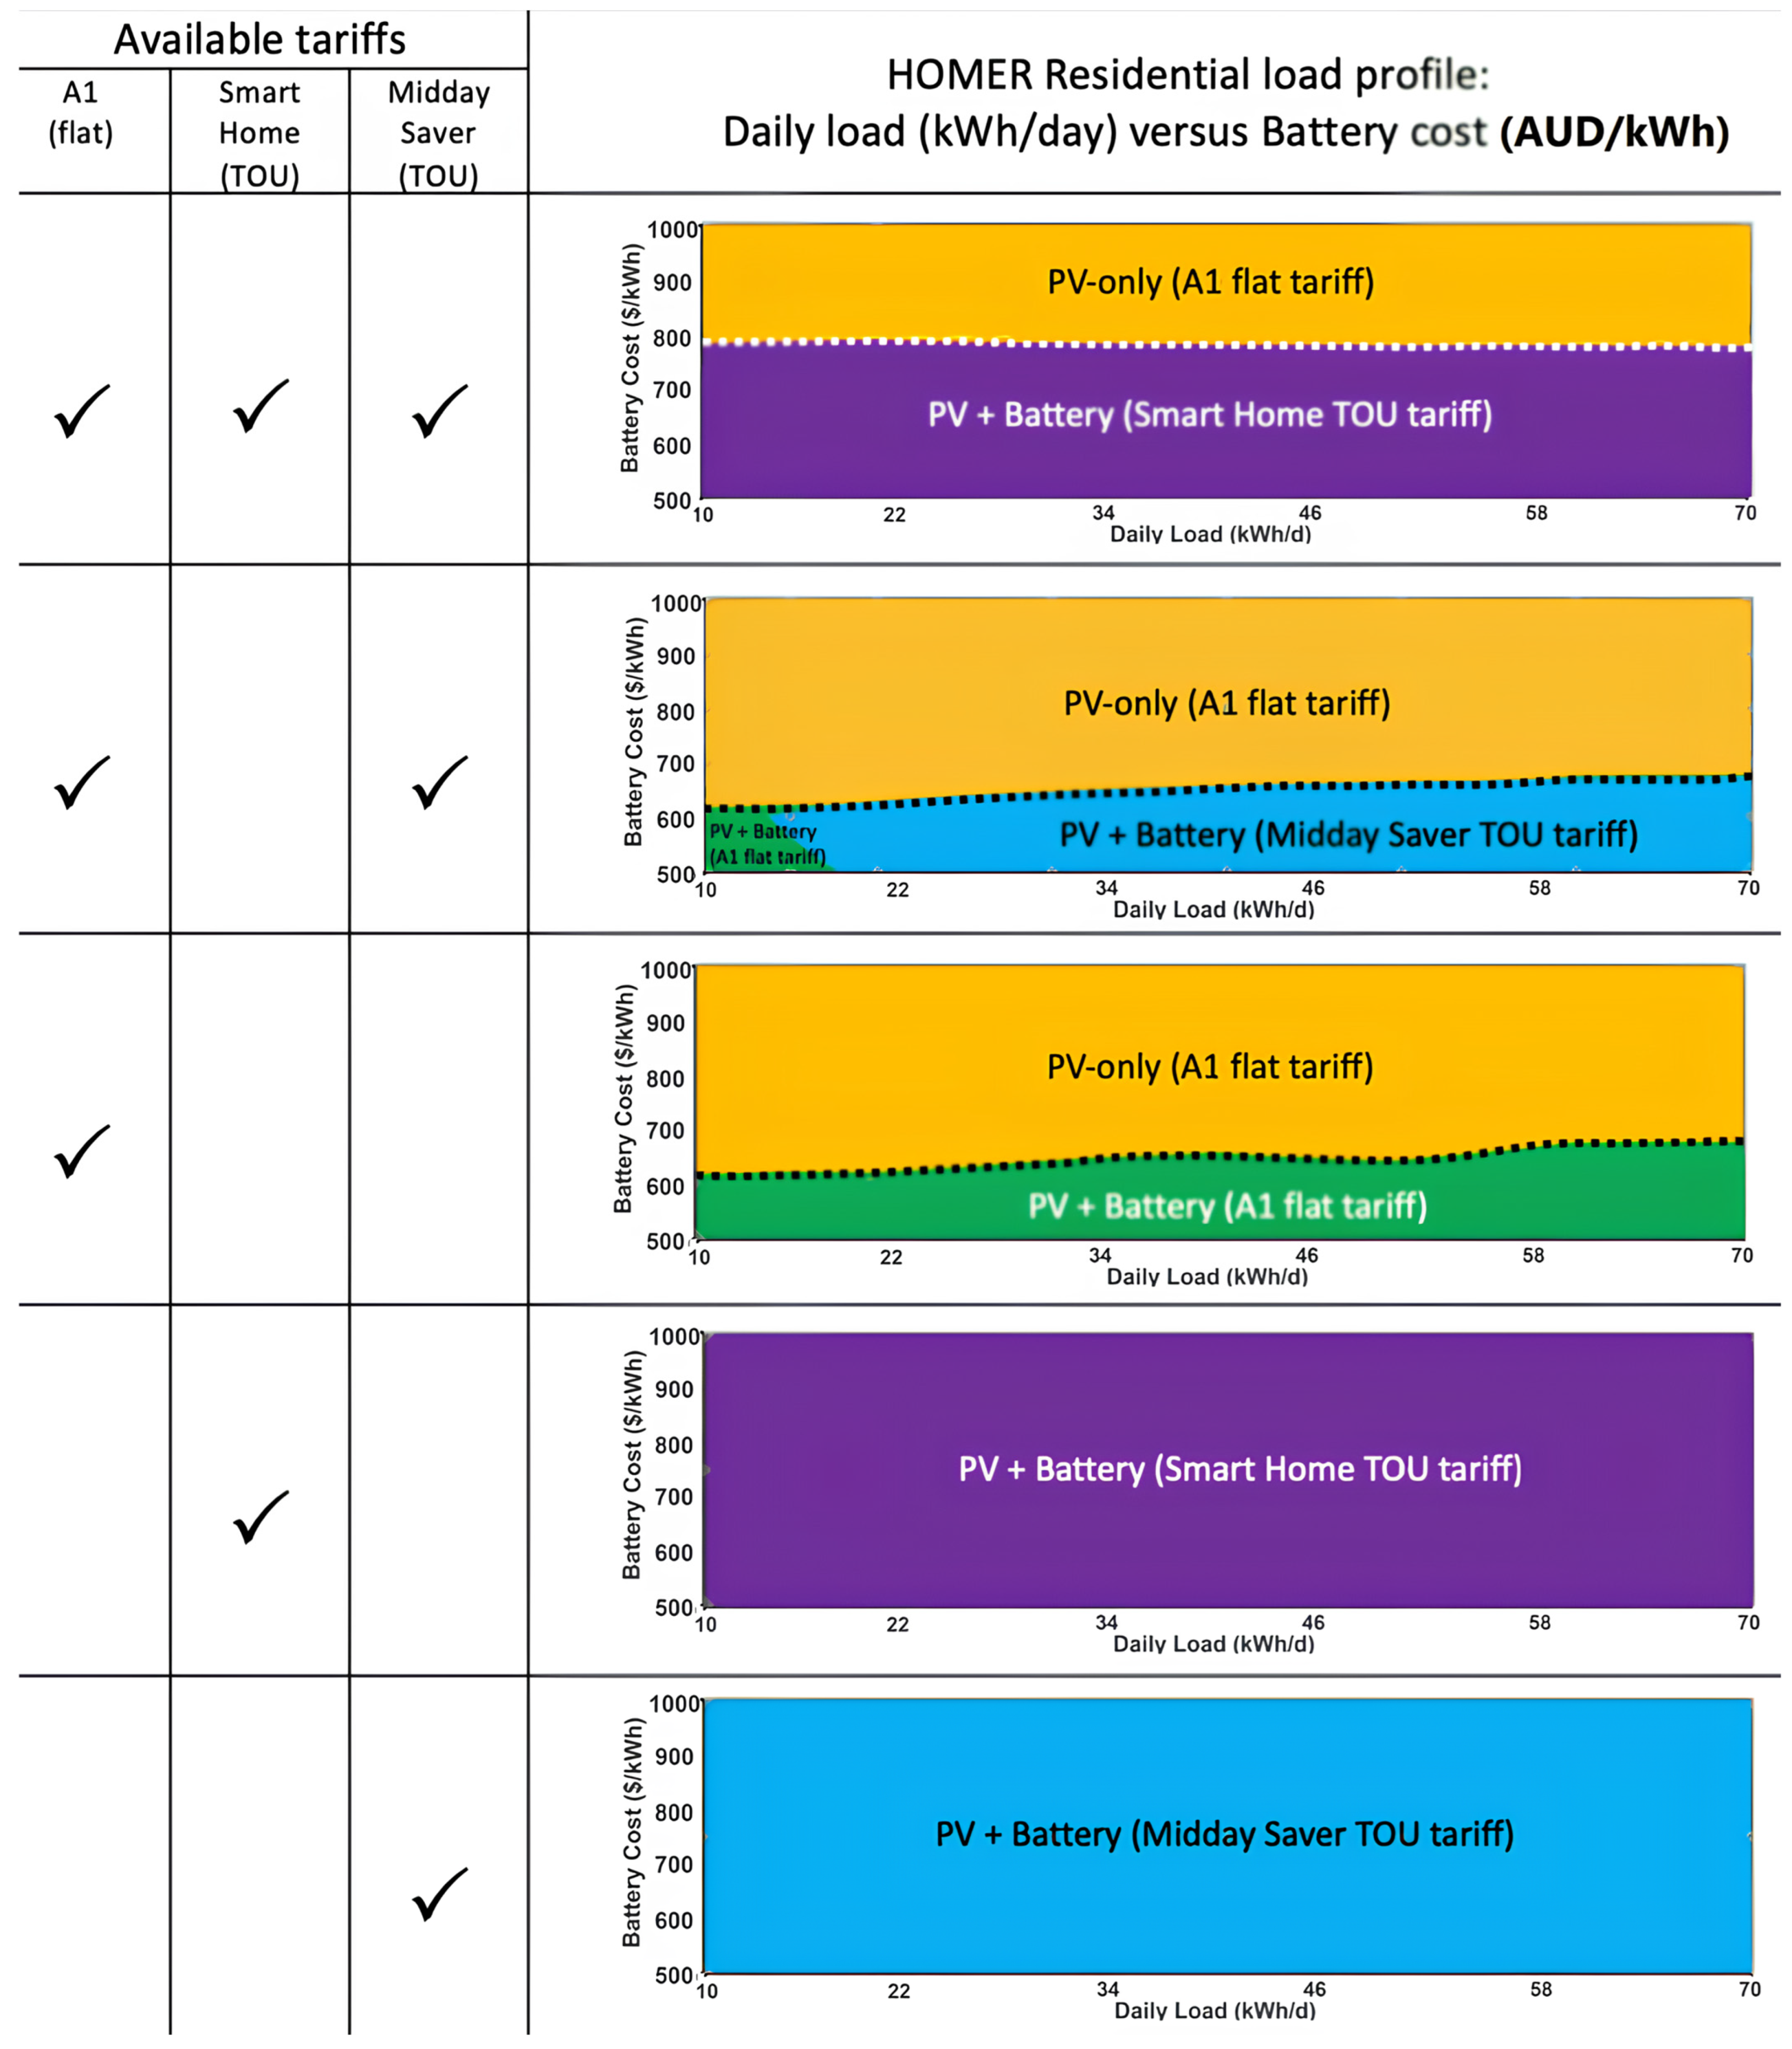
3.2.5. Sensitivity Series 5: Evaluation of the Impact of Minor Tariff Changes

Sensitivity Series 5 focuses on the impact of minor changes in electricity tariffs on the financial viability of PV + Battery systems. For this sensitivity analysis, simulations were conducted for two representative load profiles: Young Family and Big Energy User. The aim was to assess how different tariff structures, specifically the Smart Home TOU tariff, Synergy A1 flat tariff, and Synergy Midday Saver TOU tariff, influence the optimal system configuration. The results also examine how these tariffs interact with the DEBS, where payments for energy exported to the grid are only available from 3 to 9 pm. All simulations were conducted with a fixed discount rate of 5%, grid sales limit of 5 kW, no CO2 emissions penalty, a new battery cost of 1000 AUD/kWh, and a replacement battery cost of 500 AUD/kWh. The results for the Young Family load profile are striking. When all three tariffs are available, the optimal system configuration across all daily loads and battery prices is consistently a PV + Battery system using the Smart Home TOU tariff. This indicates that, from an NPC perspective, the PV + Battery solution is already the best option for this load profile under current conditions. When the Smart Home tariff is removed from the available options, the battery price must drop significantly for a PV + Battery system to remain financially optimal. For larger daily loads, the battery price must fall to approximately 810 AUD/kWh. In comparison, the price threshold for smaller loads is lower, around 660 AUD/kWh, before the PV + Battery configuration becomes viable again. Figure 10 demonstrates this shift in the optimal configuration when the Smart Home tariff is excluded from the analysis. Furthermore, removing the DEBS export payment for hours outside 3 to 9 pm also influences the battery price boundary, slightly increasing the required price reduction for PV + Battery systems. With this change, the minimum battery price required ranges from 740 AUD/kWh to 850 AUD/kWh, depending on the load size.
For the Big Energy User profile, with all three tariffs available, a PV + Battery system is not the preferred solution at current battery prices. Instead, the battery price must fall between 650 AUD/kWh and 850 AUD/kWh, depending on the load size. When the Smart Home tariff is removed, the required battery price drops further, with a range of 620 AUD/kWh to 740 AUD/kWh necessary for the PV + Battery solution to be financially viable. One key difference between the Big Energy User profile and the Young Family profile is that the impact of tariff changes on the battery price boundary is less pronounced. This indicates that, while tariffs play a significant role, the higher energy consumption in the Big Energy profile tends to favor a more consistent shift in the battery price threshold, with a smaller relative impact of tariff changes on system viability. The simulations also explored the effect of changes in the DEBS payment structure, which restricts export payments to the hours of 3–9 pm. This adjustment consistently pushes the battery price boundary slightly higher, making PV + Battery solutions more financially viable. However, this adjustment cannot drastically change the optimal system configuration unless the battery price approaches competitive levels.

3.2.6. Key Insights of Sensitivity Analyses

The results from the sensitivity analyses provide several key insights into the financial viability of PV + Battery systems. The following subsections highlight the most important factors that influence system optimization, including the dependency on battery price reductions, the effect of load profiles, and the impact of tariff structures. Additionally, this section explores how FIT, grid sales limits, carbon emissions penalties, discount rates, and optimal system sizing contribute to the overall performance of PV + Battery systems. Figure 11 provides a detailed visual representation of how tariff availability affects the optimal system configuration across load profiles, in this case, the residential profile, which was consistently the least favorable for PV + Battery configurations from an NPC perspective:
  • Battery Price Dependency: The financial viability of PV + Battery systems is highly dependent on battery price reductions, load profiles, and available tariffs. Unlike previous research, such as [50] (which found that batteries must cost less than 463 AUD/kWh) or [49] (which argued for a 50% reduction in battery prices), this study indicates that, under certain conditions, PV + Battery systems are already viable at current battery prices, while in other cases, even a 300 AUD/kWh reduction in battery price may not be enough;
  • Load Profiles Influence: The load profile significantly impacts the optimal system configuration. The Flat Control profile consistently showed the highest density of PV + Battery solutions, followed by the “Day Focused” profile, “Community” profile, “High Day & Evening Peak” profile, “Double Peak” profile, and finally, the “Residential” profile. This hierarchy indicates how well different load profiles can leverage battery storage to optimize NPC;
  • Tariff Impact: Tariff structures significantly affect system optimization. The Smart Home TOU tariff is consistently associated with PV + Battery solutions, while the Synergy A1 flat tariff favors PV-only systems. Interestingly, when only the Midday Saver TOU tariff is available, PV-only systems become more prevalent, particularly at lower daily loads. Figure 11 visually represents how tariff availability influences system configuration across load profiles;
  • Feed-in Tariffs: The results show that limiting FIT to evening hours (3 to 9 pm) boosts the financial return of PV + Battery systems. However, this also highlights the tension between network operator goals and consumer expectations, with consumers potentially resenting lower FIT;
  • Grid Sales Limits: A grid sales limit of 0 kW (i.e., no energy exports) consistently favors PV + Battery systems, similar to the effect of lower FIT. However, increasing the grid sales limit to 5 kW or 10 kW favors PV-only systems, though there is little difference between the two higher limits;
  • Carbon Emissions Penalty: A carbon emissions penalty has a small but consistent positive impact on the financial viability of PV + Battery systems. However, Australia lacks a carbon pricing mechanism, so this factor is not yet clinically relevant. A higher carbon penalty would favor PV + Battery systems more strongly if introduced;
  • Discount Rate: The discount rate plays a significant role in determining the financial viability of battery systems. Even a modest increase from 0% to 5% can shift the balance in favor of lower initial capital solutions, such as PV-only systems. As the discount rate is an external macroeconomic factor, careful selection of the rate is necessary to avoid distorting financial projections;
  • Optimal Sizing: The HOMER Grid optimization function identifies the optimal system configuration for each simulation point, and the optimal system size varies significantly by load profile. For some profiles, a PV-only system is optimal, while PV + Battery configurations dominate for others. This variation underscores the importance of accurate load profiling when planning energy systems.

3.3. Economic Analysis for Early PV Adopters

Our final modeling program shifts the focus to a hypothetical analysis of early PV adopters in Western Australia, aiming to draw potential parallels between the successful uptake of rooftop solar and the prospects for residential battery adoption. The analysis examines how the initial high FIT offered to early solar adopters was crucial to promoting the take-up of solar, given the high initial investment costs. In contrast, while current export tariffs have decreased, the cost of investing in solar systems has also significantly reduced, leading to different financial dynamics for newer PV adopters. The hypothetical scenario assumes that an early adopter installed a maximum allowed system size of 5 kW and received the FIT40 tariff for ten years, followed by the REBS tariff for the next ten years. The model assumes the PV system lasts 20 years without any upgrades or replacements. Interestingly, the results suggest that early adopters may have incurred a financial disadvantage compared to later investors due to the high initial cost of solar systems. In contrast, subsequent PV-only households have benefited more from lower system costs and favorable FIT, which justifies the lower export tariffs.

3.3.1. Consumer Implications

The findings of this research underscore the complexity of advising consumers on whether to invest in residential batteries. While there are valid non-financial reasons for acquiring battery storage, such as backup power or environmental motivations, most consumers will likely base their decisions on financial returns. Communicating these financial implications requires a careful approach, using clear, consumer-friendly metrics while maintaining rigor. A critical finding of this research is that financial outcomes vary significantly depending on factors like load profile, daily load, tariffs, and grid export limits. These variables highlight the risk of poorly specified systems that might never recover their investment cost. Of the eight parameters modeled in this research, three are under the consumer’s control (load profile, energy usage, and system choice), two are determined by network operators (tariffs and grid export limits), one is set by the government (CO2 emissions penalty), and two are influenced by global trends (battery prices and discount rates). The price of batteries remains one of the most significant considerations for households exploring residential storage options. This research evaluated DER solutions based on NPC, showing that in some cases, PV + Battery systems are already financially optimal in Western Australia. However, the reality is that many households may not have an accurate understanding of their load profiles, which may also change over time. Additionally, while Australia currently lacks a CO2 emissions penalty, introducing such a policy could significantly impact financial returns. Ultimately, considering only a subset of factors, such as battery prices, can lead to deploying suboptimal DER systems that may offer poor financial returns or even fail to recover the household’s investment.
Another issue highlighted by this study is the overwhelming amount of information available to consumers regarding DERs. Despite this abundance, most households will rely on system installers for advice. Therefore, consumers must select their installer carefully. Installers must use accurate data, including load profiles, to optimize system performance. However, even a well-sized system might not remain optimal as household energy consumption can fluctuate over time, particularly with the growing transportation electrification. Systems, once installed, are complex and expensive to modify, making initial optimization crucial. External factors beyond consumer control, such as tariff changes and grid sales limits, also directly impact the financial return of DER investments. Households with existing PV systems are already experiencing how tariff changes can reduce financial returns, and the same risk applies to future DER systems. This highlights households’ uncertainty when investing in PV + Battery systems. For tech-savvy early adopters or those seeking emergency backup power, the financial cost of batteries may be less of a concern. However, for most households, economic considerations will dominate the decision-making process.

3.3.2. Recommendations

To address some of the current uncertainties for consumers, this research consolidates the findings into four key recommendations, primarily aimed at government agencies, energy providers, and network operators:
  • Government agencies should establish a single, trusted source of information for consumers. Consumers need reliable, centralized information about Distributed Energy Resources (DER) options to make informed decisions;
  • Energy providers and technology companies should provide consumer-appropriate technology to help households understand and manage their load profiles and energy consumption. By better understanding their energy usage, households can make more informed decisions about system sizing and investment in DERs;
  • Network operators should clarify and communicate the longer-term network management perspective on community batteries (in front of the meter) versus residential batteries (behind the meter). Consumers need to understand how network operators view the role of residential batteries, particularly in the context of VPPs;
  • Government agencies and energy regulators should ensure that if residential batteries are critical for the network, tariffs and subsidies should support their adoption. Engaging with consumers about potential long-term tariff changes and the possibility of future battery subsidies will help households factor this into their DER investment decisions.

4. Conclusions

Western Australia has one of the most extensive isolated grids in the world and is already experiencing the impact of higher renewables penetration. Rooftop solar is the largest generation source on Western Australia’s SWIS network. The take-up of solar PV continues to increase. Reverse power flows are leading to low load and grid instability concerns. The primary network solution is Emergency Solar Management, which allows grid operators to disconnect new PV systems, albeit as a last resort. There is a consensus that energy storage is one of the possible solutions and, therefore, a critical part of the energy transition. There is also widespread commentary that this storage will be needed at all levels of the network, including distribution both behind and in front of the meter. There are valid non-financial reasons for purchasing a residential battery, such as the need for emergency backup. However, most households currently view battery purchases from a strong financial perspective. There is a widespread view that batteries are still too expensive and that, in most cases, the battery warranty will expire before the battery payback period. This research carried out techno-economic modeling to address this question, investigating under what conditions home batteries are or will become financially viable in Western Australia. ‘Financially viable’ has been defined as Net Present Value/Net Present Cost. The modeling in this project has also deliberately addressed the current and near term. Therefore, the modeling has used current prices and tariffs. This research has found that there are already cases in Western Australia where PV + Battery systems are financially viable. However, this heavily depends on the load profile, daily energy use, tariff, and grid sale limit assumptions. If flat tariffs are eliminated, PV + Battery solutions become financially viable at current battery prices, impacting consumers without these systems. Unless there is a significant drop in the installed battery price or action to reduce the uncertainty for consumers, most households will continue to delay investment in residential batteries.

Author Contributions

Conceptualization, I.H. and A.A.; methodology, I.H.; software, I.H.; validation, I.H. and A.A.; investigation, I.H., M.G. and A.A.; writing—original draft preparation, I.H. and M.G.; writing—review and editing, I.H., M.G. and A.A.; visualization, I.H. and M.G.; supervision, A.A. All authors have read and agreed to the published version of the manuscript.

Funding

This research received funding from Edith Cowan University.

Institutional Review Board Statement

Exempt from human research ethics review.

Informed Consent Statement

Not applicable.

Data Availability Statement

The data presented in this study are available on request from the corresponding author.

Conflicts of Interest

The authors declare no conflicts of interest.

References

  1. Ghahramani, M.; Sadat-Mohammadi, M.; Nazari-Heris, M.; Asadi, S.; Mohammadi-Ivatloo, B. Introduction and literature review of the operation of multi-carrier energy networks. In Planning and Operation of Multi-Carrier Energy Networks; Springer: Berlin/Heidelberg, Germany, 2021; pp. 39–57. [Google Scholar]
  2. Wanapinit, N.; Offermann, N.; Thelen, C.; Kost, C.; Rehtanz, C. Operative Benefits of Residential Battery Storage for Decarbonizing Energy Systems: A German Case Study. Energies 2024, 17, 2376. [Google Scholar] [CrossRef]
  3. Ghahramani, M.; Habibi, D.; Ghahramani, M.; Nazari-Heris, M.; Aziz, A. Sustainable Buildings: A Comprehensive Review and Classification of Challenges and Issues, Benefits, and Future Directions. In Natural Energy, Lighting, and Ventilation in Sustainable Buildings; Springer: Berlin/Heidelberg, Germany, 2023; pp. 1–28. [Google Scholar]
  4. Brumana, G.; Ghirardi, E.; Franchini, G. Comparison of Different Power Generation Mixes for High Penetration of Renewables. Sustainability 2024, 16, 8435. [Google Scholar] [CrossRef]
  5. Burger, E.M.; Moura, S.J. Generation following with thermostatically controlled loads via alternating direction method of multipliers sharing algorithm. Electr. Power Syst. Res. 2017, 146, 141–160. [Google Scholar] [CrossRef]
  6. Soleimani, H.; Habibi, D.; Ghahramani, M.; Aziz, A. Strengthening Power Systems for Net Zero: A Review of the Role of Synchronous Condensers and Emerging Challenges. Energies 2024, 17, 3291. [Google Scholar] [CrossRef]
  7. Ghahramani, M.; Nazari-Heris, M.; Zare, K.; Mohammadi-ivatloo, B. Robust short-term scheduling of smart distribution systems considering renewable sources and demand response programs. In Robust Optimal Planning and Operation of Electrical Energy Systems; Springer: Berlin/Heidelberg, Germany, 2019; pp. 253–270. [Google Scholar]
  8. Chen, Z.; Amani, A.M.; Yu, X.; Jalili, M. Control and optimisation of power grids using smart meter data: A review. Sensors 2023, 23, 2118. [Google Scholar] [CrossRef]
  9. Moreno-Muñoz, A.; Giacomini, N. Energy Smart Appliances: Applications, Methodologies, and Challenges; John Wiley & Sons: Hoboken, NJ, USA, 2023. [Google Scholar]
  10. Ghahramani, M.; Heris, M.N.; Zare, K.; Ivatloo, B.M. Incorporation of demand response programs and wind turbines in optimal scheduling of smart distribution networks: A case study. In Proceedings of the 2017 Conference on Electrical Power Distribution Networks Conference (EPDC), Semnan, Iran, 19–20 April 2017; pp. 25–32. [Google Scholar]
  11. Huang, L.; Sun, W.; Li, Q.; Li, W. Distributed real-time economic dispatch for islanded microgrids with dynamic power demand. Appl. Energy 2023, 342, 121156. [Google Scholar] [CrossRef]
  12. Babu, K.V.S.M.; Vinay, K.S.S.; Chakraborty, P. Peer-to-peer sharing of energy storage systems under net metering and time-of-use pricing. IEEE Access 2023, 11, 3118–3128. [Google Scholar] [CrossRef]
  13. Ghahramani, M.; Zare, K.; Mohammadi-Ivatloo, B. Optimal energy procurement of smart large consumers incorporating parking lot, renewable energy sources and demand response program. Int. J. Smart Electr. Eng. 2018, 7, 145–154. [Google Scholar]
  14. Behi, B.; Jennings, P.; Arefi, A.; Azizivahed, A.; Pivrikas, A.; Muyeen, S.; Gorjy, A. A Robust Participation in the Load Following Ancillary Service and Energy Markets for a Virtual Power Plant in Western Australia. Energies 2023, 16, 3054. [Google Scholar] [CrossRef]
  15. ARENA. Energy Storage Study. 2015. Available online: https://arena.gov.au/knowledge-bank/energy-storage-study/ (accessed on 21 October 2024).
  16. Ghahramani, M.; Nazari-Heris, M.; Zare, K.; Mohammadi-Ivatloo, B. Energy and reserve management of a smart distribution system by incorporating responsive-loads/battery/wind turbines considering uncertain parameters. Energy 2019, 183, 205–219. [Google Scholar] [CrossRef]
  17. Graham, P.; Havas, L. Projections for Small-Scale Embedded Technologies; Report; CSIRO: Canberra, Australia, 2020. [Google Scholar]
  18. Laslett, D.; Carter, C.; Creagh, C.; Jennings, P. A large-scale renewable electricity supply system by 2030: Solar, wind, energy efficiency, storage and inertia for the South West Interconnected System (SWIS) in Western Australia. Renew. Energy 2017, 113, 713–731. [Google Scholar] [CrossRef]
  19. Lu, B.; Blakers, A.; Stocks, M. 90–100% renewable electricity for the south west interconnected system of western Australia. Energy 2017, 122, 663–674. [Google Scholar] [CrossRef]
  20. Wilkinson, S.; Maticka, M.J.; Liu, Y.; John, M. The duck curve in a drying pond: The impact of rooftop PV on the Western Australian electricity market transition. Util. Policy 2021, 71, 101232. [Google Scholar] [CrossRef]
  21. Australian Energy Market Operator. 2022 Wholesale Electricity Market Electricity Statement of Opportunities: June 2022; Australian Energy Market Operator: Melbourne, Australia, 2022. [Google Scholar]
  22. Helwig, A.; Bell, J. What energy storage technologies will Australia need as renewable energy penetration rises? J. Energy Storage 2024, 95, 112701. [Google Scholar]
  23. Shaikh, R.A.; Vowles, D.J.; Dinovitser, A.; Allison, A.; Abbott, D. Robust capital cost optimization of generation and multitimescale storage requirements for a 100% renewable Australian electricity grid. PNAS Nexus 2024, 3, 127. [Google Scholar] [CrossRef]
  24. Madsen, C. Low Load Responses–Distributed Photovoltaic Generation Management; Australian Energy Market Operator: Melbourne, Australia, 2021. [Google Scholar]
  25. Maticka, M.J. The SWIS DUCK–Value pricing analysis of commercial scale photovoltaic generation in the South West Interconnected System. Electr. J. 2019, 32, 57–65. [Google Scholar] [CrossRef]
  26. Alam, M.S.; Al-Ismail, F.S.; Salem, A.; Abido, M.A. High-level penetration of renewable energy sources into grid utility: Challenges and solutions. IEEE Access 2020, 8, 190277–190299. [Google Scholar] [CrossRef]
  27. Das, B.K.; Hassan, R.; Islam, M.S.; Rezaei, M. Influence of energy management strategies and storage devices on the techno-enviro-economic optimization of hybrid energy systems: A case study in Western Australia. J. Energy Storage 2022, 51, 104239. [Google Scholar] [CrossRef]
  28. Tidemann, C.; Engerer, N.; Franklin, E.; Hussey, K.; Pezzey, J.C. Promoting behind-the-meter battery storage: Options for more effective government support and regulation. Int. J. Technol. Intell. Plan. 2018, 12, 77–98. [Google Scholar] [CrossRef]
  29. Edelenbosch, O.Y.; Hof, A.F.; Nykvist, B.; Girod, B.; Van Vuuren, D.P. Transport electrification: The effect of recent battery cost reduction on future emission scenarios. Clim. Chang. 2018, 151, 95–108. [Google Scholar] [CrossRef]
  30. Say, K.; John, M.; Dargaville, R. Power to the people: Evolutionary market pressures from residential PV battery investments in Australia. Energy Policy 2019, 134, 110977. [Google Scholar] [CrossRef]
  31. Roberts, M.B.; Adams, S.M.; Kuch, D. Social license to automate batteries? Australian householder conditions for participation in Virtual Power Plants. Energy Res. Soc. Sci. 2023, 104, 103241. [Google Scholar] [CrossRef]
  32. Csereklyei, Z.; Dwyer, S.; Kallies, A.; Economou, D. The role of community-scale batteries in the energy transition: Case studies from Australia’s National Electricity Market. J. Energy Storage 2024, 93, 112277. [Google Scholar] [CrossRef]
  33. Ransan-Cooper, H.; Shaw, M.; Sturmberg, B.C.; Blackhall, L. Neighbourhood batteries in Australia: Anticipating questions of value conflict and (in)justice. Energy Res. Soc. Sci. 2022, 90, 102572. [Google Scholar] [CrossRef]
  34. Parra, D.; Swierczynski, M.; Stroe, D.I.; Norman, S.A.; Abdon, A.; Worlitschek, J.; O’Doherty, T.; Rodrigues, L.; Gillott, M.; Zhang, X. An interdisciplinary review of energy storage for communities: Challenges and perspectives. Renew. Sustain. Energy Rev. 2017, 79, 730–749. [Google Scholar] [CrossRef]
  35. Mohseni, S.; Rutovitz, J.; Smith, H.; Dwyer, S.; Tahir, F. Economic Viability Assessment of Neighbourhood versus Residential Batteries: Insights from an Australian Case Study. Sustainability 2023, 15, 16331. [Google Scholar] [CrossRef]
  36. Alipour, M.; Stewart, R.A.; Sahin, O. Beyond the diffusion of residential solar photovoltaic systems at scale: Allegorising the battery energy storage adoption behaviour. Energies 2021, 14, 5015. [Google Scholar] [CrossRef]
  37. Pradhan, P.; Ahmad, I.; Habibi, D.; Aziz, A.; Al-Hanahi, B.; Masoum, M.A. Optimal sizing of energy storage system to reduce impacts of transportation electrification on power distribution transformers integrated with photovoltaic. IEEE Access 2021, 9, 144687–144698. [Google Scholar] [CrossRef]
  38. Energy Policy WA. Distributed Energy Resources Roadmap; Energy Policy WA: Perth, Australia, 2020. [Google Scholar]
  39. Eghbal, D. Grid transformation driven by high uptake of distributed energy resources—An Australian case study. In Decentralized Frameworks for Future Power Systems; Elsevier: Amsterdam, The Netherlands, 2022; pp. 51–80. [Google Scholar]
  40. Energy Policy WA. Energy Buyback Schemes. 2022. Available online: https://www.wa.gov.au/organisation/energy-policy-wa/energy-buyback-schemes (accessed on 21 October 2024).
  41. Synergy. FIT Changes. 2022. Available online: https://www.synergy.net.au/Global/FIT-Faq (accessed on 21 October 2024).
  42. Kloppenburg, S.; Smale, R.; Verkade, N. Technologies of engagement: How battery storage technologies shape householder participation in energy transitions. Energies 2019, 12, 4384. [Google Scholar] [CrossRef]
  43. Feron, S. Sustainability of off-grid photovoltaic systems for rural electrification in developing countries: A review. Sustainability 2016, 8, 1326. [Google Scholar] [CrossRef]
  44. van Groenou, A.B.; Lovell, H.; Franklin, E. Household decision-making for home batteries. In Proceedings of the Asia Pacific Solar Research Conference, Sydney, Australia, 4–6 December 2018. [Google Scholar]
  45. Esplin, R.; Nelson, T. Redirecting solar feed in tariffs to residential battery storage: Would it be worth it? Econ. Anal. Policy 2022, 73, 373–389. [Google Scholar] [CrossRef]
  46. Agnew, S.; Smith, C.; Dargusch, P. Causal loop modelling of residential solar and battery adoption dynamics: A case study of Queensland, Australia. J. Clean. Prod. 2018, 172, 2363–2373. [Google Scholar] [CrossRef]
  47. Mulleriyawage, U.G.; Shen, W.; Hu, C. Battery system selection in DC microgrids for residential applications: An Australian case study. In Proceedings of the 2019 14th IEEE Conference on Industrial Electronics and Applications (ICIEA), Xi’an, China, 19–21 June 2019; pp. 1926–1931. [Google Scholar]
  48. Alarrouqi, R.A.; Ellabban, O.; Al-Fagih, L. An assessment of different load demands on photovoltaic plus battery storage system profitability: A case study of Australia. In Proceedings of the 2020 IEEE 29th International Symposium on Industrial Electronics (ISIE), Delft, The Netherlands, 17–19 June 2020; pp. 1497–1502. [Google Scholar]
  49. Khezri, R.; Mahmoudi, A.; Haque, M.H. Optimal capacity of PV and BES for grid-connected households in South Australia. In Proceedings of the 2019 IEEE Energy Conversion Congress and Exposition (ECCE), Baltimore, MD, USA, 29 September–3 October 2019; pp. 3483–3490. [Google Scholar]
  50. Sharma, V.; Haque, M.H.; Aziz, S.M. Comparative evaluation of alternative tariffs on energy cost of households with PV and battery. In Proceedings of the 2019 29th Australasian Universities Power Engineering Conference (AUPEC), Nadi, Fiji, 26–29 November 2019; pp. 1–6. [Google Scholar]
  51. Shaw-Williams, D. A Techno-Economic Network Assessment of Household Generation and Battery Storage; Queensland University of Technology: Brisbane, Australia, 2019. [Google Scholar]
  52. Barbour, E.; González, M.C. Projecting battery adoption in the prosumer era. Appl. Energy 2018, 215, 356–370. [Google Scholar] [CrossRef]
  53. Agnew, S.; Dargusch, P. Consumer preferences for household-level battery energy storage. Renew. Sustain. Energy Rev. 2017, 75, 609–617. [Google Scholar] [CrossRef]
  54. Nygård, H.S.; Ottesen, S.Ø.; Skonnord, O.H. Profitability Analyses for Residential Battery Investments: A Norwegian Case Study. Energies 2024, 17, 4048. [Google Scholar] [CrossRef]
  55. Dam, M.R.; van der Laan, M.D. Techno-Economic Assessment of Battery Systems for PV-Equipped Households with Dynamic Contracts: A Case Study of The Netherlands. Energies 2024, 17, 2991. [Google Scholar] [CrossRef]
  56. Orangi, S.; Manjong, N.; Clos, D.P.; Usai, L.; Burheim, O.S.; Strømman, A.H. Historical and prospective lithium-ion battery cost trajectories from a bottom-up production modeling perspective. J. Energy Storage 2024, 76, 109800. [Google Scholar] [CrossRef]
  57. Ratnam, E.L.; Weller, S.R.; Kellett, C.M. An optimization-based approach to scheduling residential battery storage with solar PV: Assessing customer benefit. Renew. Energy 2015, 75, 123–134. [Google Scholar]
  58. Zhu, B.; Lu, J.; Water, W.; Katsanevakis, M.; Moghimi, M.; Leskarac, D.; Stegen, S. Battery-Based Storage for Communities; Griffith University: Queensland, Australia, 2018. [Google Scholar]
  59. Yianni, C.; Florides, M.; Afxentis, S.; Efthymiou, V.; Georghiou, G.E. Economic viability of battery energy storage system applications. In Proceedings of the 2018 IEEE International Energy Conference (ENERGYCON), Limassol, Cyprus, 3–7 June 2018; pp. 1–6. [Google Scholar]
  60. Zhou, J.; Tsianikas, S.; Birnie, D.P., III; Coit, D.W. Economic and resilience benefit analysis of incorporating battery storage to photovoltaic array generation. Renew. Energy 2019, 135, 652–662. [Google Scholar] [CrossRef]
  61. Konstantinou, G.; Wang, G.A.; Zhan, Y. Current economic viability of combined PV and battery energy storage systems for Australian households. In Proceedings of the 2016 Australasian Universities Power Engineering Conference (AUPEC), Brisbane, Australia, 25–28 September 2016; pp. 1–6. [Google Scholar]
  62. Nicholls, A.; Sharma, R.; Saha, T. Financial and environmental analysis of rooftop photovoltaic installations with battery storage in Australia. Appl. Energy 2015, 159, 252–264. [Google Scholar]
  63. Sykes, J. Solar Batteries—Are They Worth It? Available online: https://www.solarchoice.net.au/research-solar/is-home-battery-storage-worth-it/ (accessed on 21 October 2024).
  64. Redback Technologies. We’ve Compared the Electricity Costs in a Household in WA Without Solar, with Solar, and with Solar and Battery Storage. Available online: https://redbacktech.com/wa-electricity-costs-comparison-solar-and-batteries/ (accessed on 21 October 2024).
  65. Shaw, M.; Sturmberg, B.; Mediwaththe, C.; Ransan-Cooper, H.; Taylor, D.; Blackhall, L. Community Batteries: A Cost/Benefit Analysis; Technical Report; Australian Renewable Energy Agency: Sydney, Australia, 2020. [Google Scholar]
  66. Sykes, J. How Much do Solar Panels Cost? 2024. Available online: https://www.solarchoice.net.au/residential/solar-power-system-prices/ (accessed on 21 October 2024).
Figure 1. Benefits of energy storage systems across the power system.
Sustainability 16 10432 g001
Figure 2. Six synthetic load profiles utilized for sensitivity modeling.
Sustainability 16 10432 g002
Figure 3. Series 1 result showing winning system for Daily Load (kWh/day) versus Battery Price (0.5× to 1.0×), with nominal battery size plotted on the surface. This image is for the Big Energy User profile, for a grid sale limit of 10 kW.
Sustainability 16 10432 g003
Figure 4. HOMER results from series 1 to illustrate how the winning system configuration changes based on the Load Profile, Battery Price, and Allowable Grid Sales. The arrow in the center of the image highlights the relationship between increasing grid sales limits and the transition of optimal system configurations across different load profiles. It serves to emphasize the directional changes in system selection as both load and battery prices vary under different grid sales constraints.
Sustainability 16 10432 g004
Figure 5. Series 2 result for the winning system for the load profile “Young Family”, showing the impact of load size versus nominal discount rate.
Sustainability 16 10432 g005
Figure 6. HOMER results from series 2 to illustrate how the winning system configuration changes based on the Load Profile, Discount rate, and CO2 emissions penalty. The arrow indicates the relationship between increasing CO2 emissions penalties and the shift in optimal system configurations. It highlights the impact of these penalties on system selection across different load profiles and discount rates, demonstrating the changes in system economics as environmental costs are factored into the analysis.
Sustainability 16 10432 g006
Figure 7. Series 3 results for Young Family profile at 30 kWh/day, CO2 penalty 0 AUD/t, showing the impact on battery price and discount rate for changing grid sales limit. The dotted line represents the transition boundary between the PV-only system and the PV + Battery system, illustrating the conditions under which each system configuration becomes optimal based on the discount rate and battery price.
Sustainability 16 10432 g007
Figure 8. Series 3 results for Big Energy profile at 30 kWh/day, CO2 penalty 0 AUD/t, showing the impact on battery price and discount rate for changing grid sales limit. The dotted line represents the transition boundary between the PV-only system and the PV + Battery system, indicating the conditions under which each configuration becomes optimal as a function of the discount rate and battery price.
Sustainability 16 10432 g008
Figure 9. Comparison of the same load and variables, with only the battery replacement cost, changed from AUD 1000 to AUD 500.
Sustainability 16 10432 g009
Figure 10. Impact of tariff changes on the optimal system configuration.
Sustainability 16 10432 g010
Figure 11. Impact of the available tariffs on the optimal system configuration for different daily loads and new battery prices. Each graphic is an annotated optimal system type output from a HOMER Grid sensitivity simulation.
Sustainability 16 10432 g011
Table 1. Comparison of Motivations for Residential Battery Storage.
Ref.Motivation Factors for Investing in Residential Battery StorageKey Insights
[53]Off-grid transition, climate goalsEmphasizes a variety of motivations beyond financial savings
[57]Frustration with feed-in tariffs, desire for independence from utilitiesPsychological factors like security and autonomy play a significant role
[58]Lower peak demand, support local grid stabilityCommunity benefits of storage include delaying the need for network upgrades
[53,59,60]Returns on investment; lower cost of energyThe payback period is still a barrier; it is better in areas with high solar radiation
[57,60]Backup during blackoutsFocuses on the need for energy security
Table 2. Comparison of Challenges for Residential Battery Storage.
Ref.ChallengeImpactInsights
[61]High costs and market complexityDelays in achieving financial ROIThe energy storage market is expected to grow as costs decrease, but it remains complex
[18]Significant price reductions are requiredHigh upfront costsWidespread adoption is unlikely without major reductions in battery costs
[62]Long payback periods for PV + battery systemsPayback period of 11+ yearsPV-only systems are currently more financially viable than PV + battery configurations
Table 3. Parameters for each simulation carried out for the sensitivity analysis.
Simulation ReferenceLoad ProfilesBattery Replacement (AUD/kWh)Battery Price Multiplier (New & Replacement)Load (kWh/Day)Grid Sales Limit (kW)TariffsDiscount Rate (%)CO2 Penalty (AUD/Ton)
1610001.0, 0.75, 0.510, 30, 50, 700, 5, 10Flat-A1, TOU-SH, TOU-MS00
261000110, 30, 50, 705Flat-A1, TOU-SH, TOU-MS0, 5, 100, 50, 100
3610001.0, 0.75, 0.510, 30, 50, 700, 5, 10Flat-A1, TOU-SH, TOU-MS0, 5, 100, 100
4610001.0, 0.75, 0.510, 20, 30, 40, 50, 60, 700, 5, 10Flat-A1, TOU-SH, TOU-MS0, 2.5, 5, 7.5, 10, 12.5, 15100
525001.0, 0.75, 0.610, 30, 50, 700, 5Flat-A1, TOU-SH, TOU-MS0, 5, 100, 100
615001.0, 0.8, 0.7, 0.6, 0.510, 30, 50, 700, 5Flat-A1, TOU-SH, TOU-MS0, 5, 100, 50, 100, 150
725001.0, 0.8, 0.7, 0.6, 0.510, 30, 50, 700, 5Flat-A1, TOU-MS DEBS0, 50
825001.0, 0.8, 0.7, 0.6, 0.510, 30, 50, 700, 5Flat-A1, TOU-MS DEBS0.50
925001.0, 0.8, 0.7, 0.6, 0.510, 30, 50, 700, 5Flat-A1, TOU-MS—Only DEBS Export0, 50
10A6500110, 20, 30, 40, 50, 60, 700, 5, 10Flat-A1, TOU-MS50
10B6350110, 20, 30, 40, 50, 60, 700, 5, 10Flat-A1, TOU-MS50
10C6400110, 20, 30, 40, 50, 60, 700, 5, 10Flat-A1, TOU-SH, TOU-MS50
10D3500110, 20, 30, 40, 50, 60, 700, 5, 10Flat-A150
10E3500110, 20, 30, 40, 50, 60, 700, 5, 10TOU-SH50
10F3500110, 20, 30, 40, 50, 60, 700, 5, 10TOU-MS50
Table 4. Reproducing the Case Study A results for three Perth load profiles.
HOMER Grid Results for the 3 Perth Load Profiles
Load ProfileYoung Adults/Older FamilyYoung Family/RetireesBig Energy User
Daily Consumption20 kWh/day30 kWh/day50 kWh/day
Configuration5 kW PV + 3.5 kWh battery6.6 kW PV + 6.5 kWh battery13 kW PV + 13.5 kWh battery
Capital CostAUD 9890AUD 13,225AUD 25,896
Flat Rate Tariff
MetricYoung Adults/Older FamilyYoung Family/RetireesBig Energy User
HOMER Payback (solar + battery)8.2 years5.9 years6.4 years
Calculated Payback (battery-only)>32 years>16.6 years>12.9 years
HOMER Utility Bill Savings1202 AUD/year2248 AUD/year4031 AUD/year
TOU Tariff
MetricYoung Adults/Older FamilyYoung Family/RetireesBig Energy User
HOMER Payback (solar + battery)6.3 years4.6 years5.0 years
Calculated Payback (battery-only)>22 years8.5 years6.6 years
HOMER Utility Bill Savings1573 AUD/year2855 AUD/year5222 AUD/year
Table 5. HOMER Grid results for “Big Energy User” 50 kWh/day case, for fixed system component sizes and costs as published in the case study.
HOMER Grid Selection OrderConfigurationPVBatteryTariffNPCLCOE
Winning systemPV + Battery13 kW13.5 kWhTOUAUD 72,2340.104 AUD/kWh
2nd systemPV only13 kW-FlatAUD 75,4540.092 AUD/kWh
3rd systemPV + Battery13 kW13.5 kWhFlatAUD 83,3220.120 AUD/kWh
Table 6. HOMER Grid optimizer results for “Big Energy User” 50 kWh/day case, using unit costs derived from the case study.
HOMER Grid Selection OrderConfigurationPVBatteryTariffNPCLCOE
Winning systemPV only21.9 kW-FlatAUD 74,9060.0925 AUD/kWh
2nd systemPV + Battery21.3 kW1 kWhFlatAUD 75,6940.0942 AUD/kWh
3rd systemPV + Battery24.1 kW10 kWhTOUAUD 81,7510.104 AUD/kWh
Disclaimer/Publisher’s Note: The statements, opinions and data contained in all publications are solely those of the individual author(s) and contributor(s) and not of MDPI and/or the editor(s). MDPI and/or the editor(s) disclaim responsibility for any injury to people or property resulting from any ideas, methods, instructions or products referred to in the content.

