Abstract
Every year, harbor and sailing festivals attract close to 20 million visitors in the Baltic Sea region, but their consequences on marine litter pollution are still unknown. We combine field studies with model simulations and literature reviews to quantify the annual emissions of floating macro-litter and to assess its retention in estuaries and role in Baltic Sea pollution. Results focusing on Hanse Sail in Rostock and Kiel Week are extrapolated to the entire Baltic Sea region. After the Hanse Sail 2018, the harbor pollution amounted to about 950 floating macro-litter particles/km²; 85–90% were plastics. We calculated an emission between 0.24 and 3 particles per 1000 visitors, depending on the year and the waste management system. About 0.02% of all waste generated during a festival ends up in the harbor water. The Hanse Sails contributes less than 1% to the total annual macro-litter emissions in the Warnow estuary. Model simulations indicate that over 99% of the emitted litter is trapped in the estuary. Therefore, Hanse Sails are not relevant to Baltic Sea pollution. The extrapolated Baltic-Sea-wide annual emissions are between 4466 and (more likely) 55,830 macro-litter particles. The over-30 harbor and sailing festivals contribute an estimated <0.05% to the total annual macro-litter emissions in the Baltic Sea region.
1. Introduction
For the year 2010, it was estimated that 275 million metric tons of plastic waste were generated worldwide and that between 4.8 and 12.7 million metric tons entered the ocean [1]. Results by Erikssen et al. [2] indicate that macro- (>25 mm) and meso-plastic (>5 mm) together have a mass share of 86% of global marine plastic pollution and are, quantitatively, the most important size fraction. This is the reason why macro-litter is still a research focus. Marine macro-plastics (>25 mm) can be distinguished into floating and sinking material depending on their density. Floating material can be transported by wind and currents over long distances [3], but a large share is accumulated at beaches in the vicinity of the emission pathways via surface wave activity [4,5].
Globally, it is estimated that rivers transport between 1.15 and 2.41 million tons of plastic waste to the oceans, and river transport is considered to be the major pathway for marine litter [6]. For Europe, it is assumed that between 307 and 925 million macro-litter pieces enter the seas via rivers and that 82% are plastics [7]. The largest absolute emissions of floating macro-litter (>25 mm) to the Baltic Sea are calculated to take place via major rivers, namely, the Odra, Vistula, Nemunas, Daugava and Newa (above 500,000 pieces per year and river) [7].
Besides providing important information for macro-litter management, the emission data have been utilized to simulate transport, behavior and deposition in several seas, such as the North Sea [8], the Mediterranean Sea [9], or the Baltic Sea [10]. The model simulations are based on many simplifications. One major weakness is that the retention of litter particles in the coastal zone is neglected [5,11]. Especially in the Baltic Sea, with its complex coastal zone and a multitude of fjords and lagoons, it can be expected that much of the emitted macro-litter is kept back, i.e., deposited on the sea bottom near the coast or washed ashore, and does not reach the open Baltic Sea. Retention in the coastal zone is, alongside retention in rivers, still a missing link in our knowledge that needs to be addressed.
Enclosed seas such as the Baltic Sea, the Black Sea and the Mediterranean Sea are considered as potential hotspots for marine litter (plastic) pollution due to their highly populated coastlines (relative to the sea surface area) and their restricted water exchange (e.g., [12,13]). In a recent study, the annual flux of macro-plastic to the Baltic Sea, excluding riverine loads, is estimated to be between 73 and 226 macro-plastic pieces per 100 m coastline, depending on the urbanization level [14]. This is in the same order of magnitude as riverine inputs to the Baltic Sea [10]. According to Tsiaras et al. [14], the total calculated input of macro-plastic from coastal cities to enclosed seas can far exceed the input via rivers. These calculations are based on population data and sometimes take into account sewage treatment data. However, the present data on macro-litter emissions from coastal cities and along the coastline are highly uncertain because they are merely based on assumptions and calculations. This indicates an urgent need for concrete field studies on macro-litter emissions, especially from coastal urban areas to the sea.
In most parts of the Baltic Sea, coastal city centers do not host industrial ports anymore; instead, the city seaside has been transformed into leisure and recreation areas, hosting leisure boat marinas and offering water access for locals and tourists. The increasing number of people in the city harbor area may have increased emissions, but there is another aspect that moves city and leisure ports into the foreground. City tourism gained importance and the ports became tourist attractions. To promote city tourism, the number of sailing events and port festivals increased, and most cities host at least one port or sailing festival per year. Very large events, such as the Baltic Sail in Gdansk or the Kiel Week, last between four and seven days and report above three million visitors [15,16]. Located directly on the coast, the risk of marine plastic pollution during these events is high (e.g., [17,18]). In the Baltic Sea region, festivals might potentially be a significant source of macro-plastic pollution to the Baltic Sea. However, data concerning sailing events and festivals and their role in litter/plastic emissions to the sea are lacking.
Our overall aim is to gain an insight into the role of harbor festivals on floating macro-litter pollution. Our specific objectives are (a) the calculation of emissions during one major Baltic Sea harbor festival, the Hanse Sail in Rostock, Germany, based on field studies over several years; (b) model simulations on how macro-litter emitted in Rostock city harbor is transported and retained in the estuary as well as a quantification of how much is exported to the open Baltic Sea; (c) an analysis of changes in pollution and their reasons, additionally taking into account the Kiel Week in Kiel, Germany; and (d) the compilation of information about Baltic Sea harbor festivals and the extrapolation of the emissions to the entire Baltic Sea region to acquire an impression of the overall relevance of harbor festivals to the question of marine pollution.
2. Materials and Methods
2.1. Study Area
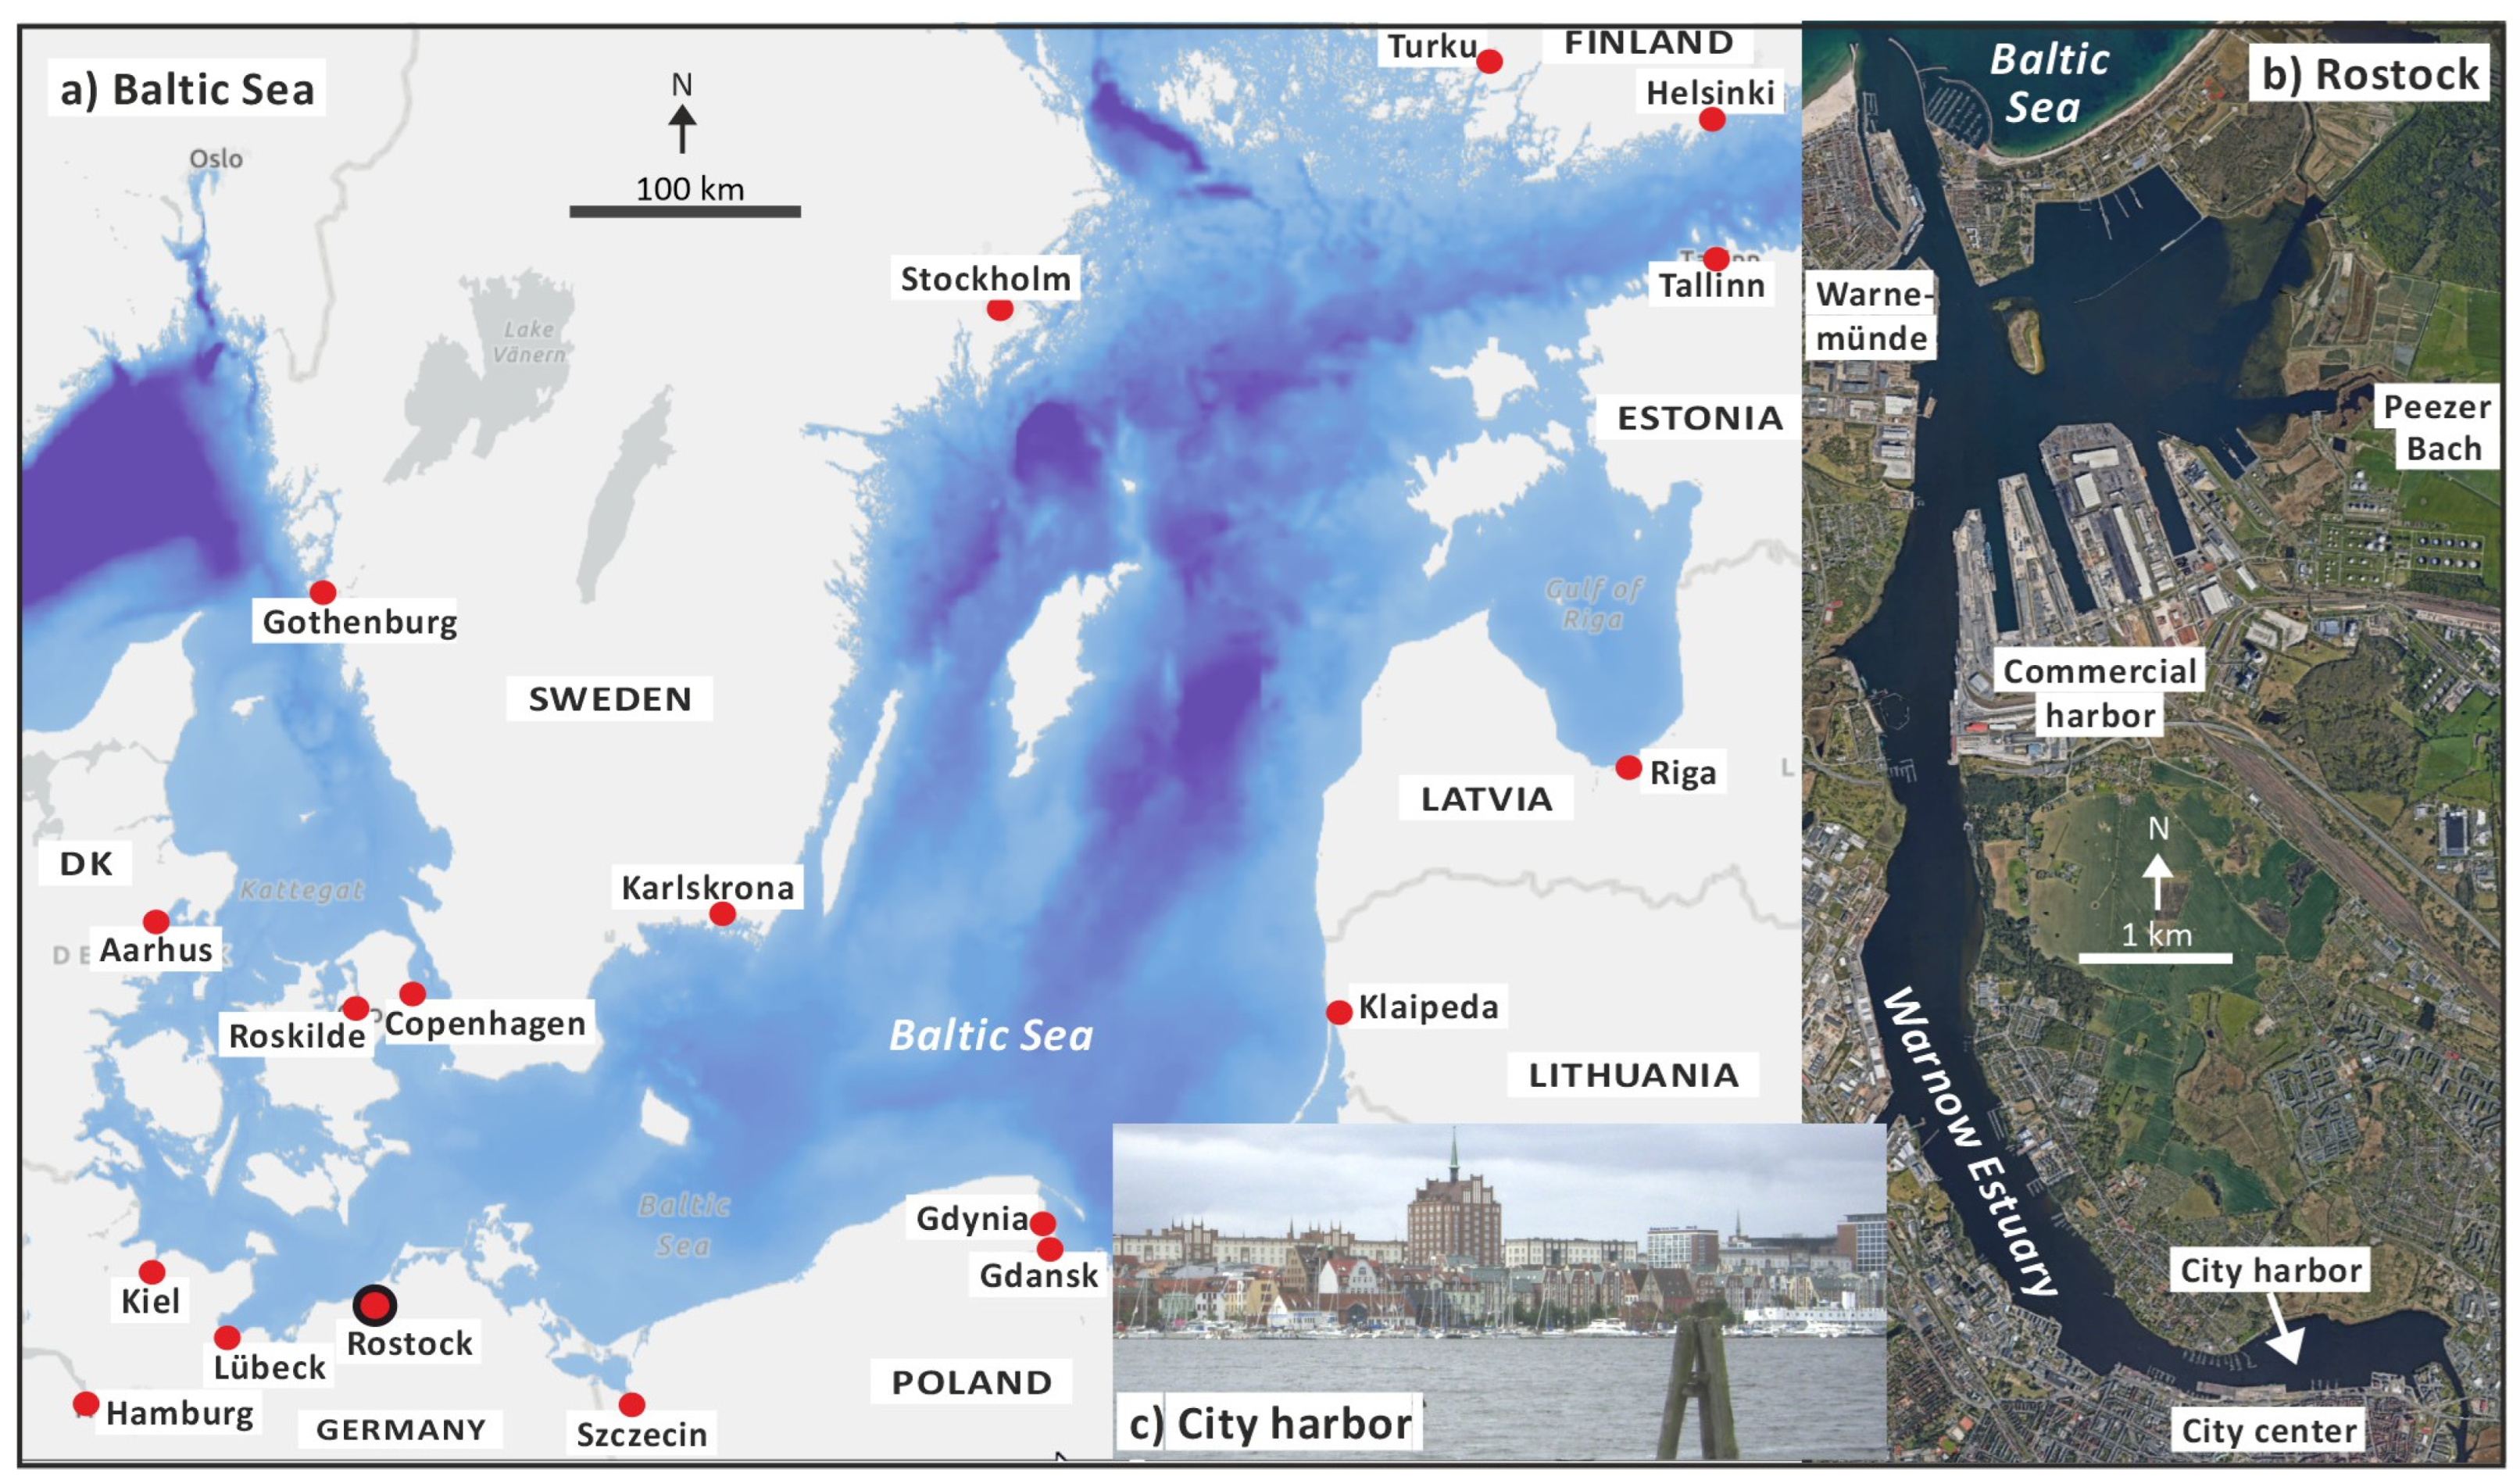
The cities of Rostock (210,000 inhabitants) and Kiel (246,000 inhabitants) are located in the western Baltic Sea and are the most important Baltic Sea harbor cities in Germany. With the Kiel Week (Kieler Woche) and the Hanse Sail Rostock, these cities host major annual sailing and harbor events. The Kiel week is the largest sailing event world-wide and the largest summer festival in the Baltic Sea region. In 2023, it attracted 3.8 million visitors during its nine days, the highest number ever recorded. More than 100 larger historic steam and sailing ships offered boat trips; over 4000 sport-sailors with about 1500 boats took part in the competitions; and 22 cruise ships visited the harbor during the event [15]. The Hanse Sail was founded in 1991 and always takes place on the second weekend in August, from Thursday evening until Sunday evening. In 2023, the Hanse Sail Rostock counted about 500,000 visitors over four days and about 150 ships offered boat trips for visitors [19]. Before the COVID-19 pandemic, for example in 2009, Hanse-Sails counted over 1 million visitors and, in some years, involved over 200 historic ships [20]. The Hanse Sail takes place in the southern part of the Warnow estuary in the city harbor (Figure 1b).

Figure 1.
(a) The central and southwestern Baltic Sea region with major harbor cities and Baltic Sea bathymetry. (b) The Warnow estuary and surrounding areas of the Hanseatic city of Rostock (map based on Google Maps). (c) The city harbor of Rostock.
2.2. Sampling of Macro-Litter during Hanse Sails in Rostock
Field data were gathered during Hanse Sails in 2017, 2018 and 2019, before the COVID-19 pandemic, and in 2023, after the COVID-19 pandemic. During the pandemic, the Hanse Sails did not take place. The sampling concepts and methodologies strongly differed between the years, depending on staff availability as well as synergistic opportunities, such as co-operations with NGOs and public cleaning events. Our focus was on macro-litter above 25 mm, but cigarette butts were always taken into account.
During the Hanse Sail 2017, which took place between 10 and 13 August, a cleaning of floating macro-litter took place on Saturday, 12 August. Using 300 μm plankton nets on sticks, near-shore floating surface litter was sampled along the entire 2.2 km Hanse Sail festival waterfront, with a focus on locations where litter was trapped between ships. After the Hanse Sail, on 14 August, the second sampling took place using the same method. The particles were classified using a simplified OSPAR litter list [21].
In 2018, a public litter collection was carried out the day after the Hanse Sail, which took place between 9 and 12 August. The state of pollution before the Hanse Sail was not assessed. Over 20 persons with a total of 14 canoes cleaned the water surface of the entire Rostock city harbor (1.4 km²) of visible floating litter [22]. The participants were divided into nine groups and each group covered one city harbor sub-area (indicated in Figure 3). The particles where collected, weighed in the laboratory and classified according to the OSPAR litter list [21].
In 2019, the near-shore harbor surface water was cleaned, and the litter was removed the week before the Hanse Sail using a landing net (about 5 mm mesh size) from the harbor wall since much litter is temporarily trapped between boats. During the Hanse Sail 2019, sampling was conducted on Thursday evening, after the first day, on Friday evening, on Sunday morning, as well as on Monday morning, after the event. On Monday morning, landing nets were additionally used from a boat in the harbor. The particles were collected and, later in the laboratory, classified according to the OSPAR litter list [21].
In 2023, the Hanse Sail took place between 10 and 13 August and was accompanied by a data collection campaign. The sampling strategy was based on previous model simulations carried out for comparable wind situations. Weak winds with an average of 3 m/s (light breeze) dominated, and the average hourly maximum wind speed did not exceed 5 m/s. According to the official weather data for Rostock, during the first two days, wind directions between south and west prevailed, followed, subsequently, by turning winds [23]. During all four days, litter emissions were visually assessed three times a day by walking along the festival waterfront. Macro-litter on the floor, overflowing bins and other potential litter emission pathways to the harbor were documented. Additionally, litter particles floating on the sea surface near the harbor walls were photographed, the number estimated, and the type of particles was partly visually determined.
Reed belts around the city harbor were considered as a major trap for floating litter. Consequently, the day before Hanse Sail 2023, the water surface and selected reed belts around the harbor festival area were cleaned of floating litter manually by boat. The same took place on the water around the festival area. The litter was collected and analyzed according to the OSPAR item list [21]. The day after the Hanse Sail, the reed belt front was revisited again by one boat and all floating particles were collected.
2.3. Complementary Data on Ports and during Harbor/Sailing Festivals
To enable general information on macro-litter emissions during events and water pollution, several approaches were applied to strengthen the data and information basis.
Once a year in September, different environmental groups organize the Coastal Clean-up Day around the Warnow Estuary. The aim is the removal of litter from the coastal zone, including the water surface area. The number of involved citizens and the specific locations vary from year to year. In 2022, a total of 139 participants collected a total of 628 kg of macro-litter, including about 3500 cigarette butts, at 17 locations around the Warnow estuary. In 2021, 513 kg od litter were removed at 11 locations. Since 2017, the Citizen Science project, “Natur- & Erlebnisraum Warnow-Ästuar”, carried out by the NABU Regionalverband Mittleres Mecklenburg e.V., has organized an additional clean-up in March. For one location, the coastline around the Peezer Bach (Figure 1), the common beach monitoring method according to OSPAR [21] was applied, including the protocol and the item categorization. The sampling covered 350 m of coastline and a 10 m strip landward and provided comparable and sufficiently reliable pollution data. The internal reports and datasheets were made available by NABU.
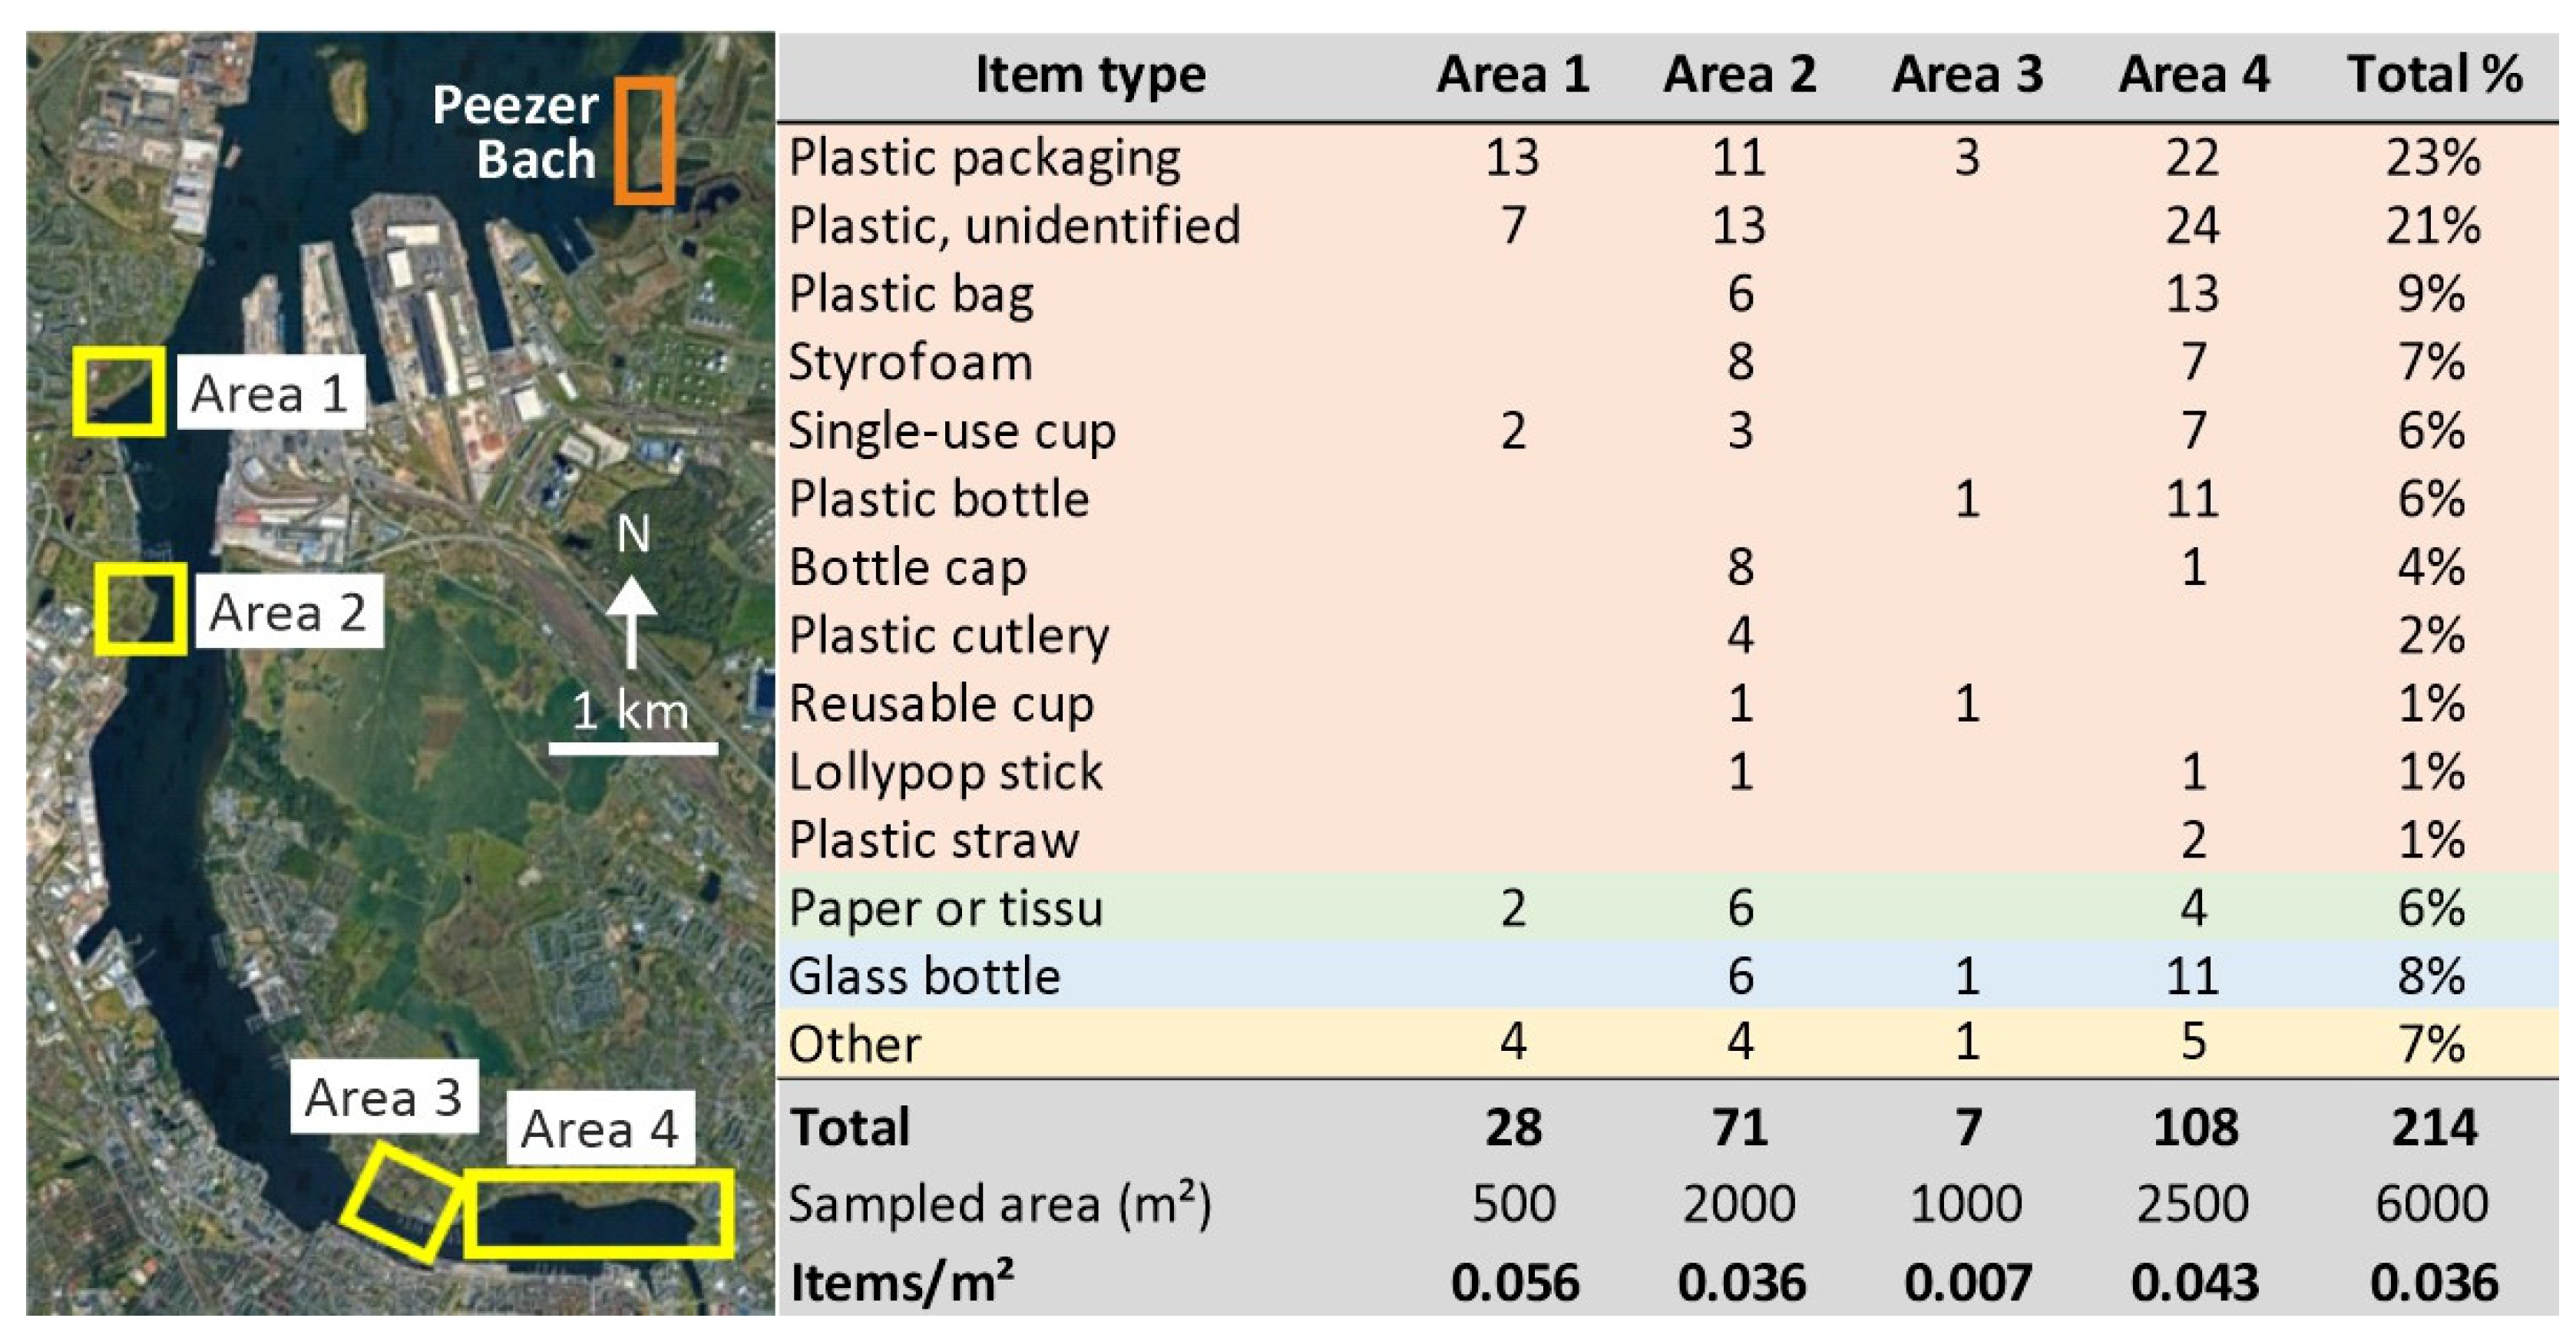
In early May 2023, we investigated floating macro-litter at four reed belts areas in the Warnow estuary (Figure 7). The sampling took place before new reed sprouts inhibited the sampling. It was carried out on foot and using a small boat. A one-meter strip of reed at the sea front was sampled, covering, altogether, about five kilometers of reed belts in the Warnow estuary.
During Kiel Week 2023, Hamburg Port Anniversary 2023, Warnemünde Week and Hanse Sail 2023, additional, alternative approaches to estimating the floating macro-litter emission to the harbor water were applied. One approach was a visual screening of the litter pollution on the floor. Two students recorded the macro-litter on the floor over several hours by walking over large parts of the festival areas. It was assumed that macro-litter that is closer than one meter to the waterfront ends up as harbor water. The results were extrapolated to the entire festival area, for the entire duration, and recalculated into emissions per visitor. Another approach was based on the total number of visitors and the total amount of officially collected waste weight by the city. The waste production in grams per visitor was calculated. This amount was recalculated into the number of litter items using the average weight of observed litter items.
To acquire an impression of past litter pollution during events, for Rostock and Kiel newspaper articles that were accessible via the Internet were analyzed. Additionally, the waste reports and management concepts of both cities and their development were analyzed.
To enable a quantification of the role of harbor events on macro-litter pollution in the Baltic Sea region, information from the Internet (search engine) and literature was reviewed. Data of over 50 events were compiled in a table, containing name and type of event, time, duration and frequency, number of local inhabitants and visitors, number of ships involved, geographical location and setting of the harbor, as well as costs and waste management concepts. For the 11 largest events, all necessary data could be compiled. For about 20 smaller events (e.g., River Harbour festival Turku, Ship day Helsinki, Archipelago Festival Karlskrona, Hajkutter Festival Nysted, Sail Aland, Haff Sail Ueckermünde, Hafentage Barth), as well as music festivals taking place in the harbor (e.g., Klaipėda Castle Jazz Festival), the number of visitors was partly estimated from publicly available photos.
2.4. Model Setup and Assumptions
Exemplary model simulations were carried out for Rostock harbor, covering the entire Warnow estuary, including the coastal parts of the western Baltic Sea. The model simulations involved two steps: first, a 3D hydrodynamic model calculated hindcast simulations for the years 2009 and 2010; second, the results were used for an offline Lagrangian particle-tracking approach. For the former, the general estuarine transport model (GETM) [24,25] with the General Ocean Turbulence Model (GOTM) [26] was used as the turbulence closure model. Previous studies with GETM/GOTM covered the entire Baltic Sea, and this enabled a coupling of the estuary to the Baltic Sea dynamic, which is imperative to reflecting the estuarine circulation properly.
The study area is numerically discretized on a structured grid with a horizontal resolution of 20 m and a vertical resolution of 25 terrain-following sigma layers. This very high spatial model resolution, implemented in a previous study [27], reflects the harbor infrastructure and bathymetry in detail and provided the precondition for sufficiently realistic model simulations. The meteorological forcing is calculated from the output of a reanalysis product of the German Weather Service (COSMO-REA6) with a temporal resolution of one hour and a spatial resolution of 6 km. Discharge data of the river Warnow were included as daily mean values. Details on boundary conditions, especially the exchange with the Baltic Sea, are provided in Lange et al. [27]. This includes a model validation based on salinity and temperature data. The results show that the model is very able to represent the field data in detail, and for the existing estuarine circulation.
The main output parameters were staggered horizontal current velocities on an Arakawa C-grid, horizontal eddy viscosity calculated using a Smagorinsky parameterization and bottom shear stress based on a quadratic drag, stored with five-minute resolution each. These were used as forcing inputs for the particle-tracking model ocean parcels [28]. Diffusion was considered using the Milstein scheme (first order). Particles were allowed to beach in coastal sections characterized by reeds and beaches. The model approach did not allow us to take into account the remobilization of litter that was previously beached.
2.5. Model Scenario Simulations
The model and Lagrangian plastic transport simulations covered the Hanse Sail in 2009 and in 2010. The years 2009 and 2010 were chosen because of contrasting weather conditions and high plastic emissions. The aim was to acquire an insight into transport and deposition patterns. The results were used for the planning of the field studies in 2023. The model simulations were not repeated for the year 2023 because of a lack of sufficiently highly resolved wind data. Further, the prevailing wind directions were sufficiently represented by the year 2009.
The simulations focused on floating macro-litter, mainly plastic. The group of floating polymers includes, for example, low- and high-density polyethylene (PE, 0.915–0.97 g/cm³ density) and polypropylene (PP, 0.89–0.92 g/cm³ density). These two polymers alone account for 36% (PE) and 21% (PP) of the global total of non-fiber plastics production and are commonly used for packaging, e.g., plastic bags, plastic films, and bottles. Other important floating polymers are cigarette filters (cellulose acetate; ~0.94 g/cm³ density) and polystyrene objects and pieces (e.g., flower pots, yoghurt cups; 0.95–1.1 g/cm³ density). All these polymers accounted for over 95% of all observed floating plastic particles during our studies. All these polymers show a similar behavior in the water, and it is assumed that floating plastic is transported passively within the upper 50 cm of the surface water layer. Wind-driven transport of particles floating above the water surface is not taken into account. The same is true for sinking plastic polymers. The simulations started with the beginning of the Hanse Sail and ended after 10 days.
3. Results
3.1. Hanse Sail Rostock—Floating Litter (Plastic) Particle Composition
During Hanse Sail 2017, floating litter along the festival water was collected on two Hanse Sail days. Altogether, 232 pieces of plastic were found: 33% cigarette butts, 16% food packages, 8% drinking cups, 5% plastic straws, 3% bottle caps and 3% bags, as well as 29% of other plastic pieces. This screening provided an initial insight but did not cover the entire Hanse Sail duration.
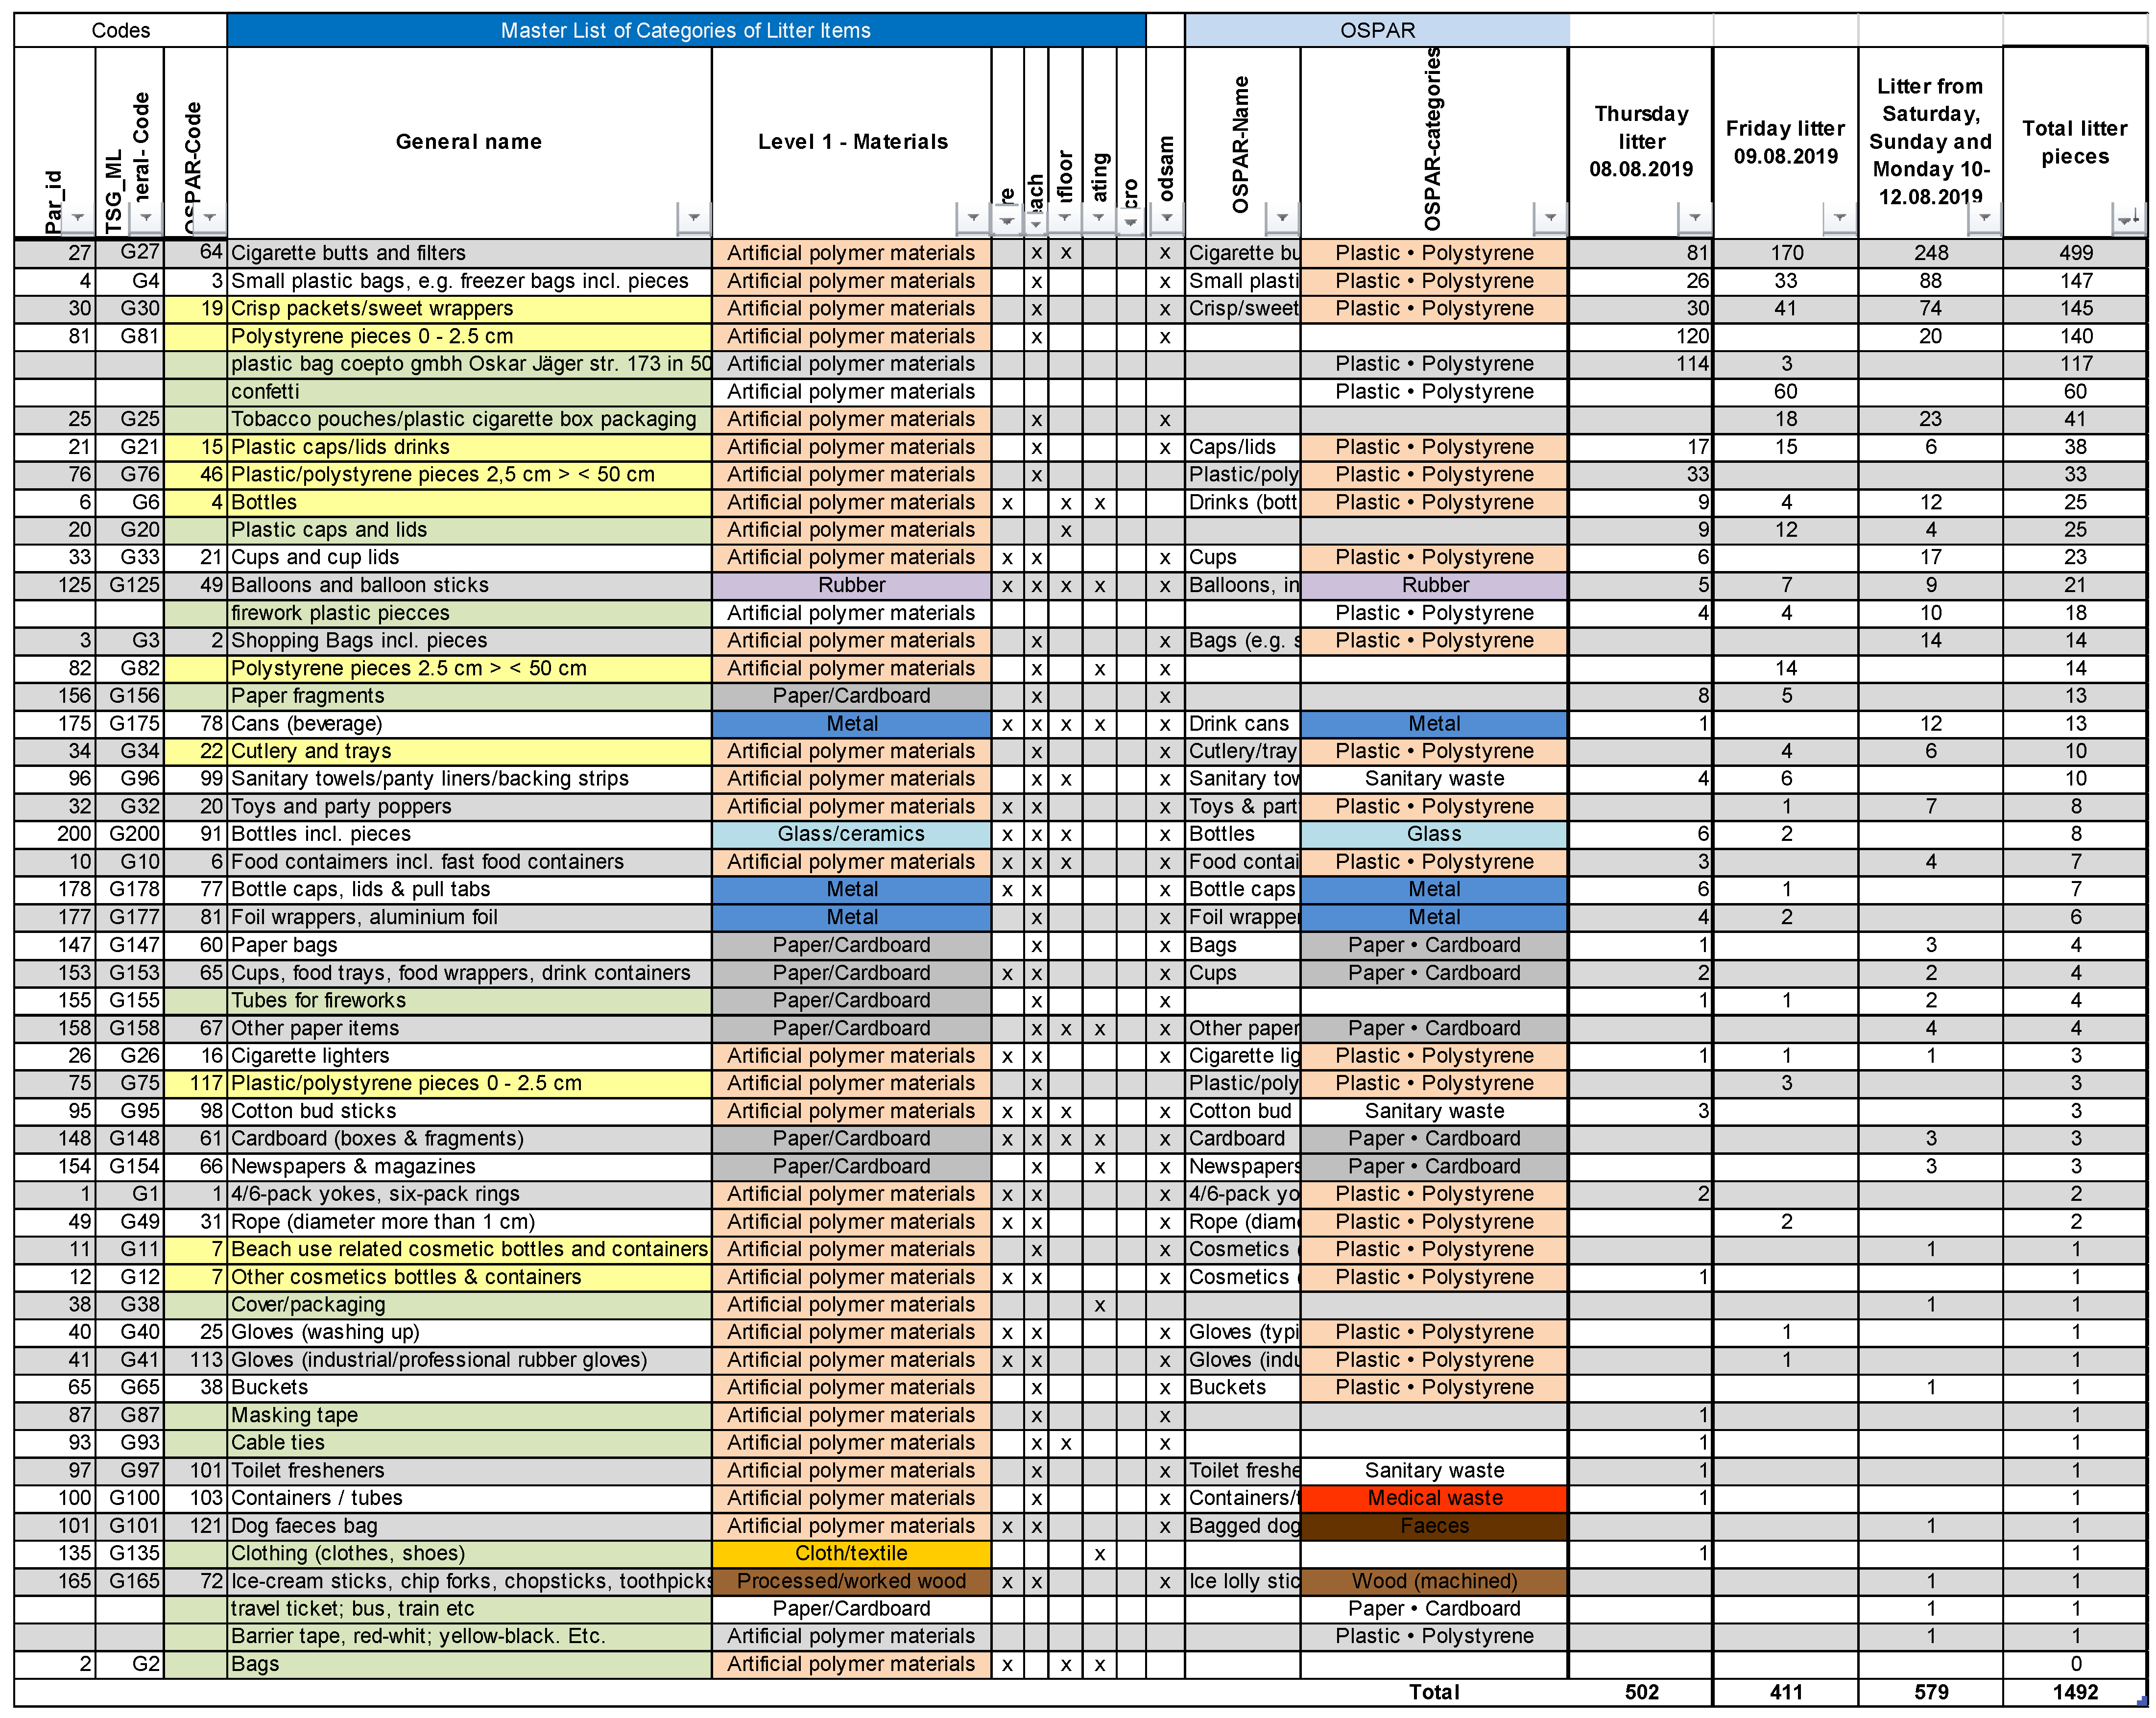
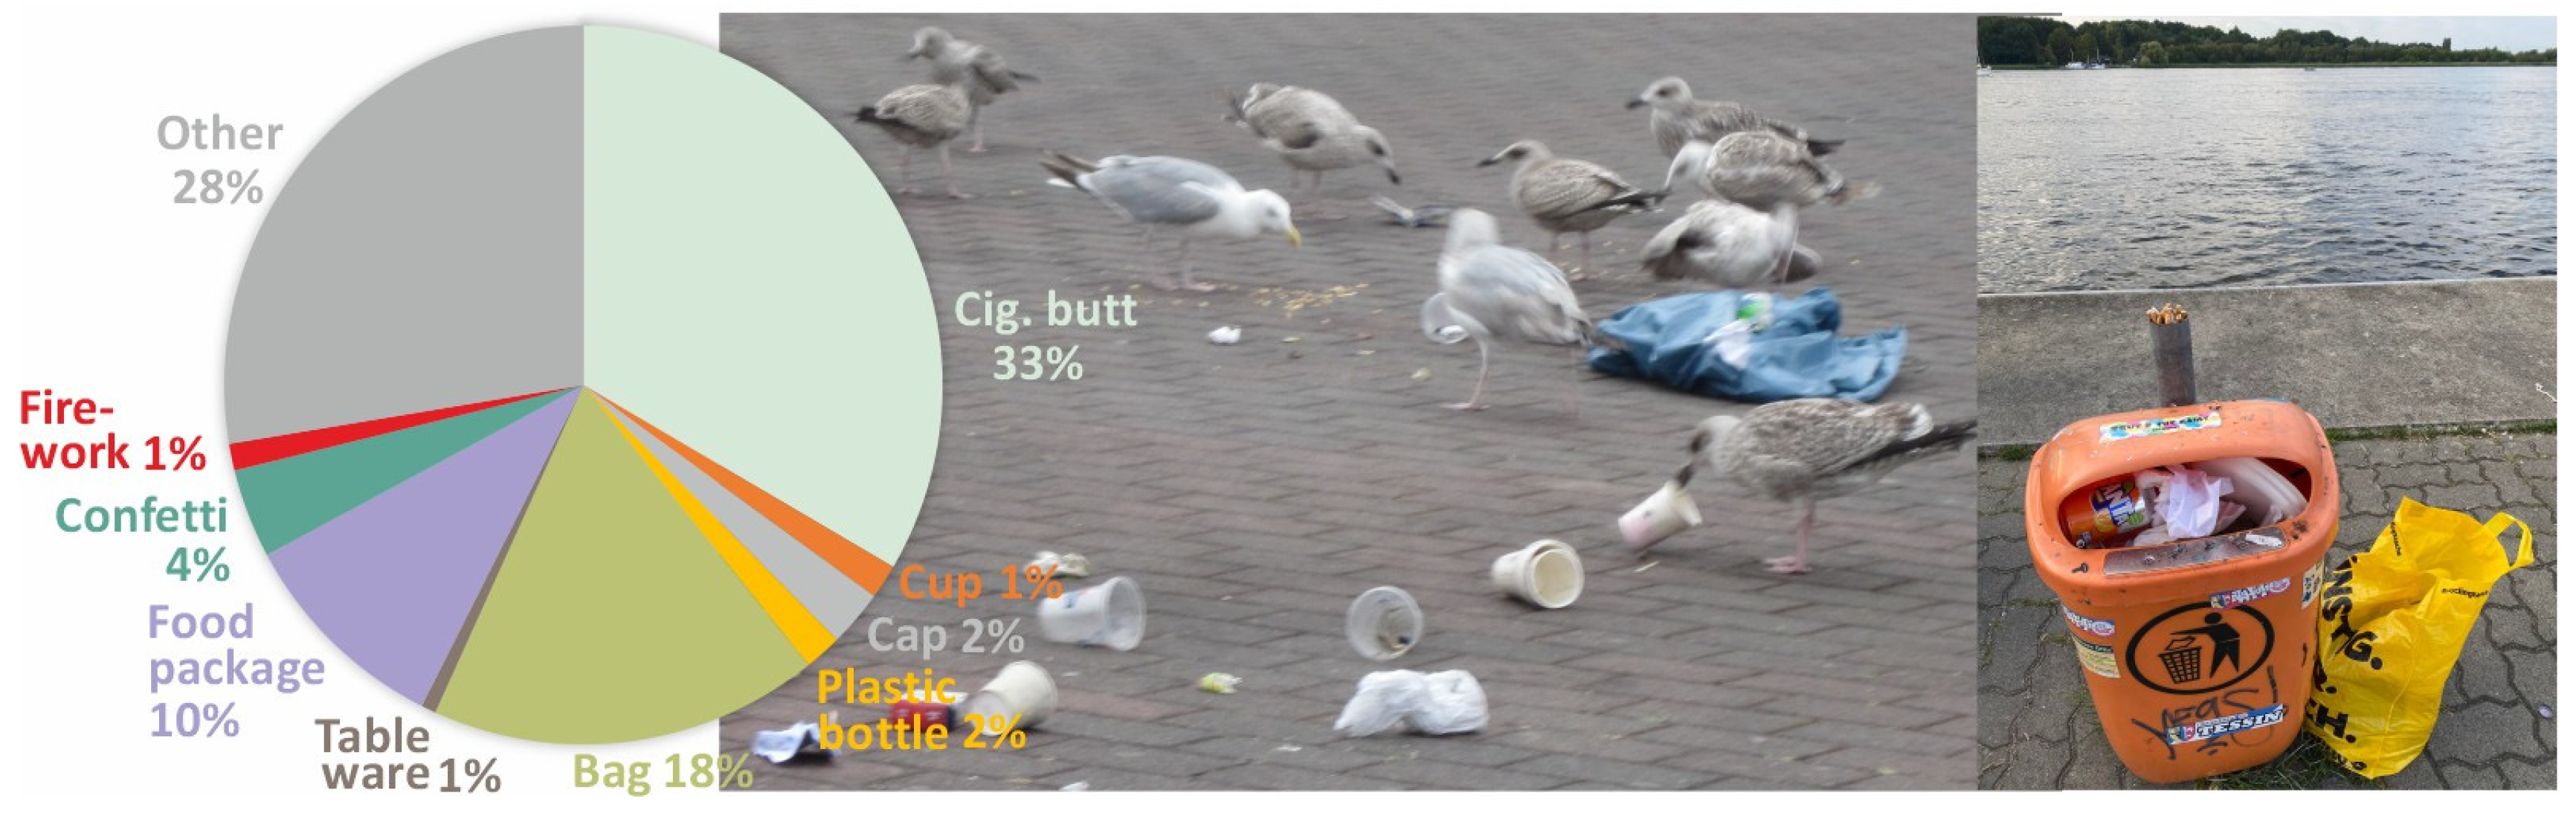
To acquire an improved insight into littering during the entire Hanse Sail duration, in 2019, a more detailed approach than in 2017 was applied. The full data are provided in Appendix A. The amount of collected floating particles was 1492 (502 on Thursday evening, 411 on Friday and 579 on Sunday/Monday). The share of plastic was above 90%; among them, 33% cigarette butts, 18% plastic bags, 10% food packages, 4% confetti, 2% cups, 3% caps, 2% bottles, 1% tableware and 1% firework pieces (Figure 2).

Figure 2.
The pie chart shows the relative share of floating macro-litter item types. It is based on the 1492 particles collected in the Rostock harbor area during the Hanse Sail festival in 2019. The category “Other” indicates other plastic items. The photos indicate potential pollution pathways to the harbor water, namely, sea-gulls and inappropriate waste collection (data in Appendix A).
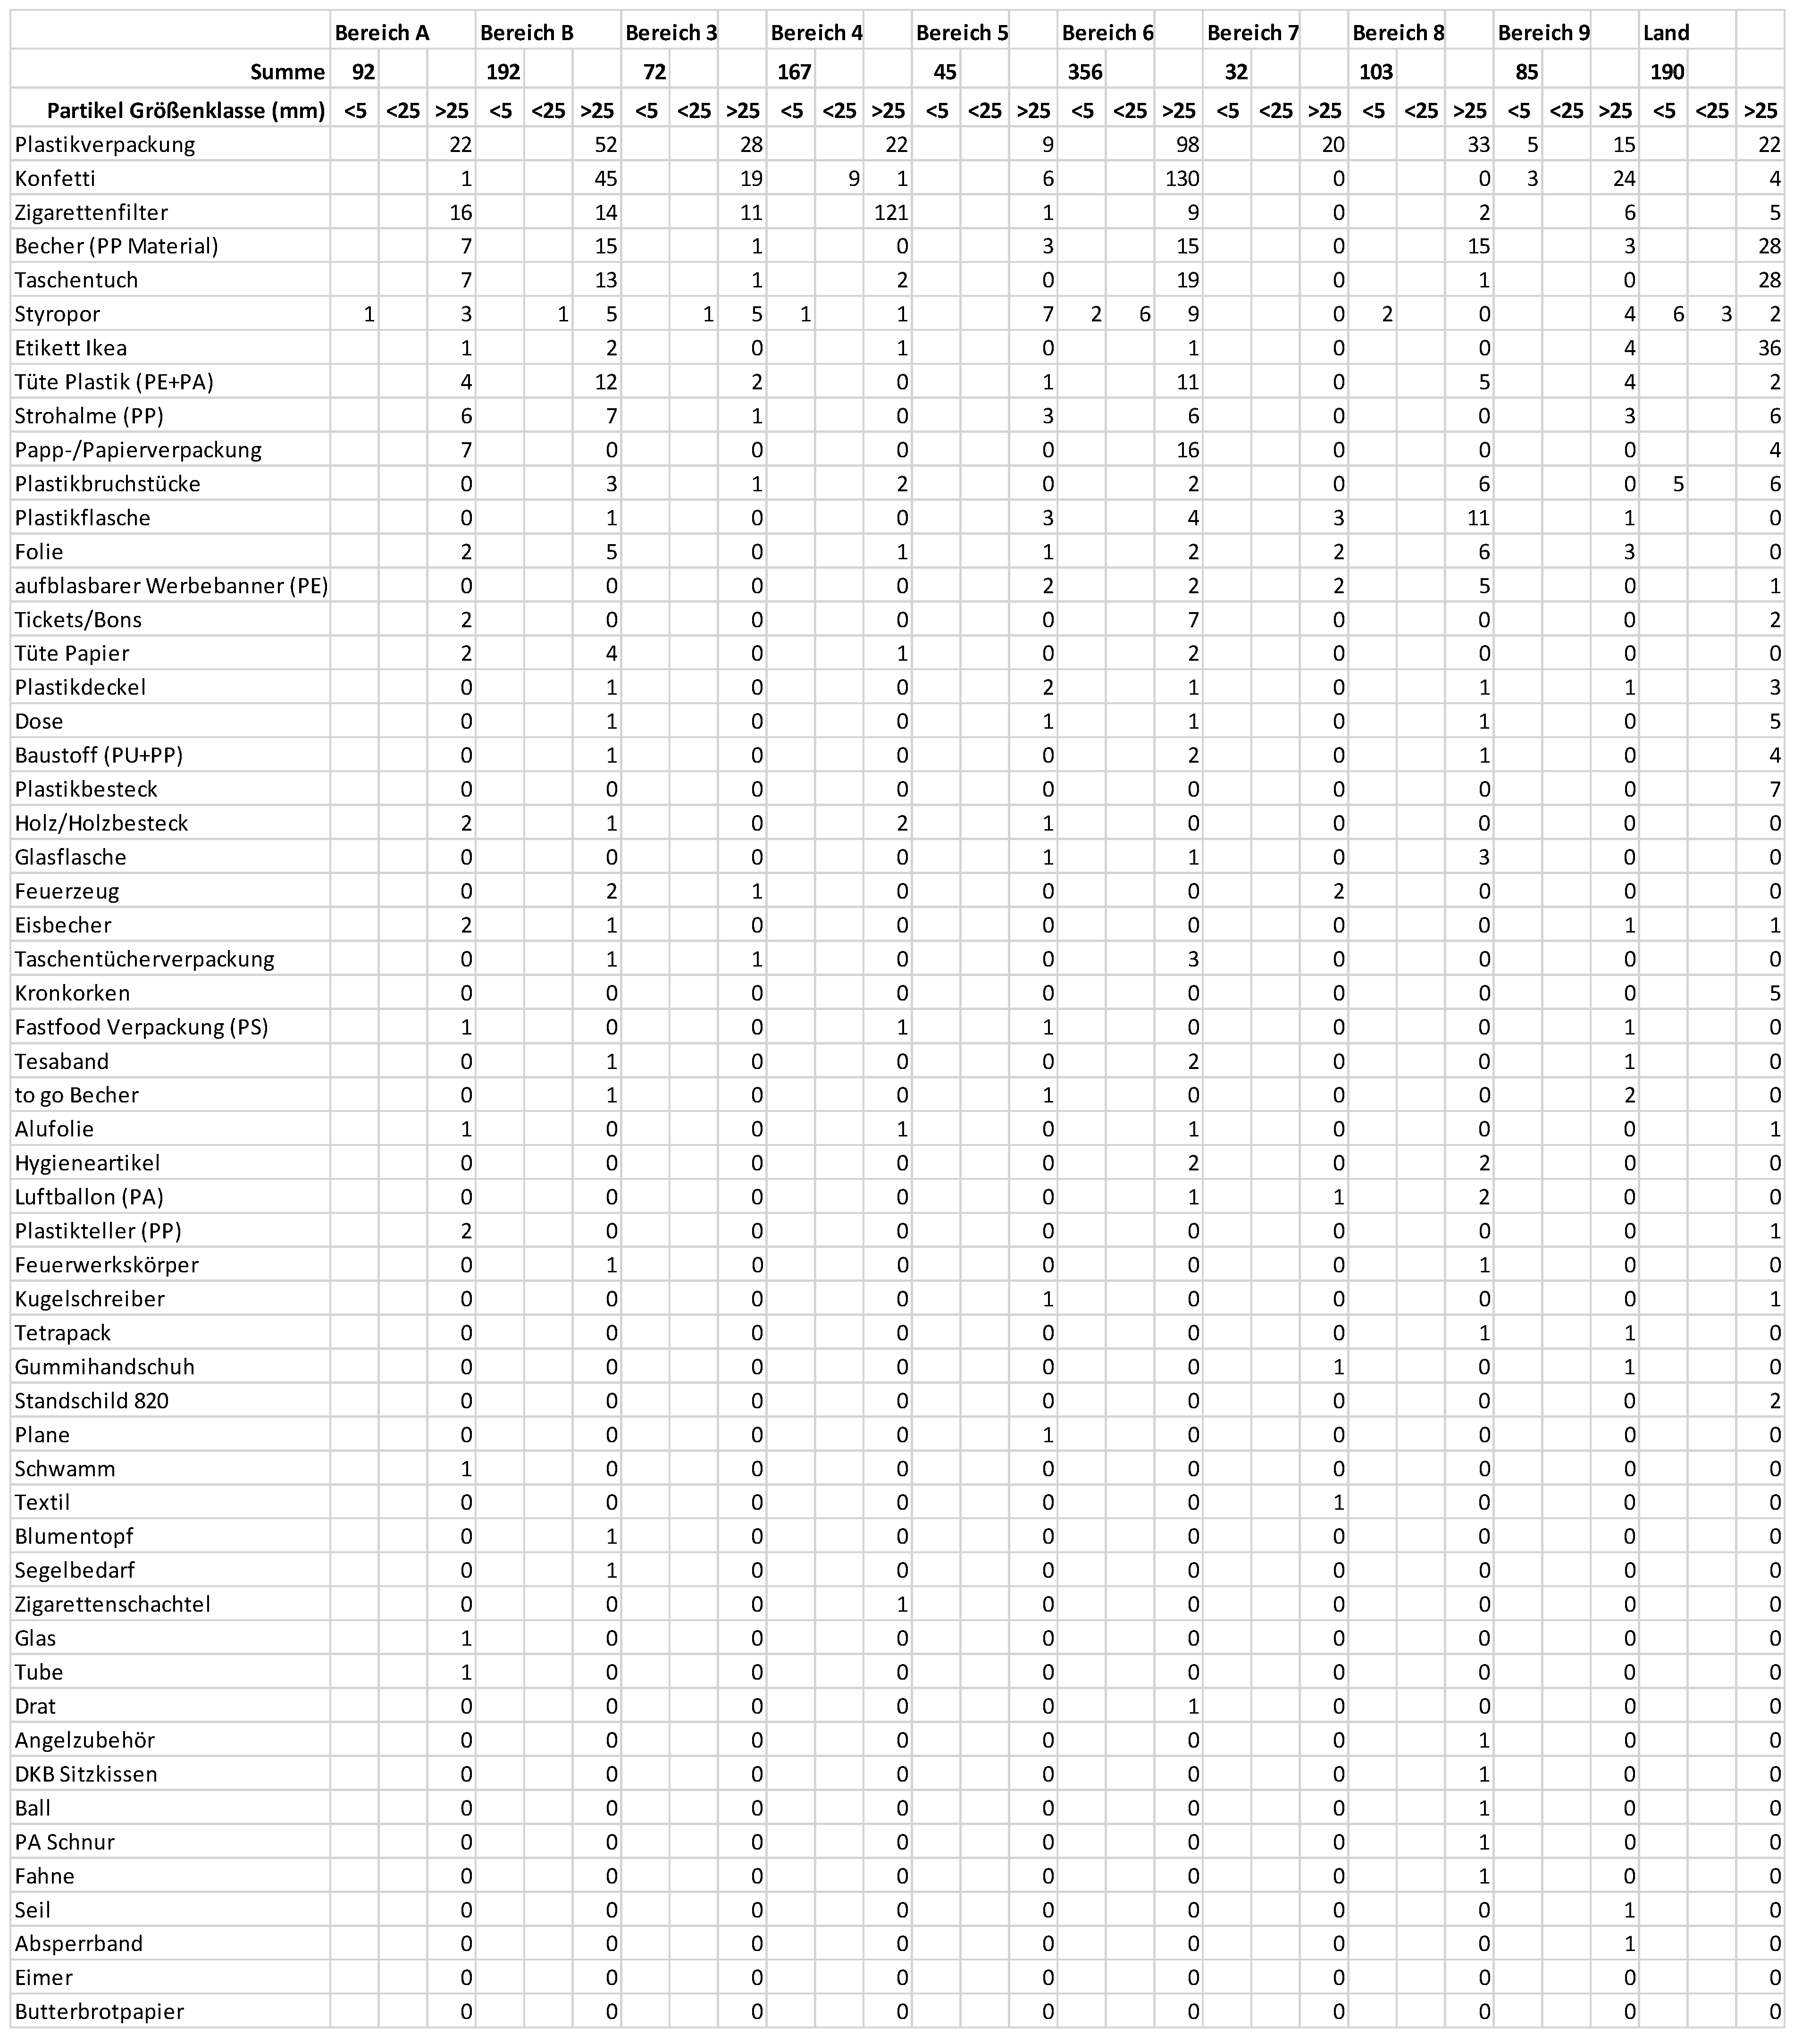
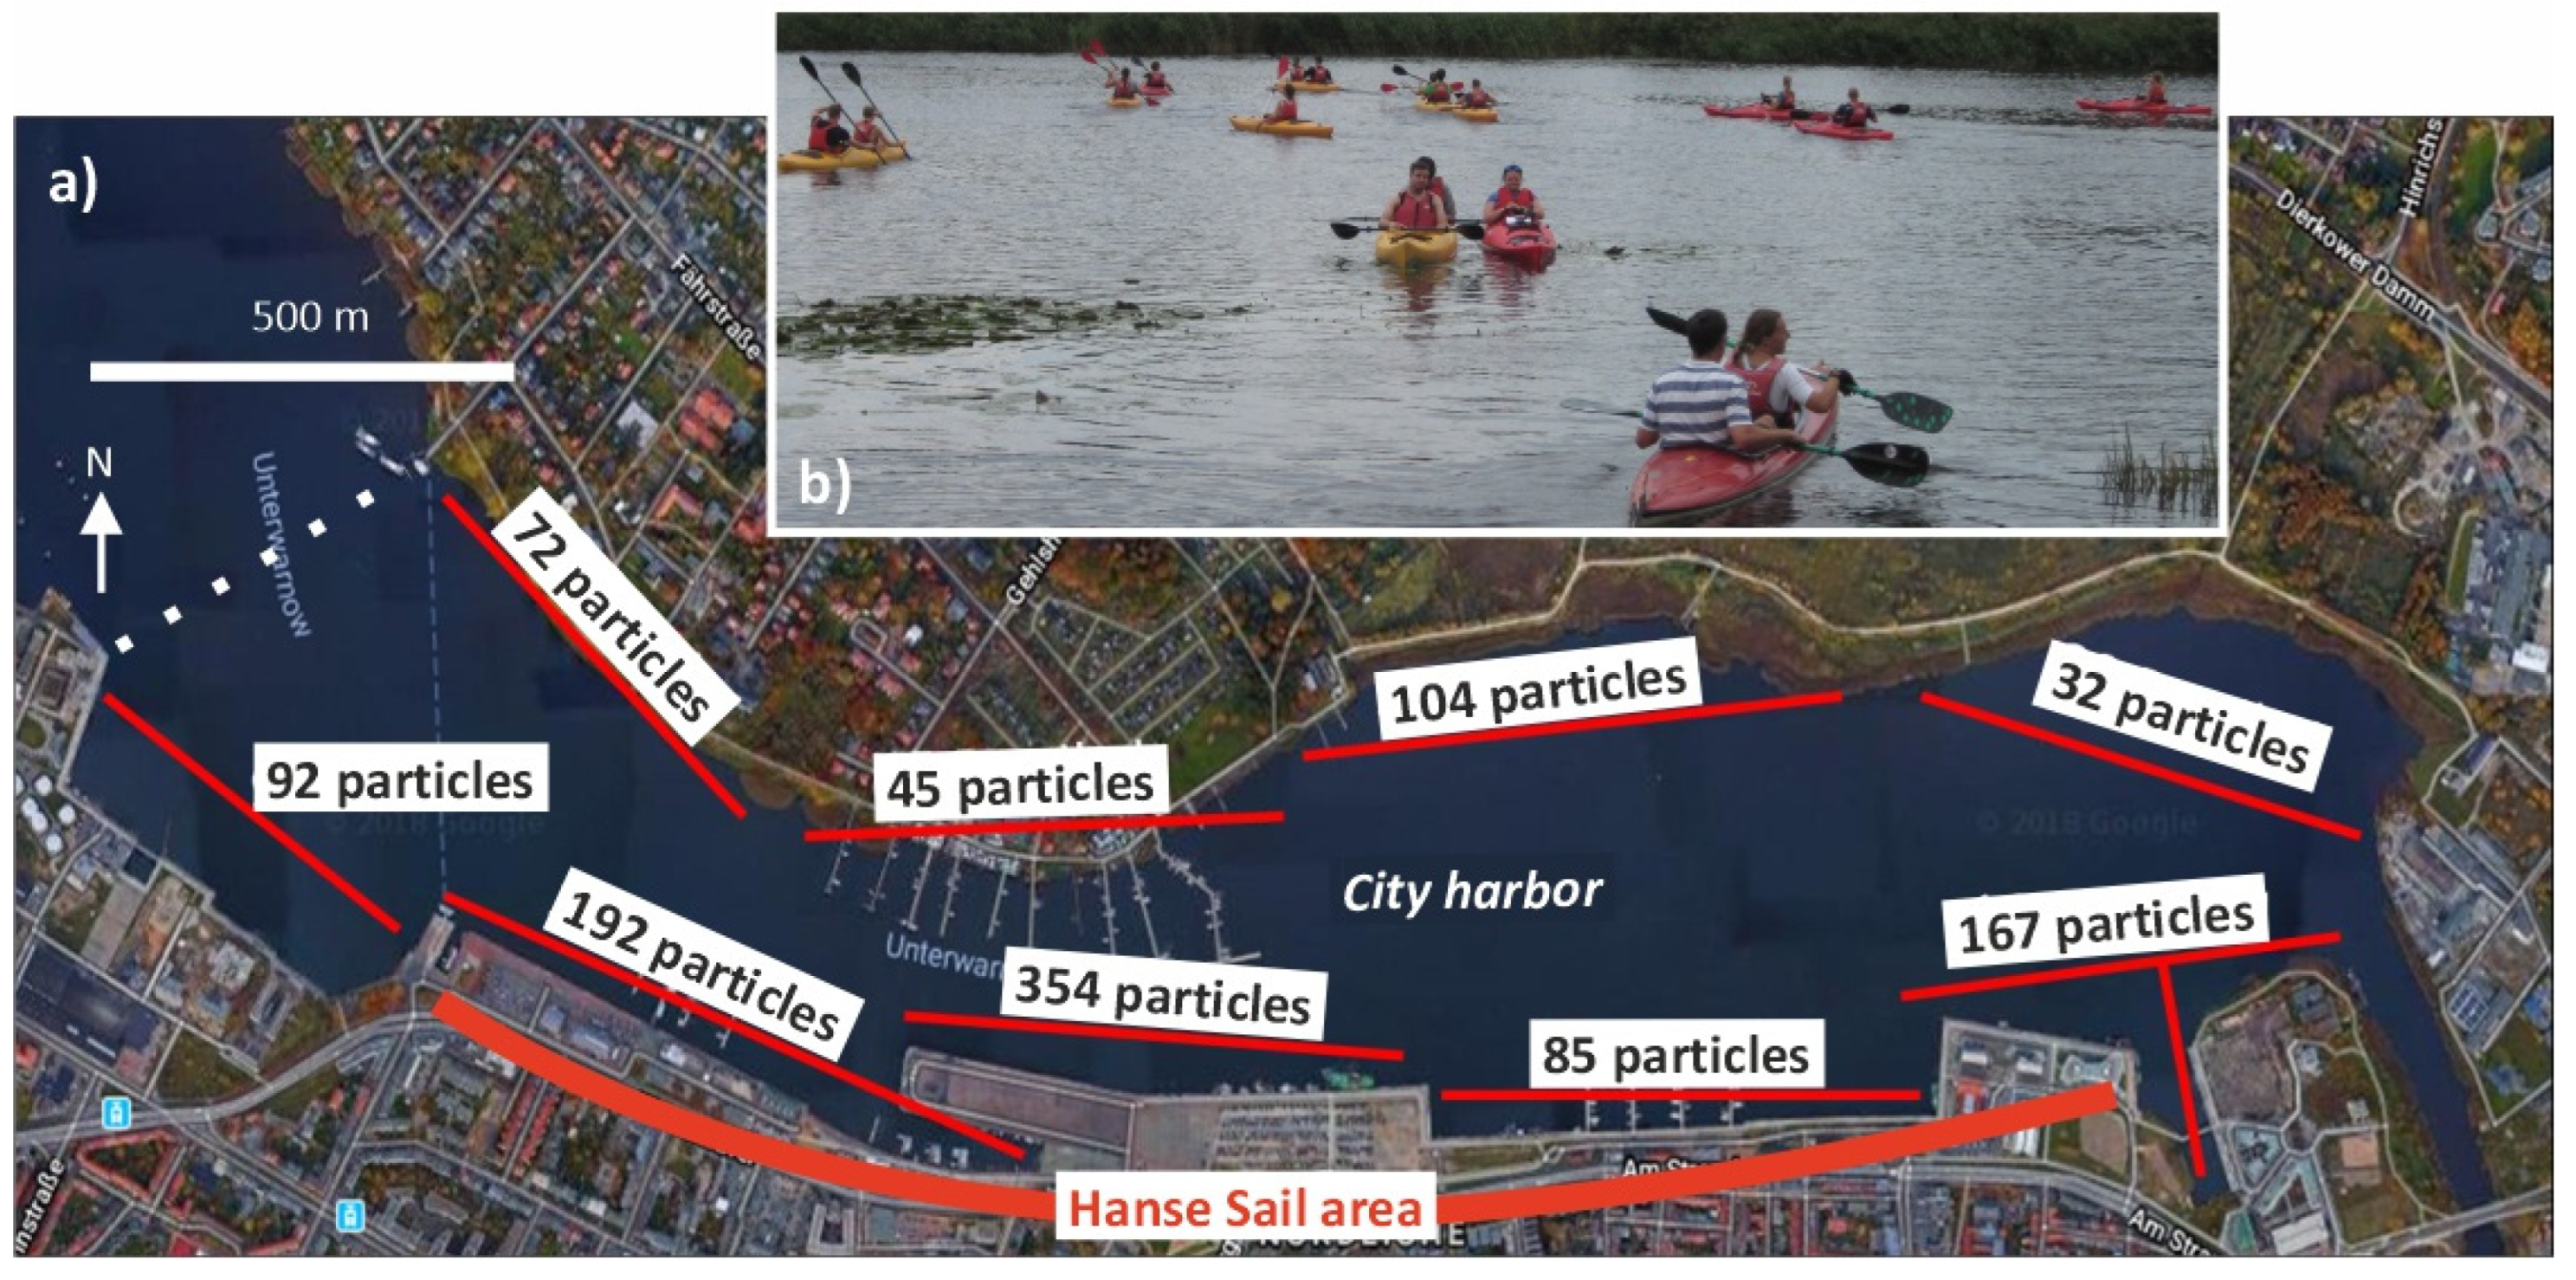
To acquire an insight into the total harbor pollution with floating litter, the monitoring of the Hanse Sail 2018 focused on the entire water surface area of the city harbor (Figure 3a). After the event, floating litter was collected, involving 14 boats (Figure 3b). Altogether, 1333 particles (plastic and non-plastic) with a total weight of 12.1 kg were picked-up from the water surface. Consequently, the average weight of the observed floating particles in the harbor in 2018 was 9 g per particle. The weight of single particles was not documented; therefore, additional statistical information cannot be provided. Over 90% of the particles were macro-litter, with a size above 25 mm. The share of plastic particles was about 85%, with 37% and 41%, respectively, polyethylene and polypropylene particles greatly dominating the plastic fraction. Among the plastic particles were 21% cigarette butts, 37% plastic food packages and cutlery, 10% drinking cups, 4% plastic straw, 2% plastic bottles and 1% bottle caps. A total of 27% were plastic confetti. The item categorization was slightly different compared to 2019.
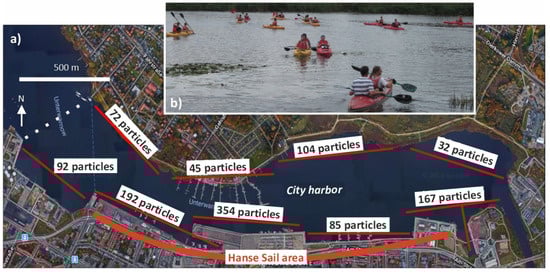
Figure 3.
(a) Floating litter particles found on the water surface in different parts of the city harbor in Rostock after the Hanse Sail 2018 (data: Appendix B). The thick red line indicates the 2.2 km extent of the Hanse Sail activities along the south coast; the dotted white line indicates the boundary of the city harbor (map: GoogleMaps). (b) Photo taken during the public sampling activity.
The results show that plastic particles were always dominating and that cigarette butts were the most important floating item. The shares of all other items vary and depend on conditions and locations. The amount of confetti—and, in 2019, the high amount of advertisement plastic bags by one company—indicate that careless and/or accidental pollution plays an important role. Even seagulls can cause litter emissions to the sea if waste systems are overfilled or not adequately secured/covered (Figure 2).
3.2. Hanse Sail Rostock—Floating Litter (Plastic) Spatial Distribution
During the Hanse Sail 2018, the focus was on spatial pollution patterns. Wind from a westerly direction dominated most of the time [23] and favored litter accumulation in and around the city harbor. It can be assumed that the sampling after the Hanse Sail in and around the city harbor caught the vast majority of particles (Figure 3, Appendix B). The observed spatial pattern of litter particles shows litter along all shores around the harbor, with highest concentrations being directly in front of the Hanse Sail festival waterfront. Of the 1333 particles found, 190 particles present in the datasheets could not be spatially allocated and are lacking in Figure 3. The city harbor has a water surface area of about 1.4 km². The pollution of the city harbor surface water with macro-litter (including plastics) after the Hanse Sail 2018 was about 950 particles/km², and the pollution with macro-plastics alone was about 810 particles/km². These numbers include the front of the reed belts.
3.3. Hanse Sail Rostock—Floating Litter (Plastic) Emissions
The sampling methodologies and the data allowed for calculations of floating litter emissions to the city harbor during the Hanse Sail. The 1333 floating macro-litter particles found after the Hanse Sail in 2018 serve as a basis. It is assumed that the Hanse Sail had 1 million visitors (including locals, showman, salespersons); that 10% of the emitted litter to the harbor had left the city harbor area; that the survey covered only 50% of the harbor water surface area; that small particles, such as cigarette butts, that contribute over 30% of the floating litter (Figure 2), were not found; and that 25% of the found litter was already in the water before the Hanse Sail. Based on those assumptions, the emission is 3 particles per 1000 visitors or 3000 particles in total. In 2019, altogether, 1492 particles were found. The sampling was restricted to the harbor water near the festival area, but all particles, even very small ones, were collected. Following a similar calculation approach as for 2018, but taking into account the differences, we receive an emission of 3.7 particles per 1000 visitors or 3700 particles in total. The data suggest that close to 90% of it is plastics. The results of 2019 confirm the calculations of 2018 but have a weaker database.
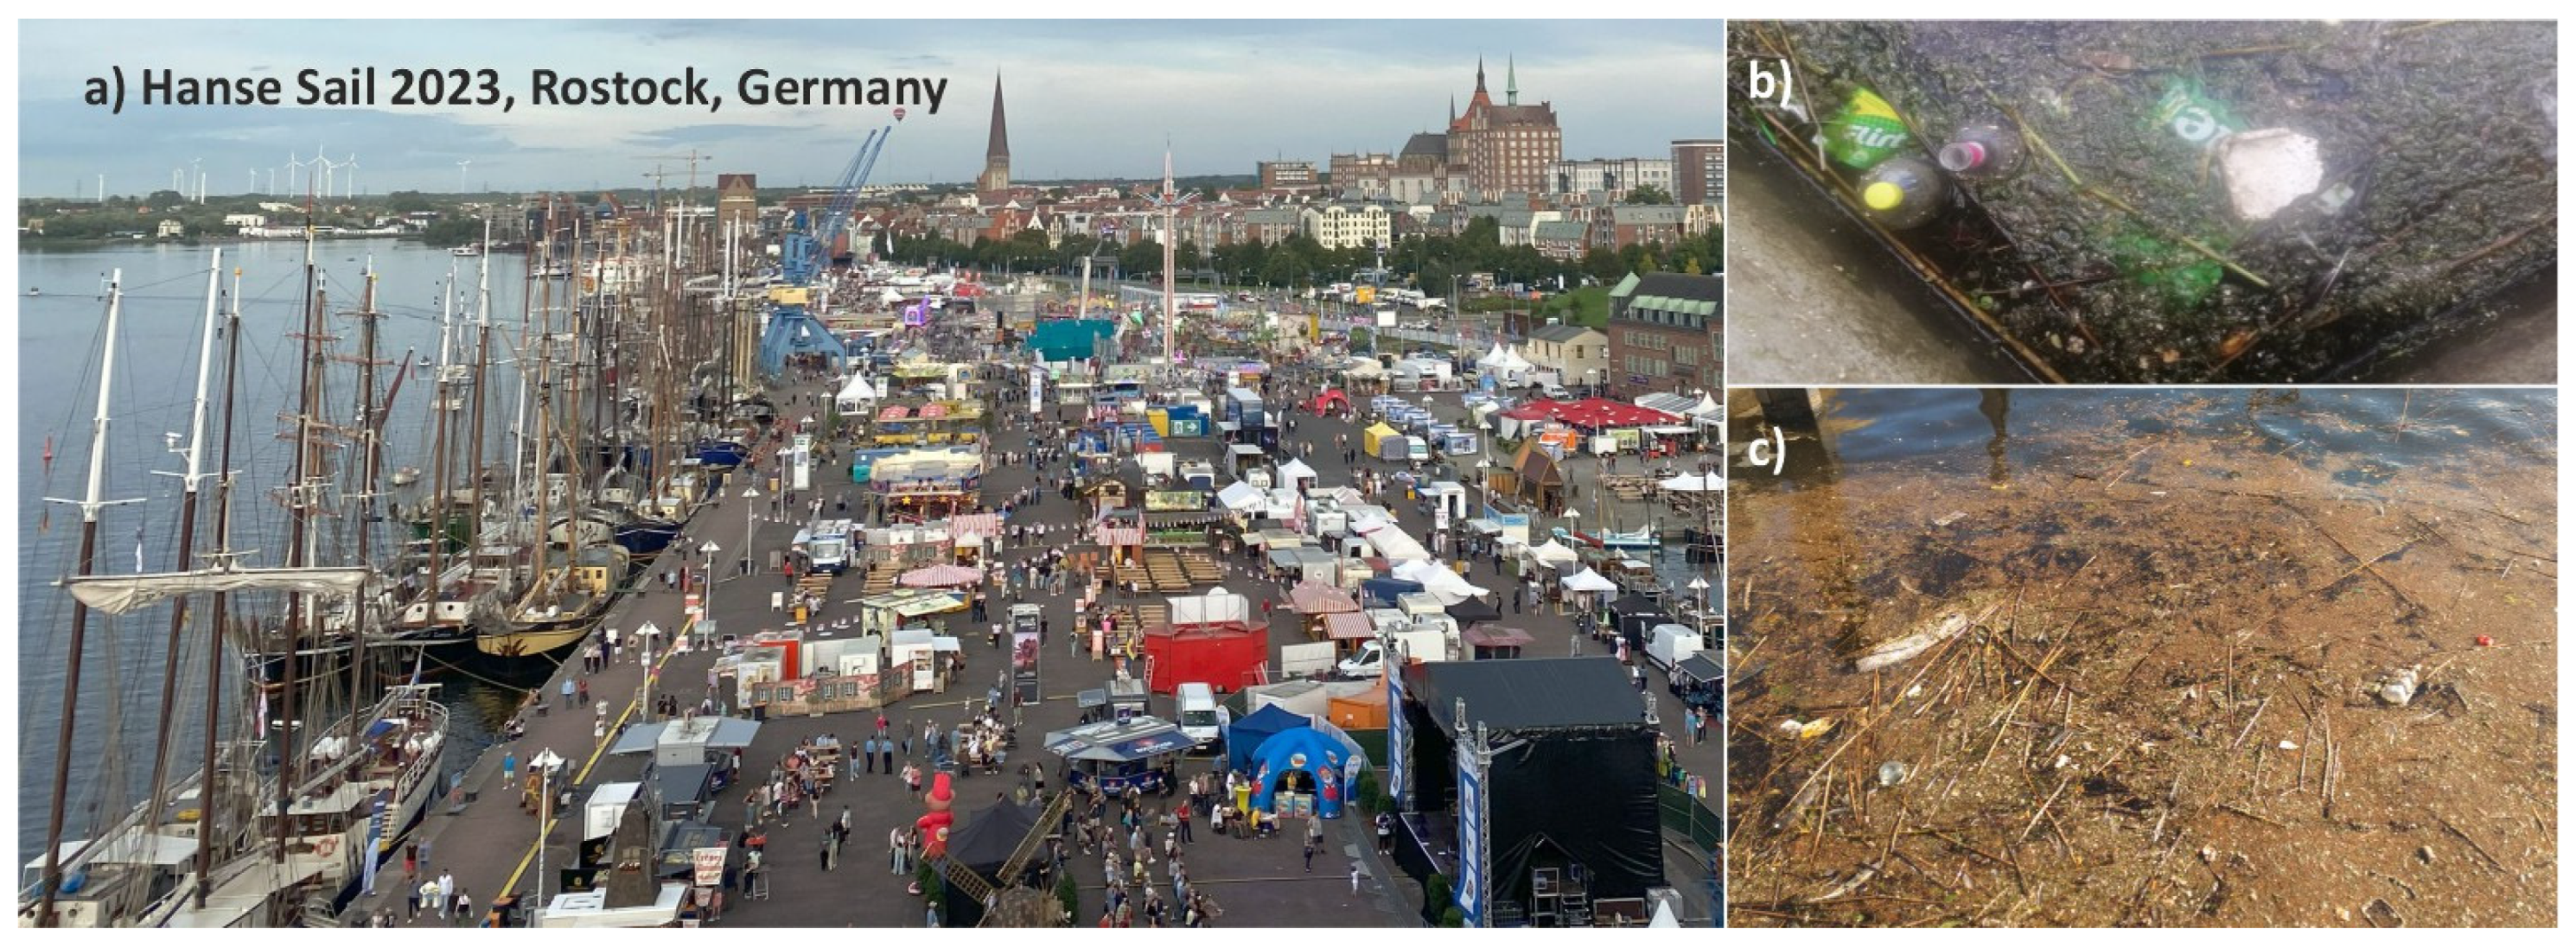
During the Hanse Sail 2023, after the COVID-19 pandemic, macro-litter monitoring during and after the event was again carried out. Because of the different concept, the Hanse Sail 2023 had only half the amount of visitors compared to Hanse Sails before 2020. At the beginning of the Hanse Sail 2023, the amount of litter floating in the water along 2.2 km harbor walls was visually estimated, from about 2 m distance, to be about 150 pieces, but not removed (Figure 4b,c). The amount did not increase during the Hanse Sail; on the contrary, later lower numbers were estimated because of wind- and current-driven litter transport towards the open harbor water. As a consequence, after the Hanse Sail, a survey of the open water and fronts of reed belts in the harbor was carried out, similarly to that in 2018, but with only one boat and only for selected areas. Only 19 pieces were found, of which 14 were plastic pieces; among them were three food/sweet packets, three plastic cigarette box packaging, two small bags and only one cigarette butt. The macro-litter emission calculations are based on 500,000 visitors and the assumptions that 10% of the emitted litter to the harbor has left the city harbor area; that the survey covered only 20% of the harbor water surface area (including reed belt front); and that small particles, such as cigarette butts, were not found. A total of 15% of the found litter was assumed to be already in the water before the Hanse Sail because the cleaning did not cover the entire area. For 2023, this results in emissions of 0.24 particles per 1000 visitors or only 120 particles in total. The model simulations were used to evaluate our observed spatial pollution pattern, to refine the emission calculations, and to optimize the sampling campaign 2023. Despite that, we estimate the range of uncertainty for the calculated emissions to be at least +/−100%. However, this uncertainty estimation cannot be statistically validated. Even when taking into account the fact that the data basis is limited, it seems that a strong drop in the amount of emission took place between 2018/2019 and 2023.

Figure 4.
(a) The Hanse Sail in Rostock, Germany 2023. (b,c) Floating litter trapped between ships in Alter Stadthafen at the beginning of the Hanse Sail 2023.
Alternative calculations for the Hanse Sail and during other harbor events, using the total waste amount, the number of visitors and emission shares to the sea based on expert guesses, resulted in an unrealistically high total litter emissions to the sea (see Section 2.3). Calculations based on the observed litter in the festival area close to the water front ended up with very low total floating emissions in the harbor water. In both complementary approaches, the subjectivity and methodological weaknesses could not be improved sufficiently. Further, the two alternative macro-litter emission calculation approaches did not provide results that could be verified by observing floating litter concentration on the harbor water surface. As a consequence, the results were not used.
The total waste collected during the Hanse Sail 2023 by the City of Rostock was about 50 tons and the total number of visitors was 500,000 visitors. This means that every visitor generated about 100 g of waste. During Kiel Week 2022, altogether, 208 tons of waste were collected. Consequently, each of the about 3 million visitors produced 69 g of waste. During the Klaipeda Sea Festival, about 47 tons of waste were collected. Assuming 500,000 visitors, we end up with 94 g of waste generated per visitor. All numbers are based on personal communications by the cities. The amount of waste per visitor is comparable between the festivals, considering the uncertainties of the data. Taking the data of Hanse Sail 2018, where 12.1 kg floating litter were collected in the harbor, and assuming a total waste generation of about 60 tons, about 0.02% of all waste (in weight) produced during the event ends up floating in the harbor water.
3.4. Changes in Waste Management
The literature survey was meant to answer the question of why the person-specific emission of floating litter during Hanse Sail in 2023 was less than 10% compared to Hanse Sails before 2020. Data provided by the city of Rostock indicate that during Hanse Sail 2023, about 50 t of waste was generated, less than for Hanse Sails before 2020. This reduction in waste generation could be due to the lower number of visitors in 2023. Another important aspect is that the Hanse Sail concept has changed [29]. The number of stalls and drinks stands and their concentration at the sea wall, as well as the density of visitors along the coastline, were reduced. The modified concept enabled a better implementation of the waste management strategy, avoided extreme densities of visitors and is certainly another factor in the reduced litter emissions to the harbor.
Because of known littering problems, the city implemented an improved waste management system in recent Hanse Sails, including a deposit system for cups, the mandatory use of degradable tableware, free waste deposit containers for all ships, reusable fence fasteners, low-emission fireworks, nightly ground cleaning and an optimized waste bin distribution and emptying system [30].
The waste management approach during Kiel Week is comparable. The Kiel Week received the Platinum Level Certification of the Clean Regatta Program [31]. The 20 criteria include the elimination of single-use items (e.g., elimination of single-use water bottles, plastic straw, bags, dinnerware, water refill stations) and responsible waste management (e.g., green team, proper waste bin placement and signage paperless event management). This means that about 150 garbage workers take care of 1100 waste bins with capacities between 120 und 5000 L [15]. The Kiel Week aims for a sustainable events certification according to ISO 20121 [32].
Several waste management activities in Rostock and Kiel result from the European Union’s policies and their implementation, for example, their ban on single-use plastic items like plastic plates, cutlery, straws, balloon sticks and cotton buds, which entered into force in 2021 [33]. In Germany, a deposit for plastic bottles has existed since 2003, which will be expanded in 2024. Further, in Germany, many types of plastic bags have been prohibited since 2022. Improved waste management systems can, at least partly, explain the strong reduction of floating litter that was observed during Hanse Sails between 2017 and 2019 and in 2023 as well. Our data do not allow for the assessment of the role of changes in perception and awareness of litter in the environment and changes in the littering behavior of visitors.
3.5. Hanse Sail Rostock—Litter Transport and Deposition Simulations
The first model simulations were carried out to support the design of the sampling campaign in 2023. Later model simulations used our calculated macro-litter emission values and were carried out with the aim to assess litter transport and deposition, as well as to quantify the litter export to the open Baltic Sea.
Figure 5 and Figure 6 show the transport of hypothetical floating litter emitted to the sea during different Hanse Sails in August. It was assumed that 3000 floating macro-litter particles were emitted during the entire event, as calculated for the year 2018 (Section 3.3). For these scenario simulations, the weather conditions during the Hanse Sails in 2009 and 2010 were applied. Both years show contrasting wind directions and wind speeds temporally exceeding 7 m/s (4 Beaufort; moderate breeze). For the summer season, the wind velocities in 2009 and 2010, where above the average, were expected to show significant transport distances and representative spatial depiction patterns.
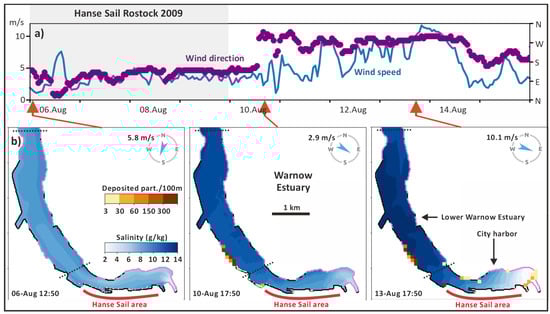
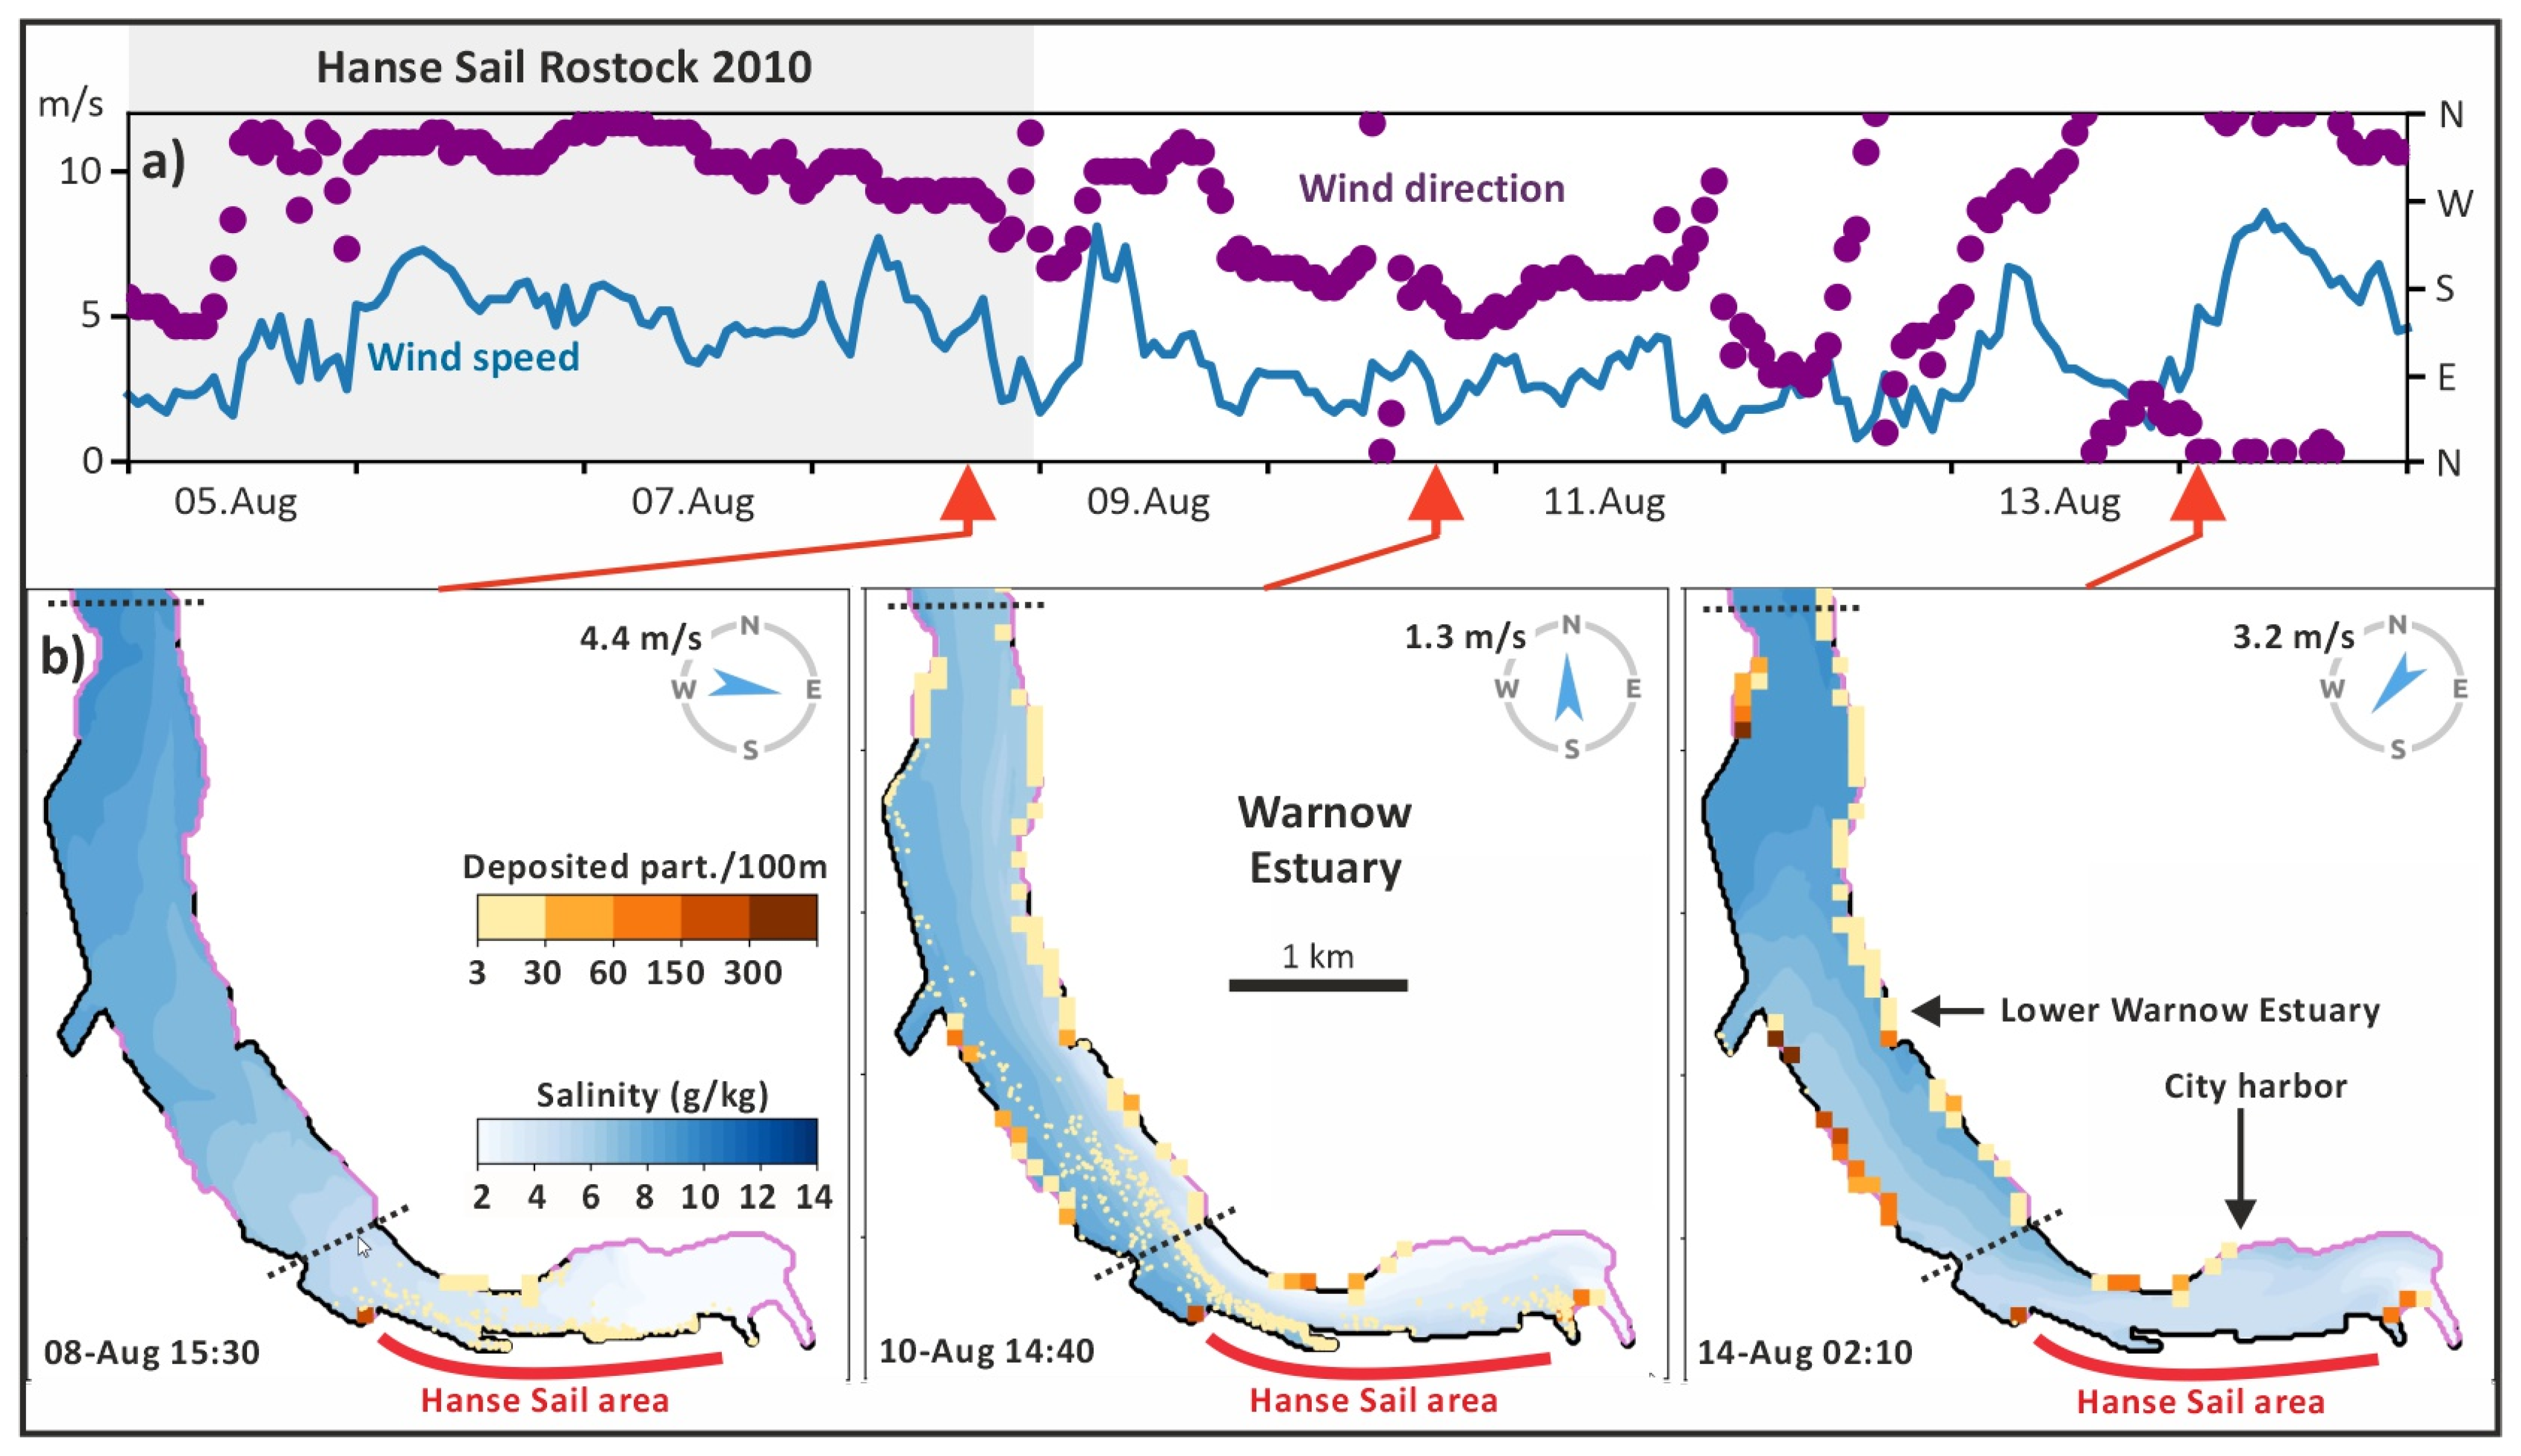
Figure 5.
(a) Wind speed and direction during Hanse Sail 2009 that lasted from 6 to 9 August. The red arrows indicate the date and time of figure series (b). (b) The model simulation of floating macro-litter and the litter deposition along the shoreline for three dates. It is assumed that, altogether, 3000 particles were emitted during the event. Purple coastlines indicate accumulating shorelines; black colors indicate shorelines; the dashed line indicates the boundary of the city harbor. The model simulation movie shows the dynamic transport behavior in detail (Supplementary Material).

Figure 6.
(a) Wind speed and direction during Hanse Sail 2010, which lasted from 5 to 8 August. The red arrows indicate the date and time of figure series (b). (b) The model simulation of floating macro-litter and the litter deposition along the shoreline for three dates. It is assumed that, altogether, 3000 particles were emitted during the event. Purple coastlines indicate accumulating shorelines; black colors indicate shorelines; the dashed line indicates the boundary of the city harbor. The model simulation movie shows the dynamic transport behavior in detail (Supplementary Material).
The model suggests that during Hanse Sail in 2009 (Figure 5), the gentle breeze (about 4 m/s) from easterly directions caused a floating litter transport along the coast towards the west. The model assumes that most litter is beached or trapped in reed belts about 3 km west of the Hanse Sail location. In the days after the Hanse Sail, which lasted from 6 to 9 August 2009, the wind speed increased and changed to southwesterly directions. The resulting currents transported several particles back towards the east and caused an accumulation in the eastern part of the city harbor.
During the Hanse Sail 2010, between 5 and 8 August (Figure 6), the gentle breeze from northwest to southwest scattered the floating particles in the southern city harbor area, were quay walls and hard coastal protection constructions do not allow for beaching. The simulation suggests some particle accumulations at beaches and reed belts on the northern coast, opposite the Hanse Sail location. However, changing wind directions after the Hanse Sail caused a transport of up to 7 km to the north, where the particles were trapped and beached. With a southerly wind with speeds of 5 m/s, particles crossed the about-500-m-wide bays and reached the northern shoreline opposite the Hanse Sail festival area within a few hours.
At the end of the Hanse Sail 2009, 42% of all emitted particles were still in the city harbor area, and 58% were further transported into the lower Warnow estuary area. The boundaries of the harbor areas are indicated in Figure 5 and Figure 6. In 2010, 88% remained in the city harbor and only 12% were in the lower Warnow estuary area. The Hanse Sails 2009 and 2010 represent situations with contrasting and comparatively strong winds. In Rostock, wind-directions between northwest and southwest are most common, and the conditions during Hanse Sail 2010 can be regarded as representative of a typical situation. Therefore, detailed field studies and sampling campaigns with a focus on the amount and composition of litter emissions in harbors from the land, as well as studies on litter pollution and deposition, could focus on the Hanse Sail coast line and the city harbor area. This means that our sampling approaches were reasonable and suitable. The pollution patterns observed in 2018 are in agreement with the model results.
The model simulations cover a further six days after the Hanse Sails, until practically all floating particles were beached. In this final situation, in 2009, 28% of all particles were beached in the city harbor area and 72% in the lower Warnow estuary area. In 2010, 17% were beached in the city harbor area, 76% in the lower Warnow estuary and 6% in the estuary close to the Baltic Sea. This implies a period of significant transport after the Hanse Sails took place, but only within 7 km of the festival area (see Supplementary Material).
Only in 2010 were about 6% of the macro-litter particles transported further north into the northern part of the estuary, and 0.4% reached the open Baltic Sea in a distance of 11 km from the Hanse Sail festival area. We can conclude that Hanse Sails are not relevant to open Baltic Sea pollution with floating litter.
However, the dynamic model movies (Supplementary Material) visually indicate that near-surface transport comprises a complex interaction between external forces from the Baltic Sea, estuarine circulation, harbor morphometry and wind shelter effects, and it can hardly be predicted without a model. Under certain conditions, the temporary transport of macro-litter particles into the Baltic Sea cannot be excluded.
3.6. Coastal Litter Accumulations in the Warnow Estuary
The annual macro-litter data gathered during the Citizen Science project, “Natur- & Erlebnisraum Warnow-Ästuar” (NABU Regionalverband Mittleres Mecklenburg e.V.), between 2018 and 2020 at the remote beach and flat coast near Peezer Bach (Figure 7) shows a pollution of between 3533 particles (2018) and 5671 particles (2019) per 100 m. The weight of the collected particles is between 236 kg (2018) and 35 kg (2020). In all years, plastic particles have a share between 96% and 98%. A detailed look into the item types found can potentially indicate emission pathways and water-bound transport. The share of cotton buds (hygienic article) is between 1.7% and 2.7%, which indicates that untreated sewage water, released during sewage overflow events or from ships, plays a role in the pollution of this coastal strip. However, these cotton buds were not necessarily released in the city harbor. Most particles indicate the adjacent harbor as the major pollution source, pointing towards a retention of macro-litter particles within few kilometers of the emission point. Disposable cutlery, plates and drinking straws have a higher likelihood of emission during Hanse Sails. The total amount of these particle types varies between 13 (2020) and 31 (2018) and results in a share between 0.25% and 0.28% of the total number of particles. The numbers are relatively low and do not indicate significant waterborne transport from the city harbor to the Peezer Bach coastline. The Peezer Bach is similar to the Warnow mouth to the Baltic Sea, located in a distance of 11 km from the city harbor. Altogether, the data support the model simulation results and do not indicate long-distance litter transport. They indicate a retention of macro-litter particles within a few kilometers of the emission point.

Figure 7.
Floating macro-litter quantity and item types found in a 1 m strip at the front of four major reed belts covering a distance of five kilometers. The colors indicate item groups. Additionally, the flat coast near Peezer Bach is indicated, which is where citizen science clean-up data collection activities took place (map based on Google Maps).
About 7 km of the Warnow estuary coastline is covered by reed belts. Alongside beaches and flat coasts, we considered these reed belts as traps for macro-litter and implemented this trap function in our model. Consequently, four reed areas (covering most of the reed belts) were studied in spring 2023—a season when the reed belts are still accessible and floating macro litter is still highly visible (Figure 7). Apart from reed area 3, which was less accessible, all other reed belts showed a comparable floating litter density between 0.036 and 0.056 particles/m². A total of 83% of the litter found was made of plastic. Reed area 4 in the city harbor, opposite of the Hanse Sail festival area, did not show higher pollution compared to areas 1 and 2. Nor did special item types, such as plastic straws (emitted before the prohibition) or cutlery, point to the Hanse Sail festival as a significant pollution source. However, a weakness of reed belt analyses is that floating litter is overgrown by vegetation within weeks. The increasing density causes the sedimentation of many litter particles. The result is a reduced floating litter pollution density and changes in the particle composition. The trap function of the reed belts was highly visible in the field, but quantification was not possible with our simple approach. Further, because of bio-fouling, it is doubtful that floating litter emitted during the previous Hanse Sail would still be detectable months later.
3.7. Quantification of Baltic Harbor Festival Emissions
The Internet research resulted in over 50 Baltic coastal harbor and sailing festivals, several with a focus on music. The 11 largest events, as well as grouped smaller festivals, are documented in Table 1. The aim is to provide a rough estimation of the quantitative relevance of all harbor and sailing events to the pollution of the Baltic Sea with litter. The quantifications are based on two scenarios: scenario 1 assumes that the emission data of 0.24 litter particles per 1000 persons, as observed during Hanse Sail 2023, can be transferred to all events in the Baltic Sea region; scenario 2 is based on an emission of 3 litter particles per 1000 persons, as observed in earlier Hanse Sails. Based on our data, it can be assumed that about 85% of the litter particles are plastics.

Table 1.
Estimated Baltic-wide annual macro-litter emissions resulting from harbor and sailing festivals. The most recent visitor numbers, mainly for 2023, were used. Scenario 1 assumes an emission of 0.24 litter particles per 1000 visitors based on calculations for Hanse Sail 2023. Scenario 2 is based on an emission of 3 litter particles per 1000 visitors as calculated for Hanse Sail 2018.
Scenario 2 suggests that even at the largest festivals (Kiel Week, Baltic Sail Gdansk), the annual emissions are below 12,000 particles. The Baltic-wide total of about 56,000 particles per year seems a realistic estimation since, very likely, not all events have implemented comprehensive waste management approaches. Assuming emissions of 3.7 particles per 1000 visitors, as calculated for Hanse Sail 2019, we receive total floating macro-litter emissions in the Baltic region close to 70,000, but we consider our data of 2019 to be less comprehensive and reliable with respect to calculating emissions compared to the data of 2018. Scenario 1, with an emission of about 4500 particles per year, reflects a situation that, very likely, will be reached during the coming years, assuming that improved waste management efforts will be implemented everywhere. Our estimated range of uncertainty for the calculated Baltic Sea region emissions is about ±300%. However, this uncertainty estimation cannot be statistically validated.
4. Discussion
4.1. Assessment of Approach and Methods
It is well known that field studies on macro-litter, e.g., on beaches, show a very high spatiotemporal variability, and the methodological weaknesses are well known [34,35,36]. Macro-litter sampling of the water surface and of festival areas have additional weaknesses. Sampling on the water surface is disturbed by wind-driven transport and pollution patchiness. Only the covered sampling area can be estimated, and extrapolation to the entire harbor water area is required. However, our model simulations suggest that samplings along the coastline by boat catch most of the litter. Samplings in the festival areas are permanently disturbed by visitors, and the time of the day affects the results. Knowing all these uncertainties, we tried to combine different approaches and addressed the emission problem, in particular, from different perspectives.
For the model simulations, we used an advanced spatially highly resolved 3D flow model that is very well adapted to the Warnow estuary [27]. The model simulations assumed that macro-litter was transported passively with the near surface layer. Direct wind-driven transport of particles drifting on the water surface (e.g., styrofoam) was neglected because it can easily be estimated based on the prevailing wind conditions. The simulations assumed that beaches and reed belts had sink functions and trapped the litter permanently. This view was supported by our observations and the literature (e.g., [37]). We further assumed that hard substrate harbor walls reflect the litter. This is a simplification because the litter sampling campaigns did show that, especially during higher water levels and higher waves, some litter was accumulated further up at stone dikes, but this shore type does not play a quantitatively important role and has negligible influence on the results. Further, we observed that litter was trapped between ships. This causes a temporary delay until the litter is subject to transport with currents. Since the quantity of particles is in the order of 10–50, this has limited consequences for the general transport and beaching pattern. Small-scale structures along the shore, such as single ships and landing stages in marinas, were not represented by the model.
The macro-litter emission scenarios used for the model simulations were based on calculations for the year 2018. However, many of the 150 ships, taking part in the Hanse Sail, e.g., 2023, transport visitors several times per day between city harbor and the Baltic Sea. The emissions from boats were not included in the simulations.
The calculations of the total annual macro-litter emissions for the entire Baltic Sea resulting from harbor events should meet the right order of magnitude, but they cannot be regarded as reliable data because of three weaknesses: The extrapolations are based on the results of the Hanse Sails in Rostock and assume that all other events have similar person-specific emissions and implemented comparable waste management strategies. It is uncertain as to whether we found all relevant events and estimated the correct numbers of visitors. The number of visitors, provided by different sources for the same event and year, varies by 50% depending on the estimation approach and the definition of a visitor (e.g., [29]). Last but not least, the decision about what is considered as a harbor event and to what extent emissions to the harbor area are possible includes subjectivity.
4.2. The Role of Festivals for Baltic Sea Litter Pollution
Publications that allow for a comparison with our results, to our knowledge, do not exist. However, during Kiel Week 2018, a report stated [38] that the emission of macro-litter to the harbor water increased by 20 times during the Kiel Week and that about 75% of the particles were made from plastic. As a consequence of the observed large amounts of cigarette butts floating in the harbor, during Kiel Week 2019, 96 large standing ashtrays were placed in the festival area and 20,000 mobile ash trays were distributed [39]. Together with additional waste emission reduction measures, the harbor water pollution during the event was reduced. For 2019, for two harbor areas in Kiel, between 300 and 400 particles of floating macro-litter were reported [39]. Compared to the Hanse Sail, the Kiel Week has a higher number of visitors, but the city harbor has very similar in size and structure. Applying a similar calculation approach to that use for the Hanse Sails, we receive a total of about 1300 particles and an emission of about 0.4 particles per 1000 visitors. These values are slightly above our calculations for the Hanse Sail 2023 and indicate that our calculated person-specific litter emissions are realistic.
In 2023, the Kiel Week reported 3.8 million visitors. The well-established waste management system removed more waste than ever—52 t during the first two days alone [40]. The steadily improved waste collection and removal systems employed during the sailing events in Kiel and Rostock are certainly a result of an improved awareness of litter in the environment. This improved awareness of litter as a problem has very likely positively affected the littering behavior of visitors during in recent decades and caused the public cleaning activities of volunteers (e.g., [41,42]). For example, in both cities, there are campaigns run by volunteers to remove the floating litter during and/or after the events (e.g., [22,39,43]). The removal of the majority of floating litter alone largely ensures that its transport to, a pollution of, the open Baltic Sea is prevented.
An estimated 1.2 million visitors attended the opening hours of the Kiel Week 2023 [44]. This unexpectedly large number temporarily exceeded the waste collection and cleaning system. Consequences included large amounts of litter on the festival floor, causing a risk of harbor water pollution. Temporarily exceeded waste collection capacities increase the risk of accidental pollution by wind, rain or sea-gulls, and seem to play a significant role not only in Rostock and Kiel. This is possibly the reason for the very high amounts of floating macro-litter observed in port areas of the Island of Mallorca.
On the Island of Mallorca, floating sea bins were applied and collected 15,899 particles and 336 kg of floating litter during the summer months [45]. In Kiel, floating sea bins were successfully applied to trap floating litter during Kiel Week as well, albeit without data collection, analyses and scientific evaluation. In harbors, floating litter often accumulates between boats and in corners. Sea bins can serve as a useful removal measure and compensate for temporary short-comings in the waste collection and removal system. However, various other cost-efficient technical measures exist to reduce floating litter in harbors [46,47].
Schwarz et al. [48] review the transport and accumulation of litter in seas and point out that what is observed floating in the sea is only 1% of the calculated litter emission from land to the sea. It is assumed that sediments and coastlines serve as efficient sinks. Estuarine filters account for about 88% of the global coastline, and it is estimated that about 57% of river water and 71% of sediment discharge to the oceans pass through estuarine filters [49]. Model simulations of the Waitematā Estuary in New Zealand, for example, indicate that more than 80% of the emitted macro-litter is kept back in the estuary [50]. A strong retention of macro-litter is supported by several recent studies (e.g., [51,52,53]). This is firmly in agreement with our model results, which suggest a practically complete retention of all macro-litter particles that are emitted during the Hanse Sail to the Warnow estuary. Since the situation of Kiel and its estuary, the Kieler Förde, is comparable, it can be assumed that emitted litter during Kiel Weeks remains in the estuary as well. Having a look at all other investigated harbor festivals in the Baltic Sea Region, most harbors are not directly located on the open sea. Therefore, we estimate that between 60% and 90% of the macro-litter emitted during harbor events in the Baltic Sea region remains in the harbor areas or the surrounding coastlines and does not enter the open Baltic Sea. However, this needs to be explored in detail.
For Hanse Sails before 2020, we calculated total floating macro-litter emissions of 3000 particles, and for Hanse Sail 2023, only about 120. During earlier macro- and meso-litter coastline monitoring at five locations in the Warnow estuary (10 samplings), over 2300 particles were found and classified. Additionally, the emission of selected macro-litter items was calculated [11]. The Warnow river enters the estuary near the city and has an annual mean water discharge of 16.5 m3/s and a catchment area of 3280 km2 [54]. The calculations in Gonzales et al. [7] suggest that the Warnow river alone emits 100,000 particles of macro-litter annually to the Warnow estuary. Combined literature data [7,11] suggest an annual macro-litter emission above 500,000 particles to the entire Warnow estuary. However, this total emission estimation has a high uncertainty. Against this background, the Hanse Sails contribute less than 1% to the annual total macro-litter emissions to the Warnow estuary and are only of local importance for the Rostock city harbor. This very low share partly results from the short duration of the event (only four days), as well as the limited directly affected coastline of about 2 km (Hanse Sail festival area) compared to the over 35 km total estuary coastline. Marine litter concentrations on the sea-floor near the festival areas show a relatively low level of pollution as well and support our results [55]. On the other hand, in earlier investigations of dredged sediments from the Warnow estuary shipping channels, altogether, 778 particles were found. A total of 26% belonged to the categories of plastic caps, packets/wrappers, cutlery/trays/straw and bottles and indicate residents, tourists or festival visitors as likely emission sources [11]. However, the data cannot be related to a defined period in time or an area. Since many particles were originally floating, the data confirm that floating particles are, after some time, sinking and are removed from the water surface.
Published calculations suggest that the largest rivers entering the Baltic Sea, namely, the Odra, Vistula, Nemunas, Daugava and Neva, each emit above 500,000 floating macro-litter particles (>25 mm) per year to the Baltic Sea. This would result in total riverine macro-litter emissions to the Baltic Sea of about 40–100 million particles/year [7]. Following this approach, and adding all other emission pathways for macro-litter to the Baltic Sea, one would certainly end up with 100 million particles/year or more. Taking this number, the emissions from harbor and sailing festivals of about 50,000 particles annually would be only 0.05% of the annual riverine inputs to the Baltic Sea.
5. Conclusions
The awareness of litter as a major problem in the marine environment has increased in recent decades. This has caused an ongoing improvement of waste collection and removals systems. This is highly visible in Germany. As a consequence, today, the litter emissions to the harbor surface water during harbor and sailing festivals, such as the Hanse Sail in Rostock, are of minor importance to Baltic Sea marine litter pollution. The calculated emissions are about 3 particles/1000 visitors or even less, and they cause, despite large numbers of visitors, maximal emissions of below 12,000 particles for the largest festivals (Kiel Week, Baltic Sail Gdansk). With respect to the marine litter pollution of entire estuaries, as well as on a Baltic Sea region scale, the share is below 1% of the total emissions. Harbor surface water cleaning efforts after events, as well as efficient retention in estuaries and coastal waters, ensure that, if at all, only small shares enter the open sea. Therefore, harbor festivals only contribute to a local pollution problem. However, it seems that with improved waste strategies, the importance of accidental and/or un-controlled pollution (e.g., fireworks during New Year’s Eve or harbor parties) increases. Comprehensive inventories considering all macro-litter emission pathways in estuaries are still lacking. Further, our approach to quantifying litter retention, taking into account harbor size, morphometry, spatial orientation and distance to the open sea, as well as the dominant wind conditions, would be important. Our model simulations do not show a relevant floating macro-litter export to the open sea but indicate that the estuary serves as an efficient trap.
Supplementary Materials
Movies showing all particle-tracking simulations of near surface marine macro-litter transport in Rostock (Warnow Estuary) can be downloaded from: https://doi.org/10.5281/zenodo.10220575.
Author Contributions
Conceptualization, G.S. and G.E.S.; methodology, G.S., G.E.S., M.H., S.P., S.F. and R.H.; field sampling concepts; M.H., G.E.S., M.G.R., S.P., S.F. and R.H.; model simulations, X.L.; writing, G.S.; calculations, G.S., G.E.S. and M.G.R.; visualization, G.S. and M.G.R.; review and corrections, all authors; supervision, G.S. and G.E.S.; project administration and funding acquisition, M.H. and G.S. All authors have read and agreed to the published version of the manuscript.
Funding
This research was funded by the Interreg South Baltic project COP, grant number STHB.02.03.-IP01-0006/23; as well as by the German Federal Ministry of Education and Research project “Coastal Futures”, grant number 03F0911B. Minor funding was provided by the BMU/ZUG project TouMaLi (Beitrag der nachhaltigen Abfallwirtschaft im Tourismus zum Schutz der Meeresökosysteme), grant number 65MM0001. G.E.S. also received support by the Doctorate scholarship program in Ecology and Environmental Sciences at Klaipeda University, Lithuania.
Institutional Review Board Statement
Not applicable.
Informed Consent Statement
Not applicable.
Data Availability Statement
Additional data presented in this study are available on request from the corresponding author.
Acknowledgments
We would like to thank Anna-Lucia Buer, Amina Baccar Chaabane, Rein Kiebert, Lea Maennel, Esther Robbe and Karl Schünemann for supporting the field work and the NABU Regionalverband Mittleres Mecklenburg e.V. for providing unpublished data. The World Cleanup Day activities were coordinated by the Rostocker Meeresmüllstammtisch.
Conflicts of Interest
The authors declare no conflicts of interest.
Appendix A
HanseSail 2019 (Rostock, Germany): Floating macro-litter sampling was conducted on Thursday and Friday evening and on Sunday and Monday morning with a landing net used from the harbor wall. On Monday morning, landing nets were also used from a boat in the estuary. A week before, the whole area was cleaned, and the litter was removed to ensure a clean harbor for the HanseSail (see Figure 2).
Appendix B
HanseSail 2018 (Rostock-Germany): Citizen science sampling of floating litter at the water surface of the Warnow estuary after the Hanse Sail on 13 August. “Bereich” indicates the collection areas in Figure 3. “Partikel Größenklassen” indicate the particle size classes. The German item names follow OSPAR [21].
References
- Jambeck, J.R.; Geyer, R.; Wilcox, C.; Siegler, T.R.; Perryman, M.; Andrady, A.; Ramani, N.; Law, K.L. Plastic waste inputs from land into the ocean. Science 2015, 347, 768–771. [Google Scholar] [CrossRef]
- Eriksen, M.; Lebreton, L.C.M.; Carson, H.S.; Thiel, M.; Moore, C.J.; Borerro, J.C.; Galgani, F.; Ryan, P.G.; Reisser, J. Plastic pollution in the world’s oceans: More than 5 trillion plastic pieces weighing over 250,000 tons afloat at sea. PLoS ONE 2014, 9, e111913. [Google Scholar] [CrossRef]
- Lebreton, L.C.M.; Greer, S.D.; Borrero, J.C. Numerical modelling of floating debris in the world’s oceans. Mar. Pollut. Bull. 2012, 64, 653–661. [Google Scholar] [CrossRef]
- Andrady, A.L. Persistence of plastic litter in the oceans. In Marine Anthropogenic Litter; Bergmann, M., Gutow, L., Klages, M., Eds.; Springer Open: Berlin/Heidelberg, Germany, 2015; pp. 57–72. [Google Scholar] [CrossRef]
- Schernewski, G.; Radtke, H.; Hauk, R.; Baresel, C.; Olshammar, M.; Osinski, R.; Oberbeckmann, S. Transport and behavior of microplastics emissions from urban sources in the Baltic Sea. Front. Environ. Sci. 2020, 8, 579361. [Google Scholar] [CrossRef]
- Lebreton, L.; van der Zwet, J.; Damsteeg, J.W.; Slat, B.; Andrady, A.; Reisser, J. River plastic emissions to the world’s oceans. Nat. Commun. 2017, 8, 15611. [Google Scholar] [CrossRef]
- González-Fernández, D.; Cózar, A.; Hanke, G.; Viejo, J.; Morales-Caselles, C.; Bakiu, R.; Barceló, D.; Bessa, F.; Bruge, A.; Cabrera, M.; et al. Floating macrolitter leaked from Europe into the ocean. Nat. Sustain. 2021, 4, 474–483. [Google Scholar] [CrossRef]
- Neumann, D.; Callies, U.; Matthies, M. Marine litter ensemble transport simulations in the southern North Sea. Mar. Poll. Bull. 2014, 86, 219–228. [Google Scholar] [CrossRef] [PubMed]
- Zambianchi, E.; Trani, M.; Falco, P. Lagrangian transport of marine litter in the Mediterranean Sea. Front. Environ. Sci. 2017, 5, 5. [Google Scholar] [CrossRef]
- Christensen, A.; Murawski, J.; She, J.; St. John, M. Simulating transport and distribution of marine macro-plastic in the Baltic Sea. PLoS ONE 2023, 18, e0280644. [Google Scholar] [CrossRef] [PubMed]
- Schernewski, G.; Radtke, H.; Robbe, E.; Haseler, M.; Hauk, R.; Meyer, L.; Piehl, S.; Riedel, J.; Labrenz, M. Emission, transport, and deposition of visible plastics in an estuary and the Baltic Sea—A monitoring and modeling approach. Environ. Manag. 2021, 68, 860–881. [Google Scholar] [CrossRef]
- Galgani, F.; Hanke, G.; Maes, T. Global Distribution, Composition and Abundance of Marine Litter. In Marine Anthropogenic Litter; Bergmann, M., Gutow, L., Klages, M., Eds.; Springer Open: Berlin/Heidelberg, Germany, 2015; pp. 29–56. [Google Scholar]
- Vlachogianni, T.; Anastasopoulou, A.; Fortibuoni, T.; Ronchi, F. Marine Litter Assessment in the Adriatic and Ionian Seas; IPA-Adriatic. DeFishGear Project; MIO-ECSDE: Athens, Greece; HCMR: Gournes, Greece; ISPRA: Rome, Italy, 2017; p. 87. Available online: https://mio-ecsde.org/wp-content/uploads/2017/02/Final-MLA-salonia_final.pdf (accessed on 15 August 2023).
- Tsiaras, K.; Hatzonikolakis, Y.; Kalaroni, S.; Pollani, A.; Triantafyllou, G. Modeling the Pathways and Accumulation Patterns of Micro- and Macro-Plastics in the Mediterranean. Front. Mar. Sci. 2021, 8, 1389. [Google Scholar] [CrossRef]
- Die Kieler Woche 2023 in Zahlen. Available online: https://www.kieler-woche.de/de/medien/meldung.php?id=128091 (accessed on 24 November 2023).
- Baltic Sail Gdańsk 2023. Available online: https://www.gdansk.pl/wiadomosci/Baltic-Sail-2023-bilety,a,244903 (accessed on 24 November 2023).
- Collins, A.; Cooper, C. Measuring and managing the environmental impact of festivals: The contribution of the ecological footprint. J. Sustain. Tour. 2017, 25, 148–162. [Google Scholar] [CrossRef]
- Andriolo, U.; Gonçalves, G. Impacts of a massive beach music festival on a coastal ecosystem—A showcase in Portugal. Sci. Total Environ. 2023, 861, 160733. [Google Scholar] [CrossRef] [PubMed]
- Hanse Sail Rostock. Available online: https://www.hansesail.com/news/detail/maritimes-spektakel-in-rostock-500-000-menschen-besuchten-die-32-hanse-sail.html (accessed on 24 November 2023).
- Augsburger Allgemeine. Rekordverdächtige Besucherzahl bei Hanse Sail. Available online: https://www.augsburger-allgemeine.de/panorama/Rekordverdaechtige-Besucherzahl-bei-Hanse-Sail-id6276271.html (accessed on 24 November 2023).
- Wenneker, B.; Oosterbaan, L.; Intersessional Correspondence Group on Marine Litter (ICGML). Guideline for Monitoring Marine Litter on the Beaches in the OSPAR Maritime Area, 1.0 ed.; OSPAR Commission: London, UK, 2010; 15p, & Annexes. [Google Scholar] [CrossRef]
- Ostseezeitung. Paddler fischen Müll aus der Warnow. Available online: https://www.ostsee-zeitung.de/lokales/rostock/paddler-fischen-muell-aus-der-warnow-PZUK7I7SIEEQ4BQVLAVT3NZ6PM.html (accessed on 24 November 2023).
- Wetter in Rostock. Available online: https://www.timeanddate.de/wetter/deutschland/rostock (accessed on 24 November 2023).
- Burchard, H.; Bolding, K. GETM: A General Estuarine Transport Model—Scientific Documentation; Joint Research Centre: Ispra, Italy, 2002; Available online: https://getm.eu/files/GETM/doc/GETM2002.pdf (accessed on 3 December 2023).
- Klingbeil, K.; Burchard, H. Implementation of a direct nonhydrostatic pressure gradient discretisation into a layered ocean model. Ocean Model. 2013, 65, 64–77. [Google Scholar] [CrossRef]
- Umlauf, L.; Burchard, H. Second-order turbulence closure models for geophysical boundary layers. A review of recent work. Cont. Shelf Res. 2005, 25, 795–827. [Google Scholar] [CrossRef]
- Lange, X.; Klingbeil, K.; Burchard, H. Inversions of estuarine circulation are frequent in a weakly tidal estuary with variable wind forcing and seaward salinity fluctuations. J. Geophys. Res. Oceans 2020, 125, e2019JC015789. [Google Scholar] [CrossRef]
- Lange, M.; van Sebille, E. Parcels v0.9: Prototyping a Lagrangian ocean analysis framework for the petascale age. Geosci. Model Dev. 2017, 10, 4175–4186. [Google Scholar] [CrossRef]
- Hanse Sail Rostock: Handlungskonzept 2021+. Available online: https://www.hansesail.com/fileadmin/images/tzrw/Hanse_Sail_Handlungskonzept_FINAL.pdf (accessed on 24 November 2023).
- Rathaus Rostock. Nachhaltig und Barrierefrei: Auf dem Weg zur Hanse Sail der Zukunft. Available online: https://rathaus.rostock.de/de/rathaus/aktuelles_medien/nachhaltig_und_barrierefrei_auf_dem_weg_zur_hanse_sail_der_zukunft/346922 (accessed on 24 November 2023).
- Clean Regattas. Available online: https://www.sailorsforthesea.org/programs/clean-regattas (accessed on 24 November 2023).
- ISO 20121 Sustainable Events. Available online: https://www.iso.org/iso-20121-sustainable-events.html (accessed on 24 November 2023).
- EU Restrictions on Certain Single-Use Plastics. Available online: https://environment.ec.europa.eu/topics/plastics/single-use-plastics/eu-restrictions-certain-single-use-plastics_en (accessed on 24 November 2023).
- Schernewski, G.; Balciunas, A.; Gräwe, D.; Gräwe, U.; Klesse, K.; Schulz, M.; Wesnigk, S.; Fleet, D.; Haseler, M.; Möllman, N.; et al. Beach macro-litter monitoring on southern Baltic beaches: Results, experiences and recommendations. J. Coast. Conserv. 2018, 22, 5–25. [Google Scholar] [CrossRef]
- Larsen Haarr, M.; Falk-Andersson, J.; Fabres, J. Global marine litter research 2015–2020: Geographical and methodological trends. Sci. Total Environ. 2022, 820, 153162. [Google Scholar] [CrossRef]
- Browne, M.A.; Chapman, M.G.; Thompson, R.C.; Amaral Zettler, L.A.; Jambeck, J.; Mallos, N.J. Spatial and Temporal Patterns of Stranded Intertidal Marine Debris: Is There a Picture of Global Change? Environ. Sci. Technol. 2015, 49, 7082–7094. [Google Scholar] [CrossRef]
- Mazarrasa, I.; Puente, A.; Núñez, P.; García, A.; Abascal, A.J.; Juanes, J.A. Assessing the Risk of Marine Litter Accumulation in Estuarine Habitats. Mar. Pollut. Bull. 2019, 144, 117–128. [Google Scholar] [CrossRef]
- Geomar—Schattenseite der Kieler Woche. Available online: https://www.geomar.de/fileadmin/news_import/pm_2018_44_kiwo-muell.pdf (accessed on 24 November 2023).
- Geomar—Kieler Woche 2019 Kampagne. Available online: https://www.geomar.de/fileadmin/content/service/presse/Pressemitteilungen/2019/KielWeek_2019_FinalResults_German.pdf (accessed on 24 November 2023).
- Kieler Nachrichten. Kieler Woche 2023: Deutlich mehr Müll als im Vorjahr. Available online: https://www.kn-online.de/lokales/kiel/kieler-woche-2023-deutlich-mehr-muell-in-kiel-als-im-vorjahr-HAMMCQNAKBHGRBFWHXQNISYULU.html#:~:text=Insgesamt%2052%2C44%20Tonnen%20Abfall,gute%20Wetter%20tat%20sein%20%C3%9Cbriges (accessed on 24 November 2023).
- Adam, I. Tourists’ perception of beach litter and willingness to participate in beach clean-up. Mar. Pollut. Bull. 2021, 170, 112591. [Google Scholar] [CrossRef]
- Soares, J.; Miguel, I.; Venâncio, C.; Lopes, I.; Oliveira, M. Public views on plastic pollution: Knowledge, perceived impacts, and pro-environmental behaviours. J. Hazard. Mater. 2021, 412, 125227. [Google Scholar] [CrossRef] [PubMed]
- Fhews. Available online: http://fhews.de/unterwegs-mit-dem-schiermoker-dieses-schiff-fischt-den-muell-aus-der-foerde/ (accessed on 24 November 2023).
- Kieler Nachrichten. 1,2 Millionen Gäste: Ansturm zum Kieler-Woche-Start groß wie nie. Available online: https://www.kn-online.de/lokales/kiel/kieler-woche-2023-deutlich-mehr-muell-in-kiel-als-im-vorjahr-HAMMCQNAKBHGRBFWHXQNISYULU.html#:~:text=Insgesamt%2052%2C44%20Tonnen%20Abfall,gute%20Wetter%20tat%20sein%20%C3%9Cbriges (accessed on 24 November 2023).
- Maglic, L.; Maglic, L.; Grbcic, A.; Gulic, M. Composition of Floating Marine Litter in Port Areas of the Island of Mallorca. J. Mar. Sci. Eng. 2022, 10, 1079. [Google Scholar] [CrossRef]
- Nikiema, J.; Asiedu, Z.A. Review of the cost and effectiveness of solutions to address plastic pollution. Environ. Sci. Pollut. Res. 2022, 29, 24547–24573. [Google Scholar] [CrossRef] [PubMed]
- Brouwer, R.; Huang, Y.; Huizenga, T.; Frantzi, S.; Le, T.; Sandler, J.; Dijkstra, H.; van Beukering, P.; Costa, E.; Garaventa, F.; et al. Assessing the performance of marine plastics cleanup technologies in Europe and North America. Ocean Coast. Manag. 2023, 238, 106555. [Google Scholar] [CrossRef]
- Schwarz, A.E.; Ligthart, T.N.; Boukris, E.; van Harmelen, T. Sources, transport, and accumulation of different types of plastic litter in aquatic environments: A review study. Mar. Pollut. Bull. 2019, 143, 92–100. [Google Scholar] [CrossRef]
- Dürr, H.H.; Laruelle, G.G.; van Kempen, C.M.; Slomp, C.P.; Meybeck, M.; Middelkoop, H. Worldwide Typology of Nearshore Coastal Systems: Defining the Estuarine Filter of River Inputs to the Oceans. Estuaries Coasts 2011, 34, 441–458. [Google Scholar] [CrossRef]
- Chen, Z.; Li, G.; Bowen, M.; Coco, G. Retention of buoyant plastic in a well-mixed estuary due to tides, river discharge and winds. Mar. Pollut. Bull. 2023, 194, 115395. [Google Scholar] [CrossRef]
- van Emmerik, T.; Van Klaveren, J.; Meijer, L.J.; Krooshof, J.W.; Palmos, D.A.A.; Tanchuling, M.A. Manila river mouths act as temporary sinks for macroplastic pollution. Front. Mar. Sci. 2020, 7, 770. [Google Scholar] [CrossRef]
- Tramoy, R.; Gasperi, J.; Colasse, L.; Silvestre, M.; Dubois, P.; Noûs, C.; Tassin, B. Transfer dynamics of macroplastics in estuaries–new insights from the Seine estuary: Part 2. Short-term dynamics based on GPS-trackers. Mar. Pollut. Bull. 2020, 160, 111566. [Google Scholar] [CrossRef] [PubMed]
- Ryan, P. Does size and buoyancy affect the long-distance transport of floating debris? Environ. Res. Lett. 2021, 10, 107186. [Google Scholar] [CrossRef]
- Piehl, S.; Hauk, R.; Robbe, E.; Richter, B.; Kachholz, F.; Schilling, J.; Lenz, R.; Fischer, D.; Fischer, F.; Labrenz, M.; et al. Combined Approaches to Predict Microplastic Emissions Within an Urbanized Estuary (Warnow, southwestern Baltic Sea). Front. Environ. Sci. 2021, 9, 616765. [Google Scholar] [CrossRef]
- Schernewski, G.; Escobar Sánchez, G.; Wandersee, P.; Lange, X.; Haseler, M.; Nassour, A. Marine macro-litter (plastic) pollution of German and North African marina and city port sea floors. Appl. Sci. 2023, 13, 11424. [Google Scholar] [CrossRef]

Disclaimer/Publisher’s Note: The statements, opinions and data contained in all publications are solely those of the individual author(s) and contributor(s) and not of MDPI and/or the editor(s). MDPI and/or the editor(s) disclaim responsibility for any injury to people or property resulting from any ideas, methods, instructions or products referred to in the content. |
© 2024 by the authors. Licensee MDPI, Basel, Switzerland. This article is an open access article distributed under the terms and conditions of the Creative Commons Attribution (CC BY) license (https://creativecommons.org/licenses/by/4.0/).