Abstract
Algae are rich in nutrients and bioactive compounds, playing a crucial role as biostimulants for plants, enhancing growth and resilience. Four algae-based extracts were tested: the raw extract of red macroalgae Calliblepharis jubata (CJ), Ulasco (UA), Grasco (GR) and “AgriAlgae Foliar” (AA), the latter with microalgae. The extracts were evaluated for their physicochemical parameters (pH, electrical conductivity and solids), macro and microelements, phenolic compounds and antioxidants. Afterwards, seed germination trials were carried out with turnip seeds (Brassica rapa var. cymosa L.), and pot trials were carried out with Cherry Belle (Flora Lusitana, Cantanhede, Portugal) radish plants (Raphanus sativus L.), to verify the biostimulant potential of the extracts in horticulture. In the pot trials, all the treatments led to better yields and nutritional quality. The UA 0.12 extract influenced the heaviest roots (40.32 ± 11.89 g), on average, and the GR 0.10 extract in roots with the highest percentage of proteins (1.866 ± 0.004% dm), phenolic compounds (0.12121 mg eq. gallic acid/g fm) and antioxidants (0.0754 ± 0.0000 mg eq. ascorbic acid/g fm). The radishes treated with the AA 0.003 extract showed the greatest uniformity, the healthiest leaves, with the highest flavonoid content and the heaviest aerial part (19.52 ± 5.99 g). All the extract treatments resulted in a visible mitigation of abiotic stress and consequently better results, showing that these can be crucial for sustainable agriculture.
1. Introduction
The United Nations points to an increase in the world’s population, and it is expected that by 2050, it will increase to some 9.8 billion people requiring sustenance, whereas currently, an inappropriate use of chemicals as fertilizers and pesticides has caused soil pollution, loss of soil fertility and a decrease in biodiversity, eliminating pest natural enemies [1]. Crops suffer biotic and abiotic stresses that affect their growth and productivity; the effects of these stresses are responsible for losses in the order of 30% to 40% and 60% to 70% of plant productivity, respectively [2]. It has therefore become essential to look for emerging and sustainable technologies that can meet the urgent need to achieve sustainable agriculture with lower associated costs, higher yields and better product nutritional values to tackle the problems of hunger and malnutrition [3].
Algae have different classifications, while eukaryotes such as seaweeds, visible to the naked eye, are referred to as macroalgae; smaller unicellular organisms are collectively referred to as microalgae, which can be prokaryotic like Cyanophyceae (Chloroxybacteria) or eukaryotic like green microalgae (Chlorella vulgaris). Microalgae are referred to as a group of organisms with small dimensions and a simple structure but high photosynthetic efficiency [4,5,6]. Previous studies by Sharma et al. [7], Hamed et al. [8], Kapoore et al. [2] and Leogrande et al. [9] indicate that various algae have the potential to promote overall plant growth and development and greater resistance to biotic and abiotic stresses through low biomass foliar applications, which is promising for reducing the dependence on conventional synthetic fertilizers and pesticides, leading to a more sustainable and resilient agricultural system contributing to achieving zero hunger by enhancing crop productivity as well as improving social wellbeing through healthier plant growth and preserving marine and terrestrial ecosystems, increasing economic results and reducing the environmental footprint through carbon sequestration.
Macroalgae are highly diverse organisms that can essentially be distinguished as red, green and brown algae by their pigments and morphology. Red algae (Rhodophyta) lack flagellated cells and contain chlorophyll a, phycobiliproteins, and floridean starch as a storage product. Their chloroplasts have thylakoids occurring individually, with phycoerythrins present in the greatest amount, giving the algae their pinkish color. Green algae (Chlorophyta) possess chlorophylls a and b, store starch within the chloroplast (often with a pyrenoid) and differ from other eukaryotic algae by forming the storage product, the starch, in the chloroplast instead of the cytoplasm. Brown algae (Phaeophyceae) have chloroplasts containing chlorophylls a, c1 and c2, with their characteristic brown color derived from large amounts of the carotenoid fucoxanthin and their storage product laminarin [10]. Several primary and secondary metabolites have been identified in macroalgae extracts that have a positive impact on agriculture, including amino acids, polysaccharides, vitamins, fatty acids, mineral elements, phenolic compounds, and traces of phytohormones that all work in synergy to evoke an overall positive response in the plant system where each component might act on various metabolic networks [8,11,12]. According to Regulation (EU) 2019/3009, biostimulants are products that aim to stimulate the natural nutrition processes of plants regardless of nutrient content, and algae extracts meet this definition.
The objective of this study was to characterize the four algae-based extracts based on their physical and chemical parameters (solids, electrical conductivity and pH), macro and micronutrients, as well as antioxidants and phenolic compounds. Additionally, the study aimed to examine the impact of these extracts at varying concentrations on the germination and growth of turnip seedlings, aiming to optimize these concentrations. Lastly, this work also aims to evaluate the biostimulant potential of macroalgae extracts through foliar applications and examine the development and growth of “Cherry Belle” radishes plants, comparing their production, morphology, roots and nutritional properties.
2. Materials and Methods
2.1. Description of Raw Algal Extracts
Four algae-based extracts were characterized and evaluated for their biostimulant potential. The material for the raw extract of the red macroalga Calliblepharis jubata (CJ) was collected on 27 February 2023 at Cabo Mondego Beach (40°10′18.6″ N, 8°53′44.4″ W), Figueira da Foz, Portugal. The samples were washed with seawater to remove impurities, adhered sand, and other particles. Then they were then transported in plastic bags to the laboratory, where they were washed with distilled water to remove excess salt. Subsequently, the seaweeds were dried in an oven at 60 °C for 48 h (Raypa DAF-135, R. Espinar S.L., Barcelona, Spain). After drying, the material was stored in vacuum-sealed plastic bags in the dark at room temperature until use. This extract was prepared according to the methodology described by Sousa et al. [13] at a concentration of 0.035 g/mL.
The Ulasco (UA) and Grasco (GR) commercial algal extracts were provided by Umimare (Figueira da Foz, Portugal). The “AGRIALGAE-Original Foliar” extract (AA) (provided by Flora Lusitana) is a biostimulant containing microalgae and the brown seaweed Ascophyllum nodosum from the Spanish company AlgaEnergy S.A. The recommended dose by the producer is 1 g of AA extract in 300 g of water.
2.2. Determination of pH and Electrical Conductivity of Raw Extracts
The pH and electrical conductivity (EC) of the algal extracts were determined using a pH meter (pH Meter 3310, Jenway, London, UK) and an electrical conductivity meter (WTW ProfiLine Cond 3110, London, UK), respectively.
2.3. Determination of Solids
For determination the solids of the raw algal extracts, method 2540 of the Standard Methods for the Examination of Water and Wastewater was used [14]; 50 mL of each raw extract was placed in crucibles previously dried in an oven at 105 °C (Memmert, Germany), cooled in a desiccator and weighed after cooling. The weight of the crucibles before and after adding the extracts was recorded. They were then left at 105 °C in the oven until a constant weight was reached. The weight was recorded after the cooling process. Subsequently, the crucibles were placed in a muffle oven at 550 °C (Induzir, Batalha, Portugal) for 2 h. After cooling in the desiccator, crucibles were weighed. Total solids, total volatile solids and total fixed solids were calculated using the following formulas [14]:
2.4. Phosphorus Determination
Phosphorus content was determined using the AOAC 970.39 method [14]. The ashes obtained from the calcination of the raw algal extracts were digested with 10 mL of hydrochloric acid (HCl) (1 + 1) three times. In the last digestion, the liquid was almost brought to dryness with a watch glass in a regulated hot water bath (100–120 °C) and was transferred and filtered into a 50 mL volumetric flask. In the volumetric flask, 10 mL of sample was added to 10 mL of a solution of vanadate molybdate, and the volume was adjusted with distilled water. After 10 min, the absorbance at 470 nm was determined by spectrophotometry (PG instrument T80 + UV/VIS, Wibtoft, UK).
2.5. Mineral Determination
The mineral content was determined in the ashes obtained from the calcination of the raw algal extracts. They were digested with 12 mL of HNO3 (1 + 1) with a watch glass, and the liquid was evaporated almost to dryness in a regulated hot water bath (100–120 °C). It was then transferred and filtered into 50 mL volumetric flasks.
Calcium and magnesium were determined using the AOAC 975.03 method [14]. In a 50 mL volumetric flask, 5 mL of the sample was added to 10 mL of LaCl3 (5%), and the volume was adjusted with distilled water. Sodium and potassium were determined using the AOAC 966.16 and AOAC 965.30 methods, respectively [14]. In a 50 mL volumetric flask, 5 mL of the sample was added to 2.5 mL of LiCl2 (0.05 N), and the volume was adjusted with distilled water. Iron, zinc, manganese and copper were determined using the AOAC 975.03 method [14]. The solution obtained was adjusted with distilled water and directly analysed by flame atomic absorption spectrometry. All the analyses were performed by flame atomic absorption spectrometry (FAAS) on a PerkinElmer PinAAcle 900 T (Waltham, MA, USA), with dilutions made with distilled water whenever necessary according to the samples and standards.
2.6. Nitrogen and Protein Determination Using the Kjeldahl Method
Nitrogen and crude protein were determined according to the AOAC 978.04 method [14]. Initial samples of 5 mL were placed in a Kjeldahl tube. Concentrated sulfuric acid (Chem-Lab NV, Zedelgem, Belgium) and a selenium catalyst tablet (PanReac AppliChem, Darmstadt, Germany) were added. The tubes were placed in a Kjeldahl Digestor (VELP Scientifica, Velate, Italy) at 400 °C for 2 h. Subsequently, tubes were allowed to cool in the fume hood, and 50 mL of distilled water was added.
A solution of 25 mL of boric acid (Chem-Lab NV, Belgium) with a mixed indicator was placed in an Erlenmeyer flask. Together with the Kjeldahl tube, they were placed in a Kjeldahl Tube Distiller (VELP Scientifica, Italy), which was followed by the addition of 50 mL of 40% (m/v) sodium hydroxide (NaOH) (JMGS-José Manuel Gomes dos Santos, Odivelas, Portugal). The distillate was collected in the Erlenmeyer flask and titrated with a known solution of 0.1 M hydrochloric acid (Chem-Lab NV, Belgium). A factor of 6.25 for radishes was considered for calculating crude protein.
2.7. Determination of Total Phenolic Content in Raw Algal Extracts
The phenolic compounds content was determined according to the Folin–Ciocalteu method by Singleton and Joseph A. Rossi [15]. For 50 µL of each sample, 50 µL of the Folin–Ciocalteu reagent, 1 mL of a 7.5% (w/v) sodium carbonate (Na2CO3) solution and 1.4 mL of ultrapure water were added. The solutions were vortexed, and after 1 h in the dark, the absorbance at 760 nm was measured. As a comparison, a gallic acid solution was prepared, which was treated as a sample to establish a standard curve. The results were expressed in equivalents of gallic acid.
2.8. ABTS+ Assay for Determination of Antioxidants in Raw Algal Extracts
The total antioxidant capacity was determined using the ABTS+ method, as described by Gião et al., with modifications [16]. For this, an ABTS+ solution was prepared by mixing a 1:1 (v/v) solution of a 7.0 mM ABTS (2,2′-Azino-Bis (3-Ethylbenzothiazoline-6-Sulfonic Acid)) and a 2.45 mM potassium persulfate (K2S2O8) solution, and the solution was left in the dark for more than 16 h.
To obtain an absorbance value between 680 and 720 at a wavelength of 734 nm, dilutions were prepared with ultrapure water until a solution with the desired absorbance was obtained; 10 µL of the sample and 1 mL of ABTS+ solution was added, and after 6 min of reaction, the absorbance was read. As a comparison, an ascorbic acid (vitamin C) solution was prepared, which was treated as a sample to establish a standard curve. The results were expressed in equivalents of ascorbic acid.
2.9. Preparation of Extracts
The CJ extract was prepared using the raw extract of Calliblepharis jubata concentrated extract, diluted with distilled water at concentrations of 12%, 10% and 5% (v/v).
The Ulasco (UA) and Grasco (GR) extracts were prepared by diluting UA and GR concentrated extracts, respectively, with distilled water at concentrations of 12%, 10% and 5% (v/v).
The AA extract was prepared using the microalgae-based biostimulant “AGRIALGAE-Original Foliar.” Dilutions were made with distilled water at concentrations of 0.3%, 0.5% and 1% (v/v).
2.10. Germination Tests
In germination tests, Brassica rapa var. cymosa seeds from (Flora Lusitana, Cantanhede, Portugal), commonly known as turnip greens, were used. All seeds were disinfected in a 3% sodium hypochlorite solution for 1 min and washed in distilled water for 3 min according to Rayorath et al. [17]. Petri dishes lined with cotton on the bottom and filter paper above it were prepared and sterilized, and 70 mL of the extracts “UA”, “CJ”, “GR” and “AA” were added at different concentrations. A control was also prepared using distilled water at the same volume; 25 seeds per Petri dish were placed, with 3 repetitions for each treatment, and all plates were identified.
Petri dishes were then incubated (Heraeus B5090E Incubator, Thermo Scientific, Osterode, Germany) at 23 ± 1 °C for 14 days. Seed germination counts were made 7, 10 and 14 days after incubation (DAI).
The calculation of the germination percentage (GP) was calculated according to the following formula by Seng and Cheong [18]:
where SG represents the number of germinated seeds and TS represents the total number of seeds used in germination (25 seeds per Petri dish). Measurements were also made regarding radicle length (RL) and epicotyl length (EL), in centimetres. RL and EL measurements were performed on the 14th day after incubation.
2.11. Pot Trial of Radish Plants Treated with Different Algae-Based Extracts
Pots used for this experiment were 15 cm high and had a diameter of 21.5 cm, with a volume of 5.45 L. A concentration of each extract used in this trial resulted from the germination tests where the extract with the best performance was selected. The choice of the extract concentration to be applied was based not only on the performance in the germination tests (%GP, radicle length, epicotyl length), but also on economic factors. The extracts UA 12%, CJ 5%, GR 10% and AA 0.3% (v/v) were selected.
Seeds of Raphanus sativus L. from Flora Lusitana, cultivar Cherry Belle were used. This cultivar has a red round shaped root, and it can be developed in approximately 40 days after sowing (statement of the seed producer).
In the radish trial, seeds were sown on 28 June 2023 at Escola Superior Agrária de Coimbra (ESAC) in pots in an open field, with some initial shade to protect the radishes from the hot and dry Portuguese summer. The substrate used resulted from a mixture of approximately 75% “SIRO GERMINAÇÃO” (SIRO, Coimbra, Portugal) and 25% fine shifted sand, which was first mixed and moistened and filled the pots, adding 4 seeds per pot and 5 pots per treatment. Two pots, treated with tap water, were used as controls.
The Siro Substrate “Siro Germinação” is a professional agricultural acidic substrate (in CaCl2: pH = 5.5–6.5) for germination with NPK-9-2-2. On the 23rd day after sowing (DAS), a cap with 5 mL of “NITRO 27 MgO”, a granulated top-dressing fertilizer from the company DEIBA, was added to all pots. The information available regarding Nitro 27 MgO composition reveals that it contains 27% N (13.5% nitric, 13.5% ammonia), 4% MgO and limestone (although the % is not mentioned by the producer). On the 34th DAS, chlorophyll (Chl), flavonoids (Flav), anthocyanins (Anth) and NBI (Nitrogen Balance Index) of the leaves were measured with DUALEX FORCE-A (France) before the first foliar treatment was applied. These parameters (Chl, Flav, Anth NBI) were measured again on the 44th DAS, and the extracts were applied again 10 days after the first application. All foliar treatments consisted of 3 mL respective extracts per plant using a spray bottle.
Plants were collected after all measurements were taken with the DUALEX FORCE on the 47th DAS. All measurements recorded with the DUALEX-FORCE-A were made in triplicate per 3 leaves from 3 different plants from each pot and were performed randomly.
2.12. Post-Harvest Treatment of Radishes
On the 47th DAS, 14 August 2023, the radishes were harvested and stored for treatment in identified plastic bags and then taken to the laboratory, with evaluations being carried out regarding the morphology of the radish plants, the number of leaves per plant, their average size (comparison of the extension of the leaf along the main axis, going from the tip to the base of the leaf, the region where the leaf is connected to the stem) (Figure 1), and plant weight (total and without an aerial part) using PB3002-S, METTLER TOLEDO. A vertical (from top to the bottom of the root along the vertical axis) and horizontal (lateral extend of the root, perpendicular to the vertical axis) diameter were evaluated using a calliper (Electronic Digital Caliper, Gedore, Birkfeld, Austria).
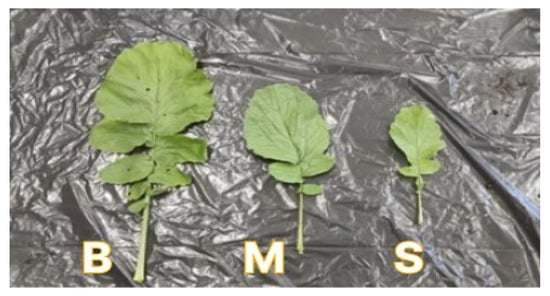
Figure 1.
Classification used for the average size of radish leaves in order (Big (B)-Medium (M)-Small (S)).
The radish roots were subsequently separated, per treatment, and were cut into slices. While most of the radish roots were sliced and placed on aluminium trays to dry at 65 °C for 48 h and subsequently milled with a mill (BOSCH TSM6A013B, Stuttgart, Germany) and stored for determination of nutrients, approximately 5 g of the sliced fresh radish roots were separated, frozen and stored at −20 °C for further evaluation of their bioactive compounds (phenolic compounds and antioxidants).
2.13. Determination of Macro and Micronutrients
The macro and micronutrient content of the radishes was determined using methodologies from Section 2.3, Section 2.4 and Section 2.6, with the difference that a solid sample was used and a certain amount of it was weighed, already dried and milled.
2.14. Extraction of Bioactive Compounds from Radishes
To evaluate both the phenolic and antioxidant content present in radishes, fresh previously frozen samples were used. These were milled (BOSCH TSM6A013B, Germany) and placed in amber bottles to protect from light, containing methanol in a proportion of 1/10 (v/v). After homogenization, the mixture was placed in an ultrasonic bath (RETSCH UR1, Haan, Germany) for 10 min at (42 kHz) to extract the metabolites, after which the extracts were decanted and filtered.
2.15. Determination of the Total Content of Phenolic Compounds in Radishes
To determine the phenolic compounds of radishes, 3 mL of ultrapure water and 250 µL of Folin Ciocalteau reagent were added to 50 µL of the extracts obtained using methodology 2.14. After stirring, 750 µL of sodium carbonate (Na2CO3) was added and left to react at room temperature and protected from light, with the absorbance finally recorded at 750 nm, using methanol as a blank. A standard curve of gallic acid was prepared in parallel.
2.16. ABTS+ Test for Determining Antioxidants in Radishes
To determine the antioxidants in radishes, the ABTS+ radical was first formed by mixing 1-1 (v/v) of a 7.4 mM ABTS solution and a 2.6 mM solution of potassium persulfate (K2S2O8), and the solution was left in the dark for a period of more than 16 h. Once the radical was formed, it was diluted with methanol to obtain an absorbance between 0.680 and 0.720 at 734 nm. To analyse the antioxidant activity, 150 µL of the extracts obtained through methodology 2.14 were added to 2850 µL of the ABTS+ solution; the mixture was left to react for 30 min in the dark, and the absorbance recorded at the end of this period at 734 nm. A standard curve of ascorbic acid was prepared in parallel as a sample.
2.17. Statistical Treatment
Statistical analysis was performed using SigmaPlot 14.0 software; data were checked for normality (Shapiro–Wilk test) and homogeneity (Brown–Forsythe test) both between the different samples and between the different treatments.
One-way analysis of variance (ANOVA) was then performed to evaluate statistically significant differences between each parameter. Statistical analysis was performed comparing the different treatments, being considered statistically different when p value < 0.05. When the assumptions of ANOVA were not met or differences were detected, multiple comparison tests were used applying the SigmaPlot 14.0 software, namely the Tukey test, the Kruskal–Wallis test, Dunn’s test and the Holm–Sidak test to identify the differences. The t-test was used when no differences were observed in samples with reduced repetitions to compare statistical differences between group means. This method is more sensitive to small differences and consequently detects differences between samples with small sample sizes.
3. Results and Discussion
3.1. Determining the pH and Electrical Conductivity of the Crude Extracts
It was possible to establish a negative correlation between pH and electrical conductivity (EC) according to Pearson’s coefficient (R2 = 0.9545); as one variable increased, the other decreased in a way that was close to linear (Table 1).

Table 1.
pH values and electrical conductivity (EC) (dS/m) of the crude extracts Ulasco (UA), Calliblepharis jubata (CJ), Grasco (GR) and Agrialgae (AA).
Comparing the different extracts, the AA extract stands out both because its pH (3.48) is much lower than the others and because its EC (22.50) is much higher, while the other extracts show similar values for these parameters.
Based on the results, considering that pH can negatively affect plants when it is below 5.5 and that EC is an index of dissolved salts, which in high concentrations (above 2 dS/m) can cause extracts to be too conductive for plants, provoking cells into osmotic stress and thus having a negative impact on the development of the plants [19]. It became clear that the AA extract, compared to the others, would have to be diluted with water in lower concentrations than the other raw extracts in order to achieve a neutral/slightly acidic pH and an EC close to 1 dS/m, which according to Hernández-Herrera et al. [20] showed the best results for algae extracts made with Sargassum liebmannii, Padina gymnospora (Phaeophyceae), Caulerpa sertularioides and Ulva lactuca (Chlorophyta), regarding germination and seedlings development of Solanum lycopersicum L.; 0.2% seaweed concentrations showed the best results since plants are more sensitive to salinity during germination and seedling growth stages.
3.2. Determination of Crude Extract Solids
Table 2 shows the total solids (TS), volatile solids (VS) and fixed solids (FS) present in each extract. Given the previous information, namely the method of preparation and the raw material of the extracts, the AA extract, based on microalgae, was the statistically densest (p < 0.05) and therefore had the highest TS values (118.499 ± 2.233); the CJ extract, prepared at the lowest concentration (0.035 g/mL), had the lowest TS value (10.335 ± 0.046). UA and GR extracts presented very similar values (23.595 ± 0.095 and 22.098 ± 0.113, respectively). These values were expected given that the method used to prepare them was similar, although the raw materials were partly different. Regarding VS, the AA extract showed the statistically (p < 0.05) highest values (1015.250 ± 3.018), while GR showed the lowest (984.386 ± 2.936); only the AA extract showed statistically significant differences compared to other extracts. The AA extract had the highest amount of FS (15.662 ± 1.109), while CJ had the lowest (6.390 ± 2.273), with significant differences between these two (p < 0.05).
Table 2.
Total solids (TS), volatile solids (VS) and fixed solids (FS) of the crude extracts UA, CJ, GR and AA (g/L). Mean ± standard deviation. Different letters indicate statistically significant differences by t-test (p < 0.05).
It was not possible to compare these parameters with the literature as they depend on the concentration at which the extracts were prepared, the extraction methods and the material used, which is mostly unknown for UA, GR and AA, while for CJ, no information was found regarding these parameters.
3.3. Characterization of Macro- and Micro-Elements in the Crude Extracts
The AA extract from microalgae showed higher concentrations of elements studied, except for sodium (953.00 ± 165.46), zinc (5.25 ± 0.26), manganese (3.11 ± 0.26) and copper (1.17 ± 0.02) (Table 3). This can be explained by the fact that algae used to produce the UA, CJ and GR extracts originated from seawater or estuarine habitats. There were no statistically significant differences (p > 0.05) found between the extracts for calcium, sodium, or copper. The nitrogen content of the AA extract differs significantly (p < 0.05) from the other extracts, with values around 50× higher (10,925.49 ± 12.99); this value was superior to that described in its technical sheet (1.3% N total by weight) [21]. Also noteworthy is the phosphorus value, found in the AA extract, which was around 10x higher compared to the others; this can be explained in part by the presence of diphosphorus pentoxide (P2O5) in its composition (0.25% by weight, as described in its technical sheet) [19].
Table 3.
Concentration of macro- (N, P, K, Ca, Mg, Na) and micro-elements (Fe, Zn, Mn, Cu) in crude extracts of UA, CJ, GR and AA (mg/L). Mean ± standard deviation. Different letters indicate statistically significant differences by t-test (p < 0.05).
3.4. Phenolic Compound and Antioxidant Content of Algae Extracts
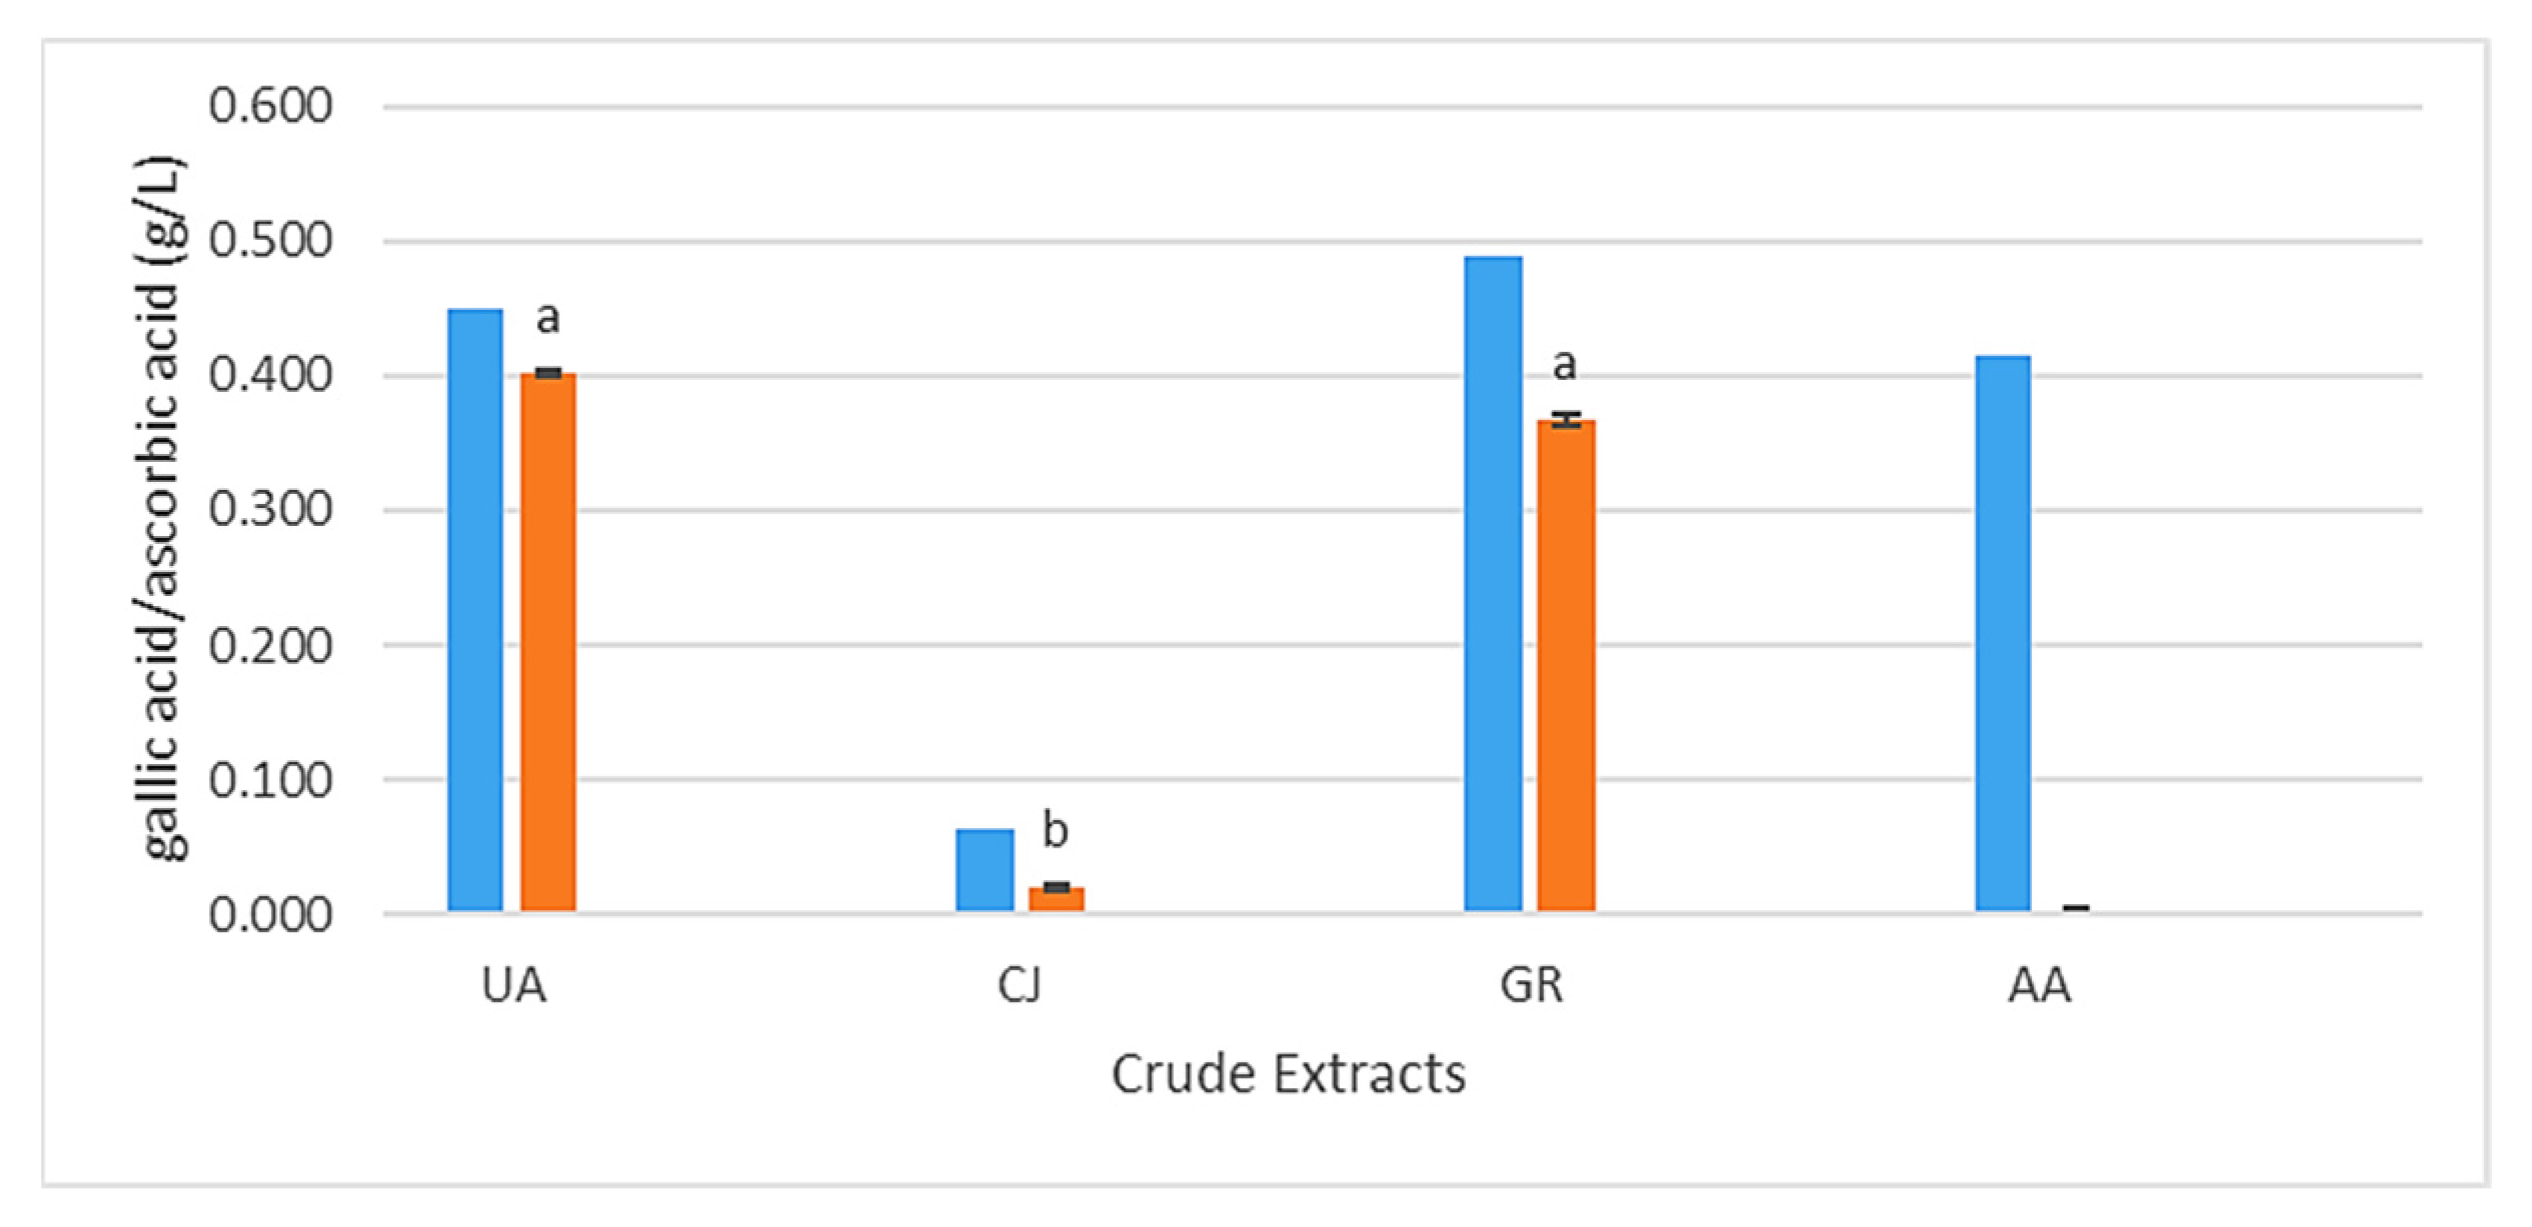
Regarding phenolic compounds (Figure 2), the CJ extract presented the lowest value of the four extracts, as expected, with 0.064 g GAE/L since the other extracts have Ascophyllum nodosum (Phaeophyceae), known for having relatively high amounts of phenolic compounds like phlorotannins that exert a powerful antioxidant activity [22]. The GR extract had the highest phenolic content (0.489 g GAE/L), followed by the UA extract (0.449 g GAE/L) and AA (0.415 g GAE/L); these values are still lower than those reported by Ertani et al. [23], with total phenolics ranging between 0.555 g/L and 1.933 g/L in five commercialized biostimulants from Ascophyllum nodosum. Regarding antioxidants, the UA extract had the highest value (0.402 g AAE/L), followed by the GR extract (0.367 g AAE/L), with statistical differences with the CJ extract, which had relatively low values (0.020 g AAE/L). It was possible to establish a strong positive correlation for UA, CJ and GR extracts between PC and AO according to the Pearson coefficient (R = 0.9859), showing a close linear relationship between these two variables.
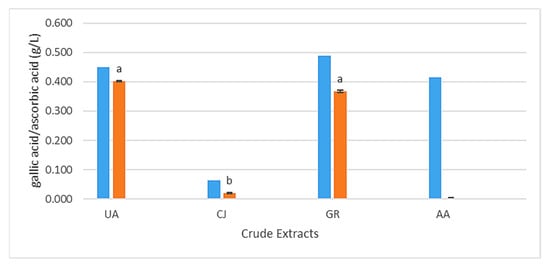
Figure 2.
Composition of UA, CJ, GR and AA alga extracts in phenolic compounds (CF) in blue (g gallic acid equivalents (GAE)/L) and antioxidants (AO) in orange (g ascorbic acid equivalents (AAE)/L) (average values; different letters indicate statistically significant differences by t-test (p < 0.05)).
The AA extract, contrary to what was expected regarding the phenolic compounds present in this extract, showed no inhibition of the ABTS+ radical or negative values, indicating a lack of antioxidant activity or a pro-oxidant effect, as described by Castro [24], where in other algae extract with Codium tomentosum, a green seaweed, it was not possible to obtain coherent and concordant results using this method. Possible future approaches to this parameter could include the evaluation of antioxidants using HPLC or other methods such as TEAC (Trolox Equivalent Antioxidant Capacity), ORAC (Oxygen Radical Absorbance Capacity) DPPH (2,2-Diphenyl-1-picrylhydrazyl) and FRAP (Ferric Reducing Antioxidant Power), which, like the ABTS method, evaluate antioxidant capacity through different oxidation/reduction mechanisms [25].
3.5. Germination Tests
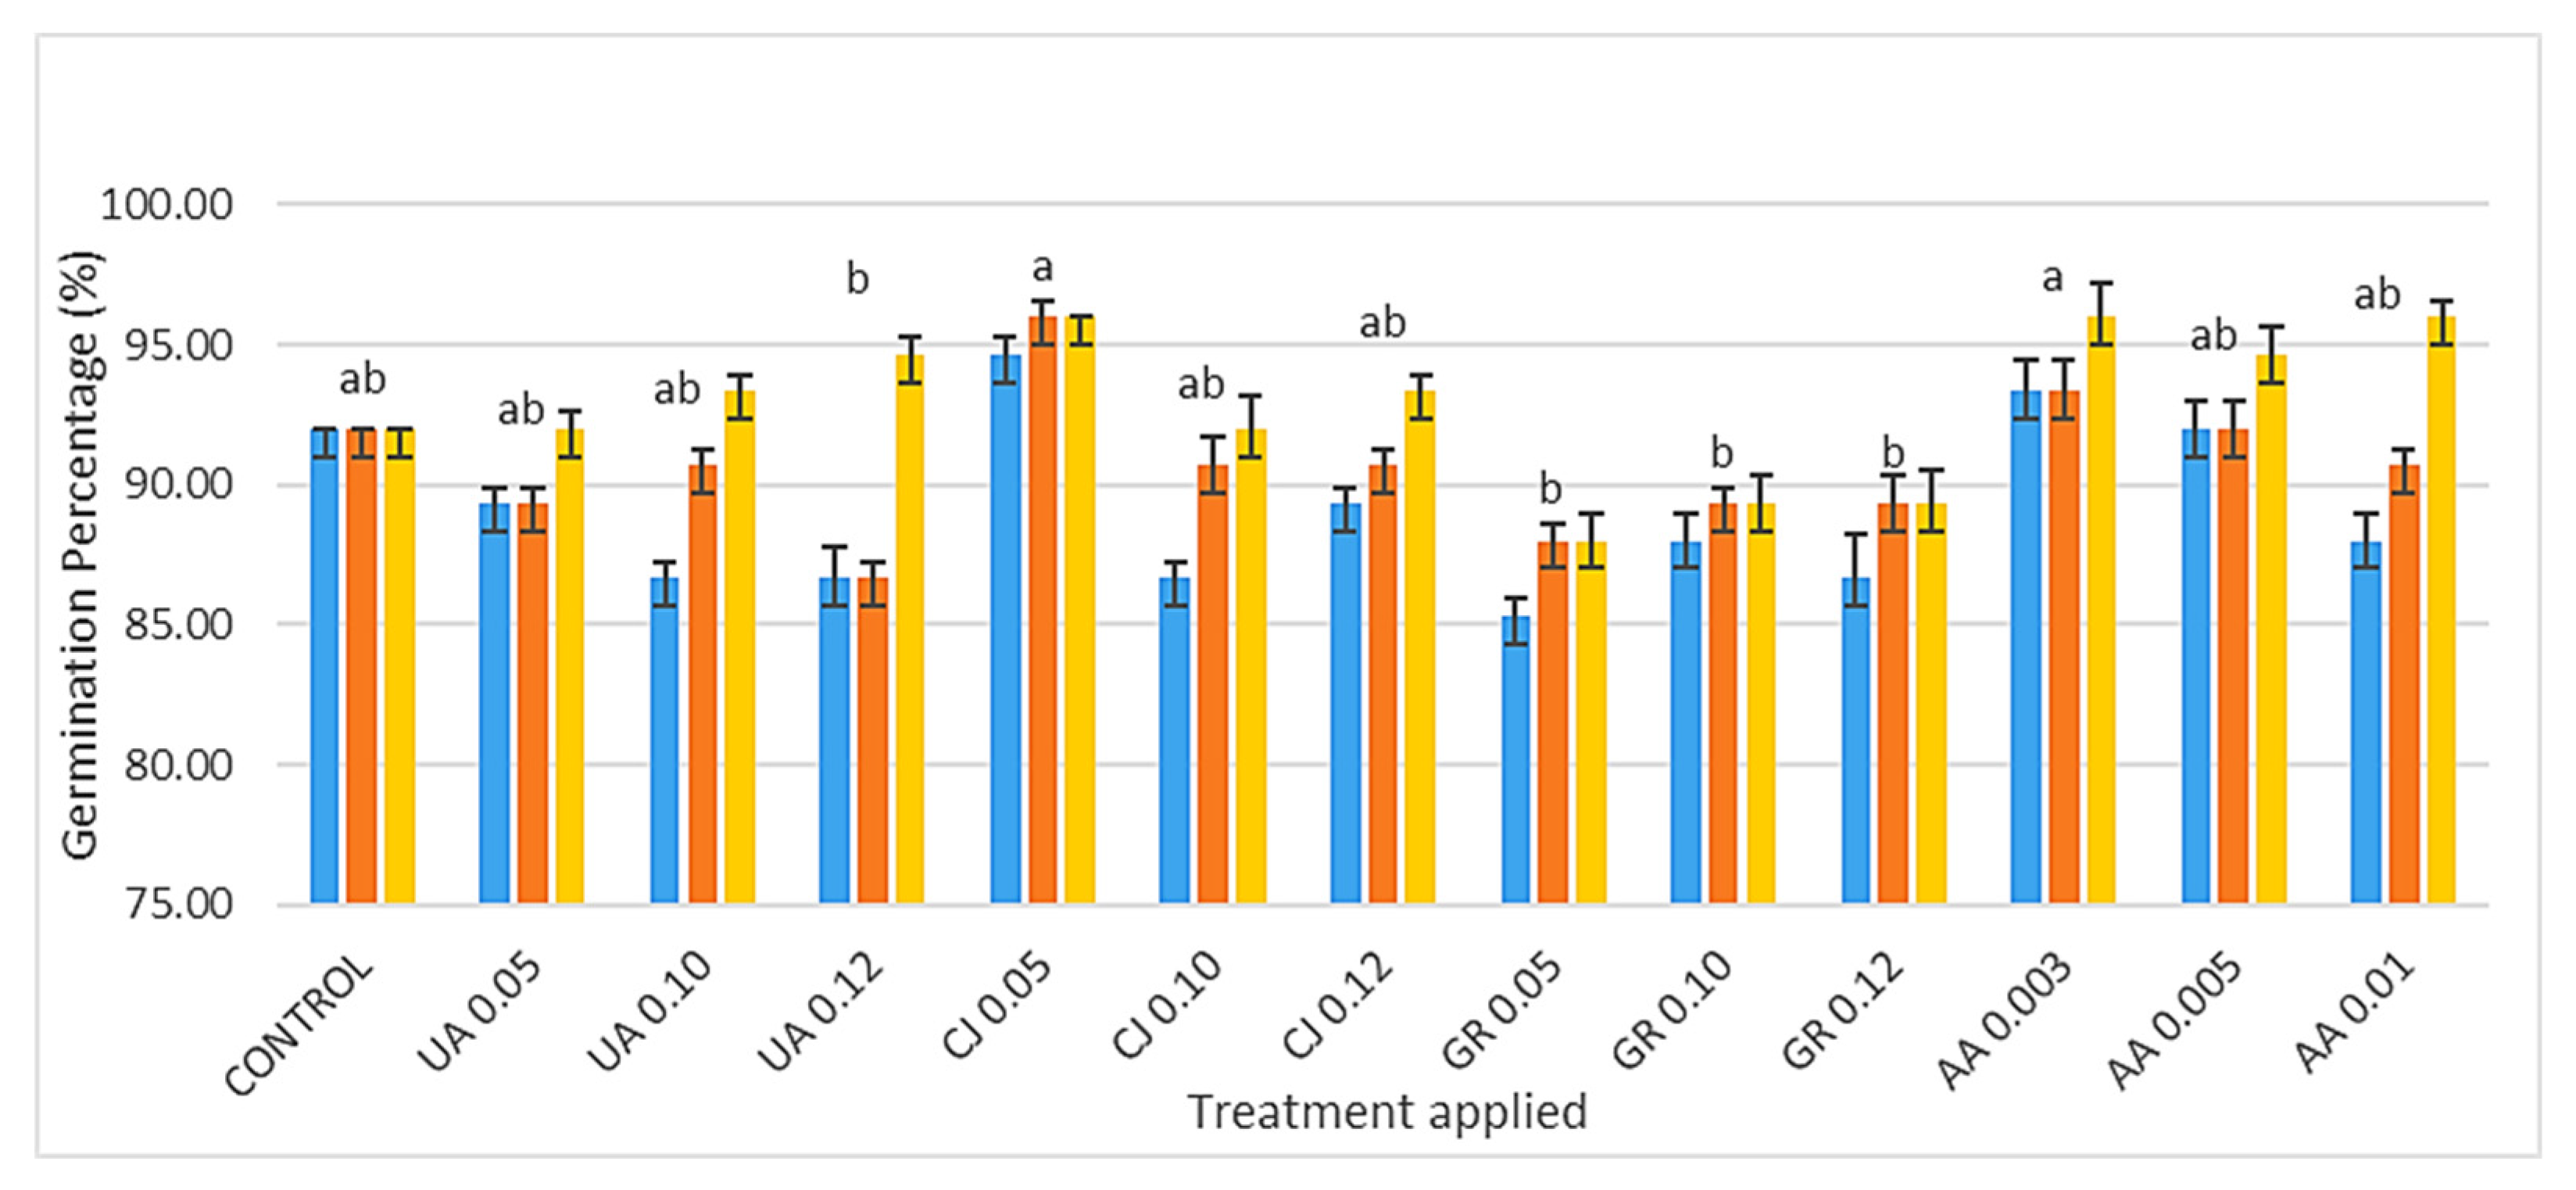
Figure 3 shows the germination percentage (GP) of turnip greens seeds seven, ten, and 14 days after incubation (DAI) and the influence that each extract had on their germination (different letters indicate significant differences between these groups (p < 0.05)). The extracts CJ 0.05, AA 0.003 and AA 0.01 were the ones that had the greatest PG at the 14th DAI (96%), while the GR, for all its concentrations, showed the least promising results for PG 88%, 89.3% and 89.3%, respectively, for GR 0.05, GR 0.10 and GR 0.12.

Figure 3.
Percentage (%) of turnip seed germination 7, 10 and 14 days after inoculation in blue, orange and yellow, respectively, influenced by the extract concentrations/treatment applied. UA, CJ, GR and AA represent the extract followed by the respective concentrations used (v/v) (mean values n = 3; different letters indicate significant differences by the Holm–Sidak multiple comparison method (p < 0.05)).
The CJ 0.05 extract showed the best results in terms of GP (7, 10 and 14 DAI), followed by the AA 0.003 extract, with significant differences when compared to the UA 0.12, GR 0.05, GR 0.10, and GR 0.12 extracts and control. The GR extract, in all its concentrations, showed the least results, even with lower values than the control. No treatment showed significant differences when compared to the control, although up to the 10th day, the control showed one of the highest values since seeds are sensitive to salinity during imbibition, despite the effect of salt being merely osmotic until a hydration threshold is surpassed [26].
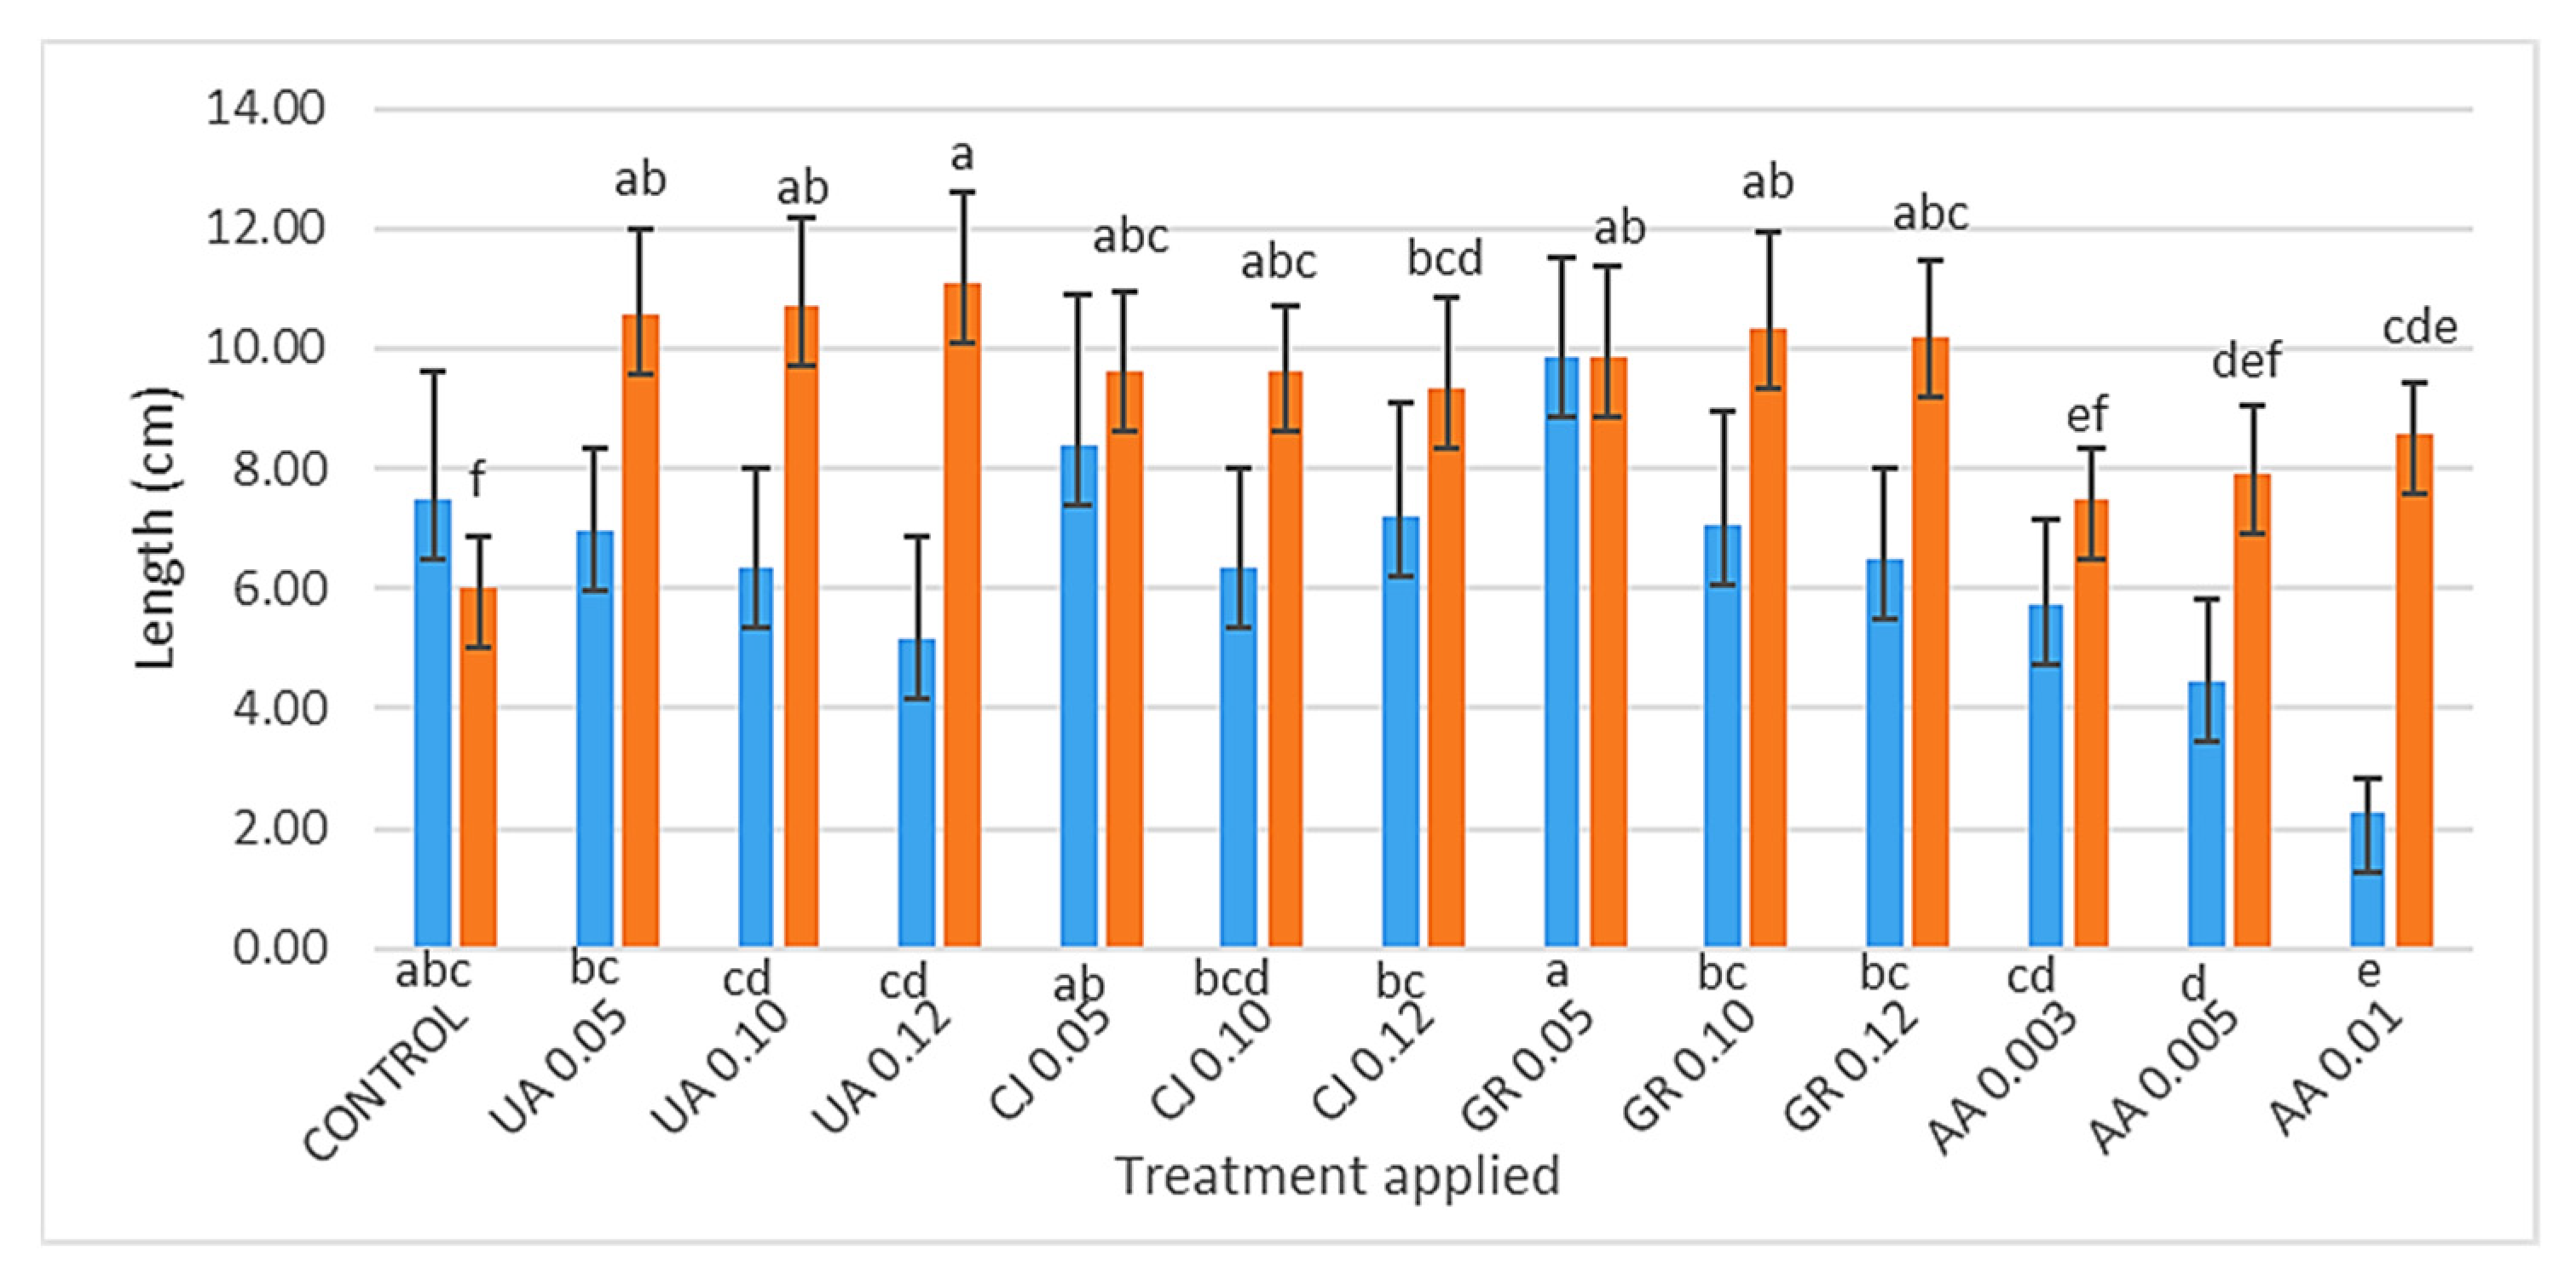
The control and extracts GR 0.05 and CJ 0.05 stimulated the radicle length (RL) the most (7.50; 9.86 and 8.40 cm, respectively), obtaining the highest results (Figure 4). The lower the extract concentration, the greater was the radicle growth. This is because when the extract concentration is lower, there are less nutrients in the extract, so the radicles will be stimulated to grow, searching for nutrients. On the other hand, the treatments AA 0.01, AA 0.05 and AA 0.003, (2.27; 4.45 and 5.73 cm, respectively), were the ones that led to the lowest RL, which is in line with the same logic: knowing that this extract is the richest in nutrients, the roots were not stimulated to grow in search of them, resulting in lower radicle growth.
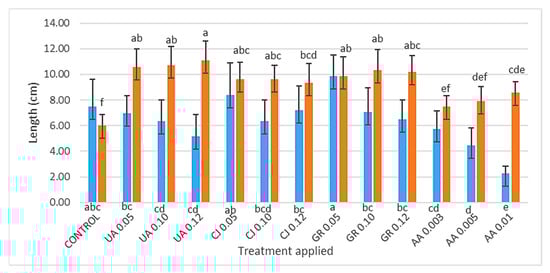
Figure 4.
Radicle length (RL) in blue and epicotyl length (EL) in orange of turnip greens depending on the different extracts UA, CJ, GR and AA, followed by the respective concentrations (v/v) (average values n = 15; different letters indicate significant differences by the Holm–Sidak multiple comparison method (p < 0.05)).
As for epicotyl length (EL), all the treatments, apart from the AA 0.003 (7.49 cm) and AA 0.005 (7.92 cm) extracts, showed significant differences when compared to the control (6.00 cm), which had the worst result in this parameter. This shows that all the extracts, except those mentioned, positively stimulated the growth and development of the seedlings. The UA 0.12 treatment showed the best EL values, followed by their lowest concentrations of UA 0.10 and UA 0.05 (11.100; 10.693 and 10.547 cm, respectively).
Considering all the parameters analysed in the germination tests and the economic factor, the extracts UA 0.12, CJ 0.05, GR 0.10 and AA 0.003 were chosen to be used in the test with the potted plants.
Among the selected concentrations, the UA 0.12 extract showed the highest PG% on the 14th day, as well as the highest EL of all the treatments, although there were no significant differences between the different concentrations.
The CJ 0.05 extract showed the best results in terms of GP and EL, in line with its higher concentrations, as well as a higher RL. Taking these factors into account, as well as the economic factor, this extract was selected at the lowest concentration tested for the pot test.
The GR 0.10 extract had a poor GP% compared to the other treatments, but it had the highest EL value and a modest RL value of its concentrations. GR 0.05 showed a very high RL, but a lower EL and GP%, than GR 0.10, leading to a disparity between EL and RL compared to the other treatments, which may be related to the lack of nutrients in the root and not to its biostimulant potential, so GR 0.10 was chosen.
Finally, the AA extract showed the lowest results in terms of RL, with only AA 0.003 showing a RL that was not significantly different when compared to the control and EL that was still higher than the control. We therefore opted for AA 0.003, which had the closest concentration to that suggested by the manufacturer.
3.6. Trial of Radishes in Pots with Extract Applications
The leaves on the control plants were generally more yellowish in colour while the plants treated with the other extracts were green (Figure 5). With the Dualex Force-A measurements (Table 4), we can see that the control plants, in general on day 47, showed lower flavonoid values in the leaves compared to the others, as well as large fluctuations in this parameter and, consequently, in the nitrogen balance index (NBI). Compared to the control plants, on average, plants treated with the extracts managed the heat, dehydration and radiation stresses better in increasing the production of flavonoids, proving the potential of extracts as stress-mitigating agents that protect and improve plants [8,27].
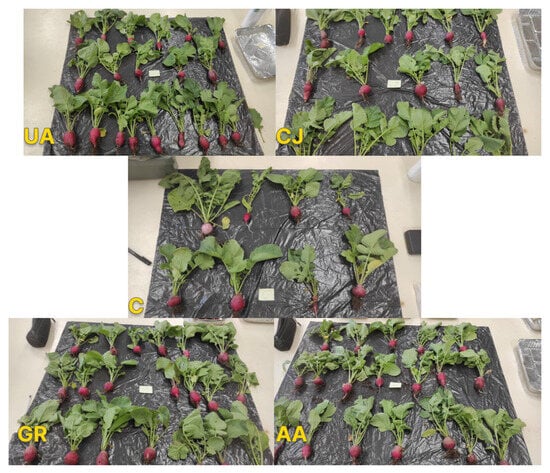
Figure 5.
Photographic record of radishes grouped by treatment (from left to right and top to bottom: UA, CJ, C, GR and AA).
Table 4.
Chl (chlorophyll), Flav (flavonoids), Anth (anthocyanidins) and NBI (nitrogen balance index) indexes measured with DualexForce-A in radishes on the 34th, 44th and 47th day after sowing (DAS) (mean values ± standard deviation n = 45; different letters indicate significant statistical differences using the Holm–Sidak method and Dunn’s test (p < 0.05)).
There were no statistically significant differences in the Chl and Anth parameters related to chlorophyll and anthocyanidins between the treatments (Table 4). There were, however, significant differences in the flavonoid index (Flav) and, consequently, in the nitrogen balance index (NBI), even on the 34th day, when no differences were expected.
Comparing the values, where statistically significant differences were observed, it is worth highlighting the flavonoids in AA which, as well as being the only group to show an increase in flavonoids after the first foliar application, also showed the highest values for this parameter on the 44th day and on the 47th day after the second application. The other extract treatments, UA, CJ and GR, however, showed a drop in flavonoid values in the leaves between the 34th and 44th days and between the 44th and 47th days, although, on average, they are higher than the control.
In general, there were no significant statistical differences between treatments in terms of plant morphology, except for the vertical diameter of the root (Table 5), where the UA and CJ extracts showed the highest values, with significant differences compared to the control related to higher growth. The control radishes, in all the parameters, showed greater mutual disparity (higher standard deviation) and less uniformity compared to the radishes subjected to treatments UA, CJ, GR and AA.
Table 5.
Individual morphological evaluation of different radishes depending on the treatment, respectively; the control and the extracts UA, CJ, GR and AA applied to the leaves (means ± standard deviation n = 8); different letters indicate statistically significant differences by the Holm–Sidak method (p < 0.05). (* S-small M-Medium, as described in the methodology).
In terms of the average total weight of the radish plants, the ones treated with UA were the heaviest (60.08 ± 15.29), and the control plants were the lightest (42.02 ± 28.69). The CJ, GR and AA treatments showed similar average values, with AA being slightly heavier.
When evaluating the weight of the aerial part, treatment AA had the highest values (19.52 ± 5.99), followed by treatment UA (19.15 ± 3.87), C (18.62 ± 17.02) and treatments CJ (17.02 ± 4.46) and GR (16.30 ± 5.31), which were lower than C. While the control had the highest number of leaves per plant (6.8 ± 1.19), the AA treatment had the lowest (5.7 ± 0.67), contrasting with the weight of the aerial part through a more robust aerial part and a more vigorous and denser stem (Figure 5). On average, regarding leaf evaluation, all the treatments had larger leaves (M) than the control (S) (Figure 1).
Regarding the weight of the root, an edible and valuable part of the radish, the results for weight as a function of diameter are in agreement with those obtained by Godlewska et al. [27]; all the treatments resulted in a higher weight compared to the control, with the UA extract showing the best results, with an average of 80% more weight compared to the control, while the CJ, GR and AA treatments showed an average of 41.72%, 42.72% and 48.26% greater weight, respectively, when compared to the control. In general, the foliar application of seaweed extracts led to a mitigation of the abiotic stress on the plants and better vegetative growth and, consequently, better and higher radish yields; this is in accordance with the work of Mahmoud et al. [28].
As for the nutritional properties of the radishes treated with different algae, they are shown in Table 6.
Table 6.
Moisture (%), crude protein (% dry matter), phosphorus (mg/100 g dm), phenolic compounds (PC) (mg eq. gallic acid/g fresh matter) and antioxidants (AO) (mg eq. ascorbic acid/ g fresh matter) of radish roots treated with C, UA, CJ, GR and AA; mean values ± standard deviation with n = 4 for moisture content tested by Tukey’s test (p < 0.05) and n = 2 for protein, phosphorus and AO tested by t-test (p < 0.05). Different letters indicate statistically significant differences.
As for moisture (%), the results were similar to those obtained by Ruzzi et al. [29]. Radishes treated with the GR extract and control stood out from the others (Table 6) and were significantly wetter than radishes from the AA treatment. Radishes treated with CJ (90.62 ± 0.26) and UA (90.56 ± 0.38) showed no significant differences with the others. The GR extract induced a higher % of protein in the radishes, and similarly to the water content of the radishes, only the GR treatment and the control produced significantly more protein than CJ. These quantities are in accordance with those obtained by Yousaf et al. [30] between 1.62% and 3.02% protein by dry matter in a study with application of nitrogen and magnesium fertilizer in radishes. There were no statistically significant differences in phosphorus (p < 0.05) production in radishes. The AA treatment had the highest phosphorus value (706.10 ± 63.83) compared to the other radishes subjected to the different treatments, while the control had the lowest values (363.39 ± 9.78), even lower than the 441 mg by 100 g dry matter mentioned by Godlewska et al. [27].
The extracts that led to a decrease in phenolic compounds (PC) in the radish leaves (Table 3) were the ones that showed the highest content of these compounds in the edible roots (Table 6), similar to what was reported by Godlewska et al. [27], where the application of some biological plant extracts to the leaves led to a decrease in total phenolic compounds in the leaves, but subsequently led to an increase in the radish roots. Plants treated with AA showed similar values to the control at root level regarding PC and AO. The GR treatment showed the highest values of PC (0.12121) and AO (0.0754 ± 0.0000), with all treatments except AA (0.0554 ± 0.0009) showing significant differences compared to the control. PC, C and AA yielded lower values than the ones described by Gamba et al. [31] (ranging between 0.061 to 0.146 mg GAE/g fm).
Based on the results obtained, all the extract treatments resulted in a notable stimulation of plant growth/yield, as well as improved nutritional properties. The UA extract stood out as the treatment that caused the greatest increase in plant weight. The GR extract, on the other hand, stood out in terms of nutritional quality, having promoted a higher % of crude protein as well as more phenolic compounds and antioxidants. The AA extract led to healthier aerial parts, with greater weight and more flavonoid content and an increase in phosphorus levels in the roots, although it showed similar values to the control in terms of phenolic compounds and antioxidants in the roots. As for the CJ extract, it showed promising results, and possible future approaches could involve merging it with another extract like UA and GR. We can conclude that the treatments contributed to mitigating abiotic stress (particularly water stress) results that are in line with the work of Rasul et al. [32], in which the application of an extract based on Ascophyllum nodosum led to the triggering of cellular mechanisms in Arabidopsis thaliana that contributed to its growth and tolerance to water stress, as well as reducing the production of reactive oxygen species (ROS). We can also conclude that the extracts promoted the absorption and assimilation of nutrients, in agreement with the study by Chami and Galli [33] where the application of seaweed-based extracts led to a reduction in total fertilization units by 13%, improving the harvest and increasing agronomic efficiency five- to nine-fold compared to the conventional nutrition program, thus playing a crucial role in achieving sustainable agriculture and increased resilience to climate change.
4. Conclusions
All the algae extracts showed interesting results, supporting the hypothesis that they can be the answer to a green and more sustainable agriculture using natural sustainable sources that do not negatively affect the environment and can be grown as a bioremediation and carbon capture agent. The present study showed that the extracts improved the development and growth of radishes, as well as improving the protection of plants against abiotic stress. The UA extract stood out as the treatment that caused the greatest increase in plant weight. Therefore, if the objective of a company or a farmer is to focus on maximizing the plant, fruit/root quality or weight for profitability, this option would be the best. On the other hand, if the objective is to produce crops with improved nutritional value, such as for personal consumption, the GR extract would be the optimal choice. When the objective is to mitigate stress, the AA extract was the most effective in overall stress reduction, leading to greater consistency in plant production. This is particularly important for large producers facing periods with significant environmental stresses.
Future studies may involve either evaluating the impact of extracts on different crops or developing new formulations involving different extraction methods, different seaweed concentrations or even the addition of another type of algae to enhance the biostimulant potential of the extracts. It would also be important to completely understand the complex network of mechanisms involved in both the biostimulant potential and the mechanisms behind the stimulation of plant defences, with the goal of developing new formulations in the future.
Author Contributions
Conceptualization, D.S., J.C., K.B. and L.P.; review methodology, D.S., J.C., K.B. and L.P.; validation, K.B. and L.P.; writing—original draft preparation, D.S.; writing—review and editing, D.S., J.C., K.B. and L.P.; supervision, K.B. and L.P. All authors have read and agreed to the published version of the manuscript.
Funding
This work was supported by FCT-Fundação para a Ciência e Tecnologia, I.P., in the framework of the Project UIDB/04004/2020 and DOI identifier 10.54499/UIDB/04004/2020 (https://doi.org/10.54499/UIDB/04004/2020, accessed on 1 January 2024).
Institutional Review Board Statement
Not applicable.
Informed Consent Statement
Not applicable.
Data Availability Statement
Data available from the authors.
Conflicts of Interest
The authors declare no conflicts of interest.
References
- López-Padrón, I.; Martínez-González, L.; Pérez-Domínguez, G.; Reyes-Guerrero, Y.; Núñez-Vázquez, M.; Cabrera-Rodríguez, J.A. Algae and their uses in agriculture. An update. Cultiv. Trop. 2020, 41, 20203479728. [Google Scholar]
- Kapoore, R.V.; Wood, E.E.; Llewellyn, C.A. Algae biostimulants: A critical look at microalgal biostimulants for sustainable agricultural practices. Biotechnol. Adv. 2021, 49, 107754. [Google Scholar] [CrossRef] [PubMed]
- Salavisa, I.; Soares, M.; Bizarro, S. A Critical Assessment of Organic Agriculture in Portugal: A Reflection on the Agro-Food System Transition; University Institute of Lisbon: Lisbon, Portugal, 2021. [Google Scholar] [CrossRef]
- Ammar, E.E.; Aioub, A.A.A.; Elesawy, A.E.; Karkour, A.M.; Mouhamed, M.S.; Amer, A.A.; EL-Shershaby, N.A. Algae as Bio-fertilizers: Between current situation and future prospective: The role of Algae as a Bio-fertilizer in serving of ecosystem. Saudi J. Biol. Sci. 2022, 29, 3083–3096. [Google Scholar] [CrossRef] [PubMed]
- Asimakis, E.; Shehata, A.A.; Eisenreich, W.; Acheuk, F.; Lasram, S.; Basiouni, S.; Emekci, M.; Ntougias, S.; Taner, G.; May-Simera, H.; et al. Algae and Their Metabolites as Potential Bio-Pesticides. Microorganisms 2022, 10, 307. [Google Scholar] [CrossRef] [PubMed]
- Song, X.; Bo, Y.; Feng, Y.; Tan, Y.; Zhou, C.; Yan, X.; Ruan, R.; Xu, Q.; Cheng, P. Potential applications for multifunctional microalgae in soil improvement. Front. Environ. Sci. 2022, 10, 1035332. [Google Scholar] [CrossRef]
- Sharma, H.S.; Fleming, C.; Selby, C.; Rao, J.R.; Martin, T. Plant biostimulants: A review on the processing of macroalgae and use of extracts for crop management to reduce abiotic and biotic stresses. J. Appl. Phycol. 2014, 26, 465–490. [Google Scholar] [CrossRef]
- Hamed, S.M.; Abd El-Rhman, A.A.; Abdel-Raouf, N.; Ibraheem, I.B.M. Role of marine macroalgae in plant protection & improvement for sustainable agriculture technology. Beni-Suef Univ. J. Basic Appl. Sci. 2018, 7, 104–110. [Google Scholar] [CrossRef]
- Leogrande, R.; El Chami, D.; Fumarola, G.; Di Carolo, M.; Piegari, G.; Elefante, M.; Perrelli, D.; Dongiovanni, C. Biostimulants for Resilient Agriculture: A Preliminary Assessment in Italy. Sustainability 2022, 14, 6816. [Google Scholar] [CrossRef]
- Lee, R.E. Phycology, 5th ed.; Cambridge University Press: Cambridge, UK, 2018. [Google Scholar] [CrossRef]
- Ali, O.; Ramsubhag, A.; Jayaraman, J. Biostimulant Properties of Seaweed Extracts in Plants: Implications towards Sustainable Crop Production. Plants 2021, 10, 531. [Google Scholar] [CrossRef]
- Muñoz-Miranda, L.A.; Iñiguez-Moreno, M. An extensive review of marine pigments: Sources, biotechnological applications, and sustainability. Aquat. Sci. 2023, 85, 68. [Google Scholar] [CrossRef]
- Sousa, T.; Cotas, J.; Bahcevandziev, K.; Pereira, L. Effects of “sargaço” extraction residues on seed germination. Millenium—J. Educ. Technol. Health 2020, 2, 29–37. [Google Scholar] [CrossRef]
- American Public Health Association. Standard Methods for the Examination of Water and Wastewater, 20th ed.; American Public Health Association, American Water Works Association and Water Environmental Federation: Washington, DC, USA, 1998. [Google Scholar]
- Singleton, V.L.; Rossi, J.A. Colorimetry of Total Phenolics with Phosphomolybdic-Phosphotungstic Acid Reagents. Am. J. Enol. Vitic. 1965, 16, 144. [Google Scholar] [CrossRef]
- Gião, M.S.; González-Sanjosé, M.L.; Rivero-Pérez, M.D.; Pereira, C.I.; Pintado, M.E.; Malcata, F.X. Infusions of Portuguese medicinal plants: Dependence of final antioxidant capacity and phenol content on extraction features. J. Sci. Food Agric. 2007, 87, 2638–2647. [Google Scholar] [CrossRef]
- Rayorath, P.; Jithesh, M.N.; Farid, A.; Khan, W.; Palanisamy, R.; Hankins, S.D.; Critchley, A.T.; Prithiviraj, B. Rapid bioassays to evaluate the plant growth promoting activity of Ascophyllum nodosum (L.) Le Jol. using a model plant, Arabidopsis thaliana (L.) Heynh. J. Appl. Phycol. 2008, 20, 423–429. [Google Scholar] [CrossRef]
- Seng, M.; Cheong, E.J. Comparative study of various pretreatment on seed germination of Dalbergia cochinchinensis. For. Sci. Technol. 2020, 16, 68–74. [Google Scholar] [CrossRef]
- Ammaturo, C.; Pacheco, D.; Cotas, J.; Formisano, L.; Ciriello, M.; Pereira, L.; Bahcevandziev, K. Use of Chlorella vulgaris and Ulva lactuca as Biostimulant on Lettuce. Appl. Sci. 2023, 13, 9046. [Google Scholar] [CrossRef]
- Hernández-Herrera, R.M.; Santacruz-Ruvalcaba, F.; Ruiz-López, M.A.; Norrie, J.; Hernández-Carmona, G. Effect of liquid seaweed extracts on growth of tomato seedlings (Solanum lycopersicum L.). J. Appl. Phycol. 2014, 26, 619–628. [Google Scholar] [CrossRef]
- AlgaEnergy. Ficha Técnica AgriAlgae Foliar. Prodelesa. 2021. Available online: https://www.prodelesa.com/wp-content/uploads/2021/05/Fichas-tecnicas-2021_Fol.pdf (accessed on 23 December 2023).
- Zheng, H.; Zhao, Y.; Guo, L. A Bioactive Substance Derived from Brown Seaweeds: Phlorotannins. Mar. Drugs 2022, 20, 742. [Google Scholar] [CrossRef]
- Ertani, A.; Francioso, O.; Tinti, A.; Schiavon, M.; Pizzeghello, D.; Nardi, S. Evaluation of seaweed extracts from laminaria and Ascophyllum nodosum spp. As biostimulants in Zea mays L. using a combination of chemical, biochemical and morphological approaches. Front. Plant Sci. 2018, 9, 361254. [Google Scholar] [CrossRef]
- Castro, P.S.d.S. Estudos em Biomassa de Macroalgas Recorrendo a Tecnologias de Extração Verdes. Master’s Thesis, Instituto Superior de Engenharia de Lisboa, Lisbon, Portugal, 2019. Available online: http://hdl.handle.net/10400.21/13327 (accessed on 13 December 2023).
- Munteanu, I.G.; Apetrei, C. Analytical methods used in determining antioxidant activity: A review. Int. J. Mol. Sci. 2021, 22, 3380. [Google Scholar] [CrossRef]
- Turk, M.; Eser, O. Effects of salt stress on germination of some silage maize (Zea mays L.) cultivars. Sci. Pap.-Ser. A Agron. 2016, 59, 466–469. [Google Scholar]
- Godlewska, K.; Pacyga, P.; Michalak, I.; Biesiada, A.; Szumny, A.; Pachura, N.; Piszcz, U. Systematic Investigation of the Effects of Seven Plant Extracts on the Physiological Parameters, Yield, and Nutritional Quality of Radish (Raphanus sativus var. sativus). Front. Plant Sci. 2021, 12, 651152. [Google Scholar] [CrossRef]
- Mahmoud, S.H.; Salama, D.M.; El-Tanahy, A.M.M.; Abd El-Samad, E.H. Utilization of seaweed (Sargassum vulgare) extract to enhance growth, yield and nutritional quality of red radish plants. Ann. Agric. Sci. 2019, 64, 167–175. [Google Scholar] [CrossRef]
- Ruzzi, M.; Giordano, M.; Ii, F.; El-Sayed, I.; Desoky, M.; Rehim, A.; Geng, Y. Biostimulants induce positive changes in the radish morpho-physiology and yield. Front. Plant Sci. 2022, 13, 950393. [Google Scholar]
- Yousaf, M.; Bashir, S.; Raza, H.; Shah, A.N.; Iqbal, J.; Arif, M.; Bukhari, M.A.; Muhammad, S.; Hashim, S.; Alkahtani, J.; et al. Role of nitrogen and magnesium for growth, yield and nutritional quality of radish. Saudi J. Biol. Sci. 2021, 28, 3021–3030. [Google Scholar] [CrossRef] [PubMed]
- Gamba, M.; Asllanaj, E.; Raguindin, P.F.; Glisic, M.; Franco, O.H.; Minder, B.; Bussler, W.; Metzger, B.; Kern, H.; Muka, T. Nutritional and phytochemical characterization of radish (Raphanus sativus): A systematic review. Trends Food Sci. Technol. 2021, 113, 205–218. [Google Scholar] [CrossRef]
- Rasul, F.; Gupta, S.; Olas, J.J.; Gechev, T.; Sujeeth, N.; Mueller-Roeber, B. Priming with a Seaweed Extract Strongly Improves Drought Tolerance in Arabidopsis. Int. J. Mol. Sci. 2021, 22, 1469. [Google Scholar] [CrossRef]
- Chami, D.E.; Galli, F. An Assessment of Seaweed Extracts: Innovation for Sustainable Agriculture. Agronomy 2020, 10, 1433. [Google Scholar] [CrossRef]


Disclaimer/Publisher’s Note: The statements, opinions and data contained in all publications are solely those of the individual author(s) and contributor(s) and not of MDPI and/or the editor(s). MDPI and/or the editor(s) disclaim responsibility for any injury to people or property resulting from any ideas, methods, instructions or products referred to in the content. |
© 2024 by the authors. Licensee MDPI, Basel, Switzerland. This article is an open access article distributed under the terms and conditions of the Creative Commons Attribution (CC BY) license (https://creativecommons.org/licenses/by/4.0/).