Abstract
Due to the rapid expansion of tourism, mining, and manufacturing, the economy of Hainan Island in southern China has experienced swift growth. However, it also brings the risk of soil pollution by mercury (Hg) as a result of increased traffic and mineral processing activities. In order to investigate the characteristics of soil Hg pollution in Hainan Island and assess the health risk, a total of 239 samples were gathered from five representative regions across the island. The findings indicate considerable fluctuations in the soil Hg concentration across the five sub-study areas, which are influenced by factors such as wind direction, mining activities, and economic development. Changjiang Li Autonomous County, situated in the downwind direction (NW) and rich in mineral resources, shows the highest soil Hg concentration (10.00–1582.50 ng·g−1). Following closely are Haikou and Sanya, the two most economically developed cities on the island, with soil Hg concentrations of 8.33–321.50 ng·g−1 and 6.04–180.50 ng·g−1, respectively. Wuzhishan Nature Reserve and Lingshui Li Autonomous County, located in the upwind area (SE), show the lowest concentrations, ranging between 10.70–104.67 ng·g−1 and 9.43–84.00 ng·g−1, respectively. Both the Single Pollution Index method and the Geo-accumulation Index method were employed to assess the level of Hg pollution. The results indicate that nearly half of the sampling sites are contaminated, in which the proportion of contaminated sites in Sanya and Haikou are the highest, but the level of contamination is low; the heavily contaminated sites are predominantly found in Changjiang Li Autonomous County. However, the low Health Risk Index (HI) ranging from 0.0001 to 0.0334 suggests that although the soil is contaminated with Hg, it does not pose a substantial non-carcinogenic risk to human health.
1. Introduction
Hg is a highly toxic pollutant [1,2,3,4]. Its toxicity is well known in Minamata disease, which took place in 1956, Japan, standing as the most famous environmental hazard incident resulted from Hg pollution [5]. Since then, numerous incidents of Hg pollution have been documented globally [6,7], prompting more attention to be paid to Hg pollution. Due to its distinctive physiochemical properties, Hg can easily amass in living organisms, posing a lethal threat to humans [8,9]; hence, it has been designated as a global pollutant by the United Nations Environment Program. The atmosphere serves as the primary medium for Hg migration in nature. Gaseous Hg is prevalent in the atmosphere with a low dry deposition rate, high solubility in water, and relatively prolonged residence time of 0.5 to 1.5 years, facilitating its long-range transport through the atmosphere [10]. Soil is the largest reservoir of Hg in the terrestrial ecosystem. It is revealed that dry deposition of gaseous element Hg in the atmosphere is the primary source of soil Hg, while human activities may also make significant contributions [11,12,13], and both may result in soil pollution. As soil Hg pollution is characterized by latency, persistence, high toxicity, and irreversibility [14], it poses a threat to the public health, especially in urban areas, highlighting the importance of a comprehensive assessment of Hg pollution status and the health risk of urban soil.
Hg naturally occurring in the Earth’s crust can be transported to surface soil through natural processes (rock weathering and erosion) and human activities by assorted pathways [15,16,17,18,19], such as the combustion of fossil fuels, non-ferrous metal smelting, Hg product generation, and waste disposal and incineration, resulting in the release of Hg into the environment [17,19,20,21,22]. It is indicated that the annual amount of anthropogenic emissions into the atmosphere is approximately 1960 t [16,23]. Recent studies have identified that anthropogenic emissions have exceeded natural emissions, with the majority of Hg re-emissions originating from anthropogenic sources [24]. As the largest coal consumer and Hg emitter in the world, coal consumption dominates China’s atmospheric Hg emissions [25,26].
Numerous studies have been conducted in order to investigate the status of Hg pollution in the atmosphere in large cities, e.g., Chongqing [27], Guangzhou [14], Nanjing [28], Xuzhou [29], Guilin [30], Beijing [31], and Taiyuan [32], or Hg pollution in the soil, such as Tibet [33] and Urumqi [34] in China; Palermo, Italy [35]; Glasgow, UK [21]; Khabarovsk, Russia [36]; Aveiro, Portugal [21]; and Lake Baikal, Russia [37,38]. The results indicate varying degrees of Hg pollution in these cities, with a positive correlation between the level of urban development and the extent of pollution [39] from mining, industry, and residences, etc. [40]. However, in the assessment of Hg health risk, soil Hg and atmospheric Hg are usually evaluated separately [41,42,43], or the concentration of atmospheric Hg is determined by regional monitoring [44,45], and thus measurements are not comprehensive or precise enough.
Hainan Island, situated in southern China, has experienced substantial economic growth in recent years, emerging as a burgeoning urban agglomeration primarily focused on tourism and external trade. However, this rapid economic development has also posed significant environmental challenges. This study aims to investigate the present Hg pollution status in the Island by examining five representative regions on the island, analyzing the factors contributing to Hg pollution, and assessing its associated health risks, taking both soil Hg and atmospheric Hg into consideration. The atmospheric Hg at 100 cm above the ground was measured where the soil Hg was sampled, and in light of this height was more reasonable for the inhaling pathway in the health risk assessment as it is an improvement on the traditional assessment. Moreover, findings on the Hg pollution status and its influencing factors will furnish valuable insights for the control of local Hg pollution.
2. Study Area
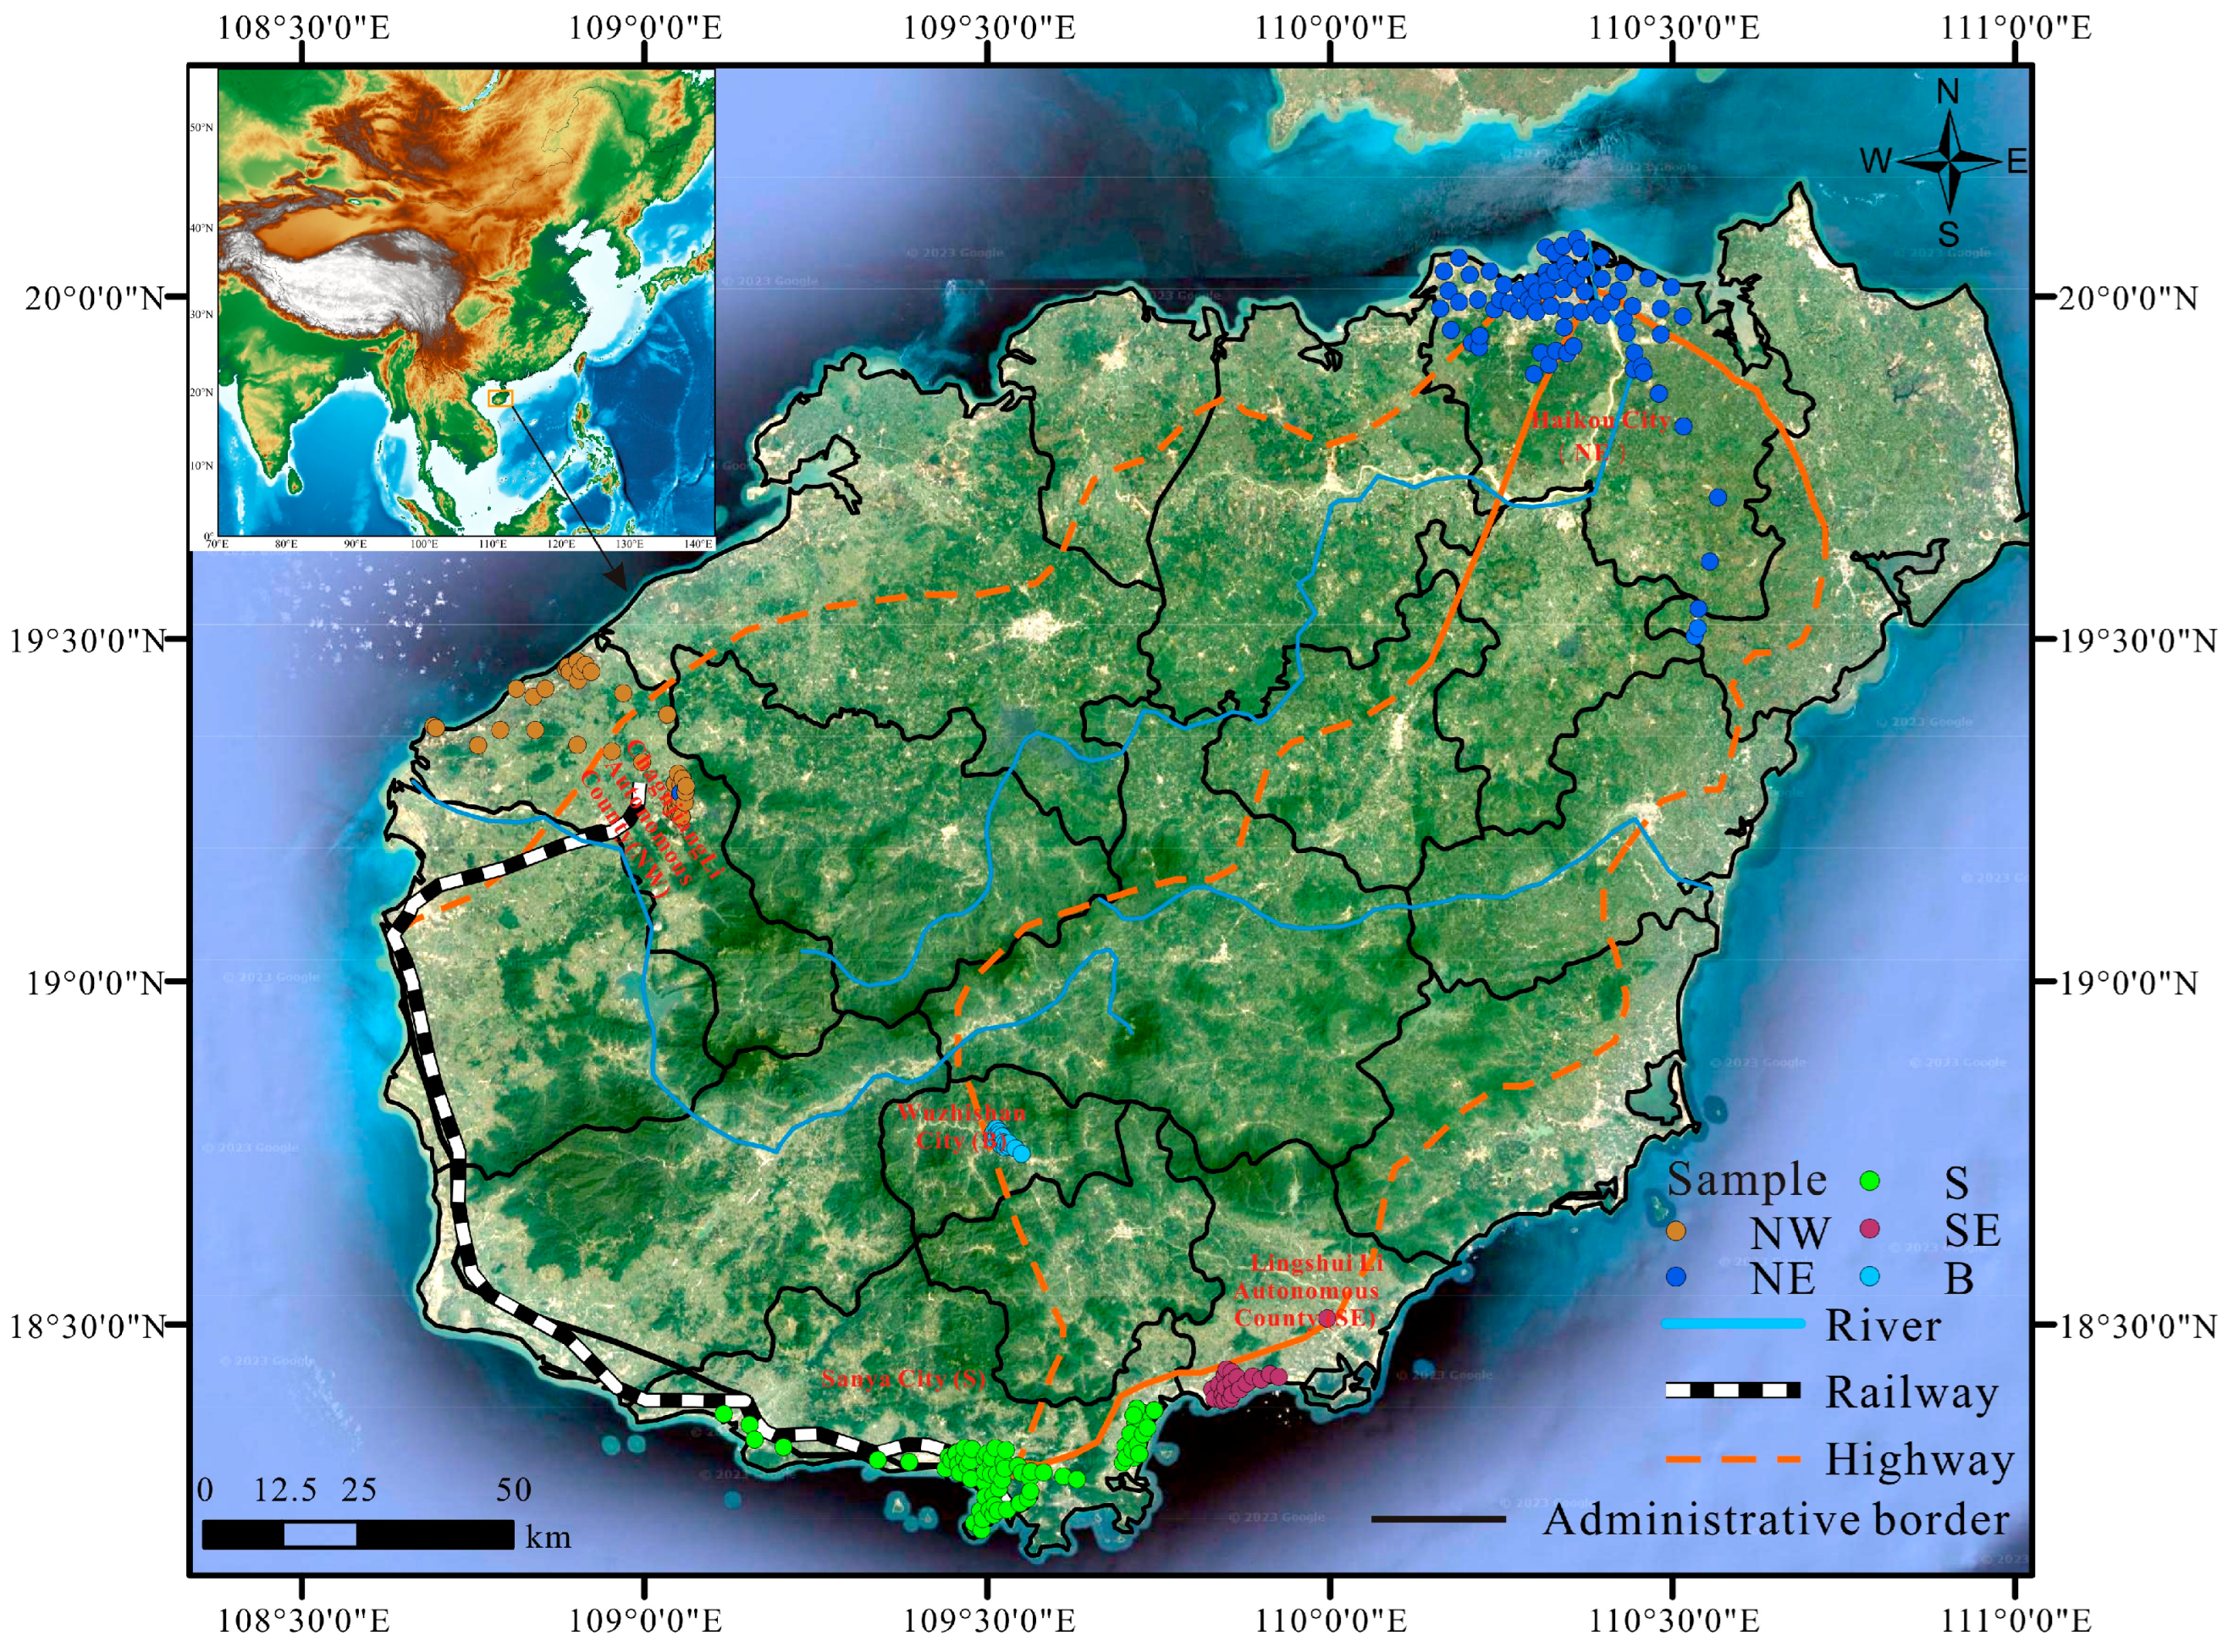
The study focused on Hainan Island as the research area, and we collected samples from five representative regions, including Wuzhishan Nature Reserve (B), as well as four economically developed coastal cities, i.e., Changjiang Li Autonomous County (NW), Haikou (NE), Lingshui Li Autonomous County (SE), and Sanya (S), which are located in the northwest, northeast, southeast, and south of the island, respectively (Figure 1). Wuzhishan Nature Reserve, situated in the center of the island, is a forest ecosystem nature reserve primarily driven by tourism; Changjiang Li Autonomous County is abundant in diverse mineral resources, such as iron, copper, cobalt, lead, gold, etc.; Haikou and Sanya, the two largest cities on the island, are characterized by flourishing industry, commerce, and high population density; and Lingshui Li Autonomous County is predominantly reliant on tourism.
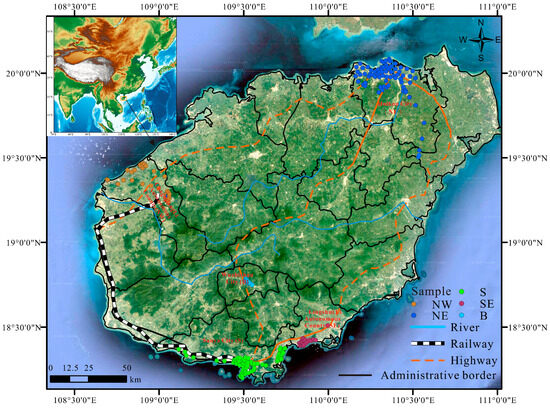
Figure 1.
Location of the study area and the five sub-study areas.
3. Materials and Methods
3.1. Sampling and Analysis
3.1.1. Sampling and Analysis of Soil Hg
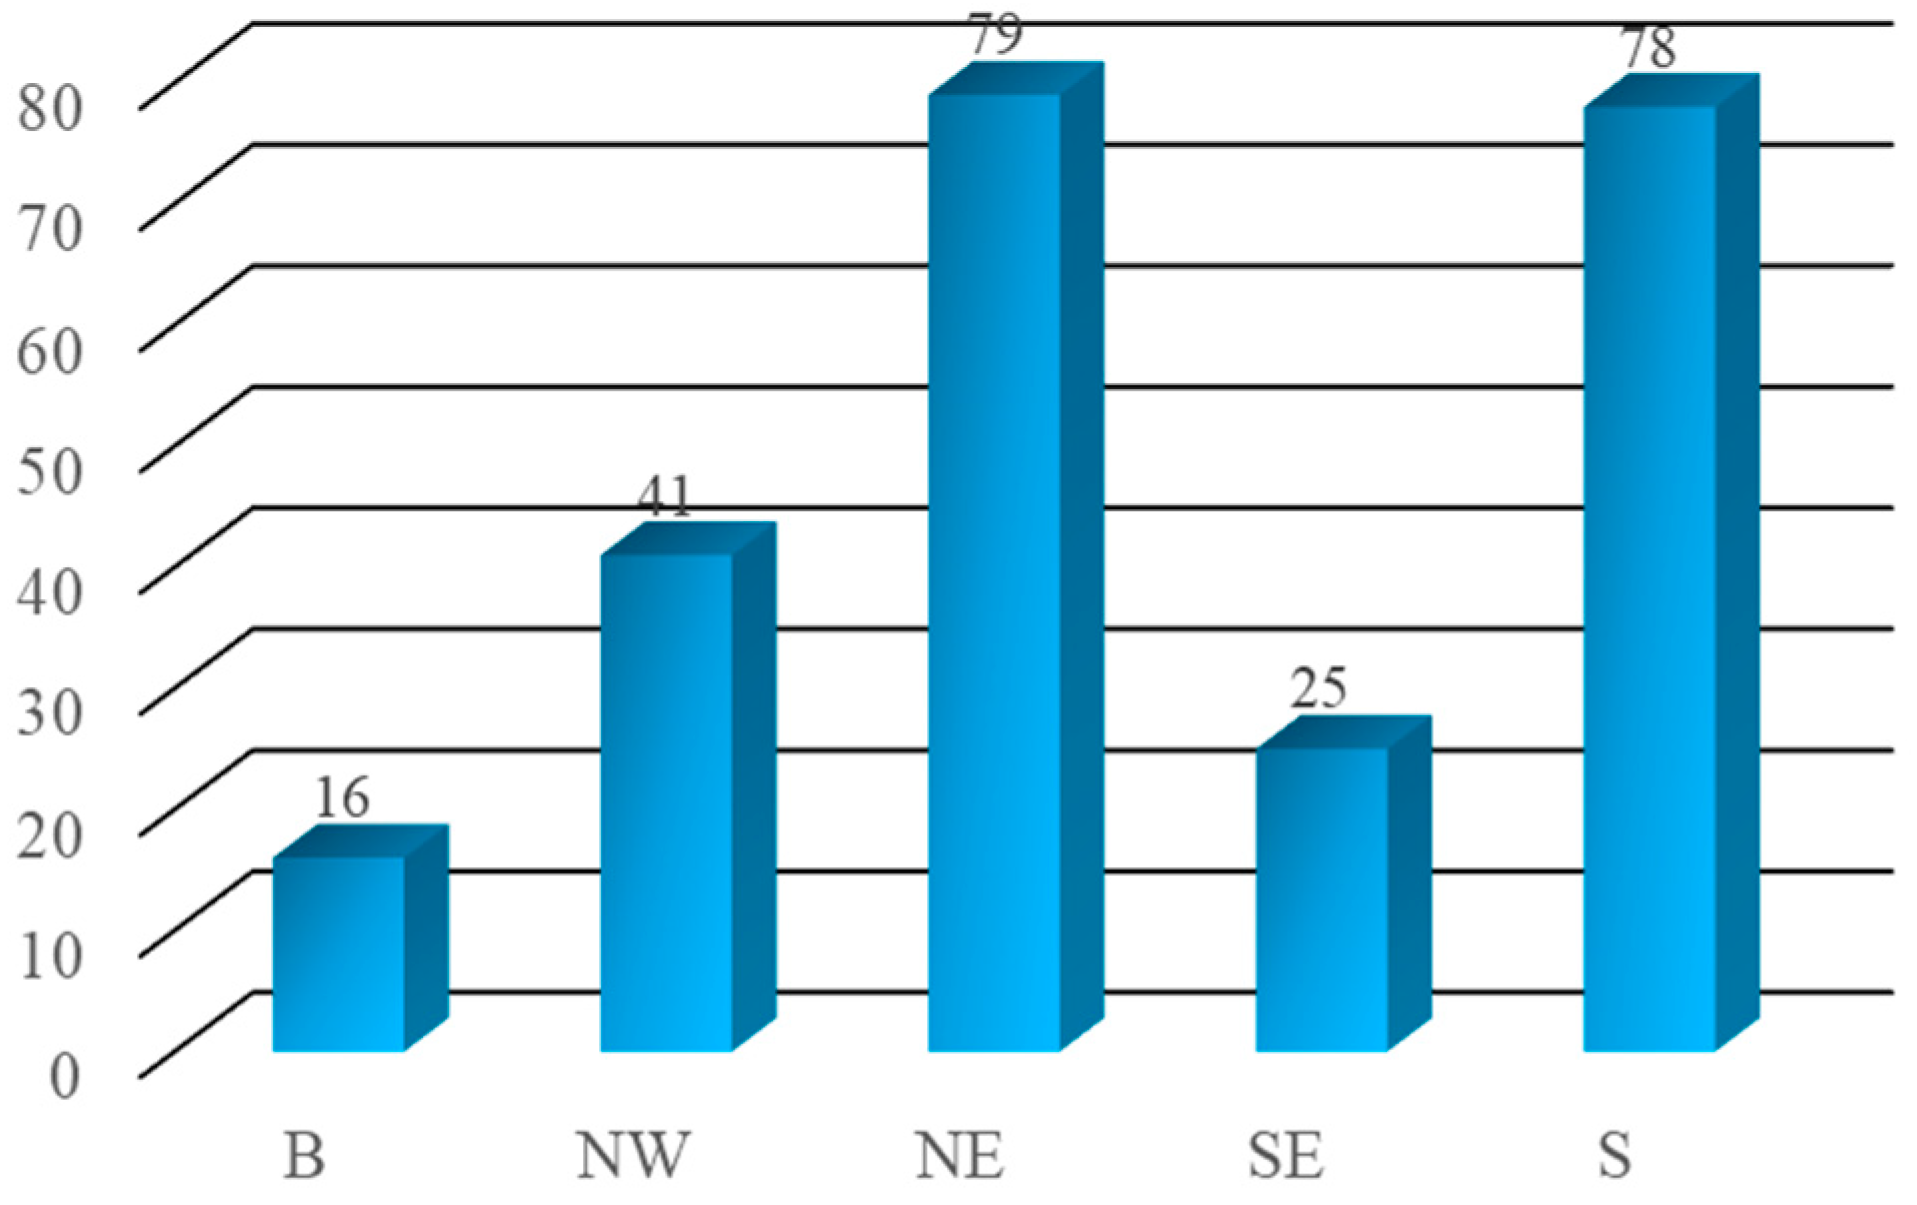
Soli samples were collected along the primary roads in the aforementioned five sub-study areas (Figure 1). A total of 239 samples were collected (Figure 2). Most of the sampling sites were assigned to Haikou (NE) and Sanya (S), the two most developed cities, with nearly 80 each, accounting for approximately 33% of the total sampling sites. The Changjiang Li Autonomous County (NW) and Lingshui Li Autonomous County (SE) followed with 41 and 25 sampling sites, respectively, while only 16 sampling sites were selected in the Wuzhishan Nature Reserve (B).
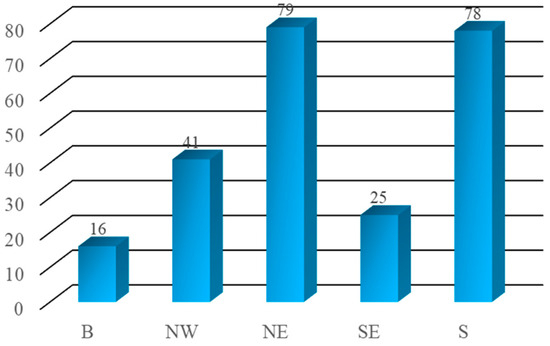
Figure 2.
Number of sampling sites in each sub-study area.
The soil samples were collected 10 cm bellow the ground surface. Once collected, they were protected from light, air-dried, and sieved through an 80-mesh nylon screen. The resulting soil samples were then securely bagged. Quality control was maintained by using standard GSS-5 material. The total mercury content in the soil was analyzed by utilizing the LUMEX Zeeman RA-915+ in combination with a UMA solid–liquid measurement module, with a detection limit of 5 ng·g−1. Each sample underwent five parallel measurements to ensure accuracy.
3.1.2. Determination of Total Atmospheric Hg
At each soil sampling site, the total gaseous Hg in the atmosphere was also measured by using the Hg Analyzer RA-915M. During air sampling, all of the sampling sites were vertically categorized into two layers, i.e., at ground surface and 100 cm above the ground. The detection limit of atmospheric Hg was 2 ng/m3. Given that the limit of Hg emission in the atmosphere is 0.1 mg/m3 [46], the detection limit is acceptable. Each sampling site underwent 6 min of monitoring, meaning that each layer at the sampling site was continuously monitored for 30 s at a rate of one reading every 10 s. The monitoring cycle was repeated 6 times, resulting in 18 parallel datapoints for each layer at each sampling site.
3.2. Methodology
3.2.1. Evaluation of Soil Hg Pollution
The Single Pollution Index method and the Geo-accumulation Index Method are frequently employed to assess soil pollution levels. These methods allow for the categorization of soil Hg pollution into distinct levels [47].
The Single Pollution Index of soil Hg is calculated as follows:
where Pi is Single Pollution Index of soil Hg; Ci is the measured concentration of Hg (mg·kg−1); and Si is the evaluation standard of Hg (mg·kg−1). Here, the average concentration of soil Hg in Wuzhishan Nature Reserve was selected as the evaluation standard since the influence of human activities is ignorable.
In contrast to the Single Pollution Index, which only yields preliminary concentration evaluation results, the Geo-accumulation Index Method [48] can not only capture the natural variation characteristics of Hg distribution, but also identify the influence of human activities on the environment. The formula is as follows:
where Igeo is the Geo-accumulation Index, Ci is the measured concentration of Hg (mg·kg−1); k is the correction index taken into consider the changes in the background value that may be caused by differences in rocks in various places, and the value of 1.5 is used when the soil is unpolluted to moderately polluted [48]; Bi is the soil background value. In this study, the average concentration of soil Hg in Wuzhishan Nature Reserve was selected.
3.2.2. Health Risk Assessment of Soil Hg
It is widely accepted that soil Hg primarily enters the human body via three principal pathways: (i) dermal contact and subsequent ingestion, (ii) direct oral ingestion, and (iii) inhalation of airborne particulate matter. However, researches have also suggested that Hg can be assimilated into the body in the vapor form [49], thus there are four main exposure pathways in actuality.
Drawing upon the Environmental Site Assessment Guideline issued by the Beijing Municipal Bureau of Quality and Technical Supervision [50] and the environmental health risk assessment methodologies advocated by the United States Environmental Protection Agency [51], the risk models for various exposure pathways are proposed as follows.
The pathway of direct human skin contact is as follows:
where EDI is the chronic daily exposure, mg·(kg·d)−1; C is the measured concentration, mg·kg−1; SA is the skin area in contact with soil, cm2·d−1, the reference value is 5000 cm2·d−1 [52]; AF is the adsorption coefficient of skin to soil, mg·cm−2, and the reference value is 1 mg·cm−2 [53]; ABS is the skin respiration rate, the reference value is 0.001 [52]; EF is the exposure frequency, d·a−1, and the reference value is 350 d·a−1 [53]; ED is the exposure period, a, and the reference value is 25 a; BW is body weight, kg, and the reference value is 55.9 kg [52]’ and AT is the exposure period, d, and the reference value is 365 × ED (d) [52].
The pathway of direct oral ingestion:
where EDI, C, EF, ED, BW, and AT all refer to Formula (3). IFP is soil intake, mg·d−1, and the reference value is 114 mg·d−1 [53].
The pathway of ingestion via breathing is as follows:
where EDI, C, EF, ED, BW and AT all refer to Formula (3). IR is air intake, m3·d−1, the reference value is 20 m3·d−1 [53], and PEF is the soil dust generation factor, the reference value is 1.32 × 10⁹ [54]
The pathway of Hg vapor inhalation is as follows:
where EDI, C, EF, ED, BW, and AT all refer to Formula (3). IR refers to Equation (5), and VF is the evaporation coefficient, m3·kg−1, and the reference value is 32,657.6 m3·kg−1 [49].
Health risk assessment is usually divided into carcinogenic risk assessment and non-carcinogenic risk assessment. For Hg, non-carcinogenic risk assessment is generally conducted and evaluated by using the hazard quotient HQ:
where EDIi is the chronic daily exposure, mg·(kg·d)−1; RfDi is the reference dose for risk assessment of various pathways, mg·(kg·d)−1; RfDskin = 2.4 × 10⁻⁵ mg·(kg·d)−1 [50]; RfDoral = 3.0 × 10⁻⁴ mg·(kg·d)−1 [50]; RfDbreath = 1.07 × 10⁻⁴ mg·(kg·d)−1 [50]; and RfDvapor = 1 × 10⁻³ mg·(kg·d)−1 [49].
The total non-carcinogenic risk value of Hg in different pathways is expressed as HI, described as follows:
when HI or HQ > 1, it is considered that there is a potential non-carcinogenic risk; when HI or HQ < 1, the risk is considered to be small or negligible.
Based on health risk assessment Formulas (3)–(8), exposure calculation parameters, and site data, the possible non-carcinogenic exposure risk to the local adult human body was calculated.
4. Results and Discussion
4.1. Factors Affecting Soil Hg Levels
4.1.1. Distribution Characteristics of Soil Hg Levels
Table 1 presents the range and mean values of Hg concentrations in soil samples collected from the five sub-study areas. It indicates that in Hainan Island, the soil Hg concentration showed a large variation from 6.04 to 1582.50 ng·g−1, with an average of 61.51 ng·g−1 and a standard deviation of 147.41. The Wuzhishan Nature Reserve (B), characterized by a lower pollution potential, had an average soil Hg concentration of 32.67 ng·g−1, which was adopted as the background for Hainan Island. Except for Lingshui Li Autonomous County (SE), the coastal cities, including Changjiang Li Autonomous County (NW), Haikou (NE), and Sanya (S), all showed varying degrees of Hg contamination. Notably, Changjiang Li Autonomous County (NW) had the highest average concentration, approximately 4.5 times that of the background, and its maximum concentration exceeded the background by 48.4 times, while Haikou and Sanya showed slightly elevated Hg levels compared to the background, with averages that were approximately 1.6- and 1.2-times higher, respectively.

Table 1.
Average and range of soil Hg concentrations in the five sub-study areas (ng·g−1).
Figure 3a–e illustrates the soil Hg concentration at each sampling site. Specifically, the soil Hg concentrations in Wuzhishan Nature Reserve (B) and Lingshui Li Autonomous County (SE) were generally lower compared to the other three areas (Figure 3d,e). On the contrary, Changjiang Li Autonomous County (NW) exhibited the highest concentration among the five sub-study areas, showing a distinct pattern of high levels inland and low levels along the coast (Figure 3a). This phenomenon can be attributed to the presence of numerous mines inland, with abundant Hg accompanying reserves of iron, copper, cobalt, lead, gold, and other mineral resources [55], since Hg may be transported into the soil during ore weathering or mineral separation. In contrast, Sanya (S) and Haikou (NE) displayed another distribution pattern, with higher soil Hg concentration along the coast and lower levels inland (Figure 3b,c). This difference may be ascribed to the more developed economy and higher traffic density in the coastal areas where Hg-bearing car exhaust emissions settle into the soil.
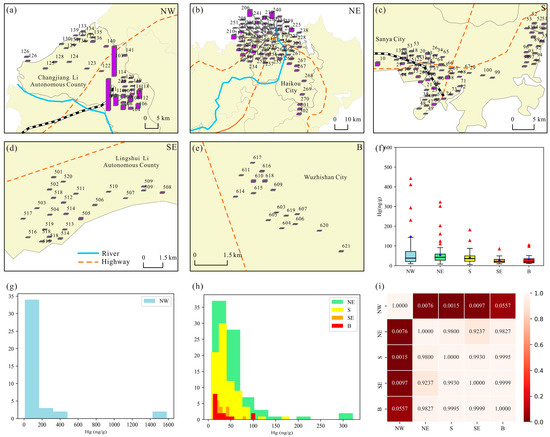
Figure 3.
Characteristics of soil Hg concentrations in the five sub-study areas. (a–e) Distribution of soil Hg concentration. (f) Box plot of soil Hg concentration, the red triangles denotes outliers. (g,h) Frequency histogram of soil Hg concentration. (i) ANOVA results of soil Hg concentration of the five sub-study areas.
4.1.2. Impact of Wind Direction on Soil Hg
To investigate the influence of wind direction on soil Hg concentration in the island, box plots and variance analysis were applied for the analysis. As illustrated in Figure 3f, the soil Hg concentration exhibited directional variations, with the highest concentration observed in the northwest. Consequently, a one-way analysis of variance (ANOVA) was conducted. The results revealed a significant difference in Hg distribution among the five sub-study areas (F = 4.63, p = 0.001). Further pairwise comparisons indicated that the Hg concentration in the northwest direction was significantly distinct from that in the other directions, with p values less than 0.05. However, no significant differences were found among the Hg concentrations in the remaining three directions, as all p exceeded 0.9 and were substantially greater than 0.05 (Figure 2i).
The spatial distribution of soil Hg pollution on the island exhibits a strong correlation with wind direction. The island has a tropical monsoon climate characterized by predominant southeasterly winds. Consequently, the polluted atmosphere is transported north-westward, leading to the deposition of atmospheric Hg onto the corresponding soil surfaces via precipitation. Water-soluble Hg accumulated on the soil surface is subsequently leached by rain, resulting in the transportation of water-soluble Hg to the surface. This process causes runoff loss or soil infiltration [56], resulting in significantly higher Hg concentrations in the downwind surface soil compared to the upwind surface soil. Therefore, the Hg concentration in the surface soil gradually increases from the southeast to the northwest.
In addition to meteorological conditions (predominantly wind direction), other factors that may influence soil Hg concentration include terrain fluctuations in the surrounding environment, the physical and chemical properties of the soil, and human activities [32]. Hg sources in the surrounding environment comprise atmospheric deposition, surface runoff, and precipitation. Atmospheric Hg can infiltrate the soil via precipitation or in its gaseous form. Additionally, Hg in water bodies can seep into the soil. Consequently, the Hg concentration in the surrounding environment directly influences soil Hg levels. The physiochemical properties of the soil significantly influence Hg distribution and transformation within it, e.g., soil properties such as organic matter content, pH, and clay content impact Hg adsorption and migration, consequently influencing its distribution in the soil. Human activities constitute a primary factor in elevated soil Hg concentrations. Instances include industrial emissions, coal burning, mining activities, waste disposal, and agricultural use of fertilizers and pesticides, all of which can raise Hg levels in the soil. Furthermore, human activities can lead to direct or indirect Hg input into the soil through waste and contaminated water.
4.1.3. Relationship between Soil Hg and Atmospheric Hg
Hg is a volatile metal that can evaporate into the atmosphere from soil, water, and other surfaces, particularly at elevated temperatures, constituting a continual source of atmospheric emissions. Furthermore, human activities can lead to significant releases of Hg into the atmosphere. Industrial production, coal burning, and waste incineration all serve as notable sources. Additionally, upon entering the atmosphere, Hg undergoes chemical reactions to produce compounds like mercury oxide (HgO) or methylmercury (CH3Hg), thus increasing its persistence in the atmosphere. Once in the atmosphere, Hg can be transported over long distances by atmospheric winds, leading to the distribution of Hg pollution in the region according to wind direction. As a result, investigating the correlation between soil Hg and atmospheric Hg concentrations can help to distinguish whether the distribution of soil Hg concentration is solely influenced by wind direction.
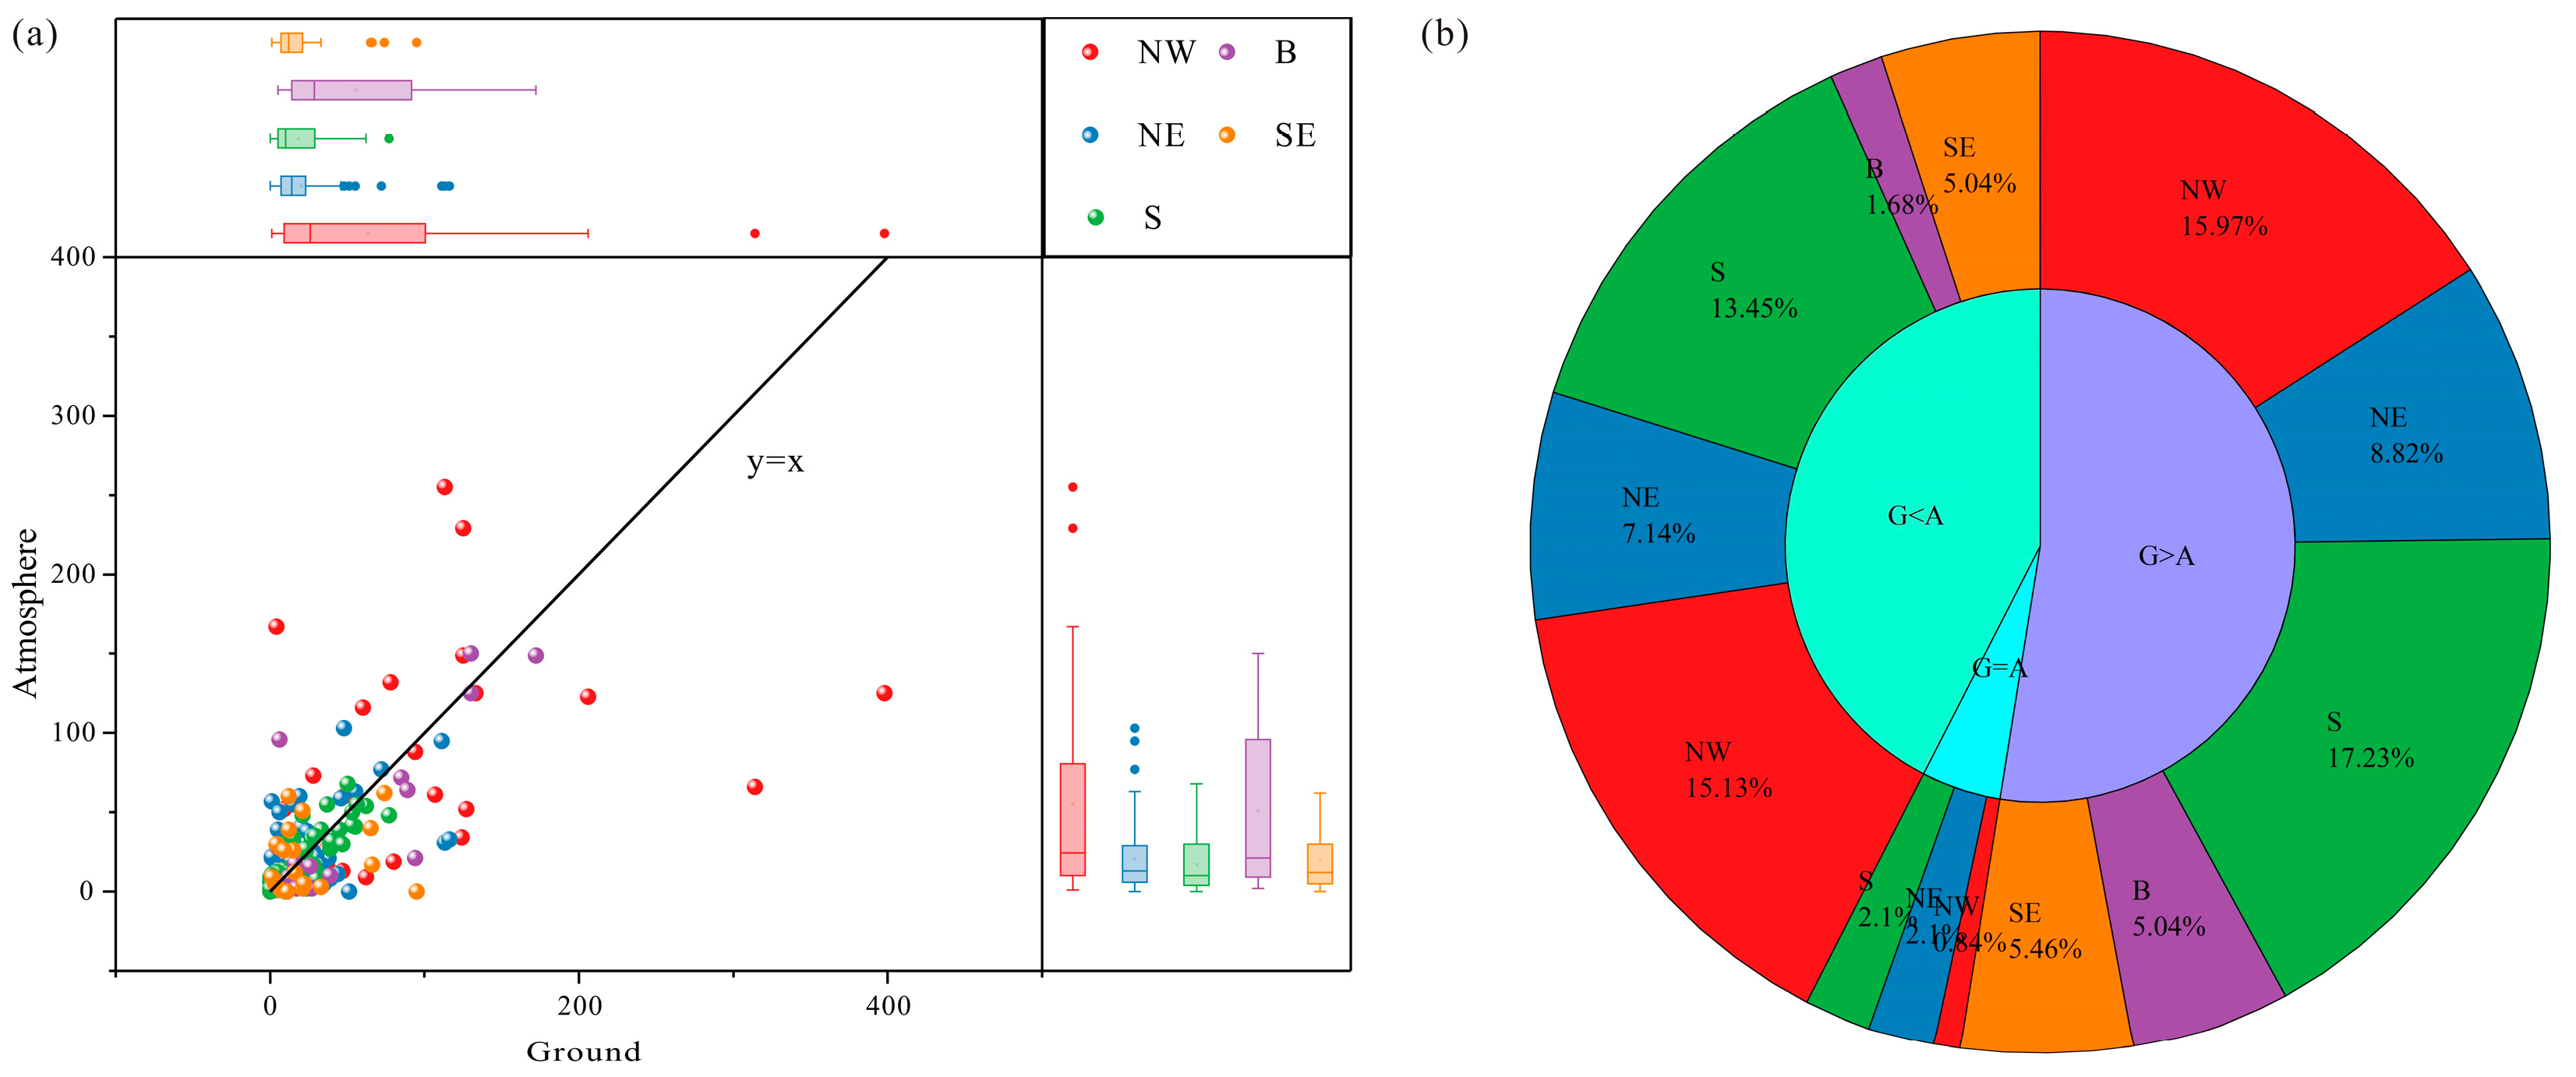
Figure 4 presents a comparative analysis of the atmospheric Hg concentration at the ground surface (Ground) and 100 cm above the ground (Atmosphere). The majority of the sampling sites (95%) exhibit significant variations in Hg concentrations between the two layers (Figure 4a). Notably, 101 sites (42%) show lower atmospheric Hg concentrations at the ground surface compared to 100 cm above the ground (Figure 4b). This phenomenon can be attributed to secondary dust, as these sampling sites are situated on streets with relatively heavy traffic flow. Consequently, the prevalence of secondary dust leads to elevated atmospheric Hg concentrations at 100 cm above the ground compared to the ground surface. Furthermore, the results of a Pearson correlation analysis reveal statistically significant positive correlations (R2 > 0.7, p < 0.05) between the Hg concentrations in the two layers in all the five sub-study areas (Table 2).
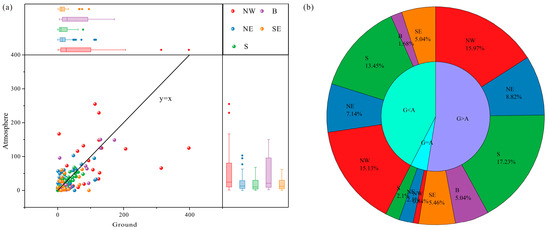
Figure 4.
(a) Comparison of atmospheric Hg concentration at the ground surface (G) and at 100 cm above the ground (A) (ng·m−3), and (b) the proportion of each area.
Table 2.
Pearson correlation coefficient of atmospheric Hg concentration at the ground surface (G) and 100 cm above the ground (A).
Concurrently, 125 sites (53%) exhibited higher atmospheric Hg concentrations at the ground surface compared to 100 cm above the ground. This phenomenon is associated with the natural deposition of dust from the atmosphere. The correlation analysis revealed a significant positive correlation between atmospheric and soil Hg concentrations (R2 = 0.789, p = 1.314 × 10⁻²⁷) (Table 3). Previous research has suggested a strong positive correlation between atmospheric and soil Hg concentrations [56], indicating that higher atmospheric Hg concentrations correspond to elevated soil Hg concentration. However, our correlation analysis results indicate an insignificant correlation between atmospheric and soil Hg concentrations (p = 0.95). Considering the findings from the previous section, the island was experiencing a pronounced monsoon, which facilitates the transport of atmospheric Hg pollutants. This transport process influences the natural deposition of Hg into the soil, thereby weakening the correlation between atmospheric and soil Hg concentrations.
Table 3.
Pearson correlation coefficient of atmospheric Hg at the ground surface (G) and soil Hg (S) concentrations.
4.2. Hg Pollution Assessment
4.2.1. Soil Hg Pollution Assessment
Table S1 presents the calculated results for the Single Pollution Index (Pi) and the Geo-accumulation Index (Igeo). The corresponding column graphs are provided in Figure 5.
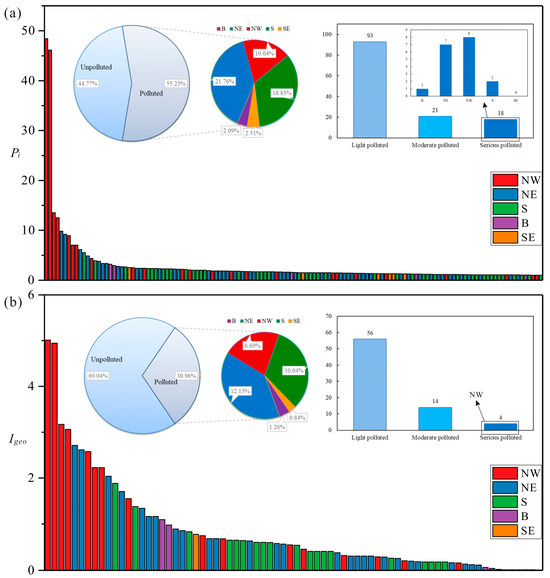
Figure 5.
(a) Sigle Pollution Index and (b) Geo-accumulation Index of Soil Hg, Hainan Island.
Based on the evaluation criteria of the Single Pollution Index (Figure 5a), 55.23% of the sampling sites were found to be contaminated (Pi > 1). Notably, the highest proportions of contaminated sites were observed in the NE (21.76%) and S (18.83%) regions, followed by NW (10.04%), B (2.09%), and SE (2.51%). A closer examination of the Pi values revealed that 18 sampling sites exhibited severe pollution (Pi > 3), with NW and NE regions accounting for the majority (8 and 7 points, respectively). Additionally, two sites in region S and 1 site in region B were classified as severely polluted. Among these, points 111 and 101 in the NW area exhibited the highest pollution levels, with Pi values of 48.4 and 46.1, respectively, indicating extremely severe pollution. Furthermore, 21 sampling sites (8.8% of the total) were moderately polluted (2 < Pi < 3), while a substantial number of points (93, accounting for 38.9% of the total) exhibited mild pollution (1 < Pi < 2).
Considering the Geo-accumulation Index as the evaluation criterion (Figure 5b), approximately 30.96% of the sampling sites were found to be polluted (Igeo > 0). Similar to the Pi-based analysis, the NE and S regions had the highest proportions of polluted sites (12.13% and 10.04%, respectively), followed by NW (6.69%), B (1.26%), and SE (0.84%). An analysis of the Igeo indicated that only 4 sampling sites were strongly polluted (Igeo > 3), all of which were located in the NW region, while 14 sampling sites (5.8% of the total) were moderately-to-strongly polluted (1 < Igeo < 3), and most of the sites (56, accounting for 23.4% of the total) were moderately polluted (0 < Igeo < 1).
4.2.2. Soil Hg Health Risk Assessment
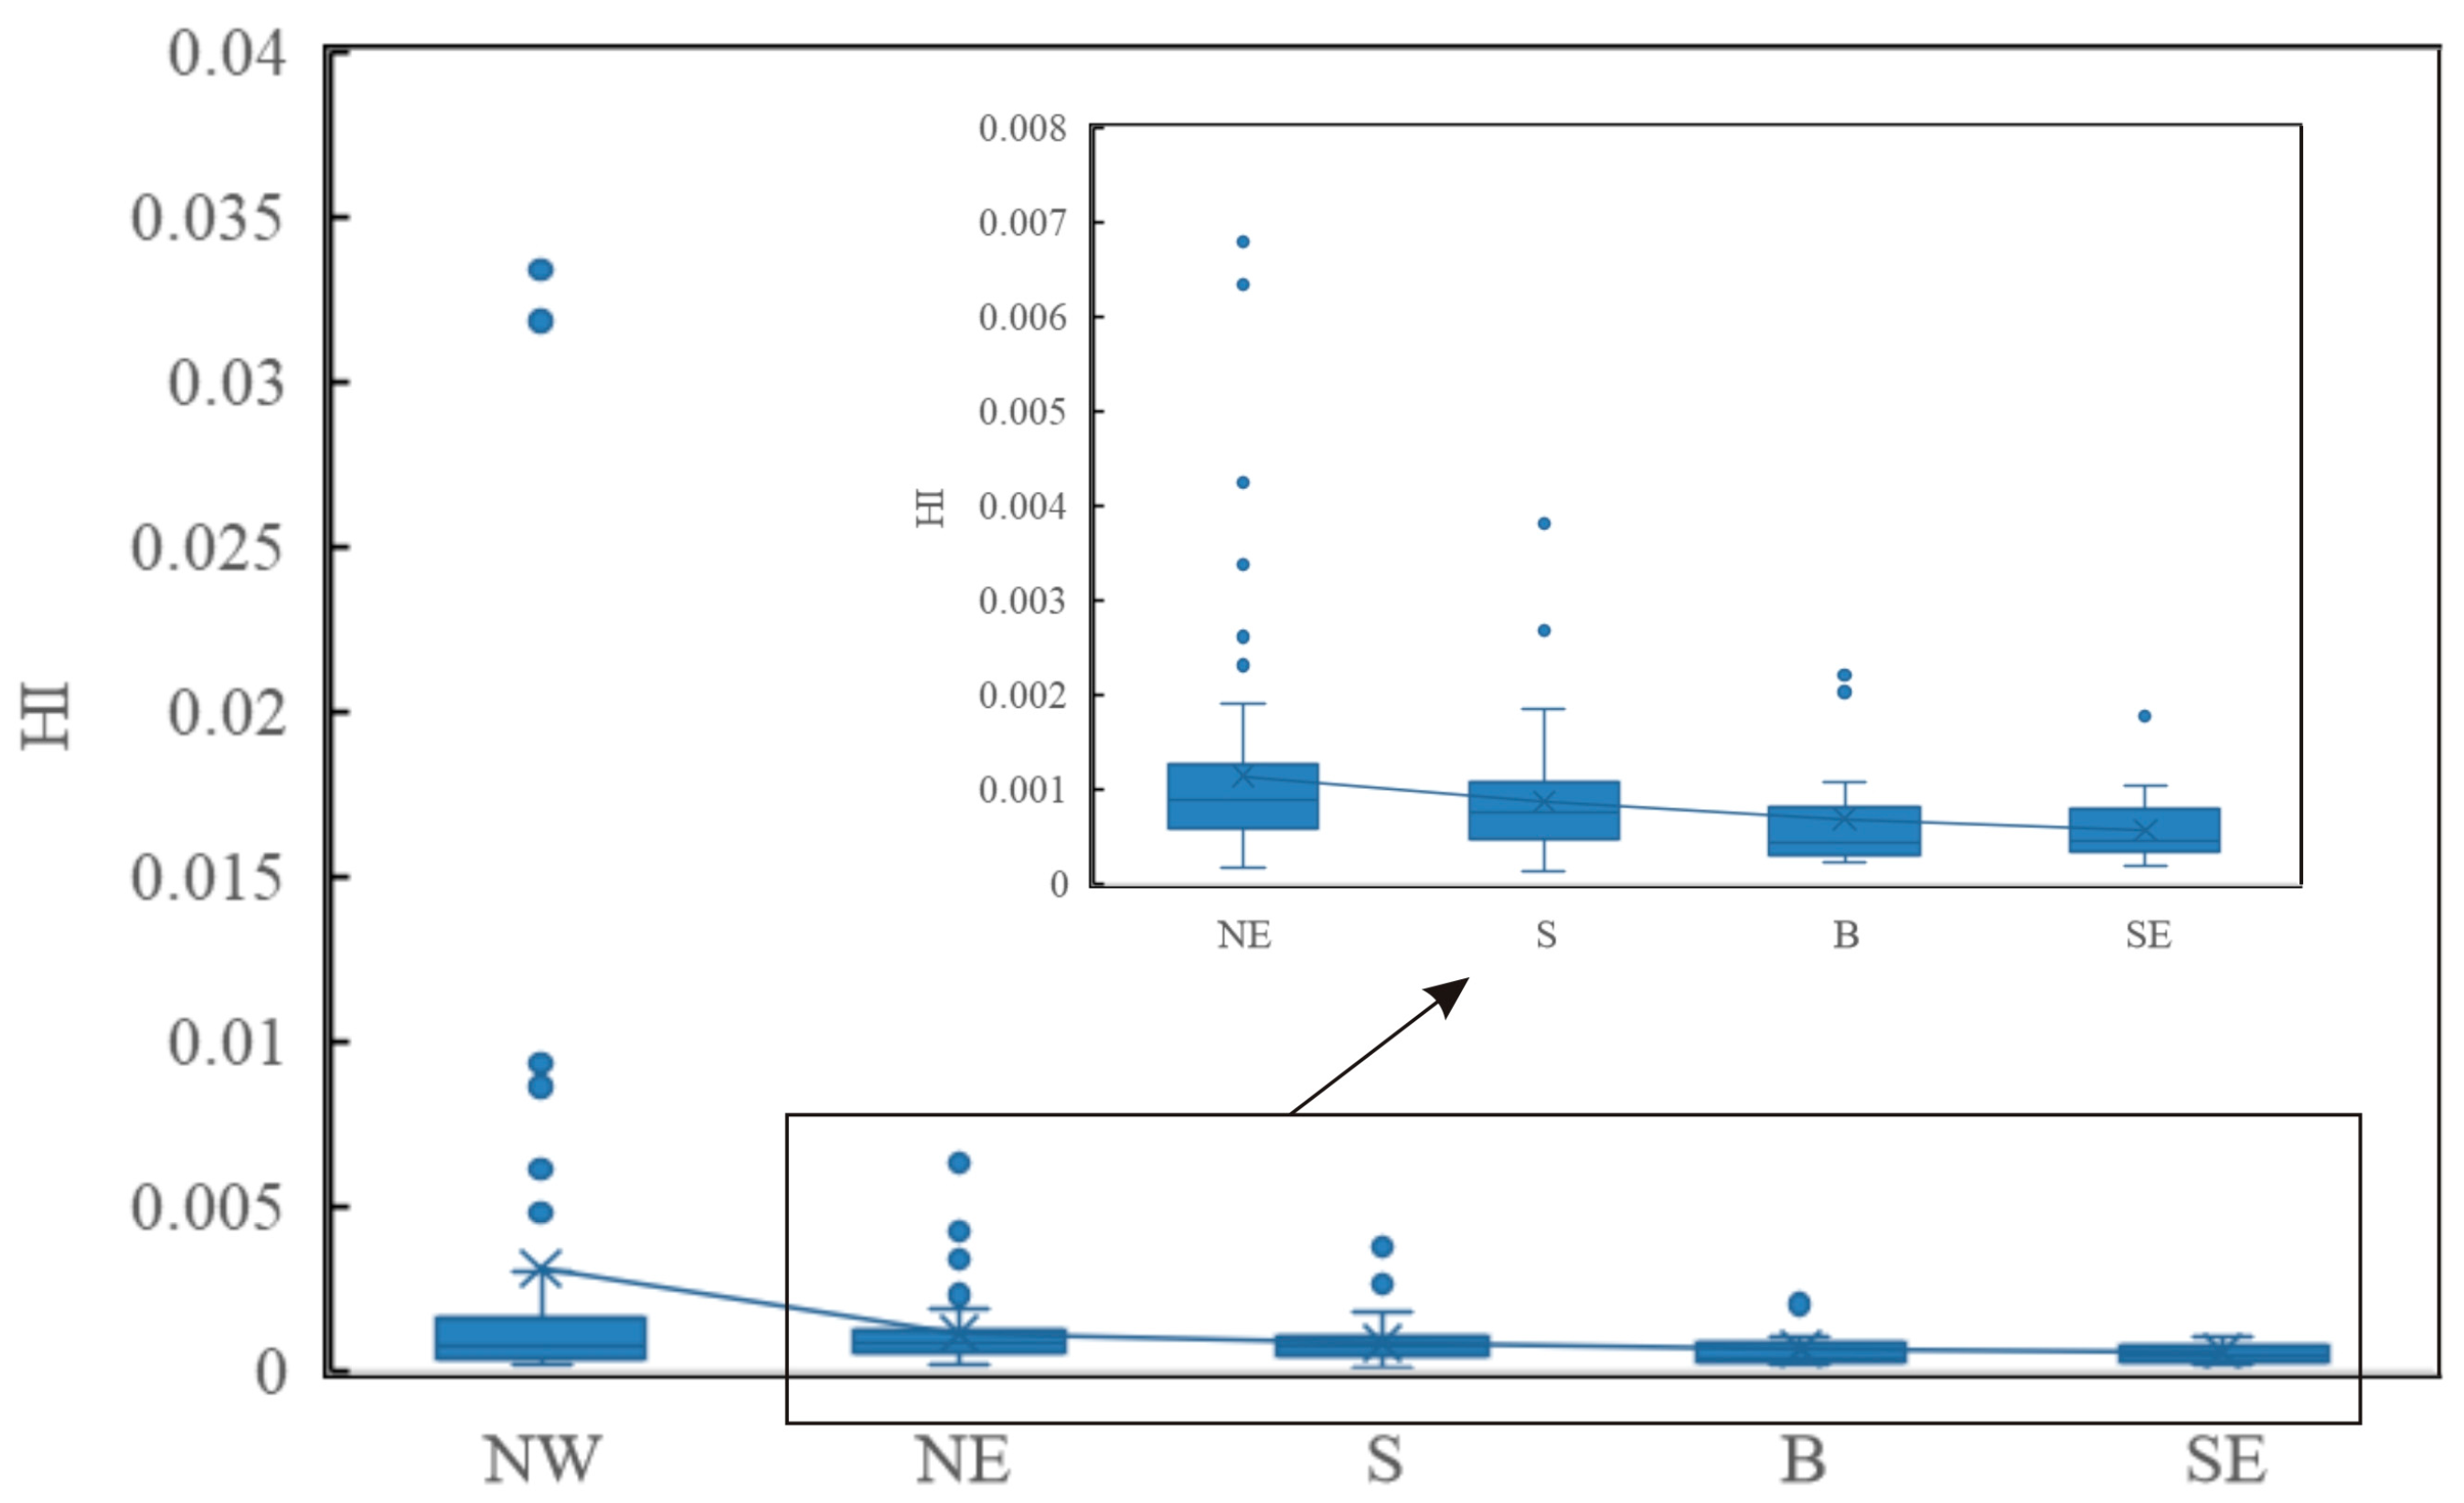
Supplementary Materials presents the calculated HI for the soil. The HI for all samples across the five sub-study areas ranges between 0.0001 to 0.0334, which is significantly lower than 1, indicating that soil Hg pollution within the study area does not pose a significant health risk to humans.
The average HI for the five sub-study areas, arranged in descending order, follow a pattern of NW > NE > S > B > SE (Figure 6). This trend is consistent with the analysis results obtained from the pollution index. Changjiang Li Autonomous County (NW) located in the downwind direction is home to many mines. Consequently, this region exhibits higher soil Hg concentrations, more severe pollution, and a higher health risk compared to the other areas. Haikou (NE) and Sanya (S) are characterized by developed economies and thriving industries and commerce. As a result, these regions show higher levels of soil Hg pollution and higher health risks compared to the Wuzhishan Nature Reserve (B) and Lingshui Li Autonomous County (SE). The Wuzhishan Nature Reserve (B) suffers fewer human activities and exhibits relatively lighter Hg pollution and lower health risks, while Lingshui Li Autonomous County (SE), located in the upwind direction of the monsoon, has the lowest levels of pollution and health risks. Therefore, the health risk posed by soil and atmospheric Hg pollution is mostly from mining and traffic, and it is impacted by the transportation of wind.

Figure 6.
Box plot of the Health Risk Index (HI) in each sub-study area, Hainan Island.
4.2.3. Hg Pollution Control and Prevention
Although the current level of soil Hg pollution in Hainan Island is relatively low and not sufficient to pose a risk to the health of the residents, failure to implement timely prevention and control measures will lead to an accumulation of Hg in the soil, leading to an increase in pollution levels that could eventually harm human health. The effective control of Hg pollution needs comprehensive policies, encompassing long-term monitoring, discharge restrictions, waste treatment, technological innovation, management, and other relevant aspects, which are suggested as follows:
- Long-Term Monitoring: Establish a comprehensive network for monitoring Hg pollution, including Hg sources and key sites to timely assess the status of Hg pollution.
- Discharge Restrictions: Enforce limits on Hg emissions in industrial activities, including mining, by employing advanced technology and equipment to minimize the release of Hg. Additionally, enhance the control of Hg emissions from coal-fired enterprises by implementing technologies such as clean coal combustion and flue gas desulfurization and denitrification.
- Waste Treatment: Employ suitable technologies for treating waste containing Hg, including recycling, transformation, and safe disposal.
- Management and Control: Enhance prudent use and management of Hg, promote its recycling and reutilization, and minimize its use and release. Strengthen the supervision of mining enterprises, preventing illegal discharge of Hg-containing waste water and solid waste.
5. Conclusions
This study investigated the Hg concentrations in the soil of Hainan Island, analyzed the spatial distribution characteristics and influencing factors of Hg concentration, utilized the Single Pollution Index method and the Geo-accumulation Index method to evaluate the Hg pollution status, and conducted a health risk assessment. The main conclusions are as follows:
- (1)
- The soil Hg content in Hainan Island ranges from 6.04 to 1582.50 ng·g−1, with an average of 61.51 ng·g−1. There are significant regional differences. Changjiang Li Autonomous County (NW), which is rich in mineral resources, showed the highest concentration, ranging from 10.00 to 1582.50 ng·g−1, with an average of 61.51 ng·g−1. This was followed by the economically developed cities of Haikou (NE) and Sanya (S), with soil Hg concentrations of 8.33–321.50 ng·g−1 and 6.04–180.50 ng·g−1, respectively, and averages of 54.01 ng·g−1 and 41.08 ng·g−1, respectively. Wuzhishan Nature Reserve (B) and Lingshui Li Autonomous County (SE) have the lowest concentrations, i.e., 10.70–104.67 ng·g−1 and 9.43–84.00 ng·g−1, respectively, with averages of 32.67 ng·g−1 and 26.96 ng·g−1, respectively.
- (2)
- Wind direction significantly influences soil Hg content, with higher levels in the downwind (NW) compared to the upwind (SE) regions. A strong positive correlation is found between the atmospheric Hg concentrations at ground surface and 100 cm above the ground, whereas an insignificant correlation exists between the contents of soil Hg and atmospheric Hg at ground surface.
- (3)
- According to the analysis of the Single Pollution Index and the Geo-accumulation Index, 55.23% and 30.96% of the sampling sites have Hg pollution, with the NE and S areas showing the highest concentration, followed by the NW area. The SE area exhibits the lowest level of Hg pollution, in which most of the sampling sites exhibit moderate pollution, with a smaller number showing strong pollution. The Single Pollution Index method reveals 18 strongly polluted sampling sites, primarily concentrated in the NW and NE regions. In contrast, the Geo-accumulation Index method indicates only 4 strongly polluted sampling sites, all of which are located in the NW regions.
- (4)
- The health risk assessment indicates that the current risk index of Hg pollution in Hainan Island ranges from 0.0001 to 0.0334. The pollution level is insufficient to pose a non-carcinogenic risk to human health. Nevertheless, continuous monitoring and health risk assessments of soil Hg concentrations are necessary due to the rapid expansion of transportation, mining, and industrialization.
Supplementary Materials
The following supporting information can be downloaded at: https://www.mdpi.com/article/10.3390/su16073083/s1, Table S1: Data of atmospheric and soil Hg and parameters used in risk assessment.
Author Contributions
Conceptualization, Y.S. and C.Y.; methodology, Y.S.; software, Y.S.; validation, C.Y.; formal analysis, Y.S.; investigation, Y.S.; resources, Y.S. and C.Y.; data curation, Y.S.; writing—original draft preparation, Y.S.; writing—review and editing, C.Y.; visualization, Y.S.; supervision, C.Y.; project administration, C.Y.; funding acquisition, C.Y. All authors have read and agreed to the published version of the manuscript.
Funding
This research was funded by the Education Department of Hainan Province (HnjgY2022-12) and the National Natural Science Foundation of China (32260127).
Institutional Review Board Statement
Not applicable.
Informed Consent Statement
Not applicable.
Data Availability Statement
Data are contained within the article and Supplementary Materials.
Acknowledgments
We thank Zhang Gang at School of Environment, Northeast Normal University for the help in Hg measurement and insightful discussion.
Conflicts of Interest
The authors declare no conflicts of interest.
References
- Meriga, B.; Krishna Reddy, B.; Rajender Rao, K.; Ananda Reddy, L.; Kavi Kishor, P.B. Aluminum-induced production of oxygen radicals, lipid peroxidation and DNA damage in seedlings of rice (Oryza sativa). J. Plant Physiol. 2004, 161, 63–68. [Google Scholar] [CrossRef] [PubMed]
- Futsaeter, G.; Wilson, S. The UNEP global Hg assessment: Sources, emissions and transport. In Proceedings of the 16th International Conference on Heavy Metals in the Environment, Rome, Italy, 23–27 September 2012; pp. 973–974. [Google Scholar]
- Carocci, A.; Rovito, N.; Sinicropi, M.S.; Genchi, G. Mercury Toxicity and Neurodegenerative Effects. In Reviews of Environmental Contamination and Toxicology; Whitacre, D., Ed.; Reviews of Environmental Contamination and Toxicology; Springer: Cham, Switzerland, 2014; Volume 229, pp. 1–18. [Google Scholar] [CrossRef]
- Bolaños-Alvarez, Y.; Ruiz-Fernández, A.C.; Sanchez-Cabeza, J.A.; Asencio, M.D.; Espinosa, L.F.; Parra, J.P.; Garay, J.; Delanoy, R.; Solares, N.; Montenegro, K.; et al. Regional assessment of the historical trends of Hg in sediment cores from Wider Caribbean coastal environments. Sci. Total Environ. 2024, 2024, 170609. [Google Scholar] [CrossRef]
- Cheng, P.L. The sociological research on “Minamata Disease” in Japan. J. Hohai Univ. Philos. Social Sci. 2008, 10, 30–33, (In Chinese with English Abstract). [Google Scholar]
- Taylor, J. Hg reduction efforts in Michigan. Fuel Process. Technol. 2000, 60, 69–77. [Google Scholar] [CrossRef]
- Martin, L.; Pekka, N.; Sirkka-Liisa, N. Uptake of Hg by terrestrial plants-observations in Fin-land and Slovenia in the years 1979~1981. Mater. Geoenviron. 2004, 51, 1181–1184. [Google Scholar]
- Hu, Y. Reviews of Hg pollution distribution status research at home and abroad. Environ. Prot. Sci. 2008, 34, 38–41, (In Chinese with English Abstract). [Google Scholar]
- Dai, L.; Zhang, B.; Liao, X.; Wang, L.; Zhang, Q.; Tian, S.; Liang, T.; O’Connor, D.; Rinklebe, J. Catchment land use effect on Hg concentrations in lake sediments: A high-resolution study of Qinghai Lake. Sci. Total Environ. 2024, 916, 170260. [Google Scholar] [CrossRef]
- Kang, H.; Liu, X.; Guo, J.; Xu, G.; Wu, G.; Zeng, X.; Wang, B.; Kang, S. Increased Hg pollution revealed by tree rings from the China’s Tianshan Mountains. Sci. Bull. 2018, 63, 1328–1331. [Google Scholar] [CrossRef]
- Driscoll, C.T.; Mason, R.P.; Chan, H.M.; Jacob, D.J.; Pirrone, N. Hg as a global pollutant: Sources, pathways, and effects. Environ. Sci. Technol. 2013, 47, 4967–4983. [Google Scholar] [CrossRef]
- Wang, X.; Yuan, W.; Lin, C.J.; Zhang, L.M.; Feng, X.B. Climate and vegetation as primary drivers for global Hg storage in surface soil. Environ. Sci. Technol. 2019, 53, 10665–10675. [Google Scholar] [CrossRef]
- Song, Z.; Wang, C.; Ding, L.; Chen, M.; Hu, Y.; Li, P.; Zhang, L.; Feng, X. Soil Hg pollution caused by typical anthropogenic sources in China: Evidence from stable Hg isotope measurement and receptor model analysis. J. Clean. Prod. 2021, 288, 125687. [Google Scholar] [CrossRef]
- Yin, W.; Lu, Y.; Li, L.; Chen, C.; Zhang, C.; Dong, F. Distribution characteristics and pollution assessment of Hg in urban soils of Guangzhou. Chin. J. Soil Sci. 2009, 40, 1185–1188, (In Chinese with English Abstract). [Google Scholar]
- Lindberg, S.; Bullock, R.; Ebinghaus, R.; Engstrom, D.; Feng, X.; Fitzgerald, W.; Pirrone, N.; Prestbo, E.; Seigneur, C. A synthesis of progress and uncertainties in attributing the sources of Hg in deposition. AMBIO A J. Hum. Environ. 2007, 36, 19–33. [Google Scholar] [CrossRef]
- Xu, J.; Bravo, A.G.; Lagerkvist, A.; Bertilsson, S.; Sjöblom, R.; Kumpiene, J. Sources and remediation techniques for Hg contaminated soil. Environ. Int. 2015, 74, 42–53. [Google Scholar] [CrossRef] [PubMed]
- Zhang, J.; Xu, Y.; Wu, Y.; Hu, S.; Zhang, Y. Dynamic characteristics of heavy metal accumulation in the farmland soil over Xiaoqinling gold-mining region, Shaanxi. China Environ. Earth Sci. 2019, 78, 25. [Google Scholar] [CrossRef]
- Corella, J.P.; Sierra, M.J.; Garralón, A.; Millán, R.; Rodríguez-Alonso, J.; Mata, M.P.; de Vera, A.V.; Moreno, A.; González-Sampériz, P.; Duval, B.; et al. Recent and historical pollution legacy in high altitude Lake Marboré (Central Pyrenees): A record of mining and smelting since pre-Roman times in the Iberian Peninsula. Sci. Total Environ. 2021, 751, 141557. [Google Scholar] [CrossRef]
- Duval, B.; Tessier, E.; Kortazar, L.; Fernandez, L.A.; de Diego, A.; Amouroux, D. Dynamics, distribution, and transformations of Hg species from pyrenean high-altitude lakes. Environ. Res. 2023, 216, 114611. [Google Scholar] [CrossRef]
- Fang, F.; Wang, Q.; Li, J. Urban environmental Hg in Changchun, a metropolitan city in Northeastern China: Source, cycle and fate. Sci. Total Environ. 2004, 330, 159–170. [Google Scholar] [CrossRef]
- Rodrigues, S.; Pereira, M.E.; Duarte, A.C.; Ajmone-Marsan, F.; Davidson, C.M.; Grčman, H.; Hossack, I.; Hursthouse, A.S.; Ljung, K.; Martini, C.; et al. Hg in urban soils: A comparison of local spatial variability in six european cities. Sci. Total Environ. 2006, 368, 926–936. [Google Scholar] [CrossRef]
- Zhang, L.; Wang, M. Environmental Hg contamination in China: Sources and impacts. Environ. Int. 2007, 33, 108–121. [Google Scholar] [CrossRef]
- Friedli, H.R.; Radke, L.F.; Lu, J.Y.; Banic, C.M.; Leaitch, W.R.; MacPherson, J.I. Hg emissions from burning of biomass from temperate north american forests: Laboratory and airborne measurements. Atmos. Environ. 2003, 37, 253–267. [Google Scholar] [CrossRef]
- UNEP. Global Hg Assessment 2013: Sources, Emissions, Releases and Environmental Transport; UNEP Chemicals Branch: Geneva, Switzerland, 2013. [Google Scholar]
- Chen, B.; Li, J.S.; Chen, G.Q.; Wei, W.D.; Yang, Q.; Yao, M.T.; Shao, J.A.; Zhou, M.; Xia, X.H.; Dong, K.Q.; et al. China’s energy-related Hg emissions: Characteristics, impact of trade and mitigation policies. J. Clean. Prod. 2017, 141, 1259–1266. [Google Scholar] [CrossRef]
- Zhao, S.; Pudasainee, D.; Duan, Y.; Gupta, R.; Liu, M.; Lu, J. A review on Hg in coal combustion process: Concentration and occurrence forms in coal, transformation, sampling methods, emission and control technologies. Prog. Energy Combust. Sci. 2019, 73, 26–64. [Google Scholar] [CrossRef]
- Liao, Z.P.; Chen, Y.C.; Yang, X.C.; Wei, S.Q. Assessment of potential ecological hazard of heavy metals in urban soils in Chongqing City. J. Southwest Agricul. Univ. 2006, 2, 227–230, (In Chinese with English Abstract). [Google Scholar]
- Huang, S.; Wu, X.; Yan, C. Heavy metal concentrations and their spatial distribution in urban soils of Nanjing. Urban Environ. Urban Ecol. 2007, 20, 1–4, (In Chinese with English Abstract). [Google Scholar]
- Wang, X.S.; Qin, Y.; Sang, S.X. Accumulation and sources of heavy metals in urban topsoils: A case study from the city of Xuzhou, China. Environ. Geol. 2005, 48, 101–107. [Google Scholar] [CrossRef]
- Qian, J.; Zhang, L.; Liu, H.; Ye, J. Soil Hg distribution and pollution in urban and suburbs of Guilin. Geochimica 2000, 1, 94–99, (In Chinese with English Abstract). [Google Scholar]
- Zhang, X.; Luo, K.; Sun, X.; Sun, X.; Tan, J.; Lu, Y. Hg in the topsoil and dust of Beijing City. Sci. Total Environ. 2006, 368, 713–722. [Google Scholar] [CrossRef]
- Guo, C.; Wang, Y.; Ren, Y.; Shi, J. The distribution characteristics of Hg-element concentration in the surface soil in Taiyuan. J. Shanxi Univ. Nat. Sci. Ed. 1996, 19, 339–344, (In Chinese with English Abstract). [Google Scholar]
- Zhang, X. Research on the environmental background values of soils in Xizang. Sci. Geogr. Sin. 1994, 14, 49–54, (In Chinese with English Abstract). [Google Scholar]
- Hu, H. The Investigation of The Heavy Metal Pollution in The Aningqu District. Arid Environ. Monit. 2023, 17, 117–122, (In Chinese with English Abstract). [Google Scholar]
- Manta, D.S.; Angelone, M.; Bellanca, A.; Neri, R.; Sprovieri, M. Heavy metals in urban soils: A case study from the city of Palermo (Sicily), Italy. Sci. Total Environ. 2002, 300, 229–243. [Google Scholar] [CrossRef] [PubMed]
- Kot, F.S.; Matyushkina, L.A. Distribution of Hg in chemical fractions of contaminated urban soils of Middle Amur, Russia. J. Environ. Monit. 2002, 4, 803–808. [Google Scholar] [CrossRef] [PubMed]
- Pellinen, V.A.; Cherkashina, T.Y.; Ukhova, N.N.; Komarova, A.V. Role of gravitational processes in the migration of heavy metals in soils of the Priolkhonye mountain-steppe landscapes, Lake Baikal: Methodology of research. Agronomy 2021, 11, 2007. [Google Scholar] [CrossRef]
- Pellinen, V.; Cherkashina, T.; Gustaytis, M. Assessment of metal pollution and subsequent ecological risk in the coastal zone of the Olkhon Island, Lake Baikal, Russia. Sci. Total Environ. 2021, 786, 147441. [Google Scholar] [CrossRef] [PubMed]
- Zhou, Y.; Ma, S.; Zhu, W.; Shi, Q.; Jiang, H.; Lu, R.; Wu, W. Revealing varying relationships between wastewater Hg emissions and economic growth in Chinese cities. Environ. Pollut. 2024, 341, 122944. [Google Scholar] [CrossRef]
- Guo, S.; Wang, Y. Spatial-temporal changes of land-use Hg emissions in China. Ecol. Indic. 2023, 146, 109430. [Google Scholar] [CrossRef]
- Guney, M.; Welfringer, B.; de Repentigny, C.; Zagury, G.J. Children’s Exposure to Hg-Contaminated Soils: Exposure Assessment and Risk Characterization. Arch. Environ. Contam. Toxicol. 2013, 65, 345–355. [Google Scholar] [CrossRef] [PubMed]
- Yeganeh, M.; Afyuni, M.; Khoshgoftarmanesh, A.H.; Khodakarami, L.; Amini, M.; Soffyanian, A.R.; Schulin, R. Mapping of human health risks arising from soil nickel and Hg contamination. Hazard. Mater. Mater. 2013, 244, 225–239. [Google Scholar] [CrossRef]
- Man, Q.R.; Xu, L.J.; Li, M.F. Source Identification and Health Risk Assessment of Heavy Metals in Soil: A Case Study of Lintancang Plain, Northeast China. Int. J. Environ. Res. Public Health 2022, 19, 10259. [Google Scholar] [CrossRef]
- Wang, L.J.; Lu, X.W.; Ren, C.H.; Li, X.X.; Chen, C.C. Contamination assessment and health risk of heavy metals in dust from Changqing in dustrial park of Baoji, NW China. Environ. Earth Sci. 2014, 71, 2095–2104. [Google Scholar] [CrossRef]
- Sahakyan, L.; Tepanosyan, G.; Maghakyan, N.; Melkonyan, G.; Saghatelyan, A. Hg contents and potential risk levels in soils and outdoor dust from kindergartens of the city of Vanadzor (Armenia). Human Ecol. Risk Assess. 2020, 27, 1258–1275. [Google Scholar] [CrossRef]
- GB 16297-1996; National Environmental Protection Administration & the State Bureau of Quality and Technical Supervision. Integrated Emission Standard of Air Pollutants. Chinese Standard GB/T: Beijing, China, 2021.
- Wang, L.; Lu, X.; Jing, Q.; Ren, C.; Chen, C.; Li, X.; Luo, D. Heavy metals pollution in soil around the lead-zinc smelting plant in Changqing Town of Baoji City, China. J. Agro-Environ. Sci. 2012, 31, 325–330, (In Chinese with English Abstract). [Google Scholar]
- Müller, G. Heavy Metals in the Sediment of the Rhine-Changes Seity. Umsch. Wiss. Und Tech. 1979, 79, 778–783. [Google Scholar]
- Chen, P.; Qiu, H.Y.; Guo, Y.N.; Wang, L.Y. Heavy metal contamination and health risk assessment in the zinc mine set area of Youxi, China. J. Xiamen Univ. Nat. Sci. 2012, 51, 245–251, (In Chinese with English Abstract). [Google Scholar]
- DB11 T 656-2009; Beijing Municipal Bureau of Quality and Technical Supervision. Environmental Site Assessment Guideline. Chinese Standard GB/T: Beijing, China, 2009.
- EPA. Risk Assessment Guidance for Superfund Volume I: Human Health Evaluation Manual (Part A); EPA: Washington, DC, USA, 1989; pp. 1–291.
- Du, Y.; Gao, B.; Zhou, H.; Ju, X.; Hao, H.; Yin, S. Health risk assessment of heavy metals in road dusts in urban parks of Beijing, China. Procedia Environ. Sci. 2013, 18, 299–309. [Google Scholar] [CrossRef]
- Vilavert, L.; Nadal, M.; Schuhmacher, M.; Domingo, J.L. Concentrations of metals in soils in the neighborhood of a hazardous waste incinerator: Assessment of the temporal trends. Biol. Trace Elem. Res. 2012, 149, 435–442. [Google Scholar] [CrossRef] [PubMed]
- Tang, R.; Ma, K.; Zhang, Y.; Mao, Q. Health risk assessment of heavy metals of street dust in Beijing. Acta Sci. Circumstantiae 2012, 32, 2006–2015, (In Chinese with English Abstract). [Google Scholar]
- Liao, X.J. Study on the Environmental Geochemistry and Environmental Recondition in Shilu Iron-Ore Mining Area, Hainan. Ph.D. Thesis, China University of Geosciences, Wuhan, China, 2008. [Google Scholar]
- Wang, D.; Shi, X.; Yang, X. Transformation of atmospheric Hg in soil and its influence on the accumulation of Hg in soil. Chongqing Environ. Sci. 1998, 20, 22–25, (In Chinese with English Abstract). [Google Scholar]


Disclaimer/Publisher’s Note: The statements, opinions and data contained in all publications are solely those of the individual author(s) and contributor(s) and not of MDPI and/or the editor(s). MDPI and/or the editor(s) disclaim responsibility for any injury to people or property resulting from any ideas, methods, instructions or products referred to in the content. |
© 2024 by the authors. Licensee MDPI, Basel, Switzerland. This article is an open access article distributed under the terms and conditions of the Creative Commons Attribution (CC BY) license (https://creativecommons.org/licenses/by/4.0/).