Article

A Transformer Heavy Overload Spatiotemporal Distribution Prediction Ensemble under Imbalanced and Nonlinear Data Scenarios

1
International College of Engineering, Changsha University of Science & Technology, Changsha 410114, China
2
School of Electrical & Information Engineering, Changsha University of Science & Technology, Changsha 410114, China
*
Author to whom correspondence should be addressed.
Sustainability 2024, 16(8), 3110; https://doi.org/10.3390/su16083110
Submission received: 11 March 2024 / Revised: 5 April 2024 / Accepted: 6 April 2024 / Published: 9 April 2024
(This article belongs to the Special Issue Smart Grid Technologies and Applications)

Abstract

:
As a crucial component of power systems, distribution transformers are indispensable to ensure the sustainability of power supply. In addition, unhealthy transformers can lead to wasted energy and environmental pollution. Thus, accurate assessments and predictions of their health statuses have become a top priority. Unlike assumed ideal environments, however, some complex data distributions in practical scenarios lead to more difficulties in diagnosis. One challenge here is the potential imbalanced distribution of data factors since sparsely occurring factors along with some Unusual High-Risk (UHR) components, whose appearance may also damage transformer operations, can easily be neglected. Another is that the importance weight of data components is simply calculated according to their frequency or proportion, which may not always be reasonable in real nonlinear data scenes. With such motivations, this paper proposes a novel integrated method combining the Two-fold Conditional Connection Pattern Recognition (TCCPR) and Component Significance Diagnostic (CSD) models. Initially, the likely environmental factors that could result in distribution transformer heavy overloads were incorporated into an established comprehensive evaluation database. The TCCPR model included the UHR time series and factors that are associated with heavy overload in both spatial and temporal dimensions. The CSD model was constructed to calculate the risk impact weights of each risky component straightforwardly, in line with the total risk variation levels of the whole system caused by them. Finally, the results of one empirical case study demonstrated their adaptation capability and enhanced performance when applied in complex and imbalanced multi-source data scenes.

1. Introduction

1.1. Motivation and Background

With the global energy crisis and environmental concerns that are making energy sustainability a pressing issue, the efficient and reliable operation of power systems as the core of power conversion and transmission is key to achieving this goal. Distribution transformers play a pivotal role as indispensable equipment in a power system, and their operational status directly affects the sustainable power supply of the entire system [1].
Transformers are utilized for converting electrical power across different voltage levels. During long-term operation, a multitude of issues and failures may arise, among which, heavy overload is particularly prominent [2]. Heavy overload may not only lead to equipment damage and affect the normal operation of a power system but may also aggravate energy waste and environmental pollution.
With the acceleration of industrialization and rapid urban development, there is a frequent occurrence of power demand peaks, necessitating transformers to endure loads exceeding their rated capacity. This operating condition, although potentially temporary, poses a serious threat to transformers’ health and equipment lifespan.
The prolonged operation of a transformer under heavy overload conditions imposes additional thermal stress on its internal components, particularly the insulation material, thereby accelerating the aging process [3]. Specifically, overheating and the accelerated aging of insulation materials can release toxic chemicals such as nitrogen oxides, which can seriously pollute air quality. This pollution not only harms humans but also directly affects the surrounding ecosystem and biodiversity. Moreover, transformers are susceptible to experiencing partial discharge during heavy overload, which can result in insulation breakdown, short circuits, structural damage, or even more severe failures, such as fire incidents, which pose risks to the safety of both equipment and personnel [4]. Overheating or fire accidents in the surrounding environment can cause oil leakage. This can contaminate soil and water quality, disrupt the ecological balance, and affect biological habitats and food chains [5].
Therefore, the accurate prediction and assessment of transformer heavy overload conditions are crucial for maintaining power supply and environmental sustainability [6,7]. Currently, methods for predicting and assessing electrical equipment are rapidly advancing and can be categorized into three primary categories.
The first category is the widely used predictive analysis method that uses signal and visual sensing systems. This process entails identifying various aspects of a target through the use of multiple devices and algorithms for perceptual processing. For example, Huang et al. detected transmission lines by constructing application sensors to obtain icing data [8]. A method of collecting the feature factor parameters of the external environment by establishing multiple sets of external sensors was proposed in [9]. Jalilian et al. proposed a new method for monitoring the galloping of transmission lines using wireless communication and inertial measurement units [10]. Although the prediction method based on signal and visual sensing systems can intuitively feel the operating state of electrical equipment and has good accuracy, its internal structure is complex, costly, and easily influenced by the external environment. It also requires external accuracy instruments. As the complexity of power systems continues to deepen, the utilization of sense recognition presents drawbacks due to its complex structure and high cost. Therefore, it is not suitable for large-scale deployment and is only viable for prediction and assessment on a limited scale.
The second category is the predictive analysis method based on the physical model. This method entails developing a model based on the thermal and electrical parameters of the equipment, followed by simulating and predicting the operational state and potential fault effects of the electrical equipment. For example, Gorgan et al. proposed a model for hot-spot temperature that explained the impact of solar radiation on the temperature rise of transformer windings [11]. A model based on the fundamental heat transfer theory used for the thermal behavior prediction of the top oil of indoor distribution transformers was proposed in [12]. Shadab et al. proposed a methodology for predicting Top Oil Temperature (TOT) and estimating parameters [13]. The physical model-based prediction method yields high accuracy. However, it requires the accurate modeling of equipment parameters and a large amount of real-world data. Modeling, calibration, complexity, skill quality, and cost requirements are also steep, making it challenging to apply to aging or obsolete equipment.
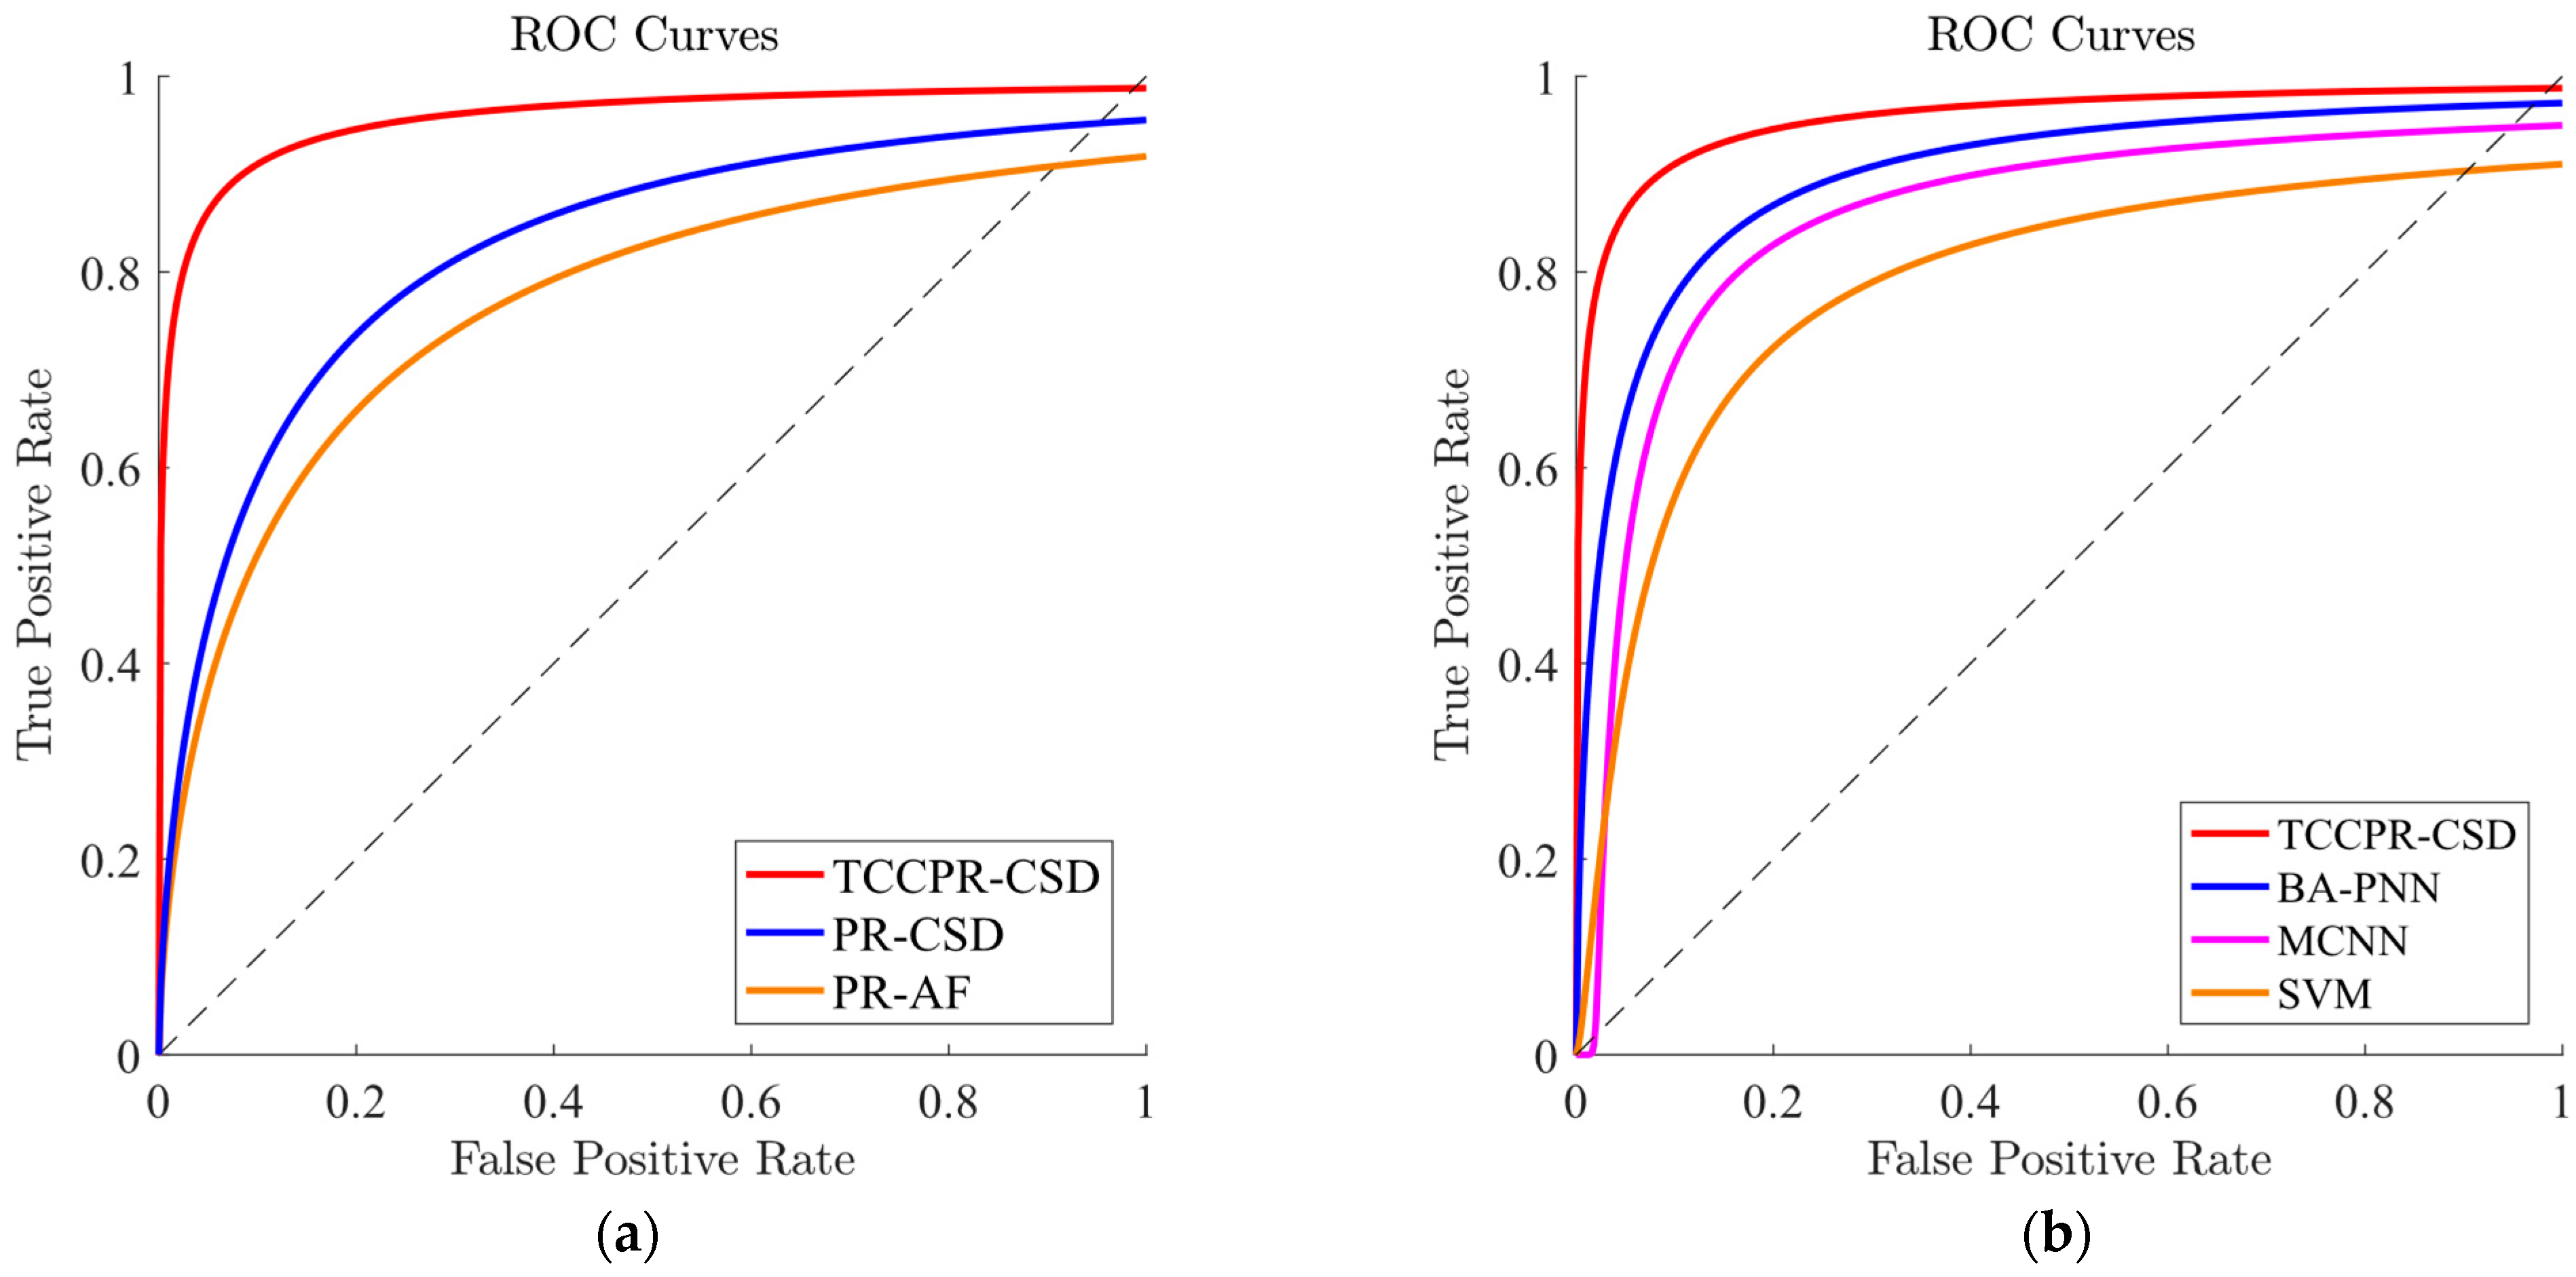
The third category is predictive analysis based on machine learning. In recent years, due to the ongoing enhancement of intelligent power systems development, intelligent algorithms have found extensive applications in the domain of fault analysis and the predictive assessment of electrical equipment. Behkam et al. proposed a modified method based on Artificial Neural Network (ANN) techniques to predict fault type detection in distribution transformer windings [14]. Bacha et al. proposed a Support Vector Machine (SVM) method to realize the classification and discrimination of transformer fault diagnosis [15]. Sun et al. proposed a novel method based on the MobileNets convolutional neural network (MCNN) to identify the partial discharge mode of transformers [16]. Yang et al. proposed an integrated method for the fault diagnosis of power transformers based on the Bat Algorithm and Probabilistic Neural Network (BA-PNN) models [17]. Huang et al. proposed a dissolved gas analysis method for power transformers based on fuzzy logic [18]. Xiao et al. proposed establishing a Bayesian network to determine the causality between various tests and fault factors and using Bayesian causal probability to diagnose transformer faults [19]. Lakehal et al. proposed a Bayesian model based on Duval’s triangle for transformer fault analysis prediction [20]. A short-term heavy overload prediction method for public transformers based on the Long Short-term Memory (LSTM-XGBOOST) combined model was proposed in [21]. The aforementioned approach has significantly advanced the development of machine learning methods. However, the number of factors considered remains relatively limited. When attempting to incorporate a broader array of factors, there is a noticeable increase in computational complexity. This statement is not applicable to modern large and complex power systems.
The method of pattern recognition (PR) is dedicated to directly excavating the latent patterns and connections within vast and complex datasets. This method is particularly well-suited for predictive evaluations in scenarios involving multiple factors, offering a more comprehensive analysis by seamlessly integrating an extensive range of variables. This capability not only enhances the accuracy of predictions but also extends the applicability of machine learning models to more complex, multifactorial contexts.
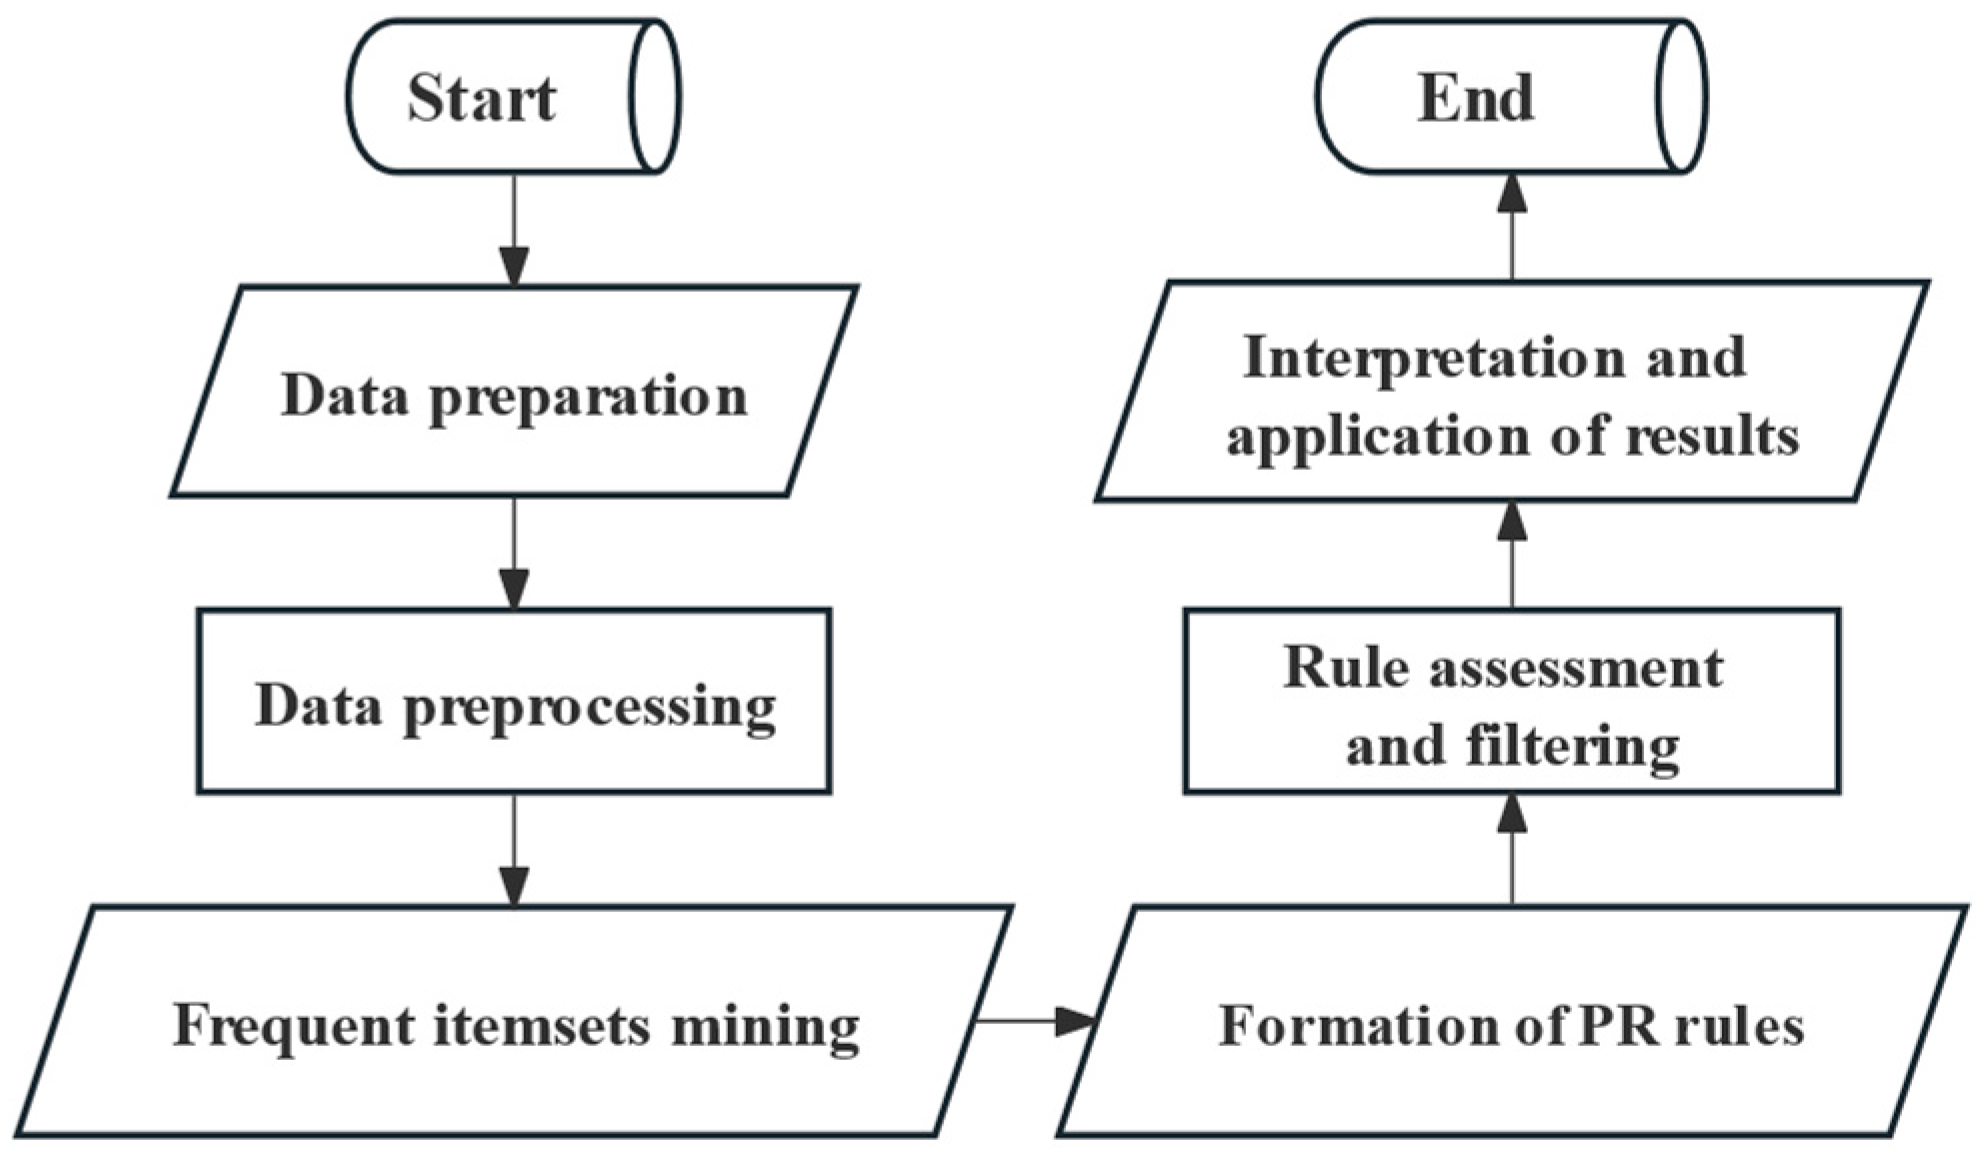
In the field of PR, the Apriori algorithm is one of the most common PR rule algorithms and mainly uses the iterative method of layer-by-layer search to mine the relevance in the item sets and then form PR rules [22]. Hong et al. proposed using pattern recognition combined with probability images for data mining while constructing a scheme to assess the state of transformers [23]. Sheng et al. constructed a new multi-state fault prediction model for transformers by combining the Apriori algorithm with the probabilistic image model [24]. When searching for frequent item sets, the model needs to scan the database several times to generate a large number of redundant candidate item sets. The Eclat algorithm utilizes a vertical data format as the input, which reads the database only once and does not need to read the transaction database several times to determine the support [25]. Thus, the Eclat algorithm is more efficient than Apriori. But, if the item frequency is very high and the frequent item sets are huge, the intersection operation may consume significant memory, causing mining inefficiency. To overcome the limitations of the Apriori algorithm, the FP-Growth algorithm just scans the database twice and compresses the input data through the FP-tree structure, which greatly optimizes the operation efficiency [26]. Although these methods effectively combine large amounts of data from multiple sources, they do not provide relevant analyses for the uneven spatio-temporal data of realistic scenarios.

1.2. Problems

While traditional PR has the innate ability to directly integrate massive amounts of data, it is still idealized in data correlation analysis: it typically computes the evaluation PR indexes based on the frequency or ratio of occurrence for feature factors. This means that these algorithms are designed based on the uniform distribution of data in both spatial and temporal dimensions. However, the feature factors contributing to faults often exhibit an imbalance distribution in both temporal and spatial dimensions in real-world scenarios. The traditional method of determining significance by proportionality to the frequency of fault feature factors is unrealistic. Therefore, traditional PR algorithms may overlook or filter out Unusual High-Risk (UHR) factors in calculations. UHR factors have a low frequency of occurrence, but their impact on failure outcomes is significant. It is crucial to handle them promptly to avoid serious consequences. The traditional method does not fully consider these UHR factors under spatiotemporal conditions but, instead, directly adopts fixed thresholds and significance score calculations.
Lightning strike accidents exemplify the imbalance distribution of temporal dimensions, occurring more frequently during summer and less frequently in other seasons. However, conventional methods for assessing this issue still use fixed thresholds for significance diagnostics, i.e., evaluating phenomena with imbalanced data distribution due to seasonal variations using uniform thresholds. Furthermore, general calculations disregard the low frequency of failures during the winter, spring, and autumn seasons. Consequently, the significant scores assigned to corresponding temporal states fall below the thresholds established based on annual failure occurrences, resulting in overlooking these unusual time series straightforwardly. In terms of spatial dimensions, traditional intelligent algorithms use a fixed significance score calculation method, which is inadequate in dealing with the influence of different environmental features on the significance index scores. In regions with temperatures below zero degrees Celsius during winter, the occurrence of ice flash accidents poses a serious threat to the stable operation of power systems due to climatic or topographical factors. In low-latitude flat areas, the probability of ice flash accidents is relatively low due to the warmer climate. However, when confronted with scenarios with the same problem but different environmental features, the use of the traditional method of calculating the severity score may result in the exclusion of ice flash accidents in the low-latitude flat regions that do not meet the minimum thresholds. Differences in environmental features thus have a significant impact on the determination of significance scores, making the traditional definition unable to adapt to the spatial distribution of data in realistic scenarios.
Moreover, the conventional weighting method cannot be applied to real-world scenarios due to the imbalanced nonlinear distribution of data. Most weight calculation methods determine relative impact weights based on the proportion of data. However, this approach cannot effectively measure the high-risk component of unusual factors, and setting weights directly based on frequency of appearance does not align with real-life complex scenarios involving non-linear data. Therefore, additional research is necessary to accurately quantify nonlinear scenarios in real-world data, take into account UHR factors, and design novel weighting models.

1.3. Research and Contributions

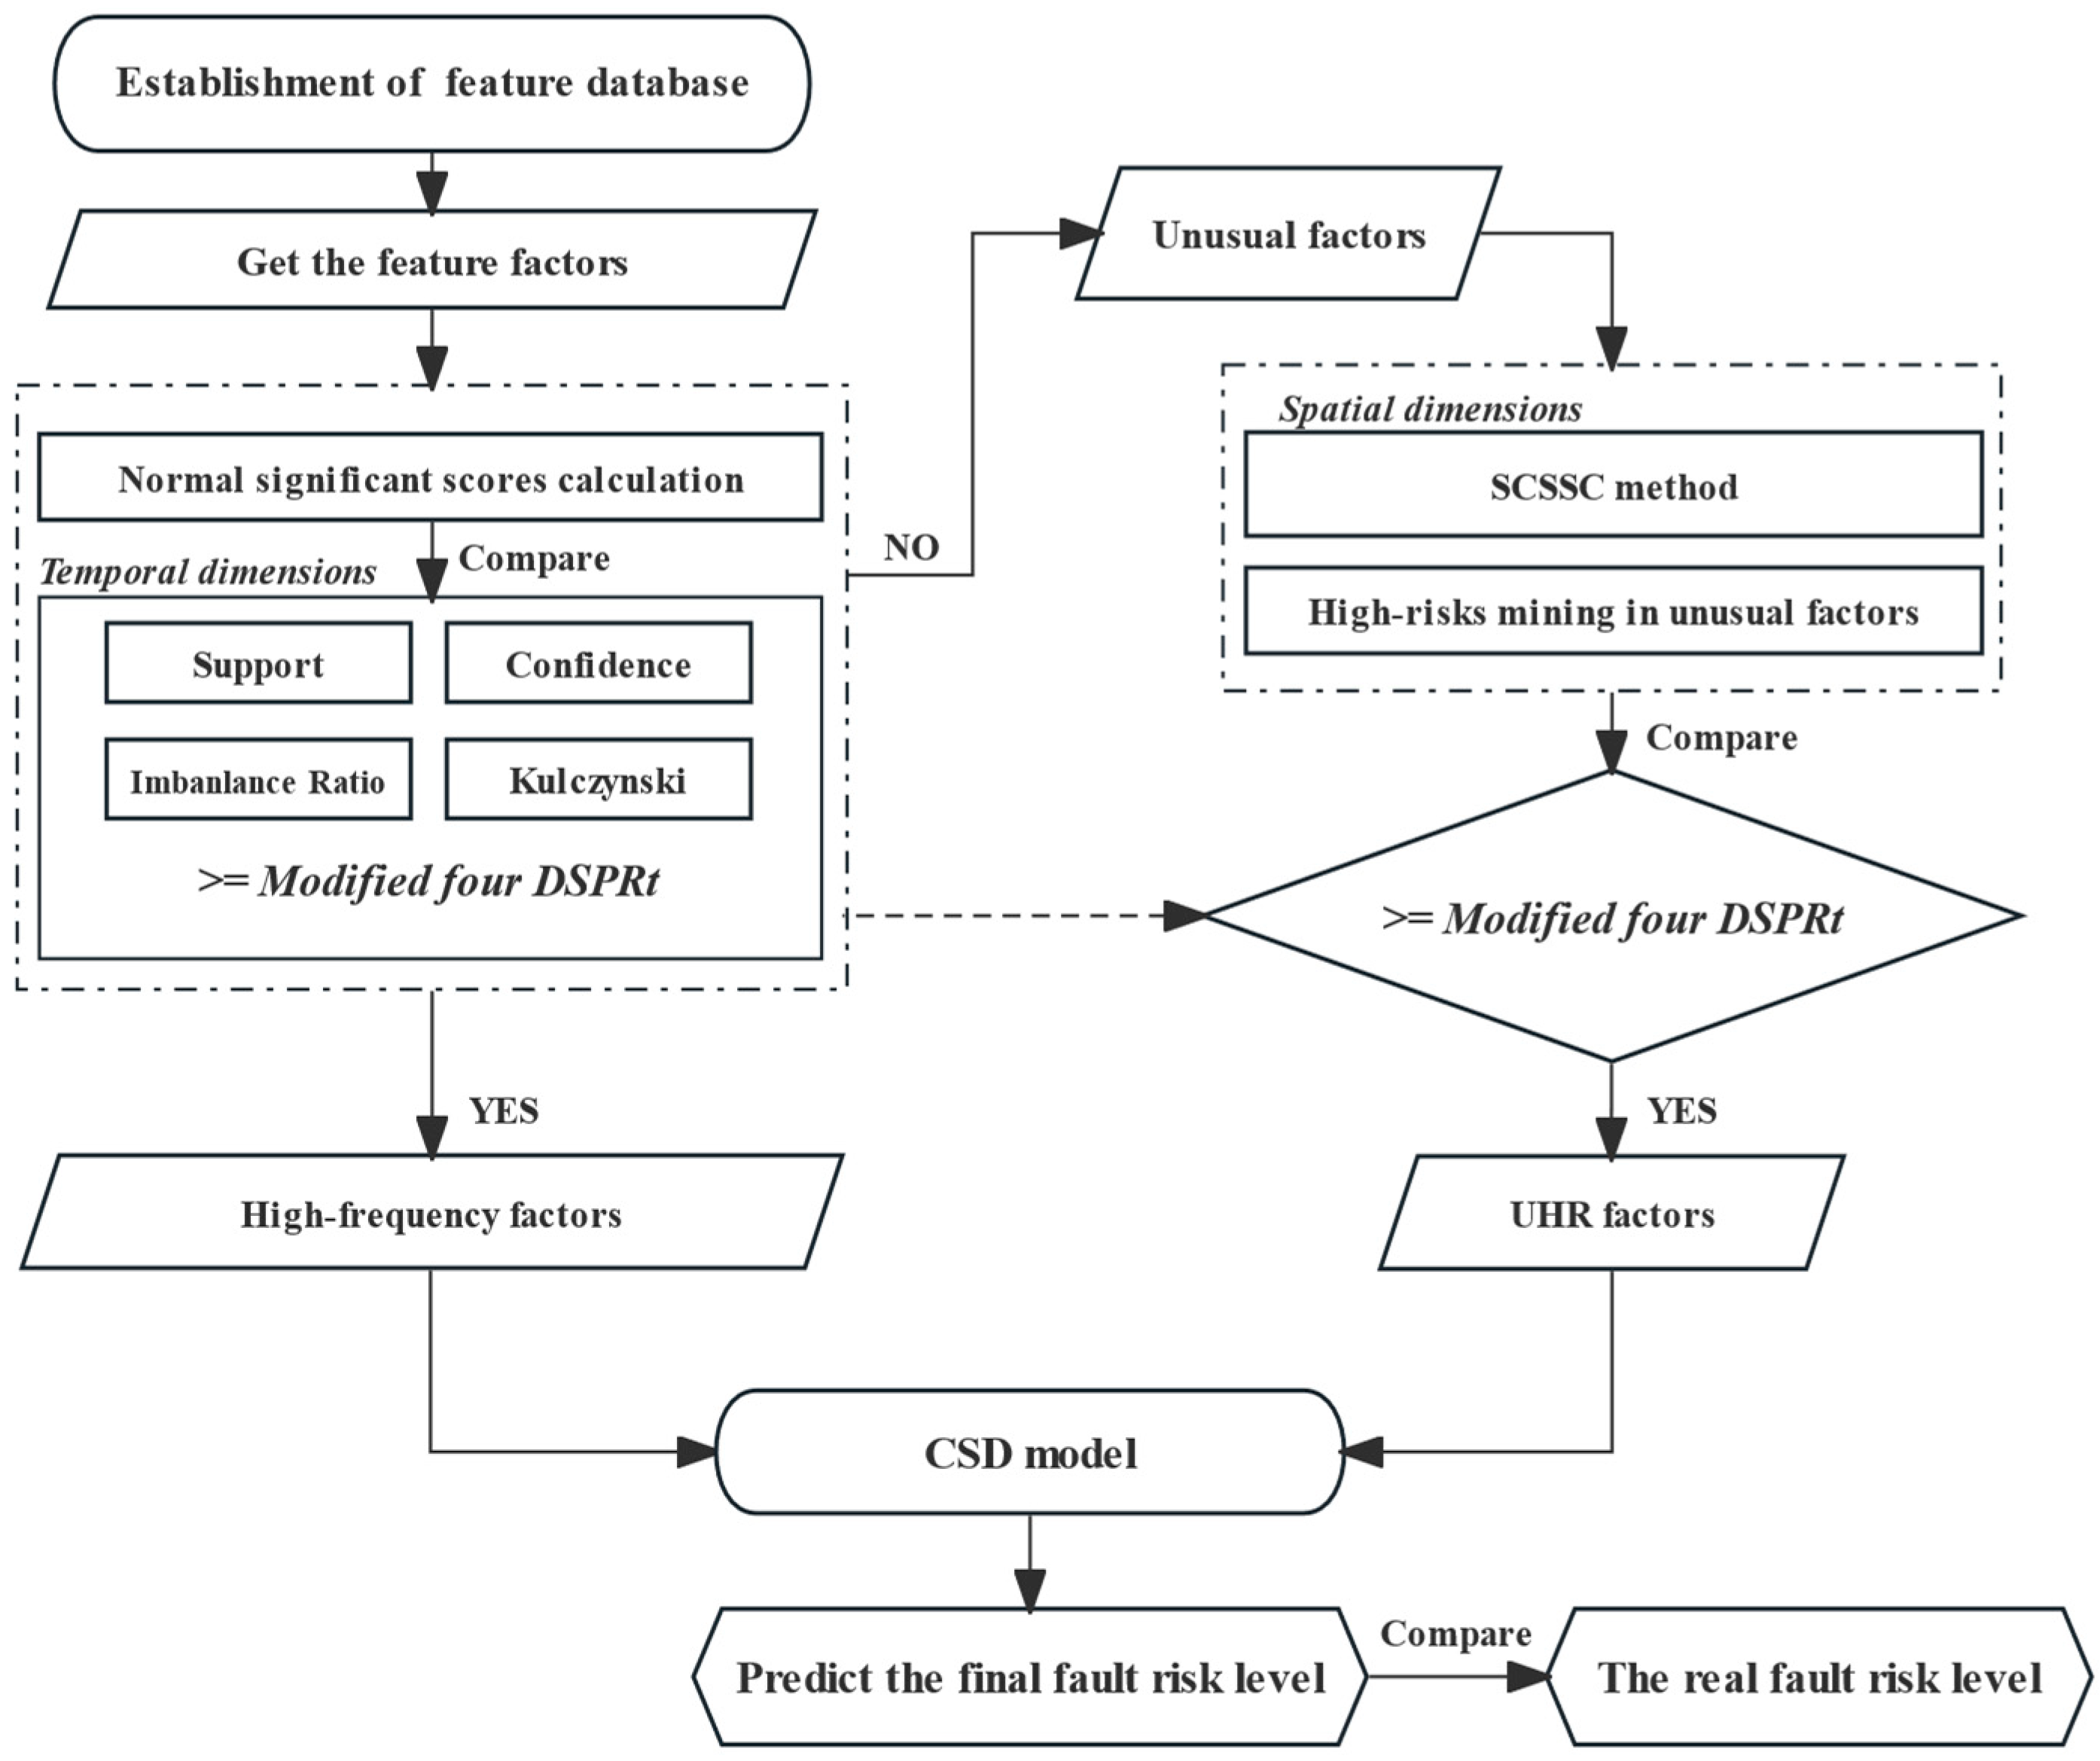
To address those aforementioned limitations, this paper proposes a novel prediction ensemble for transformer heavy overload spatiotemporal distributions. This method can effectively handle the potential imbalance distributions and nonlinear characteristics of feature factors under both spatial and temporal scales by combining the Two-fold Conditional Connection Pattern Recognition (TCCPR) and Component Significance Diagnostic (CSD) models.
Four PR significance indices were reformed to incorporate the risks in different time series. In the temporal dimension, the corresponding four Dynamic Self-adaptive PR thresholds (DSPRt) were updated periodically to ensure that the feature factors under different temporal states were also evaluated differently. This revealed the rules and trends related to transformer heavy overload in time scales. The method of Spatial Conditional Significance Score Calculation (SCSSC) considered the influence of the spatial distribution of diverse environmental condition features and factors. The significance score calculations of the unusual factors were decided via dynamic self-adaptive PR threshold screening. This comprehensively assessed these unusual factors once again to enable the identification of included high-risk components (UHR factors). Hence, the TCCPR model was established by integrating DSPRt and the SCSSC to cover potential UHR factors when various imbalanced time series and spatial factor distributions were probed.
Additionally, the CSD model was built to measure impacting weights for the distinguished risk factors for nonlinear data scenarios. The CSD model captured the potential relevance between environmental feature factors and overload failures. The risk of overall system failure could be determined utilizing the component significance (CS) and risk structure theory. The impacting weights of each risky factor were then figured out by measuring the trend and magnitude of changes by each factor pair on the overall system failure risk. For instance, the appearance of a high-risk factor led to a more significant change in the overall system risk compared to that with lower risks. As a result, the impacting weight could be decided straightforwardly according to the extra risks generated by each factor, rather than merely data proportion or appearance frequency.
Finally, this ensemble was conducted via the MFP-Growth algorithm, and an empirical case study demonstrated its adaptability in the multi-source imbalanced and nonlinear data environment, enhancing the prediction performance of transformer heavy overload occurrences.
In modern power systems, the amount of data generated by various devices, sensors, and control systems is so large and complex that traditional data processing and analysis methods may struggle to handle it. The proposed method offers significant advantages in terms of comprehensiveness and flexibility, allowing for the direct mining of potential laws and connections in massive and complex datasets. The DSPRt and SCSSC models can self-adapt the threshold and significance according to different power system data spatiotemporal distributions and thus can be widely used in various power system scenarios. This approach can be widely applied in various power system scenarios, regardless of data type or number, and is therefore highly scalable to other predictions in a power system.
The challenges in implementing the TCCPR model should not be underestimated. Precise description of the data is particularly difficult due to the continuous nature of environmental factors, which require discretization. It is important to note that different discretization methods may have varying impacts on the results.
The contributions of this paper include the following:
  • The proposed method obviates the necessity for the direct extraction of potential relationships between condition components and transformer heavy overloads, thereby enabling heavy overload predictions for distribution transformers under application data scenarios in the real world.
  • The TCCPR model incorporates DSPRt and SCSSC to effectively consider the distribution of UHR factors across different time series and environmental features. This enables an all-inclusive analysis of multi-source inputs in cases of both imbalanced spatial and temporal data distributions, which results in enhanced prediction performance, especially in imbalanced data scenes.
  • The CSD model applies a direct measurement of the relative risk impact weights of each factor by analyzing the changing trend and amplitude of the overall system risk that results from their appearance. Compared with the appearance frequency or data proportion, this model provides a more straightforward weight assessment via their impacts on fault results, making it more feasible, especially within nonlinear data scenarios.
The remaining sections of this paper are organized as follows: Section 2 provides a detailed exposition of the theoretical underpinnings and construction process of the TCCPR-CSD model, including the establishment of an evaluation feature database, the determination method for Dynamic Self-adaptive PR thresholds (DSPRts), and the application of Spatial Condition Significance Scoring Calculation (SCSSC). Section 3 demonstrates the application process and results of the model through an empirical case study, validating the model’s effectiveness in predicting heavy overload events in distribution transformers. Section 4 concludes with the main findings of the research.

2. Models and Methods

This section introduces three fundamental approaches of the proposed integrated model: the establishment of a comprehensive evaluation feature database, the design and application of the Two-fold Conditional Connection Pattern Recognition (TCCPR) model in spatiotemporal dimensions, and the establishment of the nonlinear Component Significance Diagnostic (CSD) weighted model. Furthermore, the integration of the TCCPR and CSD models results in a complete classifier model for predicting heavy overload in transformers.

2.1. Establishment of Comprehensive Evaluation Feature Database

In the process of conducting a comprehensive analysis and thorough assessment of transformer overload risk, it is crucial to consider both internal and external factors [27] and their impact on transformer performance and overload risk. Examining these factors not only highlights how they collectively influence the level of overload risk but also serves as the foundation for developing TCCPR models. To ensure comprehensive and accurate modeling, we conducted thorough assessments during the construction of the feature database for the transformers, as demonstrated in Table 1.
The features that affected distribution transformer heavy overload did not all have discrete distributions. Therefore, the continuous factors needed to be discretized before double pattern recognition (PR) processing. We divided the continuous data into different ranges based on experience and previous historical data.
To accurately predict the heavy overload on distribution transformers, it is imperative to comprehensively consider the combined impacts of internal and external influencing factors and gain a profound understanding of their effects on transformer performance and overload risk. In this paper, let the set of all items in the feature database be  S = { S 1 , , S x , , S n } , where  S x  is a single input feature variable.  S x =   { v x , 1 , , v x , k , , v x , l }  is a subset of  S . Let the set of all target variables be  O = O 1 , , O y , , O m , where  O y  represents a target variable to determine whether the transformer is in a heavy overload state. Let  U = u 1 , , u y , , u m  be the label corresponding to the record and let  R = R 1 , , R y , , R m  be the set containing all the fault quarters. In the above process,  m  and  n  are the number of items. Based on the above settings, each set was integrated and converted into a matrix. The specific conversion was as follows.
U t r a n = u 1 , , u y , , u m T
O t r a n = O 1 , , O y , , O m T
R t r a n = R 1 , , R y , , R m T
In addition, let  E o v = { E 1,1 , , E y , x , , E i , n }  denote the environmental factors. Based on this, the processing space matrix  F D o l  for transformer heavy overload prediction was constructed as follows:
A 1 = S 1 S x E 1,1 E 1 , x E y , 1 E y , x E m , 1 E m , x
A 2 = S x + 1 S n E 1 , x + 1 E 1 , n E y , x + 1 E y , n E m , x + 1 E m , n
I N s t = A 1 A 2 O t r a n R t r a n
F D o l = U t r a n I N s t
In the formula, each row represents a fault record.  { S 1 , , S x }  represent the features of external factors,  { S x + 1 , , S n }  represent the features of internal factors, and  E y , x  represents an environmental factor  v x , k  that records the feature  S x  in  u y u y  is the number label of the fault event,  R y  is the quarterly time when a fault occurs, and the quarterly time is a set of  { R 1 , R 2 , R 3 , R 4 } K y  is the result of multiple factors.

2.2. Two-Fold Conditional Connection Pattern Recognition (TCCPR) Model

2.2.1. Principle Description: Pattern Recognition (PR)

PR algorithms, initially proposed by Agrawal et al. [28], are extensively utilized as a prominent data mining technique in power system fault diagnosis for prediction and assessment purposes. They are used to extract potential relationships among multiple variables in a feature database. In PR analysis, the typical steps illustrated in Figure 1 are followed.
Suppose  F D o l  is all records in the feature database,  C  is a set of all factors in feature databases,  A  and  B  are the subset of  C A  is called the object variable, and  B  is called the target variable. If  A  and  B  can pass all the PR state thresholds in the significance diagnosis, it can be considered that when factor  A  appears, result  B  also often appears. A PR rule can be written as  A B .
Currently, Support and Confidence are the two most widely used PR indexes for diagnosing relevance significance. However, in real-world scenarios, relying solely on these two indexes is insufficient to fully capture all potential PR rules in a feature database. Therefore, Imbalance Ratio [29] and Kulczynski [30] are introduced.
Support represents the proportion of records containing  A  out of the total number of records in the input database. It measures the relationship between the feature factors in terms of ‘number’.
S u ( A ) = N u m ( A ) N u m ( F D o l )
Assuming that  A  and  B  are two item sets in  F D o l N u m ( )  denotes the cardinality of the fault records in  F D o l  satisfying all the conditions. If  A  and  B  have no common elements, the Support of the PR rule  A B  is denoted as follows:
S u A B = N u m ( A B ) N u m ( F D o l )
Its significance is calculated by comparing the record of failure caused by a specific feature factor with the whole input dataset, eliminating the meaningless rules with low frequency and accordingly discovering the potential PR rules represented by the item sets with high frequency.
Confidence is the proportion of item sets containing both  A  and  B  in the feature database to records containing  A . It is a useful index for assessing the PR of a rule. The formula for Confidence also applies to calculating the probability of a transformer experiencing heavy overload when the overload features or conditions specified in the rules occur.
C o A B = S u B A = S u ( A B ) S u ( A )
Imbalance Ratio measures the imbalance between two item sets within a PR rule. In the real scenario, the problem of sample imbalance is more prominent due to the difficulty of label acquisition or the small number of minority samples. The higher the ImRat value, the more uneven the result. The formula for the Imbalance Ratio is as follows:
I m R a t A B = ( Su A Su B ) ( Su A + Su B S u ( A B ) )
Kulczynski is a symmetry measure that considers Confidence in two directions,  A B  and  B A , which allows Kulczynski to provide a more balanced and symmetric assessment when the data are uneven. This index combines the Confidence and Support of the rule. The formula for Kulczynski is as follows:
K A B = 1 2 · Su A B Su A + S u A B S u B
A PR rule is considered strong if it satisfies more than the minimum thresholds of the four PR indexes in Table 2.

2.2.2. The Establishment of Dynamic Self-Adaptive PR Thresholds (DSPRts)

Traditional PR algorithms use identical and fixed thresholds to determine strong relevance during mining analysis. However, fixed thresholds cannot be applied to all scenarios. In reality, the factors affecting the occurrence of heavy overload in distribution transformers are unevenly distributed in temporal dimensions. One of the primary challenges posed by traditional PR is to refine the PR threshold to accommodate uneven data distribution.
The primary objective of this section is to improve the PR state thresholds by the uneven distribution of data in the temporal dimension. During unusual time series, single and fixed thresholds may result in lower significance scores for overloaded factors. This could cause these factors to fall below the PR state thresholds set during the year, resulting in their designation as low relevance and exclusion from the PR scope. Therefore, it is crucial to adjust the PR state thresholds when mining PR rules for heavy overload faults in transformers to effectively assess the significance of time series. This section proposes a method for calculating DSPRts to efficiently evaluate results under conditions of uneven data distribution in the temporal dimensions.
  • First, divide a year into four seasons, with one season serving as the baseline time series. Then, categorize the collected database data into four time series.
  • Next, improved DSPRts are set based on the significance of each time series.
  • The analysis of factors follows strict criteria: each factor must meet or exceed its time series thresholds to be considered, and it is excluded if it falls below the thresholds.
The introduction of DSPRts can effectively improve the accuracy of mining high-risk factors in unusual time series, allowing a model to more effectively discover rules and trends related to transformer heavy overload. Four DSPRts were set according to the distribution of heavy overload faults in each season:
M _ 1 = { u y F D o l y , 1 }
M _ 2 = { F D o l y , n + 2 = K ( i ) }
M _ 3 0 = { F D o l y , n + 3 = R ( z ) }
M _ 3 1 = { F D o l y , n + 3 = R m a x z }
M i n _ C o 1 = M i n _ C o 0
M i n _ S u 1 = N u m M _ 1 ; M _ 3 0 · M i n S u 0 N u m M _ 1 ; M _ 3 1 × 100 %
M i n _ K 1 = N u m ( M _ 1 ; M _ 3 0 ; M _ 2 ) · M i n _ K 0 N u m ( M _ 1 ; M _ 3 1 ; M _ 2 ) × 100 %
M i n _ I m R a t h 1 = N u m ( M _ 1 ; M _ 3 0 ; M _ 2 ) · M i n _ I m R a t 0 N u m ( M _ 1 ; M _ 3 1 ; M _ 2 ) × 100 %
In the formula,  R ( z )  represents four seasons in a year,  R m a x z  represents the quarter with the highest heavy overload frequency of the distribution transformer,  y = { 2,3 , , m + 1 }  represents a row in the input feature database  F D o l , and the subscript  0  represents the initial thresholds;  K i  represents whether the transformer is heavy-overloaded.

2.2.3. The Establishment of Spatial Conditions Significant Scores Calculation (SCSSC)

Another important problem of the traditional PR algorithm is the use of a fixed significance score calculation method that is insufficient in dealing with the impact of different environmental features on significance scores. In spatial dimensions, the factors affecting the occurrence of heavy overload in distribution transformers are unevenly distributed. The purpose of this section is to quantify the influence of spatially uneven data distribution on the prediction results of heavy overload and to correct any potential interference with the actual results. Since the occurrence of the Unusual High-Risk (UHR) factors in the unusual feature evaluation dataset may have significant consequences, extracting the UHR factors from the unusual factors is imperative.
Furthermore, it is necessary to calculate the significance scores of different forms of unusual factors according to the distribution of unusual factors under different environmental features so that UHR factors strongly associated with the target can be further extracted from the unusual dataset. This paper improves the standard method of calculating significance scores for the four PR indexes: Support, Confidence, Kulczynski, and Imbalance Ratio. It is called the Spatial Conditions Significance Score Calculation (SCSSC) method.
Let  A x 1  and  A y 1  represent a high-frequency relevance set and an unusual set, respectively. Thus, the PR rule  A B  is expanded to include high-frequency and unusual variables:
A x 1 + A y 1 B
When the PR rule  A x 1 + A y 1 B  contains any unusual environmental factor in an environmental feature  S x , the SCSSC of the PR indexes for the unusual factor in the features is calculated as follows:
M _ 4 = { A x 1 F D o l y , M d }
M _ 5 = { F D o l ( y , x ) A y 1 }
T x ( s u ) = N u m ( M _ 1 ; M _ 4 ; M _ 5 ) N u m ( M _ 1 ; M _ 5 ) × 100 %
T x ( C o ) = N u m ( M _ 1 ; M _ 4 ; M _ 5 ; M _ 2 ) N u m ( M _ 1 ; M _ 5 ) × 100 %
T x ( K ) = N u m ( M _ 1 ; M _ 4 ; M _ 5 ; M _ 2 ) N u m ( M _ 1 ; M _ 5 ) · ( 2 + 2 · N u m M _ 1 ; M _ 5 N u m M _ 1 ; M _ 5 ; M _ 2 ) × 100 %
T x ( I i m R a t ) = N u m ( M _ 1 ; M _ 5 ; M _ 2 ) T x ( s u ) · N u m M _ 1 ; M _ 5 × 100 %

2.2.4. The Utilization of MFP-Growth

Compared to other PR rule algorithms, MFP-Growth is an improved algorithm based on the FP-Growth algorithm [31]. The algorithm combines FP-tree and Header to mine frequent items, eliminating the need to reconstruct conditional pattern bases and subtrees, thereby reducing the number of recursive calls. The utilization of Header configuration minimizes algorithmic complexity. Consequently, this enhancement eliminates the requirement to scan the entire dataset for frequent items, resulting in the accelerated mining speed of MFP-Growth.

2.3. Component Significance Diagnostic (CSD) Model

This section aims to investigate the methodology for assessing the impact of the high-frequency and unusual sets on overall system risk, considering that the feature factors leading to heavy overloads on distribution transformers were characterized by a nonlinear distribution and that the high-frequency set and the unusual set had different calculations of overall system risk. A new method for calculating the weight of risk impact, based on component significance (CS) analysis, is proposed for feature factors in multi-source complex nonlinear scenarios [32]. This method can determine the relative risk weights of each factor by directly measuring the trend and magnitude of its change on the overall system risk, rather than linearly weighting the factors by data proportion or frequency of appearance.

The Establishment of a CSD Model for Overall System Risk

The overall system risk of a comprehensive analysis is typically contingent upon the risk levels associated with its components. The components represent the factors under different features. For instance, in winter, the heightened use of heating systems due to cold weather precipitates a swift escalation in load rates. Daytime sees a surge in load due to the production activities of most factories and human life. Moreover, elevated ambient temperatures contribute to a rise in the internal temperature of the transformer. Consequently, load rate and temperature bear significant weight in determining the risk of transformer overload.
In contrast to these common factors, UHR factors have a significant impact on overall system risk, even though they are unusual. To comprehensively analyze the impact of each UHR factor on failure outcomes in realistic nonlinear scenarios, a CSD model was developed. This model enabled the determination of the relative risk impact weights of each feature factor based on the degree to which they affected overall system risk.
To distinguish the relative risk impact weights of the UHR factors, this study constructed a UHR variable subspace  X h h : a collection of all UHR factors in a feature  S x . In addition,  S y x 1  and  S x y 1  represent all the high-frequency relevance factors and the UHR factors in this feature, respectively. The relative risk impact weights  μ v x , k  of a factor  v x , k S x  include two parts: ( μ x , k x 1  and  μ x , k y 1 ).  μ x , k x 1  represents the risk impact weights of  S y x 1  and  μ x , k y 1  represents the risk impact weights of  S x y 1 .
Here, the formula of  μ x , k x 1  is expressed as follows:
μ x , k x 1 = y = 2 N u m ( u y F D o l )   N u m ( F D o l y , x =   v x , k ) N u m ( m )         ,   v x , k   S y x 1
In the formula,  N u m ( m )  represents the cardinality of all fault records in the  F D o l .
For UHR factors, the key lies in identifying and processing the most significant components. CS serves as an index for measuring the significance of components of overall system function and performance. Specifically, it measures how much input factor  v x , k  contributes to system failure when a fault is detected. Therefore, this section aims to quantify the potential impact of UHR factors on the system by analyzing the CS.
S C S ( v x , k ) = 1 F ( J ( n ) ) · S B ( J y ( n ) )
In the formula,  J y ( n )  represents the component’s risk of occurrence and  F ( J ( n ) )  represents the overall system failure risk.  S B  denotes Birnbaum’s significance [33], which describes the impact of changes in component reliability on the overall system. Therefore, solving  μ x , k y 1  is solving the  S C S ( v x , k )  of the UHR factors.
Within a distribution transformer system, the occurrence of a fault record consists of a single factor under different features, and all feature conditions must appear for a fault to occur. Any missing condition will prevent the fault from occurring. Given the assumed relative independence of each environmental factor, the computation of the overall system failure risk becomes feasible. The risk of overall system failure  F J n  and the UHR factors  μ x , k y 1  can be expressed as follows:
T u m = y = 2 N u m ( u y X h h ) N u m ( u y F D o l y , 1 ; F D o l y , x = v x , k ) N u m ( S y F D o l y , 1 ; F D o l y , x   S x )
F J n = x = 2 n + 1 1 k = 1   l T u m
μ x , k y 1 = S C S v x , k = T u m · F 1 y , J n x = 2 n + 1 1 k = 1   l T u m T u m · F 0 y , J n x = 2 n + 1 1 k = 1   l T u m
F 1 y , J n  represents the risk of failure of the system as a whole when the factor  v x , k  is determined to be associated, indicating the component’s failure risk as  1 F 0 y , J n  represents the risk of failure of the system as a whole when the factor  v x , k  is determined to be irrelevant, indicating the component’s failure risk as  0 . Hence, the relative risk impact weights of a factor  v x , k  are expressed as follows:
μ v x , k = μ x , k x 1 + μ x , k y 1 = y = 2 N u m ( u y F D o l )   N u m ( F D o l y , x =   v x , k ) N u m ( m ) + T u m · F 1 y , J n x = 2 n + 1 1 k = 1   l T u m T u m · F 0 y , J n x = 2 n + 1 1 k = 1   l T u m

2.4. The Operation Procedure of the TCCPR-CSD Classifier Model

This paper introduces a novel integrated method combining the TCCPR and CSD models (TCCPR-CSD). The specific implementation process was as follows:
  • Data collection and integrated solution: Based on the input features of the distribution transformer, pertinent data were collected and integrated with risk values associated with various factors, encompassing both external and internal environmental features.
  • Establishment of Dynamic Self-adaptive PR thresholds in the temporal dimensions: Based on the training data in the database, all factors included in a feature were comprehensively analyzed using four significant PR indexes. The identification of exceptional datasets was accomplished by comparing the calculated DSPRts, as determined by Formulas (19)–(21).
  • Establishment of SCSSC in the spatial dimensions: The fault records containing any unusual factors in this feature were classified in the unusual dataset  A y 1 and the UHR factors based on these unusual datasets were mined by Formulas (24)–(27) to characterize the potential influence on distribution transformers.
  • The sequential repetition of steps (1–3) was applied to each environmental feature in the training dataset.
  • The results of the SCSSC were compared against the DSPRts to identify UHR factors in unusual datasets.
  • Establishment of risk impact weights measure method for the CSD model: The relative risk impact weights  μ v x , k of each feature factor were calculated by Formula (33) and then the final predicted failure risk level was calculated for each failure record.
  • Performance verification: Finally, (0→1: impossible to occur→certain to occur) was normalized and the predicted failure risk level was compared with the actual overload records (0 or 1: occurred or not occurred) in the test set to verify the performance of the predictive model in this study.
Combined with the above steps, the TCCPR-CSD classifier model is depicted in Figure 2.

3. Empirical Case Study

3.1. Data Description

Consider the historical records of a power grid company in Southern China from February 2018 to March 2020 as an illustration. This study focused on 30,511 fault data points, valuable for data mining. The main objective was to explore PR rules between heavy overload faults in transformers and environmental factors. A set of 21 features was collected to validate the proposed method. The simulation analysis utilized the ten-fold cross-validation method, with 70% of the historical data records as the training set, 10% as the validation set, and 20% as the test set. To validate the simulation data and accurately assess the model’s performance, Receiver Operating Characteristic (ROC) [34] curves and Precision-Recall (P-R) [35] curves were plotted. These curves were based on metrics like True Positive (TP) rate, False Positive (FP) rate, Recall rate, and Precision rate from the confusion matrix.
The P-R curve assesses the performance of a classifier by plotting the Precision rate against the Recall rate at various thresholds (0 to 1). The Area Under Curves (AUC-PR) can quantify a classifier’s overall performance, which is especially valuable in dealing with imbalanced datasets. The P-R curve provides a significant performance metric as it offers meaningful performance measures even when positive samples are scarce. The ROC curve plots the FP rate on the X-axis and the TP Rate on the Y-axis across different threshold settings, evaluating a classifier’s ability to distinguish between positive and negative class samples. Similar to the P-R curve, the area under the ROC curve (AUC-ROC) also quantifies a classifier’s performance. This is shown in Figure 3.
AUC provides a quantifiable means to evaluate the performance of a model across all possible classification thresholds. The closer a classifier’s performance is to 1, the better it is considered to be. The confusion matrix is shown in Table 3.
The related formulas of TP Rate, FP Rate, Recall Rate, and Precision Rate can be obtained from the confusion matrix, as shown in Table 4.
The environmental features selected for this example and the factors included are shown in Table 5. The continuous factor was continuously discretized based on historical experience.
Our initial task was to apply the TCCPR model for high-risk data mining to the selected data. We paid special attention to the UHR component to ensure its effective inclusion in the risk assessment, resulting in a comprehensive and accurate evaluation. The four initial PR thresholds were designed:  M i n _ S u 0 = 0.2 ,   M i n _ K 0 = 0.7 , M i n _ C o 0 = 0.6 , M i n _ I m R a t 0 = 2.5 . After that, four DSPRts and SCCSC were calculated by Formulas (17)–(20) and (24)–(27). Based on the environmental features listed in Table 5, we applied the TCCPR model to extract features and obtained the UHR factors presented in Table 6. Based on the CSD model, the relative risk weights of each factor were obtained and summed up to form the final risk level.

3.2. Classification Performance Analysis

To validate the accuracy of the proposed method, this study first compared the TCCPR-CSD model with two standard PR classifier models. These two classifiers included the Pattern Recognition-Appearance Frequency (PR-AF) model with traditional PR and appearance frequency for weighting and the Pattern Recognition-Component Significance Diagnostic (PR-CSD) model with traditional PR and the CSD model. In addition, the TCCPR-CSD model was compared with three other classifier models, namely, the BA-PNN, MCNN, and SVM models.
The comparative analysis of the ROC curves of the revised classifier with the standard and other classifier models is shown in Figure 4 and Table 7.
The comparative analysis of the P-R curves of the revised classifier with the standard and other classifier models is shown in Figure 5 and Table 8.
The TCCPR-CSD classifier model had a particularly high AUC value for the P-R curves. This can be attributed to the model’s ability to consider various features of a dataset in real-world scenarios with differing distributions for UHR factors. Therefore, the combination of the modified TCCPR and CSD models could achieve a more accurate diagnosis of heavy overload. The comparison between the TCCPR-CSD classifier model and other external classifier models also shows that the method could achieve a better performance than that for existing common machine learning methods in the face of high-dimensional data and imbalanced nonlinear data distribution.

3.3. Failure Cause Analysis

To enhance the comprehensive and in-depth analysis of model performance, this section focuses on both the running time of each model and the AUC uncertainty of the curve. Figure 6 displays the test time for the classification model. The computational complexity of the other classification models increased significantly when more factors were considered, and they took significantly longer to run than the PR classification model. The results indicate that PR model predictions are more efficient when processing large amounts of complex data.
In reality, due to the randomness of the sample, the complexity of the data distribution, and the limitations of the model itself, there were often some variations and uncertainty in the AUC value. To address this uncertainty, this part introduces the standard error and confidence interval as evaluation indexes, as shown in Figure 7.
It can be seen that the TCCPR-CSD model achieved an average improvement of 33.3% in confidence interval and an average decrease of 20% in standard errors compared to the PR-CSD model, an average improvement of 42.8% in confidence interval and an average decrease of 41.7% in standard errors compared to the PR-AF model, an average improvement of 20% in confidence interval and an average decrease of 17.6% in standard errors compared to the BA-PNN model, an average improvement of 42.8% in confidence interval and an average decrease of 37.8% in standard errors compared to the MCNN model, and an average improvement of 52.9% in confidence interval and an average decrease of 54.8% in standard errors compared to the SVM model.

3.4. Algorithms Analysis

To optimize the operation speed of the integrated model, the MFP-Growth algorithm was utilized in this study. The algorithm combined with TCCPR-CSD was compared with other PR algorithms, as shown in Figure 8.
Figure 8 shows that the MFP-Growth algorithm discussed in this section reduced running time by 21.71% compared to the FP-Growth algorithm, by 30.81% compared to the ECLAT algorithm, and by 43.74% compared to the Apriori algorithm. After comparing the results, it was evident that the accuracy and efficiency were significantly improved. As a result, the TCCPR-CSD classifier model, based on the MFP-Growth algorithm, could precisely reflect the mapping relationship between input features and output. This model provided faster running times and higher classification accuracy. Additionally, it was suitable for uneven data environments, enabling the effective guidance of overload prediction for distribution transformers.

4. Conclusions

To attain accurate and reasonable heavy overload predictions for distribution transformers in some real-world application scenarios characterized by imbalance or nonlinear data distributions, this paper proposed a novel integrated method for spatiotemporal distribution prediction based on the TCCPR-CSD ensemble. The main conclusions are outlined as follows:
  • In data imbalanced distributions, some rarely occurring environmental condition factors may also be risky ones. Thus, the TCCPR model was built to incorporate UHR factors in spatiotemporal dimensions and different temporal risks from each time series when analyzing the feature factors that affected the occurrence of transformer heavy overload. On the one hand, the four Dynamic Self-adaptive PR thresholds were designed to account for imbalanced risk distributions in temporal dimensions. On the other hand, SCSSC was developed to work out the conditional significance scores that identified UHR factors from the imbalanced distribution of data in spatial dimensions.
  • In data nonlinear distributions, data proportion or appearance frequency cannot be simply viewed as impacting the whole system risk. Therefore, the CSD model was designed to evaluate the relative impacting weights of each distinguished risky environmental factor directly through the trend and magnitude of variations of the overall system failure risk level caused by them. This comprehensively considered the impact of factors with different characteristics on system risk and accurately assessed the relative risk weights of each factor.
  • According to the empirical case study, the proposed TCCPR model effectively extracted UHR factors from the unusual components. Additionally, the CSD model had higher accuracy and rationality compared to the traditional linear weight calculation method based on the frequency of occurrence of fixed factors. By combining these two, the integrated model accurately predicted heavy overloads in scenarios with multi-source and imbalanced data distributions under spatiotemporal conditions. The prediction outcomes can serve as a reference for the allocation and arrangement of operation and maintenance work. This helps to prevent equipment damage and environmental pollution caused by heavy overload, contributing to a more reliable and sustainable power supply.

Author Contributions

Conceptualization, Y.L. and C.S.; methodology, Y.L. and C.S.; software, Z.G. and J.S.; validation, Z.J. and X.Y.; formal analysis, C.S.; investigation, Y.L. and Z.G.; resources, C.S.; data curation, Z.J. and X.Y.; writing—original draft preparation, Y.L. and J.S.; writing—review and editing, Y.L. and Z.G.; visualization, Z.J.; supervision, X.Y.; project administration, C.S.; funding acquisition, C.S., Z.J. and X.Y.; All authors have read and agreed to the published version of the manuscript.

Funding

This work was supported by the Natural Science Foundation of China (52207074, 52177015), the Natural Science Foundation of Hunan (2024JJ9175), the Key Project of the Provincial Education Department of Hunan (23A0255), the Natural Science Foundation of Changsha (kq2208231), and the Innovation and Entrepreneurship Training Program of Changsha University of Science & Technology College Students (S202310536184).

Institutional Review Board Statement

Not applicable.

Informed Consent Statement

Not applicable.

Data Availability Statement

The raw data supporting the conclusions of this article will be made available by the authors upon request.

Conflicts of Interest

We wish to confirm that there are no known conflicts of interest associated with this publication and there has been no significant financial support for this work that could have influenced its outcome. We confirm that the manuscript has been read and approved by all named authors and that there are no other persons who satisfied the criteria for authorship but are not listed. We further confirm that the order of authors listed in the manuscript has been approved by all of us. We confirm that we have given due consideration to the protection of intellectual property associated with this work and that there are no impediments to publication, including the timing of publication, with respect to intellectual property. In so doing, we confirm that we have followed the regulations of our institutions concerning intellectual property.

References

  1. Prasath, T.M.; Kirubakaran, V. A real time study on condition monitoring of distribution transformer using thermal imager. Infrared Phys. Technol. 2018, 90, 78–86. [Google Scholar]
  2. Naeem, M.F.; Hashmi, K.; Kashif, S.A.R.; Khan, M.M.; Alghaythi, M.L.; Aymen, F.; Ali, S.G.; AboRas, K.M.; Ben Dhaou, I. A novel method for life estimation of power transformers using fuzzy logic systems: An intelligent predictive maintenance approach. Front. Energy Res. 2022, 10, 977665. [Google Scholar] [CrossRef]
  3. Biçen, Y.; Aras, F.; Kirkici, H. Lifetime estimation and monitoring of power transformer considering annual load factors. IEEE Trans. Dielectr. Electr. Insul. 2014, 21, 1360–1367. [Google Scholar] [CrossRef]
  4. Lin, C.H.; Wu, C.H.; Huang, P.Z. Grey clustering analysis for incipient fault diagnosis in oil-immersed transformers. Expert Syst. Appl. 2009, 36, 1371–1379. [Google Scholar] [CrossRef]
  5. Cheng, L.; Yu, T. Dissolved Gas Analysis Principle-Based Intelligent Approaches to Fault Diagnosis and Decision Making for Large Oil-Immersed Power Transformers: A Survey. Energies 2018, 11, 913. [Google Scholar] [CrossRef]
  6. Liu, Z.; Wang, S.; Tang, B. Transformer fault identification based on the cuckoo search algorithm and DBN model. J. Electr. Power Sci. Technol. 2022, 37, 3–11. [Google Scholar]
  7. Wu, Q.; Zhang, H. A Novel Expertise-Guided Machine Learning Model for Internal Fault State Diagnosis of Power Transformers. Sustainability 2019, 11, 1562. [Google Scholar] [CrossRef]
  8. Huang, X.; Zhang, F.; Li, H.; Liu, X. An online technology for measuring icing shape on conductor based on vision and force sensors. IEEE Trans. Instrum. Meas. 2017, 66, 3180–3189. [Google Scholar] [CrossRef]
  9. Huang, X.; Zhao, L.; Chen, G. Design of a wireless sensor module for monitoring conductor galloping of transmission lines. Sensors 2016, 16, 1657. [Google Scholar] [CrossRef]
  10. Jalilian, M.; Sariri, H.; Parandin, F.; Karkhanehchi, M.M.; Hookari, M.; Jirdehi, M.A.; Hemmati, R. Design and implementation of the monitoring and control systems for distribution transformer by using GSM network. Int. J. Electr. Power Energy Syst. 2016, 74, 36–41. [Google Scholar] [CrossRef]
  11. Gorgan, B.; Notingher, P.V.; Wetzer, J.M.; Verhaart, H.F.A.; Wouters, P.A.A.F.; Van Schijndel, A. Influence of solar irradiation on power transformer thermal balance. IEEE Trans. Dielectr. Electr. Insul. 2012, 19, 1843–1850. [Google Scholar] [CrossRef]
  12. Taheri, A.A.; Abdali, A.; Rabiee, A. Indoor distribution transformers oil temperature prediction using new electro-thermal resistance model and normal cyclic overloading strategy: An experimental case study. IET Gener. Transm. Distrib. 2020, 14, 5792–5803. [Google Scholar] [CrossRef]
  13. Shadab, S.; Hozefa, J.; Sonam, K.; Wagh, S.; Singh, N.M. Gaussian process surrogate model for an effective life assessment of transformer considering model and measurement uncertainties. Int. J. Electr. Power Energy Syst. 2022, 134, 107401. [Google Scholar] [CrossRef]
  14. Behkam, R.; Karami, H.; Naderi, M.S.; Gharehpetian, G.B. Generalized regression neural network application for fault type detection in distribution transformer windings considering statistical indices. COMPEL Int. J. Comput. Math. Electr. Electron. Eng. 2022, 41, 381–409. [Google Scholar] [CrossRef]
  15. Bacha, K.; Souahlia, S.; Gossa, M. Power transformer fault diagnosis based on dissolved gas analysis by support vector machine. Electr. Power Syst. Res. 2012, 83, 73–79. [Google Scholar] [CrossRef]
  16. Sun, Y.; Ma, S.; Sun, S.; Liu, P.; Zhang, L.; Ouyang, J.; Ni, X. Partial discharge pattern recognition of transformers based on MobileNets convolutional neural network. Appl. Sci. 2021, 11, 6984. [Google Scholar] [CrossRef]
  17. Yang, X.; Chen, W.; Li, A.; Yang, C.; Xie, Z.; Dong, H. BA-PNN-based methods for power transformer fault diagnosis. Adv. Eng. Inform. 2019, 39, 178–185. [Google Scholar] [CrossRef]
  18. Huang, Y.C.; Sun, H.C. Dissolved gas analysis of mineral oil for power transformer fault diagnosis using fuzzy logic. IEEE Trans. Dielectr. Electr. Insul. 2013, 20, 974–981. [Google Scholar] [CrossRef]
  19. Xiao, Y.; Pan, W.; Guo, X.; Bi, S.; Feng, D.; Lin, S. Fault diagnosis of traction transformer based on Bayesian network. Energies 2020, 13, 4966. [Google Scholar] [CrossRef]
  20. Lakehal, A.; Tachi, F. Bayesian duval triangle method for fault prediction and assessment of oil immersed transformers. Meas. Control 2017, 50, 103–109. [Google Scholar] [CrossRef]
  21. Ma, H.; Yang, P.; Wang, F.; Wang, X.; Yang, D.; Feng, B. Short-Term Heavy Overload Forecasting of Public Transformers Based on Combined LSTM-XGBoost Model. Energies 2023, 16, 1507. [Google Scholar] [CrossRef]
  22. Yang, Z.; Shen, Y.; Zhou, R.; Yang, F.; Wan, Z.; Zhou, Z. A transfer learning fault diagnosis model of distribution transformer considering multi-factor situation evolution. IEEJ Trans. Electr. Electron. Eng. 2020, 15, 30–39. [Google Scholar] [CrossRef]
  23. Hong, K.; Jin, M.; Huang, H. Transformer winding fault diagnosis using vibration image and deep learning. IEEE Trans. Power Deliv. 2020, 36, 676–685. [Google Scholar] [CrossRef]
  24. Zhang, X.; Tang, Y.; Liu, Q.; Liu, G.; Ning, X.; Chen, J. A fault analysis method based on association rule mining for distribution terminal unit. Appl. Sci. 2021, 11, 5221. [Google Scholar] [CrossRef]
  25. Wang, X.; Yan, Z.; Zeng, Y.; Liu, X.; Peng, X.; Yuan, H. Research on correlation factor analysis and prediction method of overhead transmission line defect state based on association rule mining and RBF-SVM. Energy Rep. 2021, 7, 359–368. [Google Scholar] [CrossRef]
  26. Sheng, G.; Hou, H.; Jian, X.; Chen, Y. A novel association rule mining method of big data for power transformers state parameters based on probabilistic graph model. IEEE Trans. Smart Grid 2016, 9, 695–702. [Google Scholar] [CrossRef]
  27. Li, L.; Cheng, Y.; Xie, L.J.; Jiang, L.-Q.; Ma, N.; Lu, M. An integrated method of set pair analysis and association rule for fault diagnosis of power transformers. IEEE Trans. Dielectr. Electr. Insul. 2015, 22, 2368–2378. [Google Scholar] [CrossRef]
  28. Agrawal, R.; Imieliński, T.; Swami, A. Mining association rules between sets of items in large databases. In Proceedings of the 1993 ACM SIGMOD International Conference on Management of Data, Washington, DC, USA, 25–28 May 1993. [Google Scholar]
  29. He, H.; Zhang, W.; Zhang, S. A novel ensemble method for credit scoring: Adaption of different imbalance ratios. Expert Syst. Appl. 2018, 98, 105–117. [Google Scholar] [CrossRef]
  30. Kashan, A.H.; Akbari, A.A.; Ostadi, B. Grouping evolution strategies: An effective approach for grouping problems. Appl. Math. Model. 2015, 39, 2703–2720. [Google Scholar] [CrossRef]
  31. Shawkat, M.; Badawi, M.; El-Ghamrawy, S.; Arnous, R.; El-Desoky, A. An optimized FP-growth algorithm for discovery of association rules. J. Supercomput. 2022, 78, 5479–5506. [Google Scholar] [CrossRef]
  32. Espinoza, S.; Poulos, A.; Rudnick, H.; de la Llera, J.C.; Panteli, M.; Mancarella, P. Risk and Resilience Assessment with Component Criticality Ranking of Electric Power Systems Subject to Earthquakes. IEEE Syst. J. 2020, 14, 2837–2848. [Google Scholar] [CrossRef]
  33. Miziuła, P.; Navarro, J. Birnbaum Importance Measure for Reliability Systems with Dependent Components. IEEE Trans. Reliab. 2019, 68, 439–450. [Google Scholar] [CrossRef]
  34. Fawcett, T. An introduction to ROC analysis. Pattern Recognit. Lett. 2006, 27, 861–874. [Google Scholar] [CrossRef]
  35. Keilwagen, J.; Grosse, I.; Grau, J. Area under precision-recall curves for weighted and unweighted data. PLoS ONE 2014, 9, e92209. [Google Scholar] [CrossRef] [PubMed]
Figure 1. Flow chart of the PR algorithm.
Sustainability 16 03110 g001
Figure 2. The TCCPR-CSD classifier model flow chart.
Sustainability 16 03110 g002
Figure 3. ROC curves and P-R curves.
Sustainability 16 03110 g003
Figure 4. Comparison of classifier models via ROC curves: (a) revised and standard classifiers; (b) revised and other classifier models.
Sustainability 16 03110 g004
Figure 5. Comparison of classifier models via P-R curves: (a) revised and standard classifiers; (b) revised and other classifier models.
Sustainability 16 03110 g005
Figure 6. Comparison of classifier model test times.
Sustainability 16 03110 g006
Figure 7. Comparison of prediction performance: (a) confidence interval; (b) standard error.
Sustainability 16 03110 g007
Figure 8. Comparison of PR algorithm test results.
Sustainability 16 03110 g008
Table 1. Environmental factors of distribution transformer heavy overload.
Nature FactorsSystem FactorsDevice Factors
DateLoadDevice age
WeatherVoltageRated capacity
TopographicalCurrentCooling efficiency
Flora and faunaPhaseShort time capacity
Table 2. Four minimum thresholds.
PR IndexesMinimum Thresholds
Support M i n _ S u
Confidence M i n _ C o
Kulczynski M i n _ K
Imbalance Ratio M i n _ I m R a t
Table 3. Confusion matrix.
PredictionReality
TrueFalse
NegativeFNTN
PositiveTPFP
Table 4. Related formulas of TP rate, FP rate, Recall rate, and Precision rate.
Classifier MetricsFormulas
TP Rate T P / ( T P + F N )
FP Rate F P / ( T N + F P )
Recall Rate T P / ( F N + T P )
Precision Rate T P / ( T P + F P )
Table 5. Summary of the selected environment features.
FeaturesFactor Type
Heavy overload1,0
Day1–31
Hour1–24
Month1–12
SeasonSpring, Summer, Autumn, Winter
TopographyPlains, Hills, Plateaus, Basins, Mountains
WeatherSunny, Rainy, Cloudy, Snowy
Device ageYears
Voltage level10 KV, 35 KV, 110 KV, 220 KV, 330 KV, 500 KV
Extreme weather durationDays
Rated capacitykVA
Short time capacitykVA
Continuous featuresLoad balance rate, Plant distribution rate, Animal activity density, Average temperatures, Relative humidity, Average illumination, Cooling efficiency, Relative humidity, Current and voltage phase
Table 6. Summary of the UHR factors.
FeaturesUHR Factor Type
Month2, 3, 10, 11, 12
SeasonAutumn, Winter
WeatherCloudy
TopographyPlains, Hills, Mountains
Voltage level110 KV, 500 KV
All unusual featuresShort time capacity, Extreme weather duration, Animal activity density, Average temperatures, Relative humidity, Average illumination, and Relative humidity
Table 7. The AUC (ROC) values of revised and standard classifiers and other classifier models.
Classifier ModelsAUC (ROC)%Classifier ModelsAUC (ROC)%
TCCPR-CSD93.15BA-PNN 88.96
PR-CSD84.86MCNN86.14
PR-AF81.21SVM83.12
Table 8. The AUC (P-R) values of revised and standard classifiers and other classifier models.
Classifier ModelsAUC (P-R)%Classifier ModelsAUC (P-R)%
TCCPR-CSD93.62BA-PNN 89.81
PR-CSD85.49MCNN86.53
PR-AF81.91SVM83.76
Disclaimer/Publisher’s Note: The statements, opinions and data contained in all publications are solely those of the individual author(s) and contributor(s) and not of MDPI and/or the editor(s). MDPI and/or the editor(s) disclaim responsibility for any injury to people or property resulting from any ideas, methods, instructions or products referred to in the content.

