Abstract
In the summer of 2022, an intense heatwave swept through Northern Europe, with London bearing a significant impact. While nature-based solutions are often considered to be ideal responses to such heatwaves, experiences from the 2022 heatwave and others revealed potential drawbacks, particularly for urban green spaces. Prolonged dry spells, frequently accompanying heatwaves, result in excessively dry soil and the subsequent decline of vegetation in large parks. In the present study, microclimate simulations were conducted for Hyde Park in London, a location that experienced such drought during the 2022 heatwave, to examine its microclimatic performance in terms of thermal comfort and tree health. In alignment with the observations, ENVI-met could replicate the lack of noticeable cooling effects during the daytime and only marginal cooling during the nighttime. To address these challenges, mitigation scenarios were explored, incorporating heat mitigation measures such as part-time irrigation, temporary sun sails, and façade greenery. The findings demonstrated that implementing these measures could reduce heat stress by up to 13 K PET (physiologically equivalent temperature). These practical solutions emerged as effective remedies for mitigating the impact of heatwaves on urban green spaces and, hence, improving future urban development overall.
1. Introduction
In the last decade, Europe has experienced a notable increase in the frequency and severity of heatwaves, even extending up to the traditionally cooler northern regions [1]. This trend was exemplified by the 2022 heatwaves that hit the United Kingdom from June to August, where air temperatures exceeding 40 °C led to widespread ecological damage, including droughts, desiccated riverbeds, wildfires, and the spread of diseases, harming ecosystems all over the country [2,3,4]. The significant impact on public health—indicated by a rise in heat-related mortality exceeding 3400 deaths—categorizes UK to be among those in Europe which experience notably elevated levels of heat-related fatalities during the summer period [5,6].
This persistence of heatwaves in Europe is often associated with atmospheric blocking patterns, wherein high-pressure systems stagnate over a region, prolonging extreme weather conditions such as heatwaves, heavy rainfall, or cold spells [7,8,9]. Urban areas, which tend to absorb and retain more heat than their surroundings, experience intensified heat during these events, exacerbating the formation of heat islands and posing challenges to urban residents [10,11]. Projections indicate that as climate change continues, the frequency of these summer blocking events is likely to increase, further deteriorating urban climate conditions [12,13]. Given the challenges faced by London during the 2022 heatwave, characterized by the interaction of local urban heat islands (UHIs) and broader climatic shifts, it is evident that extreme weather events may occur more frequently in northern regions of Europe in the future due to climate change [12,14,15]. This underscores the necessity to prepare our cities for the increased occurrence of such extreme events [16].
The severe impact of this crisis was evident in Britain’s urban areas, revealing significant inadequacies in their capacity to manage such conditions [17]. City parks, vital for mitigating the UHI effect [18], became deserted landscapes due to water scarcity and intense heat [19]. In the context of urban resilience and climate change adaptation, nature-based solutions (NBSs) have emerged as potential strategies to mitigate the impacts of extreme weather events [20,21]. However, the effectiveness of NBSs, such as large urban green spaces, during extreme events like the 2022 heatwave in London, is not straightforward [22]. The severity of the situation underscores the need for researchers, urban planners, and landscape architects to devise new strategies aimed at transforming cities and their green spaces into resilient structures capable of enduring future climate impacts [23]. This necessitates a reevaluation of urban green spaces and the overcoming of outdated concepts regarding city landscapes.
Gaining insights into the complex dynamics of urban heat stress during the 2022 heatwave in London is essential for devising effective adaptation strategies and resilience measures. Microclimate simulations, facilitated by tools such as ENVI-met, provide a valuable method for analyzing the thermal behavior of urban environments with high spatial resolution [24,25,26]. Using these modeling approaches, researchers can evaluate how various design elements, vegetation distribution, and land use configurations impact local microclimates, thereby informing about targeted interventions aimed at improving thermal comfort and mitigating heat stress.
In recognition of this, the study conducts a thorough analysis of the performance of an urban green space in London during the extreme events of 2022. London’s urban green spaces, often referred to as the “green lungs” of the city, vary in size and shape, enhancing the urban landscape and providing extensive recreational opportunities for the city’s residents [27,28]. Moreover, they play a vital role in promoting urban biodiversity by creating habitats for diverse animal and plant species [29]. Among these green spaces, Hyde Park stands out, covering over 350 acres in the heart of London. The park’s popularity is further accentuated by its diverse cultural events, with the expansive Parade Ground serving as a renowned year-round venue for festivals such as the British-Summer-Time Festival and Winter Wonderland, appealing to both locals and tourists alike. However, during the summer of 2022, its media coverage primarily featured images depicting its previously verdant and meticulously tended grasslands, now rendered parched and barren fields as a result of the heatwaves.
It should hence be a common objective to develop strategies that improve human thermal comfort and promote vegetational health both within and outside of the park, while preserving its unique character and socioeconomic functions. The study subsequently assesses the efficacy of these strategies and initiates discussions on the essential rethinking of urban parks to adequately address the challenges posed by future climate change. Assessing Hyde Park’s microclimate dynamics and evaluating current heat mitigation measures within the park are crucial for informing evidence-based strategies aimed at enhancing its resilience to future heat events [30,31,32]. The present study hence finds itself within a wide field of different topics and directions revolving around urban climate and possible heat mitigation measures. Related studies, for example, covered specific measures like cool surfaces or cool/green roofs [33,34,35], the correct tree selection [36], an ideal green space arrangement regarding trees’ leaf temperatures [37], or specific site studies [38,39]. London-specific studies comprise, for example, an investigation of UHI measurements [40] and a mesoscale modeling study [41]. While previous studies often focused on already hot and arid regions like the Mediterranean or Hong Kong, heat stress investigations for Northern Europe and London in particular were marginally existent. Following the 2022 heatwave, the topic’s relevancy for this region rose strongly and resulted, for example, in the microclimate modeling analysis of different green coverage and cool pavement configurations [42]. This study now aims to bridge a gap between general advice about heat mitigation measures from sensitivity studies and site-specific measures that have been applied in different climate zones already. It seeks to evaluate the cooling impact of realistic urban planning scenarios for a famous site in one of the largest and most popular metropolitan regions worldwide.
2. Materials and Methods
To evaluate the impact of different heat mitigation measures on thermal comfort and plant health, microclimate simulations were conducted with the holistic three-dimensional model ENVI-met [43,44,45,46]. Different validation studies found the model to accurately resemble parameters like air temperature/air humidity/wind speed [24,47,48], mean radiant temperatures (MRT) [49], or plant water flux [50], hence representing a viable tool for the study. In the following, the simulation setup (Section 2.1) as well as the analyzed parameters regarding outdoor thermal comfort (Section 2.2) and plant health (Section 2.3) are presented.
2.1. Simulation Setup
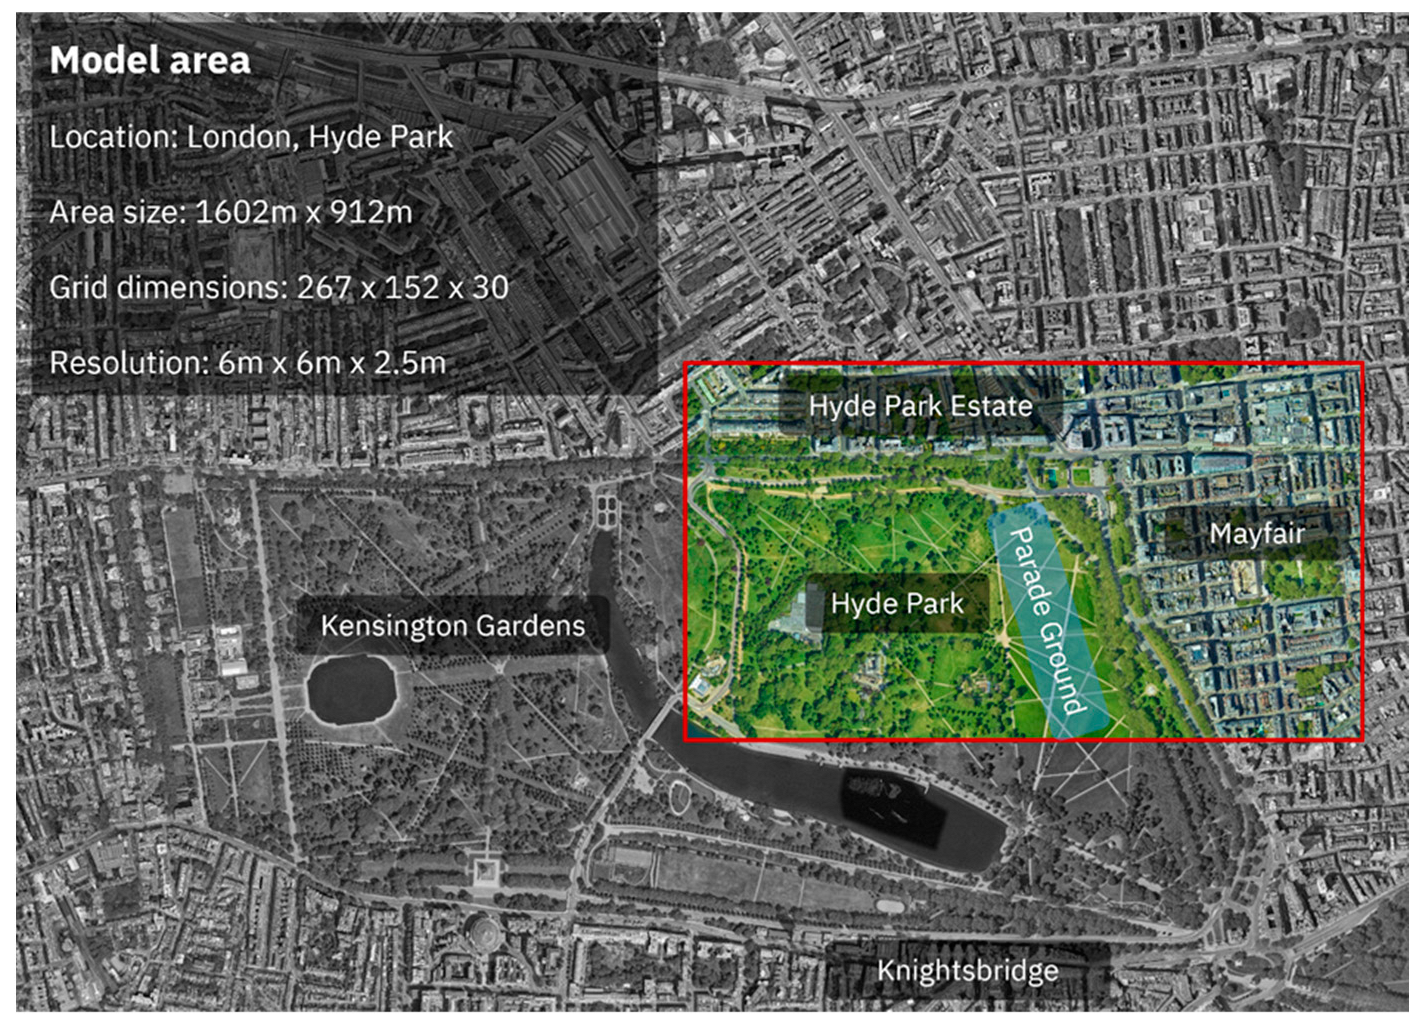
To reduce simulation time while keeping a reasonably high resolution, the model area for the investigation only covers the northeastern part of Hyde Park (Figure 1). Additionally, it includes parts of the city districts Mayfair and Hyde Park Estate in order to analyze both the microclimatic conditions within the park and the surrounding built-up areas. Furthermore, it allows the investigation of possible park cooling effects on surrounding areas. The model area’s extent equals 1602 × 912 m with a grid resolution of 6 × 6 × 2.5 m.

Figure 1.
Model area dimensions.
The model area creation was performed using the Geodata to ENVI-met plugin in QGIS. Building footprints and heights were obtained by the EMU Analytics dataset for London [51], tree data were provided by the Royal Parks organization [52], and soil profiles were digitized using satellite imagery. All buildings were defined with the insulated concrete wall/roof material ID 000000.
Two areas are expected to exhibit strong signs of thermal hazards. The first area is the large Parade Ground, which is assumed to show very high heat stress. However, implementing effective strategies to enhance thermal comfort in this area poses challenges due to its use for events requiring ample space. Permanent structures or vegetation are not feasible due to the limitations, necessitating the adoption of compact and easily removable measures as the most viable option. The second problematic area comprises the built-up regions surrounding Hyde Park. These areas are characterized by imperviousness and limited space, requiring measures that can accommodate these constraints. In response to these considerations, the following three scenarios were developed containing mitigating measures:
- By applying 5 liters of water per square meter every morning and evening all over Hyde Park, the irrigation strategy aims to provide essential moisture to the vegetation. This practice should prevent excessive drying of the soil, supporting the vitality of plants and contributing to the overall cooling effect within the park. While it may not be feasible to scale this irrigation strategy to cover the entire park, it can serve as a model for identifying specific areas where targeted irrigation can make a notable difference.
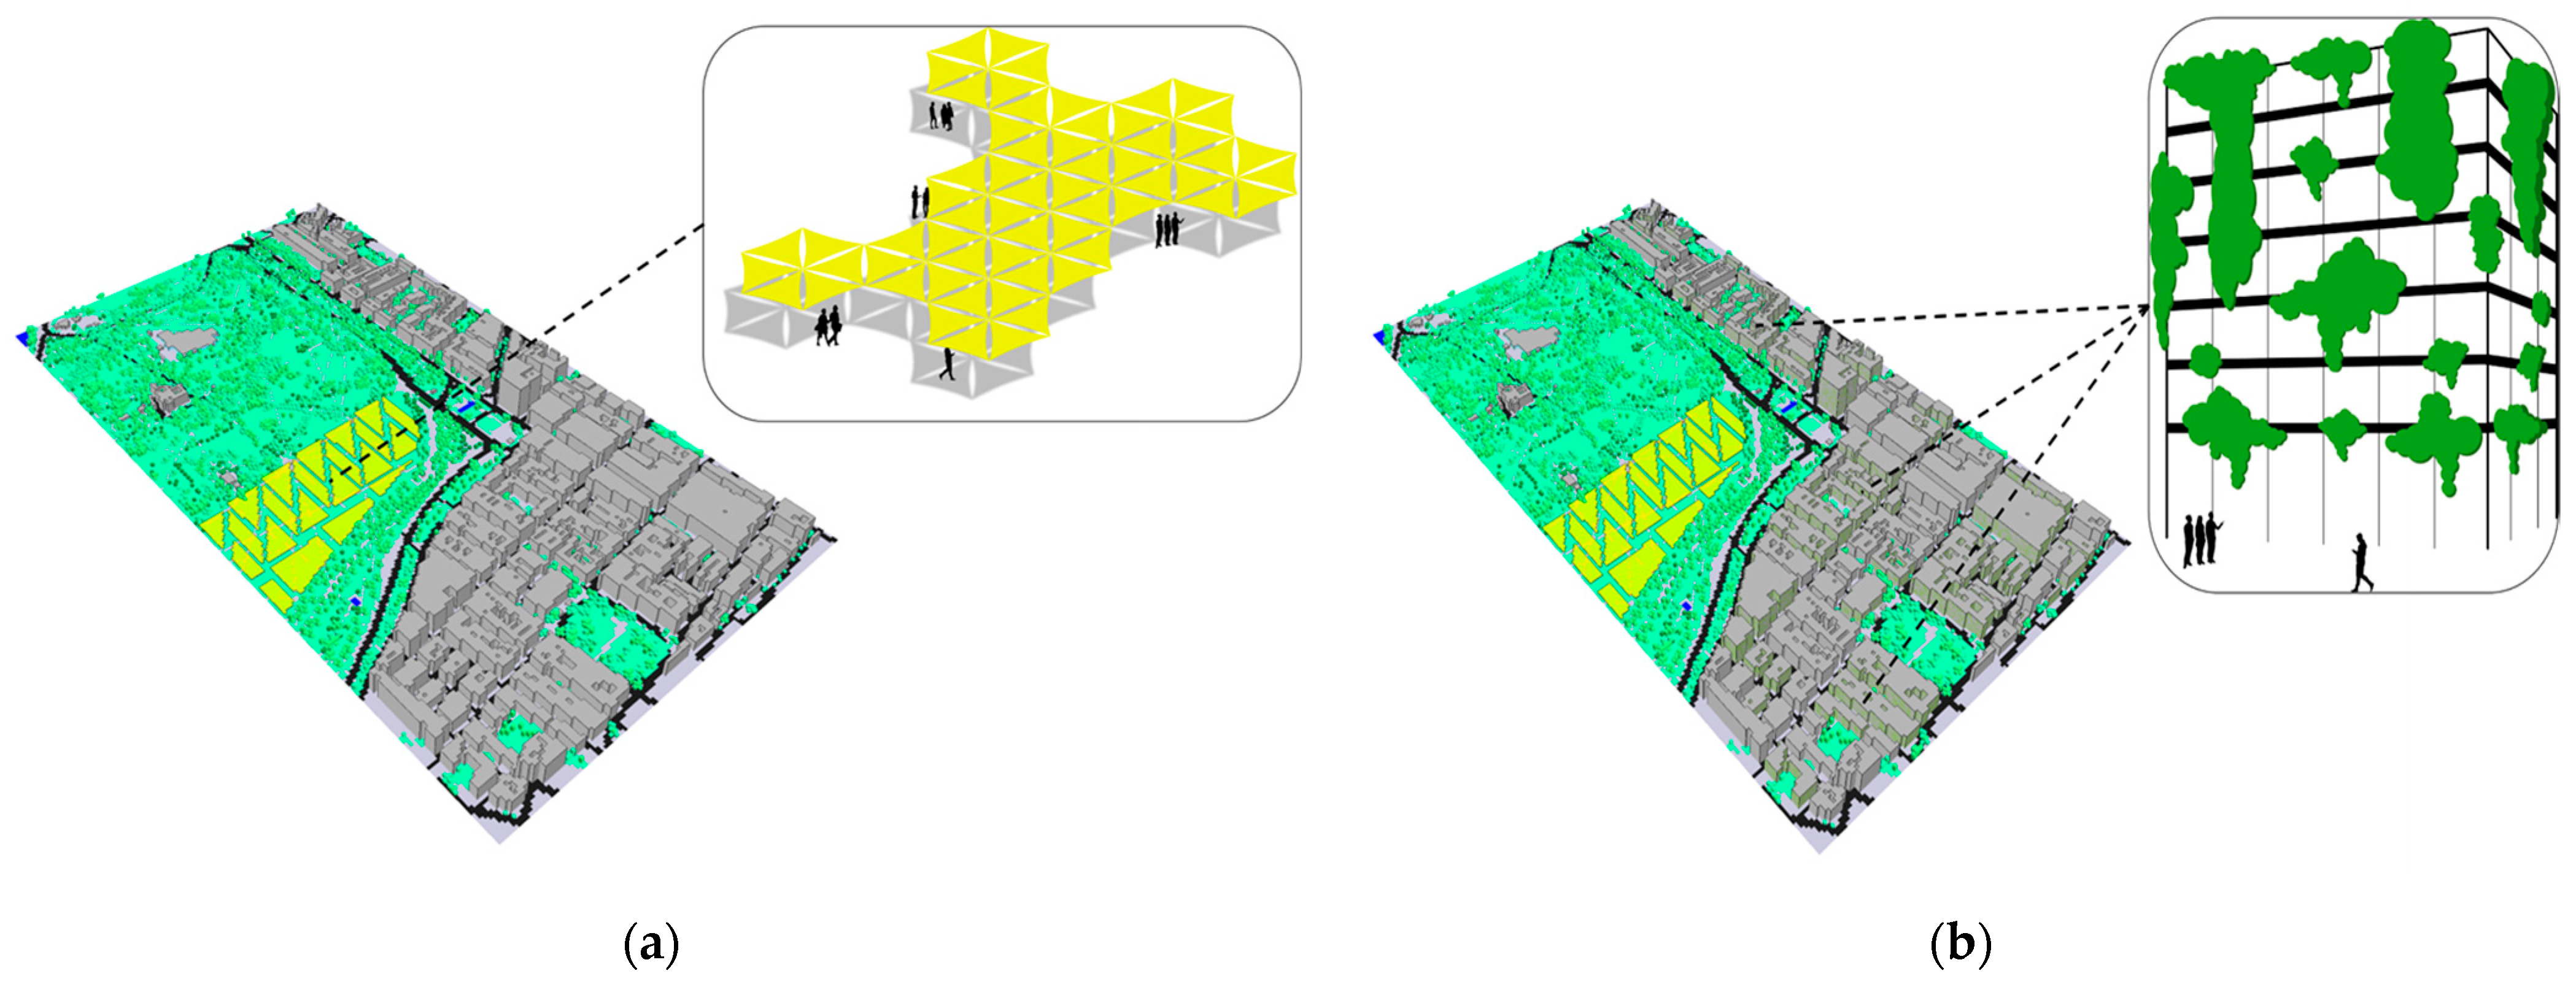
- In the second scenario, sun sail shading devices are incorporated into the model area. A total of 22 sun sails are placed all over the Parade Ground to provide shading to park visitors. While shading structures of this nature are commonly employed on a smaller scale in gardens and streets [53,54], their presence at larger outdoor events, such as festivals, is becoming increasingly prevalent and showing promising results. Sun sails also constitute a suitable solution to integrate shading to the area without necessarily being a stationary measure. In fact, with a basic infrastructure set, assembly and disassembly can be accomplished reasonably fast, whenever long periods of heat are imminent (Figure 2a). Sun sails were defined as Single Walls in ENVI-met by taking the default database item for sun sails and adjusting the basic parameters for absorption (0.25), transmission (0.25), and reflection (0.5).
 Figure 2. Model area configurations with the application of heat mitigation measures using temporary sun sails (a) and façade greenery in addition (b).
 - In order to directly address the heat issues in the built-up areas surrounding Hyde Park, the third scenario proposes the implementation of façade greening as an in-situ measure (Figure 2b). Façade greening is effective in reducing high temperatures both inside and outside buildings by means of transpiration and interception of solar radiation. Consequently, it helps to maintain a comfortable indoor temperature during the summertime while also providing thermal insulation during colder periods [55,56]. Furthermore, the advantages of façade greening extend beyond their climatic benefits: they include aesthetic improvement, enhanced air quality, noise reduction, and they provide habitats for insects and small wildlife. On the contrary, there are also several disadvantages, for example, regarding maintenance effort, water consumption due to irrigation, and high costs [57]. While roof greening applications are more complicated due to the need for substrate and irrigation, façade greening can be applied more easily, e.g., using soil-bound ivy. In this hypothetical scenario, urban planning directives yield a strong greening of the urban quarter, for example, by implementing tax incentives or subsidies, leading to our presented approach, where 50% of all buildings were greened based on a random selection. To avoid application issues with the impervious soils near buildings, i.e., pavements and streets, we assume the greening to represent greenery-substrate-modules, which are attached to the wall. They cause less damage for underlying wall materials than directly grown ivy. However, they would need an automatic irrigation system, which likely has a high maintenance effort to be covered by urban planning services. In ENVI-met, these items were defined by the default database ID 02AGSS, containing a simple plant with a height of 30 cm and an LAI of 1.5 m²/m², as well as an automatically irrigated substrate consisting of sandy loam and Styrofoam layers [58,59].
Four simulations were, hence, carried out in total, with the first one resembling the status quo of Hyde Park, with no measures taken, but drastically reduced soil humidity as present in heatwaves. It is important to note that the subsequent three scenarios resemble stages of added-up heat mitigation measures, i.e., every following scenario also includes the measures of the previous scenario(s). Scenario 4 is, thus, expected to show the highest cooling impact, as it includes all measures of irrigation, temporary sun sails, and façade greenery (Figure 2b). Table 1 shows the model area and simulation settings for both status quo and mitigation scenarios.

Table 1.
General model area and simulation settings.
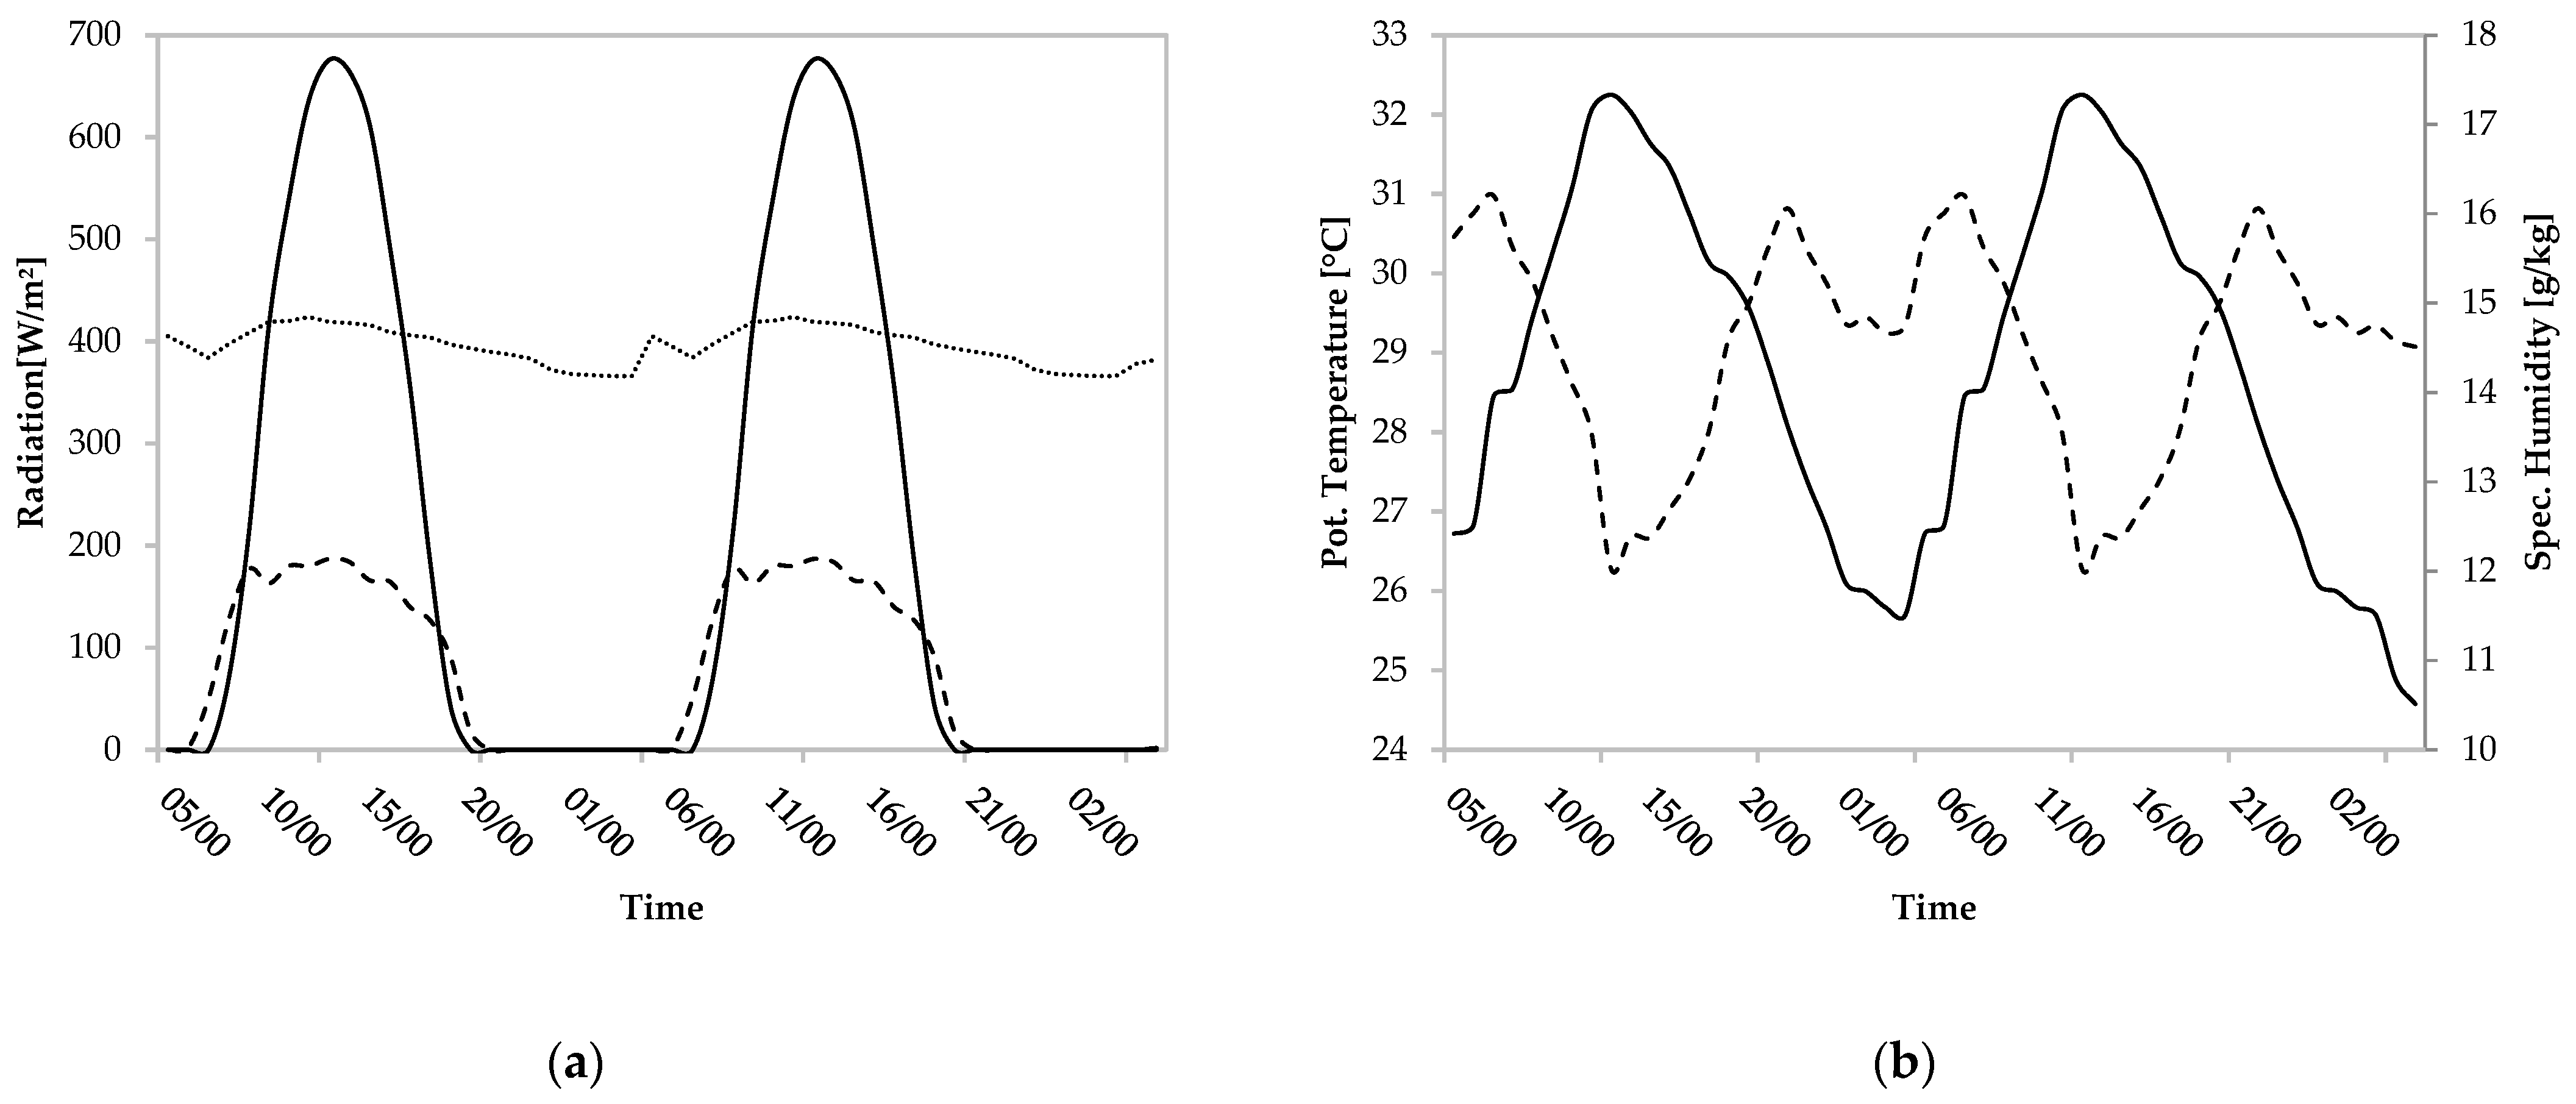
To ensure comparability, all four simulations use the same climatic boundary conditions, which resemble the hot conditions of the summer days as experienced in London during the 2022 heatwave. The used full forcing file therefore comprises clear sky conditions with very hot nighttime temperatures greater than 25 °C (Figure 3). Wind speed was held constant at 1.3 m/s with a wind direction of 230°. In the heat mitigation scenarios, precipitation of 5 mm, i.e., 5 L per square meter, is added to the soil at 07:00 h in the morning and 19:00 h in the evening by using the precipitation parameter in the full forcing file (Table 1).
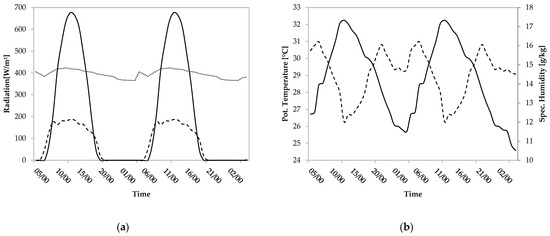
Figure 3.
Full forcing boundary conditions used for all scenarios depicting direct shortwave (black line), diffuse shortwave (dashed line), and longwave radiation (dotted line) (a) as well as potential air temperature (black line) and specific air humidity (dashed line) (b).
2.2. Human Thermal Comfort
Extreme heat poses a significant burden on the human body, profoundly impacting individuals’ wellbeing and overall health. Prolonged exposure to high air temperatures can lead to dehydration, heat exhaustion, and, in severe cases, life-threatening heatstroke [60,61]. Furthermore, the discomfort caused by extreme heat can lead to sleep disturbances and reduced productivity among people in the affected areas [62,63]. It can hinder their ability to concentrate, affecting their performance in both work and daily activities. Certain vulnerable groups are at higher risk during extreme heat events, including elderly individuals, pregnant women, infants, and children, as well as those suffering from chronic diseases [64,65].
The analysis of human thermal comfort will rely on investigating the physiological equivalent temperature (PET) rather than the simple parameter of potential air temperature. PET is a metric used in environmental science and meteorology to gauge the human perception of thermal comfort [66,67,68]. It provides a comprehensive evaluation of how weather conditions, including air temperature, humidity, wind speed, and radiation, collectively influence how humans experience and feel their surroundings. The PET index aims to estimate the equivalent temperature that a person would perceive in a typical indoor environment, making it easier to compare different outdoor weather conditions. By considering various meteorological factors and the human body’s thermoregulatory response, it offers a far more comprehensive measure of thermal comfort. The PET index categorizes various grades of physiological stress, ranging from “extreme cold stress” to “extreme heat stress” [69,70].
2.3. Plant Health
Considering the substantial influence of trees on urban heat effects, it becomes imperative to integrate their wellbeing into the development of climate mitigation strategies. Insufficient water supplies and rising air temperatures can subject the tree to severe drought and heat stress, triggering the activation of stomatal regulation, i.e., the plant closes its stomata to prevent excessive water loss during dry conditions. As a result, the leaf’s ability of transpiration cooling is drastically reduced, causing potential overheating, which can ultimately lead to its wilting and scorching. Drought stress also causes the capillary forces inside the plant to rise to a point where air bubbles can be drawn into the xylem. This leads to the formation of cavitations which hinder water and nutrient transport inside the organism. Over time, these effects can severely weaken the tree, making it susceptible to pests and diseases, leading to eventual death [71,72,73]. In the short term, stomatal closing leads to a reduced photosynthesis and transpiration rate [74], hence hindering a tree’s cooling impact. Due to these mechanisms, tree wellbeing can be evaluated by investigating transpiration rates and leaf temperatures.
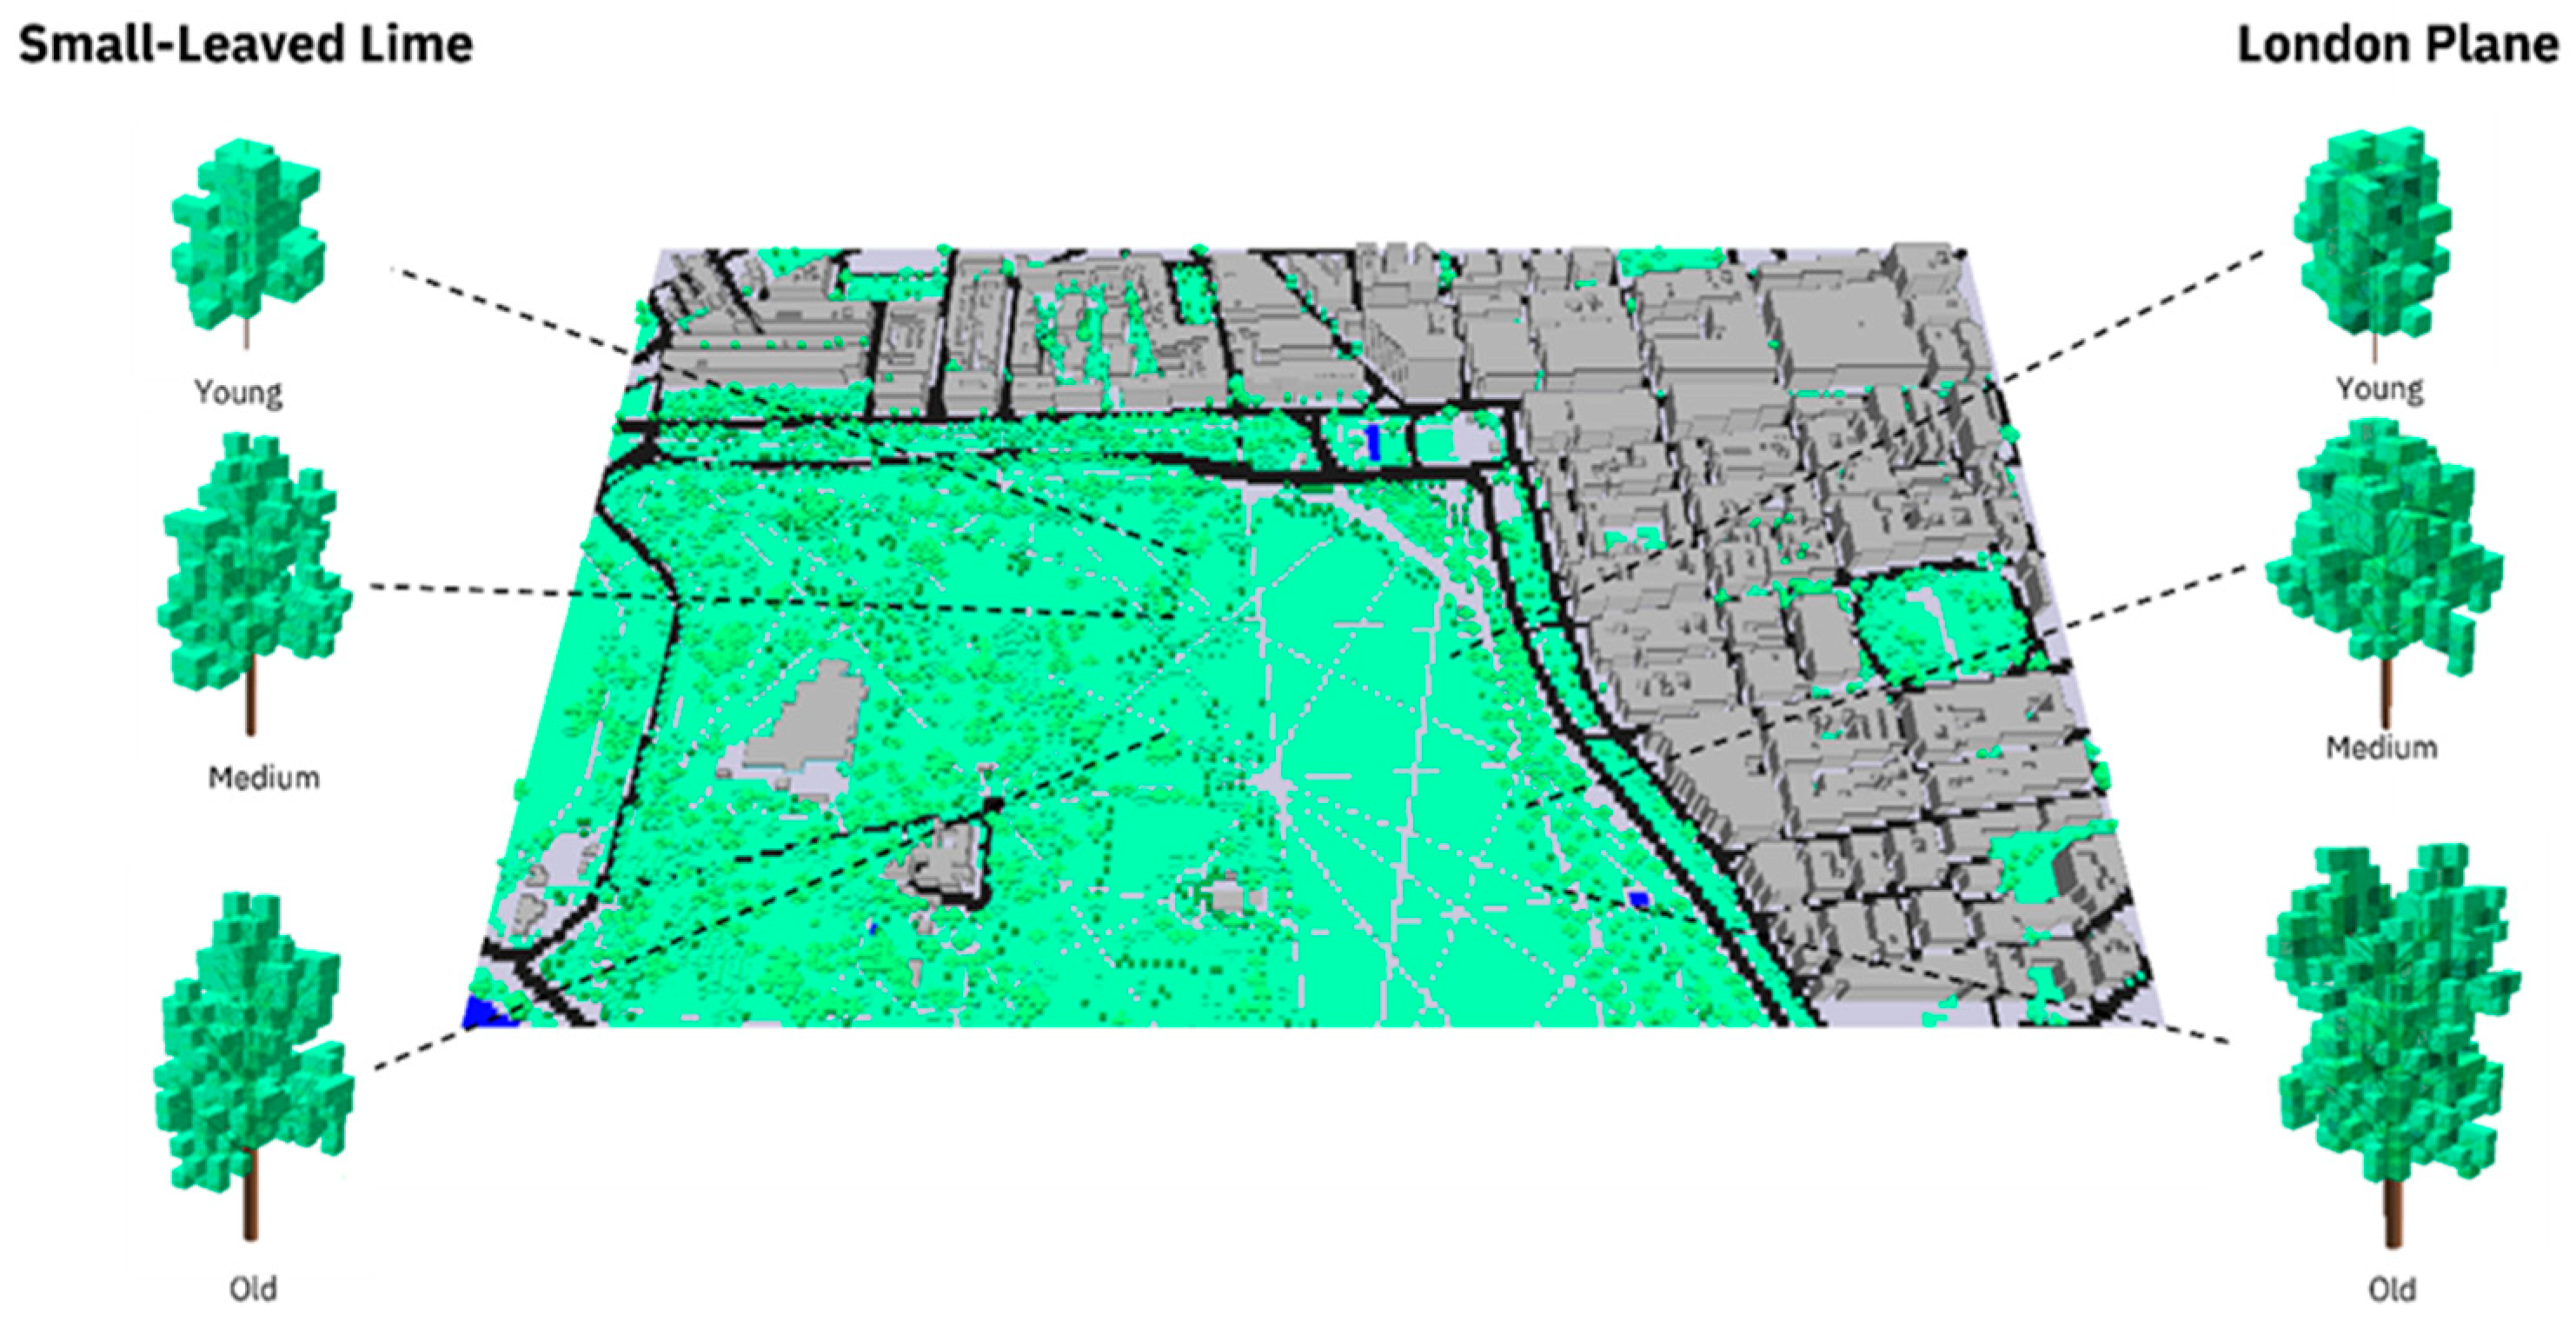
To assess the health of the park’s trees, physiological data from two prevalent tree species in Hyde Park were analyzed and compared between status quo and the irrigated Scenario 1. To compare the variations between different development stages within a tree species, representatives from three distinct age groups—young, medium-aged, and old trees—were observed in each case. Physiologically, they mainly differ in height, width, and root diameter, as well as leaf area density (LAD) and distribution in ENVI-met [75]. One of the tree species represents the London plane, which is the most abundant tree species, comprising approximately 40% of all trees in Hyde Park [76]. The other species is the small-leaved lime, which covers around 4% of the total trees [76]. Both are characterized to be rather resistant against hot and dry conditions, while the London plane typically comprises a higher LAD [77,78]. The observed trees’ locations within the model domain are displayed in Figure 4.
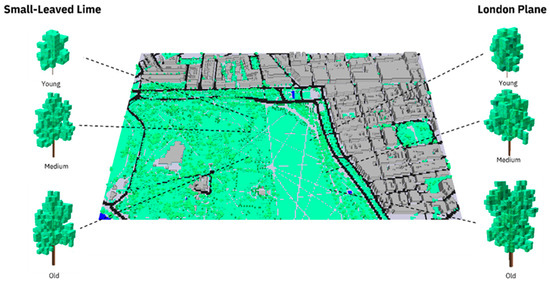
Figure 4.
Observed trees’ location in the model area.
Due to the different plant parameters as well as varying sites within the park, the trees’ responses are expected to behave differently over the course of simulation. Due to the large variation in their shape, density, and location, the six examined trees should be analyzed exemplarily for most trees of Hyde Park. Following Simon et al. 2018 [50], they are tagged to be observed in the ENVI-met simulation to obtain summed-up transpiration rates and averaged leaf temperatures for each of the examined trees over the whole course of the simulation.
3. Results
In the following, results are presented regarding thermal comfort conditions during both the daytime and the nighttime (Section 3.1) as well as the tree health development over the course of the simulations (Section 3.2).
3.1. Thermal Comfort
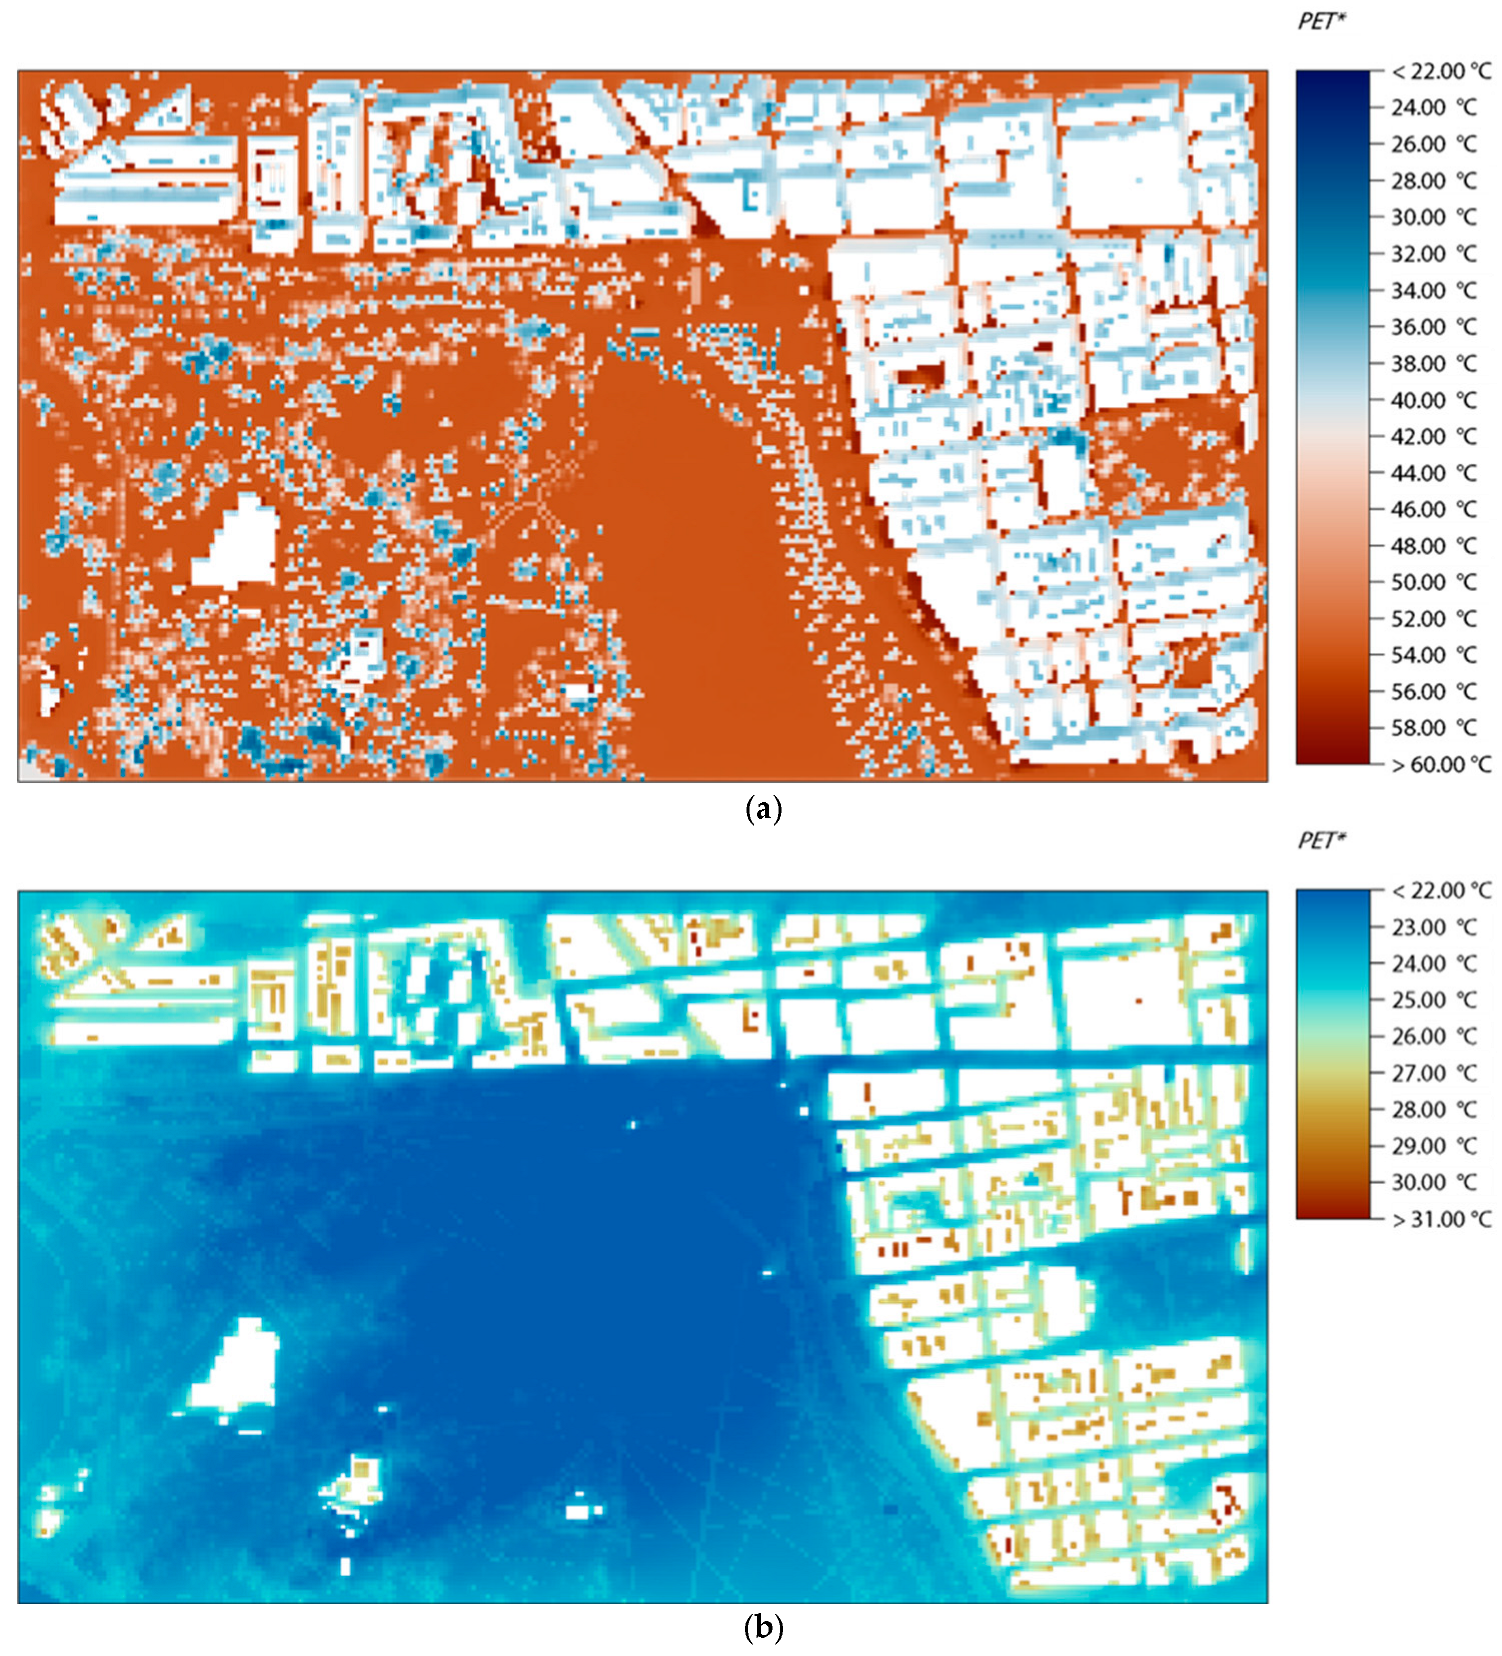
Looking at the PET values of the status quo simulation at 1 p.m., we find significant differences between shaded and nonshaded areas. On the open Parade Ground, PET values of up to 57 °C can be observed, hence showing strong signs of heat stress. This indicates that the on-site turf vegetation is not at all able to provide sufficient cooling to its surroundings. Contrarily, shaded areas, i.e., the street canyons in the built-up areas surrounding Hyde Park, clearly show more tolerable values around 32 to 34 °C and, therefore, only represent slight to moderate heat stress. Street canyons in direct exposure to solar radiation, however, show similarly high PET values to Parade Ground. Overall, the combination of shading and transpiration in areas adjacent to trees creates the lowest PET values of around 29 °C. Consequently, on a hot summer day, these areas can be expected to be primarily used as recreational spaces. However, the park’s impact on the climate of the surrounding built-up areas during the daytime is negligible (Figure 5a).

Figure 5.
PET result maps at 1 p.m. (a) and 10 p.m. (b) at a cut height level of 1.25 m. PET* is the default name for PET in ENVI-met as the model implemented the corrected PET calculations with V5.5.
At nighttime, considerable differences in PET can be perceived between park areas and the surrounding street canyons. While park areas cool down strongly to a range of 20 to 22 °C, the dense built-up areas show significantly higher PET values of around 26 to 31 °C, maintaining slight to moderate heat stress. Increased heat absorption over the day, due to the higher thermal mass of asphalt and concrete, as well as lower wind speeds which reduce the cooling capacity in these areas, cause the significantly higher PET values. In contrast to the daytime situation, a slight impact of the park’s cooling can be observed at the northeastern transition into the built-up areas (Figure 5b).
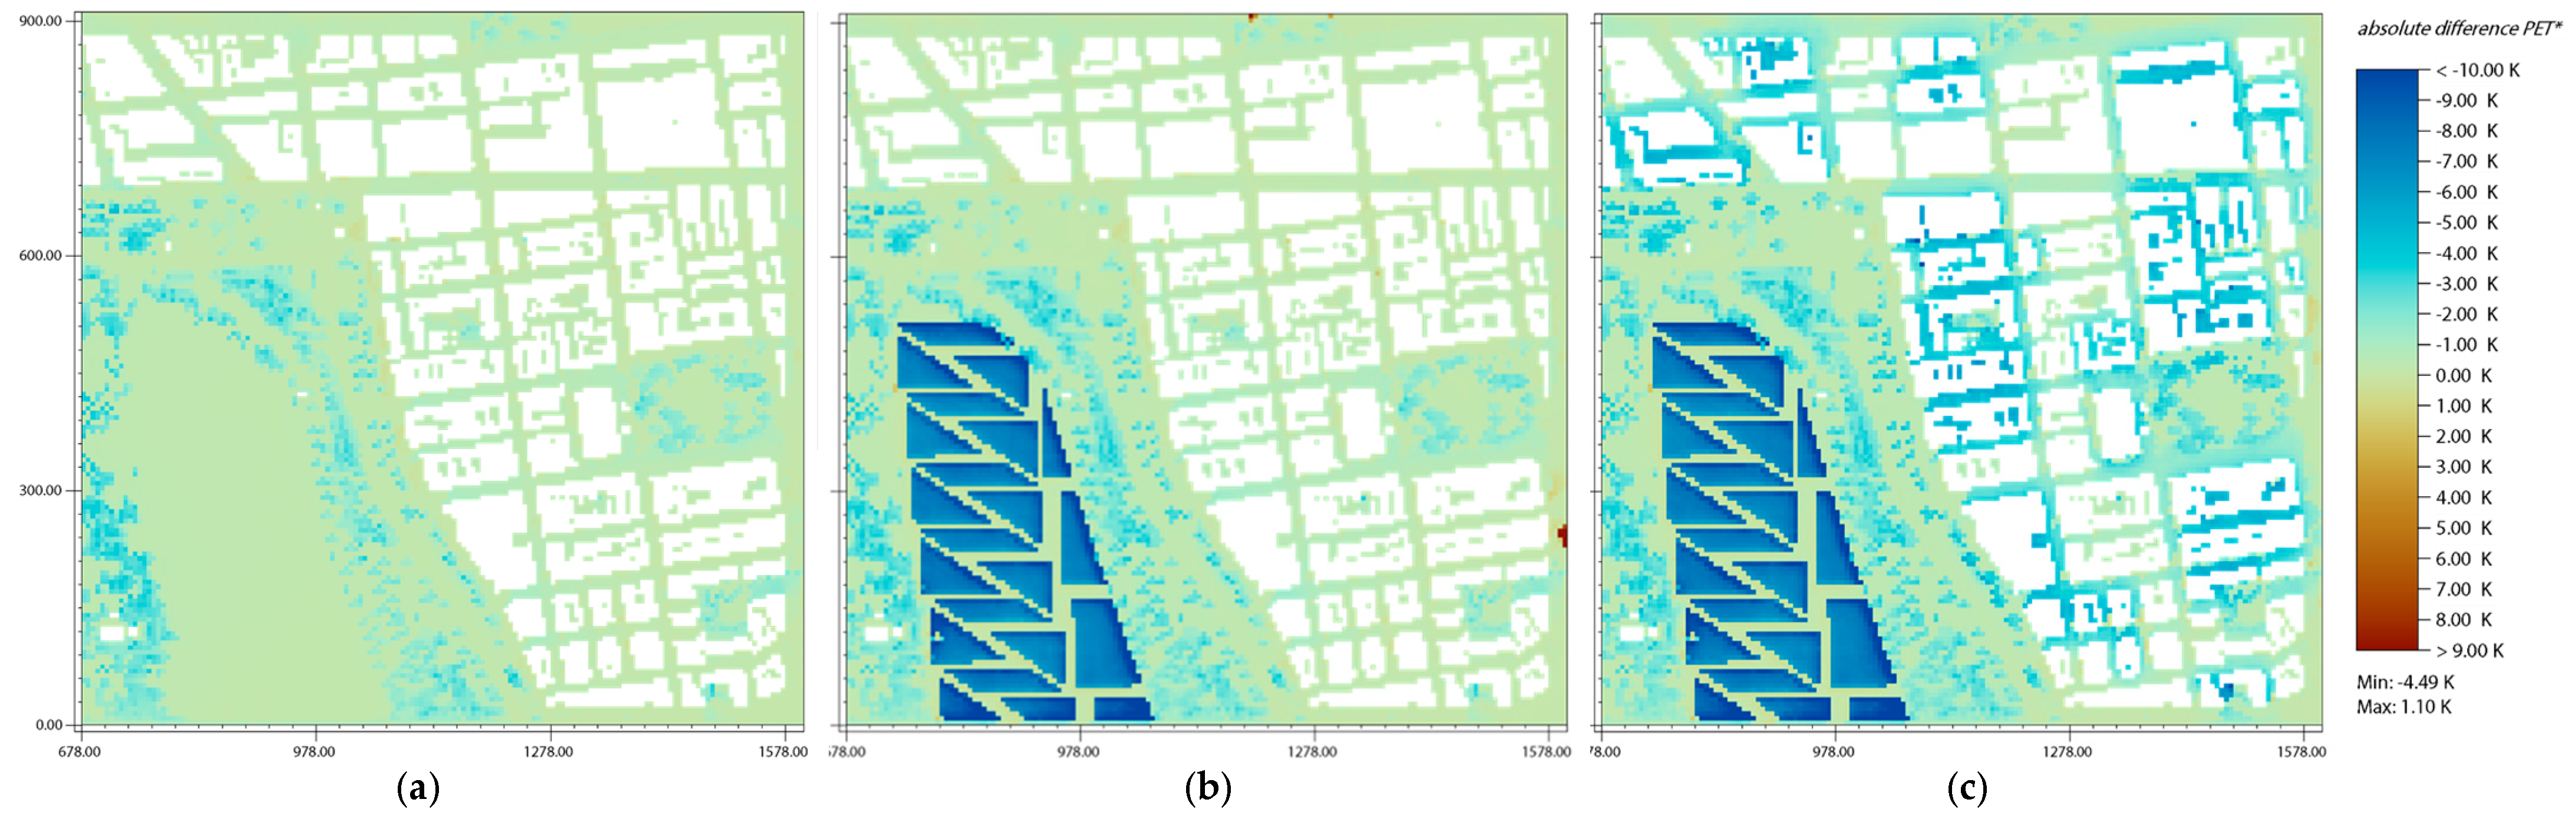
Analyzing the results of the heat mitigation simulations, it becomes evident that the irrigation strategy implemented in Scenario 1 does not improve local thermal comfort significantly during peak temperatures in open fields. Despite the substantial water distribution to the turf fields, the intensity of solar radiation remains very high, leading to rapid evaporation and minimal cooling at noon. However, areas in close proximity of trees benefit from the irrigation due to increased transpiration rates causing a decrease in PET values by around 2 to 5 °C (Figure 6a). Nevertheless, the effect is rather localized, and no observed impact on the adjacent built-up areas can be attested, indicating that the proposed irrigation strategy has a limited effect on increasing human thermal comfort at a larger scale.
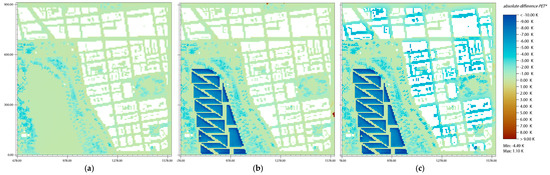
Figure 6.
Daytime PET comparison maps at 1 p.m. at a cut height level of 1.25 m, showing differences between status quo and the scenarios using irrigation only (a), additional sun sails (b), and additional façade greenery (c). PET* is the default name for PET in ENVI-met as the model implemented the corrected PET calculations with V5.5.
The introduction of sun sails demonstrates notable reductions in PET values on Parade Ground. Shading provided by the sun sails leads to an average decrease of around 7 °C PET, with some areas experiencing even greater differences of up to 13 °C. Despite this improvement, the overall high absolute PET values of the status quo, reaching up to 57 °C, would, in this scenario, only see a maximum reduction down to around 44 °C. As this still falls within the category of “extreme heat stress” on the PET index scale, the sun sail approach cannot be considered a complete success in this context. Nevertheless, individuals may be able to spend more time engaging in activities in the shaded areas. Also, it needs to be considered that the sun sails reduced direct solar radiation by 75% and therefore decreased the harming UV exposure of park visitors significantly. It is important to note, however, that the sun sails also have no visible impact regarding PET on the built-up areas in the surrounding despite the on-site improvements (Figure 6b).
In this regard, façade greening proves to be the only effective approach, exerting a positive influence on the microclimate. PET values near the greened areas show an average decrease in PET of around 4 to 6 °C compared to the status quo scenario. In terms of physiological stress grades, façade greening significantly reduces the heat stress by one or two grades depending on the location (Figure 6c).
During the nighttime, the irrigation strategy has minimal impact on evapotranspiration for both turf and tree areas. Within Hyde Park, only slight decreases of up to 0.6 °C can be observed. Furthermore, the irrigation strategy—like during the daytime—only shows little to no effect in the built-up areas. Overall, it can be stated that there are no significant differences compared to the status quo scenario (Figure 7a).
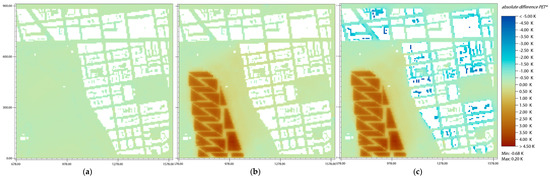
Figure 7.
Nighttime PET comparison maps for 10 p.m. at a cut height level of 1.25 m showing differences between status quo and the scenarios using irrigation only (a), additional sun sails (b), and additional façade greenery (c). PET* is the default name for PET in ENVI-met as the model implemented the corrected PET calculations with V5.5.
While the sun sails manage to significantly reduce PET values during the daytime, they tend to impede radiative cooling at night significantly. PET values beneath the sun sails are approximately 2 °C to 4 °C higher compared to the status quo due to the sun sail blocking of longwave radiation emitted by the ground. The increase in PET through the sun sails also has a slight impact on the adjacent built-up areas in the east, where PET was slightly increased by 0.2 °C to 0.5 °C (Figure 7b).
By implementing façade greening, the slightly negative impact on the built-up areas is eliminated, as they significantly reduce PET values by an average of 3 °C to 4 °C. The greened façades intercept solar radiation during the daytime, resulting in less heat absorption of the building surfaces and therefore reduced heat emissions during nighttime. As a result, the widespread moderate heat stress observed in the status quo is significantly decreased to slight or no heat stress (Figure 7c).
3.2. Tree Health
In normal, nonstressed conditions, transpiration rates in a day can be expected to rise with an increase in ambient temperature (TA) and photosynthetically active radiation (PAR). PAR can be defined as the portion of the electromagnetic radiation from the sun that is being used by plants for photosynthesis. Consequently, on a cloudless summer day, transpiration rate would normally peak around midday, when both TA and PAR reach their maximum. Drought stress, on the other hand, can be identified by a drastically decreasing transpiration activity during TA and PAR peaks. This characteristic phenomenon can be observed in the data of all lime trees, as transpiration rates drop by about a third to almost half from around 11 a.m. to 4 p.m. (Figure 8b). The deficits in transpiration activity cause hot average leaf temperatures of above 40 °C, particularly on the second day (Figure 8c). At this point, protein degradation starts to set in, causing damage to the leaf’s tissue [79,80,81]. While the lime trees suffer, the observed plane trees show almost no signs of drought stress during TA and PAR peaks (Figure 8a). This is also reflected by the average leaf temperatures, which lie around a rather cool 28 to 30 °C (Figure 8c). However, in addition to the more sufficient transpiration cooling by the plane tree, the observed lower leaf temperatures can also be attributed to the higher LAD. This contributes to a greater amount of shade provided by the outer leaf layers of the canopy, protecting inner layers from shortwave direct radiation.
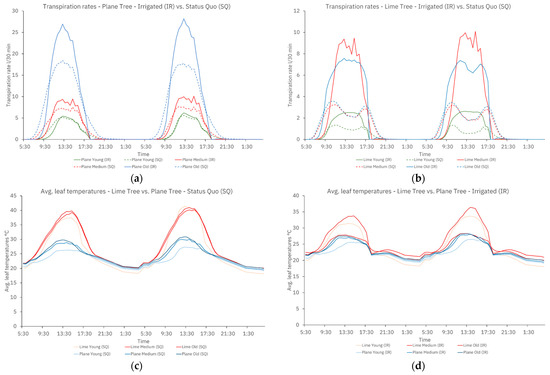
Figure 8.
Tree health plots presenting transpiration rates in status quo and irrigated scenarios in different development stages of plane trees (a) as well as lime trees (b), and average leaf temperatures of plane and lime trees in the status quo scenario (c) as well as in the irrigated scenario (d).
Regarding the performance of the tree species’ different age groups, significant variations are evident in transpiration rates, likely due to differences in root and foliage development (Figure 8a,b). However, when it comes to leaf temperatures, no notable distinctions are observed among the various age groups (Figure 8c).
The irrigation strategy results in a noteworthy enhancement in the overall health of the observed lime and plane trees. There is a substantial increase in transpiration rates for all trees, indicating a higher metabolic activity and, consequently, a greater potential for growth. Furthermore, two of the lime trees no longer exhibit any signs of drought stress. However, the old lime tree still shows some signs of drought stress on the second day, suggesting that the current irrigation approach may not fully meet its water demands (Figure 8b).
The increased transpiration rates also lead to significantly lower leaf temperatures for all the trees, with even the lime trees remaining well below the 40 °C threshold. Notably, the old lime tree shows the highest temperatures among them, once again highlighting its vulnerability to the prevailing conditions (Figure 8d).
4. Discussion and Conclusions
This study focuses on the urgent issue of escalating heat during summers in Europe and its impact on urban parks, exemplified by Hyde Park in London. The analysis of human thermal comfort during daytime revealed that inside Hyde Park, the expansive Parade Ground experienced extremely high PET values due to the absence of shading and desiccation of local turf fields. Conversely, areas adjacent to trees demonstrated significantly lower potential for thermal stress. The surrounding built-up areas exhibited varying degrees of heat stress depending on their sun exposure. However, during the nighttime, these areas displayed distinct disadvantages as their cooling potential was notably lower compared to the vegetated areas of Hyde Park.
Based on these findings, the first key lesson from the study is the crucial significance of incorporating and conserving suitable urban greenery, particularly trees, to establish climate resilience of city parks. Trees play an essential role in creating cool oases, even amidst extreme temperatures, through their shading and transpiration cooling effects. This contributes to the preservation of recreational areas for city residents even during the hottest hours of the day. A successful implementation, however, relies on the selection of heat- and drought-resistant tree species, to ensure long-term health and survival of vegetation. The examined London plane and small-leaved lime are already among the best options, while oaks—currently 5% of all park trees [76]—should be a viable alternative [82]. Equally important is the implementation of targeted irrigation measures to support trees during challenging dry periods. This proactive approach to water management plays a key role in sustaining healthy urban ecosystems. However, that is, of course, a critical point during droughts and also not a cost-effective solution as long as there is no automatic irrigation system available.
Whenever conflicting usage does not allow for static vegetational measures, alternative artificial solutions can be beneficial in mitigating human thermal stress. For instance, the sun sails integrated at Parade Ground have demonstrated partial effectiveness in alleviating intense heat and enhancing thermal comfort in areas previously lacking shade. These nonpermanent structures offer a suitable solution, providing a way to address heat-related challenges and create more comfortable environments for people in urban spaces. This site-specific measure should be minimally invasive for the park, providing an efficient, feasible, and relatively unexpensive solution for improving outdoor thermal comfort. However, it comes with more maintenance costs than the current situation without the temporary sun sails, which would have to be assembled or disassembled depending on prevailing weather conditions.
In general, there are a few study limitations and simplifications that have to be stated to allow a reasonable interpretation of the presented results. The observed modeling results are quite site-specific and are likely different for other climate zones or even other parts of London. Only two tree species of different age groups have been examined, resulting in a total of six trees. Due to the large variation of trees and their specific locations within Hyde Park, they can only be seen as exemplary study objects and their behavior cannot be transferred to all other trees in the model area. Furthermore, the study is solely based on microclimate modeling with ENVI-met, while the usage of other microclimate models, mesoscale models, or on-site measurements might have given deeper, or at least different, insights into the topic. Modeling in general always involves a trade-off between large model area dimensions and fine resolutions on one hand, and computational limitations on the other hand, making it necessary to use parametrizations and simplifications.
In addition to these study limitations, the presented findings do not represent only local heat mitigation measures. Moreover, the most important keynote is that park vegetation—although playing a significant role in mitigating the urban climate and offering recreational spaces –is not sufficient to fully address the challenges cities face because of extreme heat events. The study’s results indicate that the impact of park vegetation during the severe conditions in 2022 is highly localized, resulting in limited cooling potential on adjacent built-up areas. Therefore, it becomes imperative to implement in situ measures to effectively cope with these challenges. In this regard, façade greening emerges as a crucial solution, offering localized remedies to densely built areas. By incorporating green elements on building exteriors, such as climbing plants or green walls, façade greening can help cool the urban environment, mitigate the UHI effect, and enhance overall climate resilience in densely populated urban areas. Moreover, this approach has the potential for further extension through a complete reimagining of urban design. By opening up the conventional dense urban fabric of cities, ample space can be created for pocket parks or community gardens to further enhance the positive impacts of urban greening. In any case, combining the benefits of park vegetation and façade greening creates a more comprehensive approach to address extreme climate impacts in urban settings. The disadvantages regarding costs and maintenance effort therefore have to be evaluated against the possible gains for the urban population.
In conclusion, the study emphasized that achieving climate resilience in cities is a highly intricate challenge that requires the consideration of multiple factors. The analysis of mitigation strategies revealed that there is unlikely to be a universal solution to address all issues. Instead, a network of diverse measures needs to be implemented to effectively tackle the challenges posed by climate change. In this context, microclimate simulations emerge as a crucial tool, enabling both the identification of thermal hazards and the design and evaluation of countermeasures. Further studies regarding the 2022 heatwave in London and possible heat mitigation measures are strongly needed to further improve thermal comfort conditions for the urban population. A shifted focus from micro- to mesoscale would represent an appealing option to be able to fully investigate the impact of the entire Hyde Park on the surrounding built-up area.
Author Contributions
Conceptualization, L.S. and H.S.; methodology, L.S., P.S. and H.S.; software, L.S. and H.S.; validation, P.S., L.S. and T.N.; formal analysis, L.S. and P.S.; investigation, L.S. and P.S.; resources, M.B.; data curation, L.S., T.S. and H.S.; writing—original draft preparation, L.S., P.S. and T.S.; writing—review and editing, T.S., P.S., T.N. and H.S.; visualization, L.S., T.N. and T.S.; supervision, H.S., T.S. and M.B.; project administration, H.S. and T.S. All authors have read and agreed to the published version of the manuscript.
Funding
This research received no external funding.
Institutional Review Board Statement
Not applicable.
Informed Consent Statement
Not applicable.
Data Availability Statement
The raw data supporting the conclusions of this article will be made available by the authors on request.
Conflicts of Interest
The authors declare no conflicts of interest.
References
- Zhang, R.; Sun, C.; Zhu, J.; Zhang, R.; Li, W. Increased European Heat Waves in Recent Decades in Response to Shrinking Arctic Sea Ice and Eurasian Snow Cover. NPJ Clim. Atmos. Sci. 2020, 3, 7. [Google Scholar] [CrossRef]
- Zachariah, M.; Vautard, R.; Schumacher, D.L.; Vahlberg, M.; Heinrich, D.; Raju, E.; Thalheimer, L.; Arrighi, J.; Singh, R.; Li, S.; et al. Without Human-Caused Climate Change Temperatures of 40 °C in the UK Would Have Been Extremely Unlikely; World Weather Attribution; University of Waikato: Hamilton, New Zealand, 2022. [Google Scholar]
- Osman, A.I.; Chen, L.; Yang, M.; Msigwa, G.; Farghali, M.; Fawzy, S.; Rooney, D.W.; Yap, P.-S. Cost, Environmental Impact, and Resilience of Renewable Energy under a Changing Climate: A Review. Environ. Chem. Lett. 2023, 21, 741–764. [Google Scholar] [CrossRef]
- Yule, E.L.; Hegerl, G.; Schurer, A.; Hawkins, E. Using Early Extremes to Place the 2022 UK Heat Waves into Historical Context. Atmos. Sci. Lett. 2023, 24, e1159. [Google Scholar] [CrossRef]
- Lo, Y.T.E.; Mitchell, D.M.; Thompson, R.; O’Connell, E.; Gasparrini, A. Estimating Heat-Related Mortality in near Real Time for National Heatwave Plans. Environ. Res. Lett. 2022, 17, 024017. [Google Scholar] [CrossRef] [PubMed]
- Ballester, J.; Quijal-Zamorano, M.; Méndez Turrubiates, R.F.; Pegenaute, F.; Herrmann, F.R.; Robine, J.M.; Basagaña, X.; Tonne, C.; Antó, J.M.; Achebak, H. Heat-Related Mortality in Europe during the Summer of 2022. Nat. Med. 2023, 29, 1857–1866. [Google Scholar] [CrossRef] [PubMed]
- Kautz, L.-A.; Martius, O.; Pfahl, S.; Pinto, J.G.; Ramos, A.M.; Sousa, P.M.; Woollings, T. Atmospheric Blocking and Weather Extremes over the Euro-Atlantic Sector—A Review. Weather Clim. Dyn. 2022, 3, 305–336. [Google Scholar] [CrossRef]
- Lu, R.; Xu, K.; Chen, R.; Chen, W.; Li, F.; Lv, C. Heat Waves in Summer 2022 and Increasing Concern Regarding Heat Waves in General. Atmos. Ocean. Sci. Lett. 2023, 16, 100290. [Google Scholar] [CrossRef]
- Ibebuchi, C.C.; Abu, I.-O. Characterization of Temperature Regimes in Western Europe, as Regards the Summer 2022 Western European Heat Wave. Clim. Dyn. 2023, 61, 3707–3720. [Google Scholar] [CrossRef]
- Dong, L.; Mitra, C.; Greer, S.; Burt, E. The Dynamical Linkage of Atmospheric Blocking to Drought, Heatwave and Urban Heat Island in Southeastern US: A Multi-Scale Case Study. Atmosphere 2018, 9, 33. [Google Scholar] [CrossRef]
- Lee, Y.Y.; Din, M.F.M.; Ponraj, M.; Noor, Z.Z.; Iwao, K.; Chelliapan, S. Overview of Urban Heat Island (Uhi) Phenomenon towards Human Thermal Comfort. Environ. Eng. Manag. J. (EEMJ) 2017, 16, 2097–2111. [Google Scholar]
- Davini, P.; D’Andrea, F. From CMIP3 to CMIP6: Northern Hemisphere Atmospheric Blocking Simulation in Present and Future Climate. J. Clim. 2020, 33, 10021–10038. [Google Scholar] [CrossRef]
- Rousi, E.; Kornhuber, K.; Beobide-Arsuaga, G.; Luo, F.; Coumou, D. Accelerated Western European Heatwave Trends Linked to More-Persistent Double Jets over Eurasia. Nat. Commun. 2022, 13, 3851. [Google Scholar] [CrossRef]
- Ma, Y.; Liang, P.; Grimmond, S.; Yang, X.; Lyu, J.; Ding, Y. Three-Dimensional Urban Thermal Effect across a Large City Cluster during an Extreme Heat Wave: Observational Analysis. J. Meteorol. Res. 2022, 36, 387–400. [Google Scholar] [CrossRef]
- Beniston, M.; Stephenson, D.B.; Christensen, O.B.; Ferro, C.A.T.; Frei, C.; Goyette, S.; Halsnaes, K.; Holt, T.; Jylhä, K.; Koffi, B.; et al. Future Extreme Events in European Climate: An Exploration of Regional Climate Model Projections. Clim. Chang. 2007, 81, 71–95. [Google Scholar] [CrossRef]
- O’Malley, C.; Piroozfarb, P.A.E.; Farr, E.R.P.; Gates, J. An Investigation into Minimizing Urban Heat Island (UHI) Effects: A UK Perspective. Energy Procedia 2014, 62, 72–80. [Google Scholar] [CrossRef]
- Sahani, J.; Kumar, P.; Debele, S.; Emmanuel, R. Heat Risk of Mortality in Two Different Regions of the United Kingdom. Sustain. Cities Soc. 2022, 80, 103758. [Google Scholar] [CrossRef]
- Motazedian, A.; Coutts, A.M.; Tapper, N.J. The Microclimatic Interaction of a Small Urban Park in Central Melbourne with Its Surrounding Urban Environment during Heat Events. Urban For. Urban Green. 2020, 52, 126688. [Google Scholar] [CrossRef]
- Kraemer, R.; Kabisch, N. Parks Under Stress: Air Temperature Regulation of Urban Green Spaces Under Conditions of Drought and Summer Heat. Front. Environ. Sci. 2022, 10, 849965. [Google Scholar] [CrossRef]
- Heusinger, J.; Weber, S. Surface Energy Balance of an Extensive Green Roof as Quantified by Full Year Eddy-Covariance Measurements. Sci. Total Environ. 2017, 577, 220–230. [Google Scholar] [CrossRef]
- Lafortezza, R.; Chen, J.; van den Bosch, C.K.; Randrup, T.B. Nature-Based Solutions for Resilient Landscapes and Cities. Environ. Res. 2018, 165, 431–441. [Google Scholar] [CrossRef]
- Seddon, N.; Chausson, A.; Berry, P.; Girardin, C.A.J.; Smith, A.; Turner, B. Understanding the Value and Limits of Nature-Based Solutions to Climate Change and Other Global Challenges. Philos. Trans. R. Soc. B Biol. Sci. 2020, 375, 20190120. [Google Scholar] [CrossRef] [PubMed]
- Brandsma, S.; Lenzholzer, S.; Carsjens, G.J.; Brown, R.D.; Tavares, S. Implementation of Urban Climate-Responsive Design Strategies: An International Overview. J. Urban Des. 2024, 0, 1–26. [Google Scholar] [CrossRef]
- Liu, Z.; Cheng, W.; Jim, C.Y.; Morakinyo, T.E.; Shi, Y.; Ng, E. Heat Mitigation Benefits of Urban Green and Blue Infrastructures: A Systematic Review of Modeling Techniques, Validation and Scenario Simulation in ENVI-Met V4. Build. Environ. 2021, 200, 107939. [Google Scholar] [CrossRef]
- Sinsel, T.; Simon, H.; Broadbent, A.M.; Bruse, M.; Heusinger, J. Modeling Impacts of Super Cool Roofs on Air Temperature at Pedestrian Level in Mesoscale and Microscale Climate Models. Urban Clim. 2021, 40, 101001. [Google Scholar] [CrossRef]
- Ouyang, W.; Sinsel, T.; Simon, H.; Morakinyo, T.E.; Liu, H.; Ng, E. Evaluating the Thermal-Radiative Performance of ENVI-Met Model for Green Infrastructure Typologies: Experience from a Subtropical Climate. Build. Environ. 2022, 207, 108427. [Google Scholar] [CrossRef]
- Oh, Y. All London Green Grid as Nature-Based Solutions for Urban Resilience. In The Palgrave Handbook of Climate Resilient Societies; Brears, R.C., Ed.; Springer International Publishing: Cham, Switzerland, 2021; pp. 989–1011. ISBN 978-3-030-42462-6. [Google Scholar]
- Layton, J.; Latham, A. Social Infrastructure and Public Life—Notes on Finsbury Park, London. Urban Geogr. 2022, 43, 755–776. [Google Scholar] [CrossRef]
- Roebuck, A.; Hurley, L.; Slater, D. Assessing the Species Diversity and Vulnerability of Urban Tree Populations in the London Borough of Westminster. Urban For. Urban Green. 2022, 74, 127676. [Google Scholar] [CrossRef]
- Zhang, Z.; Paschalis, A.; Mijic, A. Planning London’s Green Spaces in an Integrated Water Management Approach to Enhance Future Resilience in Urban Stormwater Control. J. Hydrol. 2021, 597, 126126. [Google Scholar] [CrossRef]
- Tsoka, S.; Velikou, K.; Tolika, K.; Tsikaloudaki, A. Evaluating the Combined Effect of Climate Change and Urban Microclimate on Buildings’ Heating and Cooling Energy Demand in a Mediterranean City. Energies 2021, 14, 5799. [Google Scholar] [CrossRef]
- Chan, S.Y.; Chau, C.K. On the Study of the Effects of Microclimate and Park and Surrounding Building Configuration on Thermal Comfort in Urban Parks. Sustain. Cities Soc. 2021, 64, 102512. [Google Scholar] [CrossRef]
- Sinsel, T.; Simon, H.; Broadbent, A.M.; Bruse, M.; Heusinger, J. Modeling the Outdoor Cooling Impact of Highly Radiative “Super Cool” Materials Applied on Roofs. Urban Clim. 2021, 38, 100898. [Google Scholar] [CrossRef]
- Ambrosini, D.; Galli, G.; Mancini, B.; Nardi, I.; Sfarra, S. Evaluating Mitigation Effects of Urban Heat Islands in a Historical Small Center with the ENVI-Met® Climate Model. Sustainability 2014, 6, 7013–7029. [Google Scholar] [CrossRef]
- Kolokotsa, D.; Santamouris, M.; Zerefos, S.C. Green and Cool Roofs’ Urban Heat Island Mitigation Potential in European Climates for Office Buildings under Free Floating Conditions. Sol. Energy 2013, 95, 118–130. [Google Scholar] [CrossRef]
- Morakinyo, T.E.; Ouyang, W.; Lau, K.K.-L.; Ren, C.; Ng, E. Right Tree, Right Place (Urban Canyon): Tree Species Selection Approach for Optimum Urban Heat Mitigation—Development and Evaluation. Sci. Total Environ. 2020, 719, 137461. [Google Scholar] [CrossRef] [PubMed]
- Feng, L.; Shuai, L.; Zhou, Y.; Zhang, X.; Sun, J. Improving the Green Space Arrangement in Residential Areas from the Perspective of Tree Leaf Temperature Utilizing Scenario Simulation in ENVI-Met. Sci. Total Environ. 2024, 918, 170650. [Google Scholar] [CrossRef] [PubMed]
- Zhao, T.F.; Fong, K.F. Characterization of Different Heat Mitigation Strategies in Landscape to Fight against Heat Island and Improve Thermal Comfort in Hot–Humid Climate (Part I): Measurement and Modelling. Sustain. Cities Soc. 2017, 32, 523–531. [Google Scholar] [CrossRef]
- Ouyang, W.; Morakinyo, T.E.; Ren, C.; Ng, E. The Cooling Efficiency of Variable Greenery Coverage Ratios in Different Urban Densities: A Study in a Subtropical Climate. Build. Environ. 2020, 174, 106772. [Google Scholar] [CrossRef]
- Doick, K.J.; Peace, A.; Hutchings, T.R. The Role of One Large Greenspace in Mitigating London’s Nocturnal Urban Heat Island. Sci. Total Environ. 2014, 493, 662–671. [Google Scholar] [CrossRef]
- Grawe, D.; Thompson, H.L.; Salmond, J.A.; Cai, X.-M.; Schlünzen, K.H. Modelling the Impact of Urbanisation on Regional Climate in the Greater London Area. Int. J. Climatol. 2013, 33, 2388–2401. [Google Scholar] [CrossRef]
- Taher, H.; Elsharkawy, H.; Rashed, H.F. Urban Green Systems for Improving Pedestrian Thermal Comfort and Walkability in Future Climate Scenarios in London. Buildings 2024, 14, 651. [Google Scholar] [CrossRef]
- Bruse, M.; Fleer, H. Simulating Surface Plant Air Interactions inside Urban Environments with a Three Dimensional Numerical Model. Environ. Model. Softw. 1998, 13, 373–384. [Google Scholar] [CrossRef]
- Huttner, S. Further Development and Application of the 3D Microclimate Simulation ENVI-Met. Ph.D. Thesis, Johannes Gutenberg-University Mainz, Mainz, Germany, 2012. [Google Scholar]
- Simon, H. Modeling Urban Microclimate: Development, Implementation and Evaluation of New and Improved Calculation Methods for the Urban Microclimate Model ENVI-Met. Ph.D. Thesis, Universitätsbibliothek Mainz, Mainz, Germany, 2016. [Google Scholar]
- Simon, H.; Sinsel, T.; Bruse, M. Advances in Simulating Radiative Transfer in Complex Environments. Appl. Sci. 2021, 11, 5449. [Google Scholar] [CrossRef]
- Tsoka, S.; Tsikaloudaki, A.; Theodosiou, T. Analyzing the ENVI-Met Microclimate Model’s Performance and Assessing Cool Materials and Urban Vegetation Applications—A Review. Sustain. Cities Soc. 2018, 43, 55–76. [Google Scholar] [CrossRef]
- Elraouf, R.A.; ELMokadem, A.; Megahed, N.; Eleinen, O.A.; Eltarabily, S. Evaluating Urban Outdoor Thermal Comfort: A Validation of ENVI-Met Simulation through Field Measurement. J. Build. Perform. Simul. 2022, 15, 268–286. [Google Scholar] [CrossRef]
- Sinsel, T.; Simon, H.; Ouyang, W.; dos Santos Gusson, C.; Shinzato, P.; Bruse, M. Implementation and Evaluation of Mean Radiant Temperature Schemes in the Microclimate Model ENVI-Met. Urban Clim. 2022, 45, 101279. [Google Scholar] [CrossRef]
- Simon, H.; Lindén, J.; Hoffmann, D.; Braun, P.; Bruse, M.; Esper, J. Modeling Transpiration and Leaf Temperature of Urban Trees—A Case Study Evaluating the Microclimate Model ENVI-Met against Measurement Data. Landsc. Urban Plan. 2018, 174, 33–40. [Google Scholar] [CrossRef]
- Emu Analystics. Free Data Sample London Building Heights 2022. Available online: https://www.emu-analytics.com/post/data-packs-from-emu-analytics (accessed on 15 July 2023).
- Royal Parks. Hyde Park Tree Data 2023. Available online: https://www.itreetools.org/documents/350/TreeconomicsHydeParkReport.pdf (accessed on 15 July 2023).
- Elgheznawy, D.; Eltarabily, S. The Impact of Sun Sail-Shading Strategy on the Thermal Comfort in School Courtyards. Build. Environ. 2021, 202, 108046. [Google Scholar] [CrossRef]
- Fabbri, K.; Antonini, E.; Marchi, L. Sun-Shading Sails in Courtyards: An Italian Case Study with RayMan. Sustainability 2023, 15, 13033. [Google Scholar] [CrossRef]
- Perini, K.; Rosasco, P. Cost Benefit Analysis for Green Facades and Living Wall Systems. Build. Environ. 2013, 70, 110–121. [Google Scholar] [CrossRef]
- Manso, M.; Castro-Gomes, J. Green Wall Systems: A Review of Their Characteristics. Renew. Sustain. Energy Rev. 2015, 41, 863–871. [Google Scholar] [CrossRef]
- Manso, M.; Teotónio, I.; Silva, C.M.; Cruz, C.O. Green Roof and Green Wall Benefits and Costs: A Review of the Quantitative Evidence. Renew. Sustain. Energy Rev. 2021, 135, 110111. [Google Scholar] [CrossRef]
- Bruse, M.; Simon, H.; Sinsel, T. Development and Implementation of a High-Resolution Dynamical Wall and Roof Model for ENVI-Met; Part 2: Vegetated Walls and Roofs; ResearchGate: Berlin, Germany, 2023. [Google Scholar] [CrossRef]
- Liu, Z.; Cheng, K.Y.; Sinsel, T.; Simon, H.; Jim, C.Y.; Morakinyo, T.E.; He, Y.; Yin, S.; Ouyang, W.; Shi, Y.; et al. Modeling Microclimatic Effects of Trees and Green Roofs/Façades in ENVI-Met: Sensitivity Tests and Proposed Model Library. Build. Environ. 2023, 244, 110759. [Google Scholar] [CrossRef]
- Ou, Y.; Wang, F.; Zhao, J.; Deng, Q. Risk of Heatstroke in Healthy Elderly during Heatwaves: A Thermoregulatory Modeling Study. Build. Environ. 2023, 237, 110324. [Google Scholar] [CrossRef]
- Gostimirovic, M.; Novakovic, R.; Rajkovic, J.; Djokic, V.; Terzic, D.; Putnik, S.; Gojkovic-Bukarica, L. The Influence of Climate Change on Human Cardiovascular Function. Arch. Environ. Occup. Health 2020, 75, 406–414. [Google Scholar] [CrossRef] [PubMed]
- Chevance, G.; Minor, K.; Vielma, C.; Campi, E.; O’Callaghan-Gordo, C.; Basagaña, X.; Ballester, J.; Bernard, P. A Systematic Review of Ambient Heat and Sleep in a Warming Climate. Sleep Med. Rev. 2024, 75, 101915. [Google Scholar] [CrossRef] [PubMed]
- Orlov, A.; Sillmann, J.; Aunan, K.; Kjellstrom, T.; Aaheim, A. Economic Costs of Heat-Induced Reductions in Worker Productivity Due to Global Warming. Glob. Environ. Chang. 2020, 63, 102087. [Google Scholar] [CrossRef]
- Weilnhammer, V.; Schmid, J.; Mittermeier, I.; Schreiber, F.; Jiang, L.; Pastuhovic, V.; Herr, C.; Heinze, S. Extreme Weather Events in Europe and Their Health Consequences—A Systematic Review. Int. J. Hyg. Environ. Health 2021, 233, 113688. [Google Scholar] [CrossRef] [PubMed]
- Qu, Y.; Zhang, W.; Ryan, I.; Deng, X.; Dong, G.; Liu, X.; Lin, S. Ambient Extreme Heat Exposure in Summer and Transitional Months and Emergency Department Visits and Hospital Admissions Due to Pregnancy Complications. Sci. Total Environ. 2021, 777, 146134. [Google Scholar] [CrossRef] [PubMed]
- VDI Methods for the Human-Biometeorological Assessment of Climate and Air Hygiene for Urban and Regional Planning; VDI 3787, Sheet 2; Beuth: Berlin, Germany, 2008.
- Matzarakis, A.; Amelung, B. Physiological Equivalent Temperature as Indicatior for Impacts of Climate Change on Thermal Comfort of Humans. In Seasonal Forecasts, Climate Change and Human Health; Thomson, M.C., Garcia-Herrera, R., Beniston, M., Eds.; Springer: Dordrecht, The Netherlands, 2008; pp. 161–172. [Google Scholar]
- Davtalab, J.; Deyhimi, S.P.; Dessi, V.; Hafezi, M.R.; Adib, M. The Impact of Green Space Structure on Physiological Equivalent Temperature Index in Open Space. Urban Clim. 2020, 31, 100574. [Google Scholar] [CrossRef]
- Li, X.; Zhang, Y.; Li, D.; Xu, Y.; Brown, R.D. Ameliorating Cold Stress in a Hot Climate: Effect of Winter Storm Uri on Residents of Subsidized Housing Neighborhoods. Build. Environ. 2022, 209, 108646. [Google Scholar] [CrossRef]
- Kumar, P.; Sharma, A. Assessing the Monthly Heat Stress Risk to Society Using Thermal Comfort Indices in the Hot Semi-Arid Climate of India. Mater. Today Proc. 2022, 61, 132–137. [Google Scholar] [CrossRef]
- Lens, F.; Gleason, S.M.; Bortolami, G.; Brodersen, C.; Delzon, S.; Jansen, S. Functional Xylem Characteristics Associated with Drought-Induced Embolism in Angiosperms. New Phytol. 2022, 236, 2019–2036. [Google Scholar] [CrossRef]
- Savi, T.S.; Bertuzzi, S.; Branca, M.; Tretiach, M.; Nardini, A. Drought-Induced Xylem Cavitation and Hydraulic Deterioration: Risk Factors for Urban Trees under Climate Change? New Phytol. 2015, 205, 1106–1116. [Google Scholar] [CrossRef]
- Frank, S.D. Review of the Direct and Indirect Effects of Warming and Drought on Scale Insect Pests of Forest Systems. For. Int. J. For. Res. 2021, 94, 167–180. [Google Scholar] [CrossRef]
- Marchin, R.M.; Backes, D.; Ossola, A.; Leishman, M.R.; Tjoelker, M.G.; Ellsworth, D.S. Extreme Heat Increases Stomatal Conductance and Drought-Induced Mortality Risk in Vulnerable Plant Species. Glob. Chang. Biol. 2022, 28, 1133–1146. [Google Scholar] [CrossRef]
- Simon, H.; Sinsel, T.; Bruse, M. Introduction of Fractal-Based Tree Digitalization and Accurate In-Canopy Radiation Transfer Modelling to the Microclimate Model ENVI-Met. Forests 2020, 11, 869. [Google Scholar] [CrossRef]
- Rogers, K.; Goodenough, J.; Frediani, K.; Watson, J. Hyde Park Tree Benefits. In An Integrated Assessment of Tree Benefits in Hyde Park Using i-Tree Eco and Capital Asset Valuation for Amenity Trees; University of Dundee: Dundee, UK, 2018; Available online: https://discovery.dundee.ac.uk/en/publications/hyde-park-tree-benefits-i-tree-eco-technical-report (accessed on 15 November 2023).
- Dervishi, V.; Fleckenstein, C.; Rahman, M.A.; Pauleit, S.; Ludwig, F.; Pretzsch, H.; Rötzer, T. Trees in Planters—Growth, Structure and Ecosystem Services of Platanus × Hispanica and Tilia cordata and Their Reaction to Soil Drought. Urban For. Urban Green. 2023, 86, 128024. [Google Scholar] [CrossRef]
- Moser, A.; Rahman, M.A.; Pretzsch, H.; Pauleit, S.; Rötzer, T. Inter- and Intraannual Growth Patterns of Urban Small-Leaved Lime (Tilia cordata Mill.) at Two Public Squares with Contrasting Microclimatic Conditions. Int. J. Biometeorol. 2017, 61, 1095–1107. [Google Scholar] [CrossRef]
- Ciupak, A.; Dziwulska-Hunek, A.; Gładyszewska, B.; Kwaśniewska, A. The Relationship between Physiological and Mechanical Properties of Acer platanoides L. and Tilia cordata Mill. Leaves and Their Seasonal Senescence. Sci. Rep. 2019, 9, 4287. [Google Scholar] [CrossRef]
- Andrianjara, I.; Cabassa, C.; Lata, J.-C.; Hansart, A.; Raynaud, X.; Renard, M.; Nold, F.; Genet, P.; Planchais, S. Characterization of Stress Indicators in Tilia cordata Mill. as Early and Long-Term Stress Markers for Water Availability and Trace Element Contamination in Urban Environments. Ecol. Indic. 2024, 158, 111296. [Google Scholar] [CrossRef]
- Teskey, R.; Wertin, T.; Bauweraerts, I.; Ameye, M.; Mcguire, M.A.; Steppe, K. Responses of Tree Species to Heat Waves and Extreme Heat Events. Plant Cell Environ. 2015, 38, 1699–1712. [Google Scholar] [CrossRef]
- Vitasse, Y.; Bottero, A.; Cailleret, M.; Bigler, C.; Fonti, P.; Gessler, A.; Lévesque, M.; Rohner, B.; Weber, P.; Rigling, A.; et al. Contrasting Resistance and Resilience to Extreme Drought and Late Spring Frost in Five Major European Tree Species. Glob. Chang. Biol. 2019, 25, 3781–3792. [Google Scholar] [CrossRef]


Disclaimer/Publisher’s Note: The statements, opinions and data contained in all publications are solely those of the individual author(s) and contributor(s) and not of MDPI and/or the editor(s). MDPI and/or the editor(s) disclaim responsibility for any injury to people or property resulting from any ideas, methods, instructions or products referred to in the content. |
© 2024 by the authors. Licensee MDPI, Basel, Switzerland. This article is an open access article distributed under the terms and conditions of the Creative Commons Attribution (CC BY) license (https://creativecommons.org/licenses/by/4.0/).