Abstract
This study explores the intricate relationship between the growth of medical tourism in Malaysia and its impacts on the local community, particularly focusing on residents’ quality of life. Malaysia’s status as a competitive destination for affordable, high-quality healthcare services has led to significant economic growth, including increased healthcare revenue, job creation, and infrastructure improvements. However, the influx of foreign patients has raised concerns regarding healthcare accessibility for locals and the strain on local resources. Data from 361 respondents were analyzed using Partial Least Squares Structural Equation Modeling (PLS-SEM). The results indicate that medical tourism positively affects economic performance, with a significant path coefficient (β = 0.434, p < 0.01), showing a strong correlation between economic benefits and perceived improvement from medical tourism development. Similarly, personal benefits from the industry have a positive influence on quality of life (β = 0.202, p < 0.05). However, this study also reveals that attitudes towards medical tourism do not significantly impact residents’ perceptions of quality of life (β = 0.057, p > 0.05), highlighting social disparities in how different groups experience the effects of this industry. The findings suggest that while medical tourism offers economic advantages, challenges such as reduced healthcare access for locals and the growing commercialization of healthcare must be addressed. This study concludes with recommendations for sustainable policy interventions to balance the economic growth of medical tourism with the well-being of local communities.
1. Introduction
A significant global industry, medical tourism is defined as the cross-border movement of individuals seeking medical treatment in nations other than their own and has experienced rapid growth in recent years [1]. Malaysia has emerged as a key participant in the medical tourism market thanks to its world-class healthcare facilities, trained medical experts, and cheap pricing. As overseas patients rush to Malaysia for medical treatment, the industry’s expansion has significant economic consequences. However, the growth of medical tourism goes beyond hospital walls, impacting several areas of the host nation, including citizens’ attitudes and quality of life.
The revival of medical tourism occurred during the 18th century. Medical tourism experienced a recovery in Bath, Britain, when affluent Europeans embarked on journeys to avail themselves of the therapeutic attributes of water while simultaneously asserting their social standing. Napoleon III of France initiated a new enthusiasm for the thermal advantages of water. During the early 20th century, the French Riviera, renowned for its conducive climate for therapeutic purposes, garnered significant attention from affluent individuals. Over the course of time, novel patterns have arisen from this form of tourism [2]. The tourism industry experienced significant transformations following World War II, characterized by advancements in social, political, economic, and logistical aspects. These changes led to a rise in tourist activity, leisure, and entertainment. Over time, tourism has begun to divide into various specialized markets, with medical tourism experiencing notable growth [2]. A historical perspective on medical tourism is shown in Figure 1.
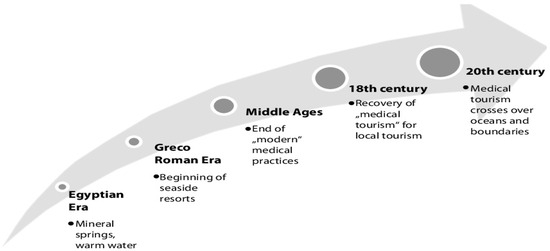
Figure 1.
Historical perspective on medical tourism [2].
In Figure 2, it becomes evident that the patient–tourist encounters a comparable array of challenges, regardless of whether they are contemplating travel for significant surgical procedures or rehabilitation treatments. There exists a positive correlation between risk perception and the type of treatment received. For instance, during a significant surgical procedure, the patient undergoes a series of crucial steps to comprehend the service being provided to them and the potential hazards linked to each stage of the procedure. Consequently, patients undergoing major surgery exhibit a greater level of risk perception compared to those receiving spa therapy. Nevertheless, when individuals seeking wellness therapy encounter a limited number of straightforward concerns, primarily pertaining to the geographical region (such as water type and climatic preference) and the nature of the wellness programs available, insufficient consideration is given to the proficiency of the practitioners employed in these healthcare facilities.
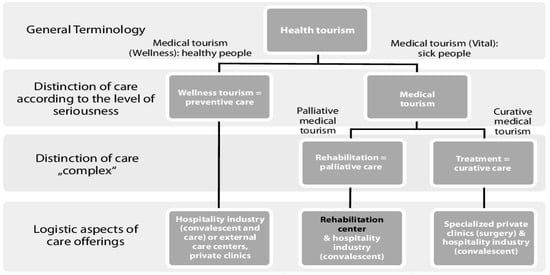
Figure 2.
A variety of medical tourism services [2].
Malaysia’s medical tourism sector has shown remarkable growth in recent years, positioning the country as a leading destination for healthcare services in the region. The most recent statistics on the growth of medical tourism in Malaysia are shown in Table 1.

Table 1.
Growth of medical tourism in Malaysia [3].
This extensive study aims to explore the complex relationship between the rise of medical tourism in Malaysia and the views of its people, as well as any potential impact on their standard of living. The healthcare system and wider society of Malaysia have undergone significant changes as a result of Malaysia’s success in luring medical tourists. These developments have raised complicated concerns and thoughts about the implications for the local community, both good and negative. Medical tourism has a wide variety of effects on inhabitants, including economic, social, cultural, and environmental components. It also includes the host community’s availability and cost of healthcare services. Understanding how Malaysian residents perceive these changes and the resulting effects on their quality of life is critical for policymakers, healthcare providers, and stakeholders in the medical tourism industry to strike a harmonious balance between economic growth and host community welfare.
The economic advantages of medical tourism in Malaysia are obvious in a variety of ways. For starters, the surge of overseas patients has resulted in a considerable boost in healthcare income. The demand for private hospitals and healthcare providers has increased, resulting in larger revenues and expenditures for cutting-edge medical equipment and infrastructure. As a result, Malaysia’s image as a healthcare center has grown. Additionally, the medical tourism sector directly contributes to job growth by offering employment possibilities for a broad spectrum of specialists, including medical professionals, nurses, office workers, and support services [4]. This is especially significant in areas with a large concentration of medical tourism facilities since it helps local citizens’ income levels and lowers unemployment rates.
Another significant economic advantage of medical tourism is the improvement of the infrastructure. Malaysia has made investments in enhancing its infrastructure in order to handle the increasing number of foreign patients [5]. These improvements include its transit network, its lodging alternatives, and other areas. These upgrades not only improve the experience of medical tourists but also help locals by raising the standard of infrastructure as a whole. Malaysia’s healthcare travel industry has been resilient, with a revenue of MYR 1.4 billion recorded as of August 2023. Although Malaysia has made considerable progress in terms of healthcare services, physical infrastructure, and leveraging human capital to increase tourist happiness, neighboring nations have also used this strategy [6]. Cancer therapy had the greatest revenue share in 2022 and is expected to continue to do so. This is due to global cancer rates growing. According to the International Agency for Research on Cancer, 19.3 million new cancer cases and 10 million cancer-related deaths occurred worldwide in 2020.
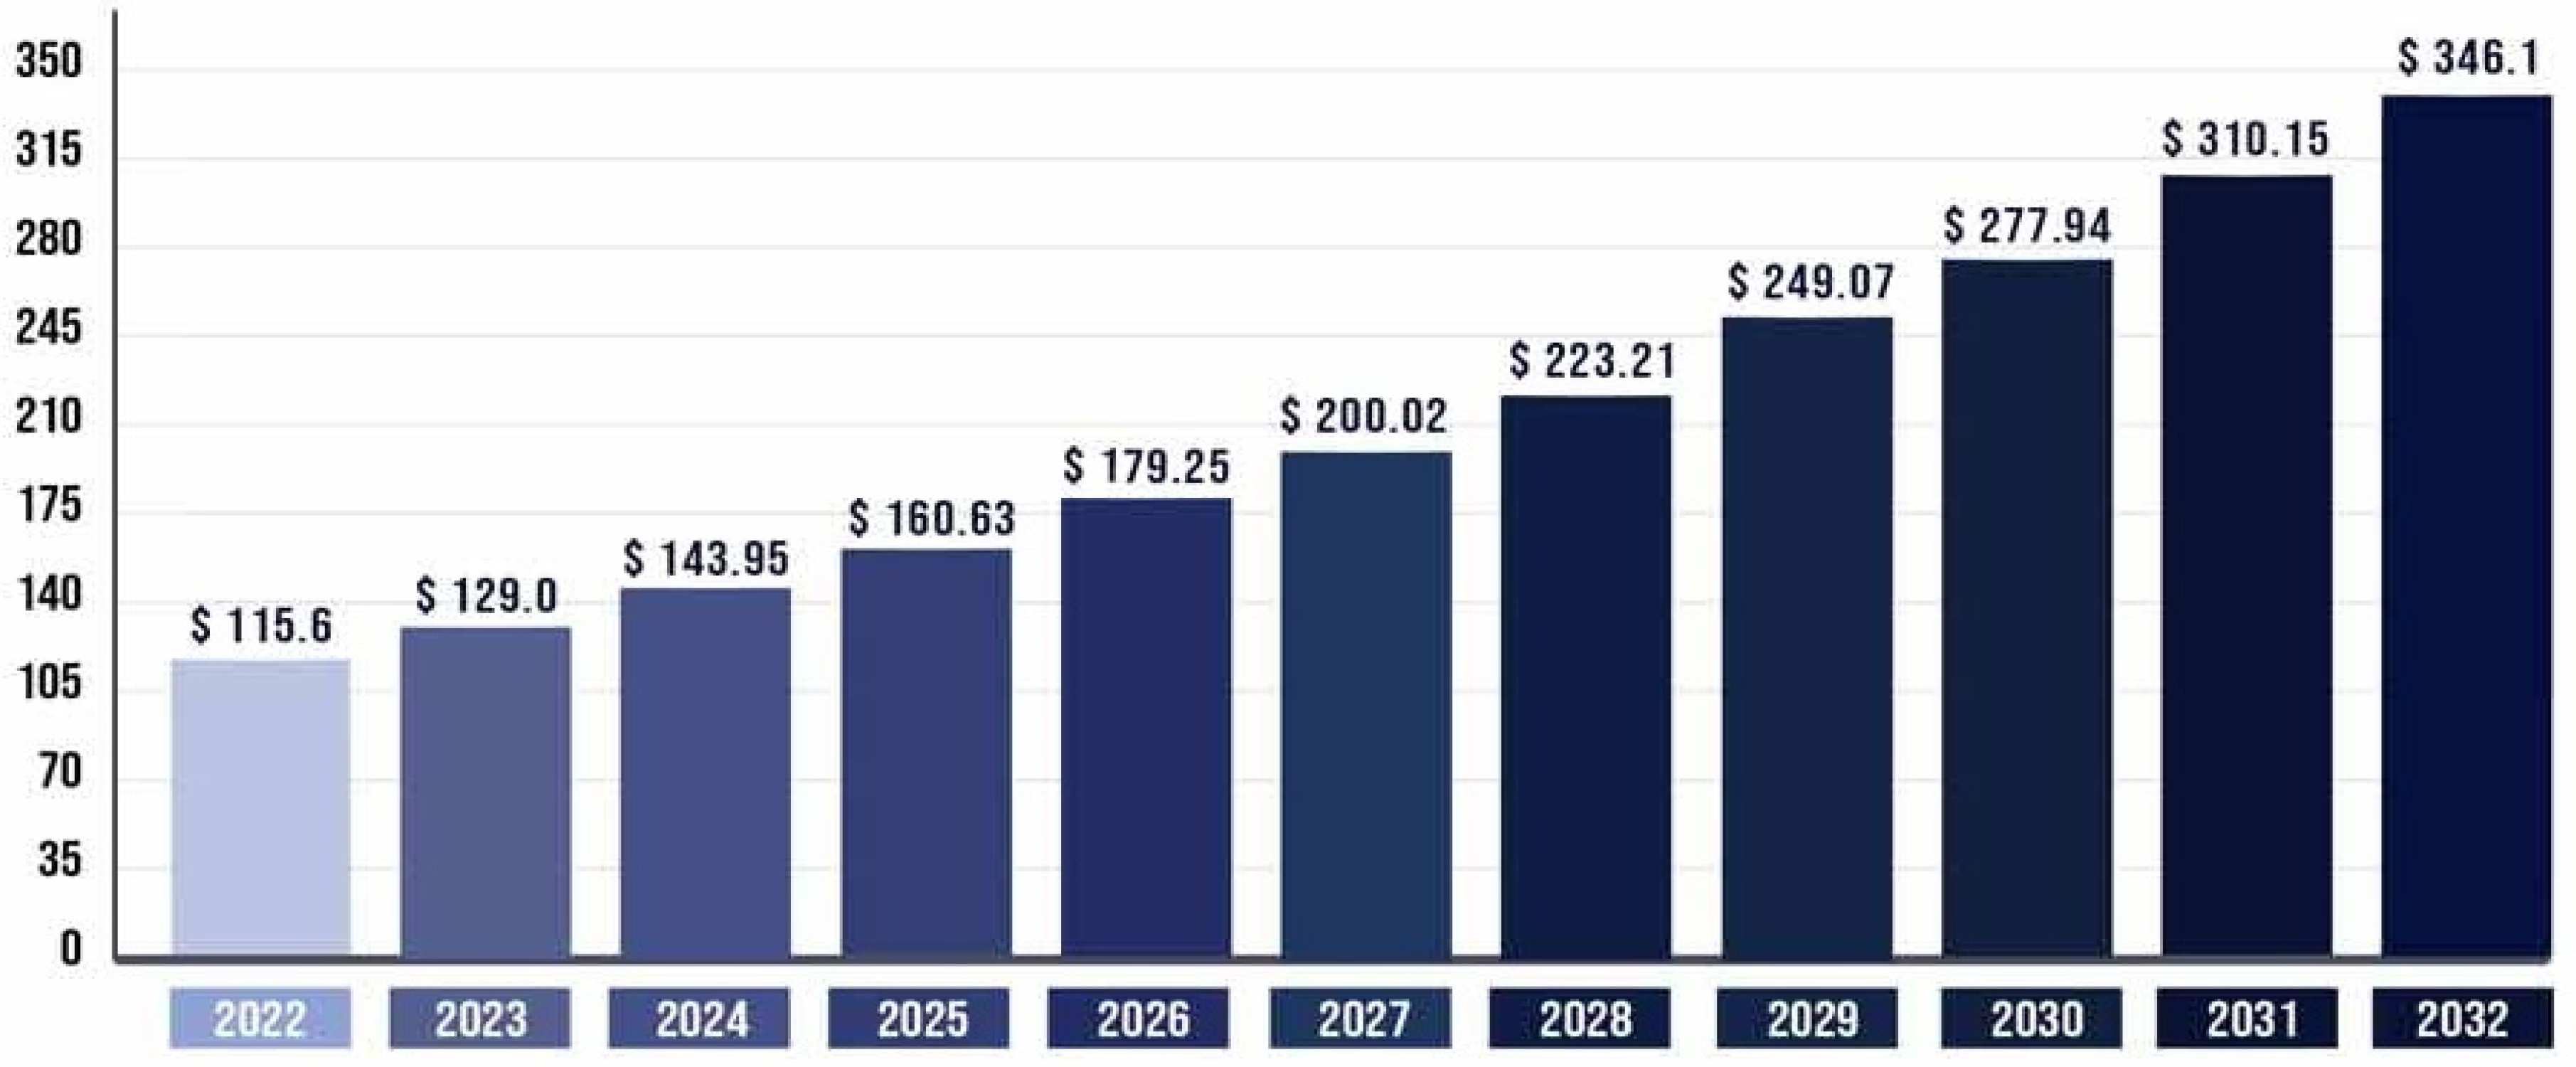
The estimated value of the worldwide medical tourism industry in 2022 was USD 115.6 billion. It is projected to reach around USD 346.1 billion by 2032, with a compound annual growth rate (CAGR) of 11.59% from 2023 to 2032, which is shown in Figure 3.
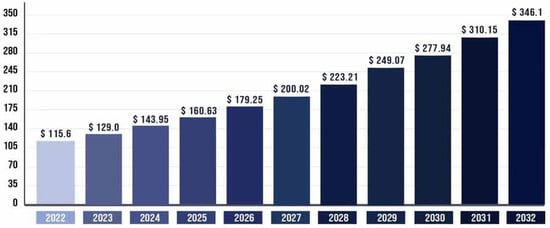
Figure 3.
Medical tourism market size worldwide [6].
Historically, medical tourism has evolved from its roots in 18th-century Europe, where affluent individuals sought therapeutic treatments, to its present-day global phenomenon driven by advancements in healthcare and tourism infrastructure. For Malaysia, the growth of this sector extends beyond economic gains, influencing various aspects of local communities, including healthcare accessibility, cultural integration, and residents’ quality of life. As reflected in this study, while medical tourism has led to increased healthcare revenue, job creation, and infrastructure development, it has also raised concerns regarding the prioritization of foreign patients over locals, resource allocation, and potential social inequities.
This study seeks to explore the intricate relationship between the expansion of medical tourism in Malaysia and its impacts on the local community. Using Partial Least Squares Structural Equation Modeling (PLS-SEM), the research examines how perceived economic benefits, personal advantages, and satisfaction with healthcare services contribute to residents’ quality of life. Additionally, this study delves into the challenges posed by the industry, such as healthcare commercialization, disparities in service quality, and ethical considerations, while identifying opportunities for sustainable development. By addressing these dynamics, this research aims to provide actionable insights for policymakers and stakeholders to balance economic growth with the well-being of local communities.
The rest of this paper is as follows: In Section 2 and Section 3, we explore the economic implications of medical tourism development, including economic benefits, challenges, and social and cultural implications, respectively. Environmental considerations and healthcare accessibility factors that shape residents’ perceptions are discussed in Section 4 and Section 5, respectively. In Section 6, we delve into the central question of whether the expansion of medical tourism in Malaysia has enhanced or compromised the quality of life for its residents. Through this in-depth exploration, we aim to unravel the complexities of this rapidly evolving industry and its intricate interplay with the lives of the people who call Malaysia home. A literature review, theoretical framework, and overall discussion are elaborated on the following sections.
2. Literature Review
Medical tourism’s explosive rise can nevertheless also put a burden on the infrastructure and resources of the local community. Residents’ daily routines may be inconvenienced and disrupted as a result of traffic congestion, population growth, and changes in land use patterns. Concerns concerning the emergence of socioeconomic inequities as a result of the growth of medical tourism may also exist. While some locals get jobs and business possibilities thanks to the sector, others might not have access to these benefits and can feel excluded or left behind. The challenges of social and cultural implications of medical tourism in Malaysia are shown in Table 2.
Table 2.
Challenges of social and cultural implications of medical tourism in Malaysia [7].
Access to healthcare services for locals may be made easier as a result of the growth of medical tourism. Local residents may have access to a greater choice of medical services and specializations as a consequence of the growth of healthcare facilities and increasing investment in medical technology and knowledge [8]. Residents who seek specialist medical treatment may benefit from shorter travel distances and lower costs. Additionally, the rivalry among private healthcare organizations serving customers from other countries can encourage improvements in all areas of service quality and patient care. Residents who depend on these institutions for their healthcare requirements may benefit from this.
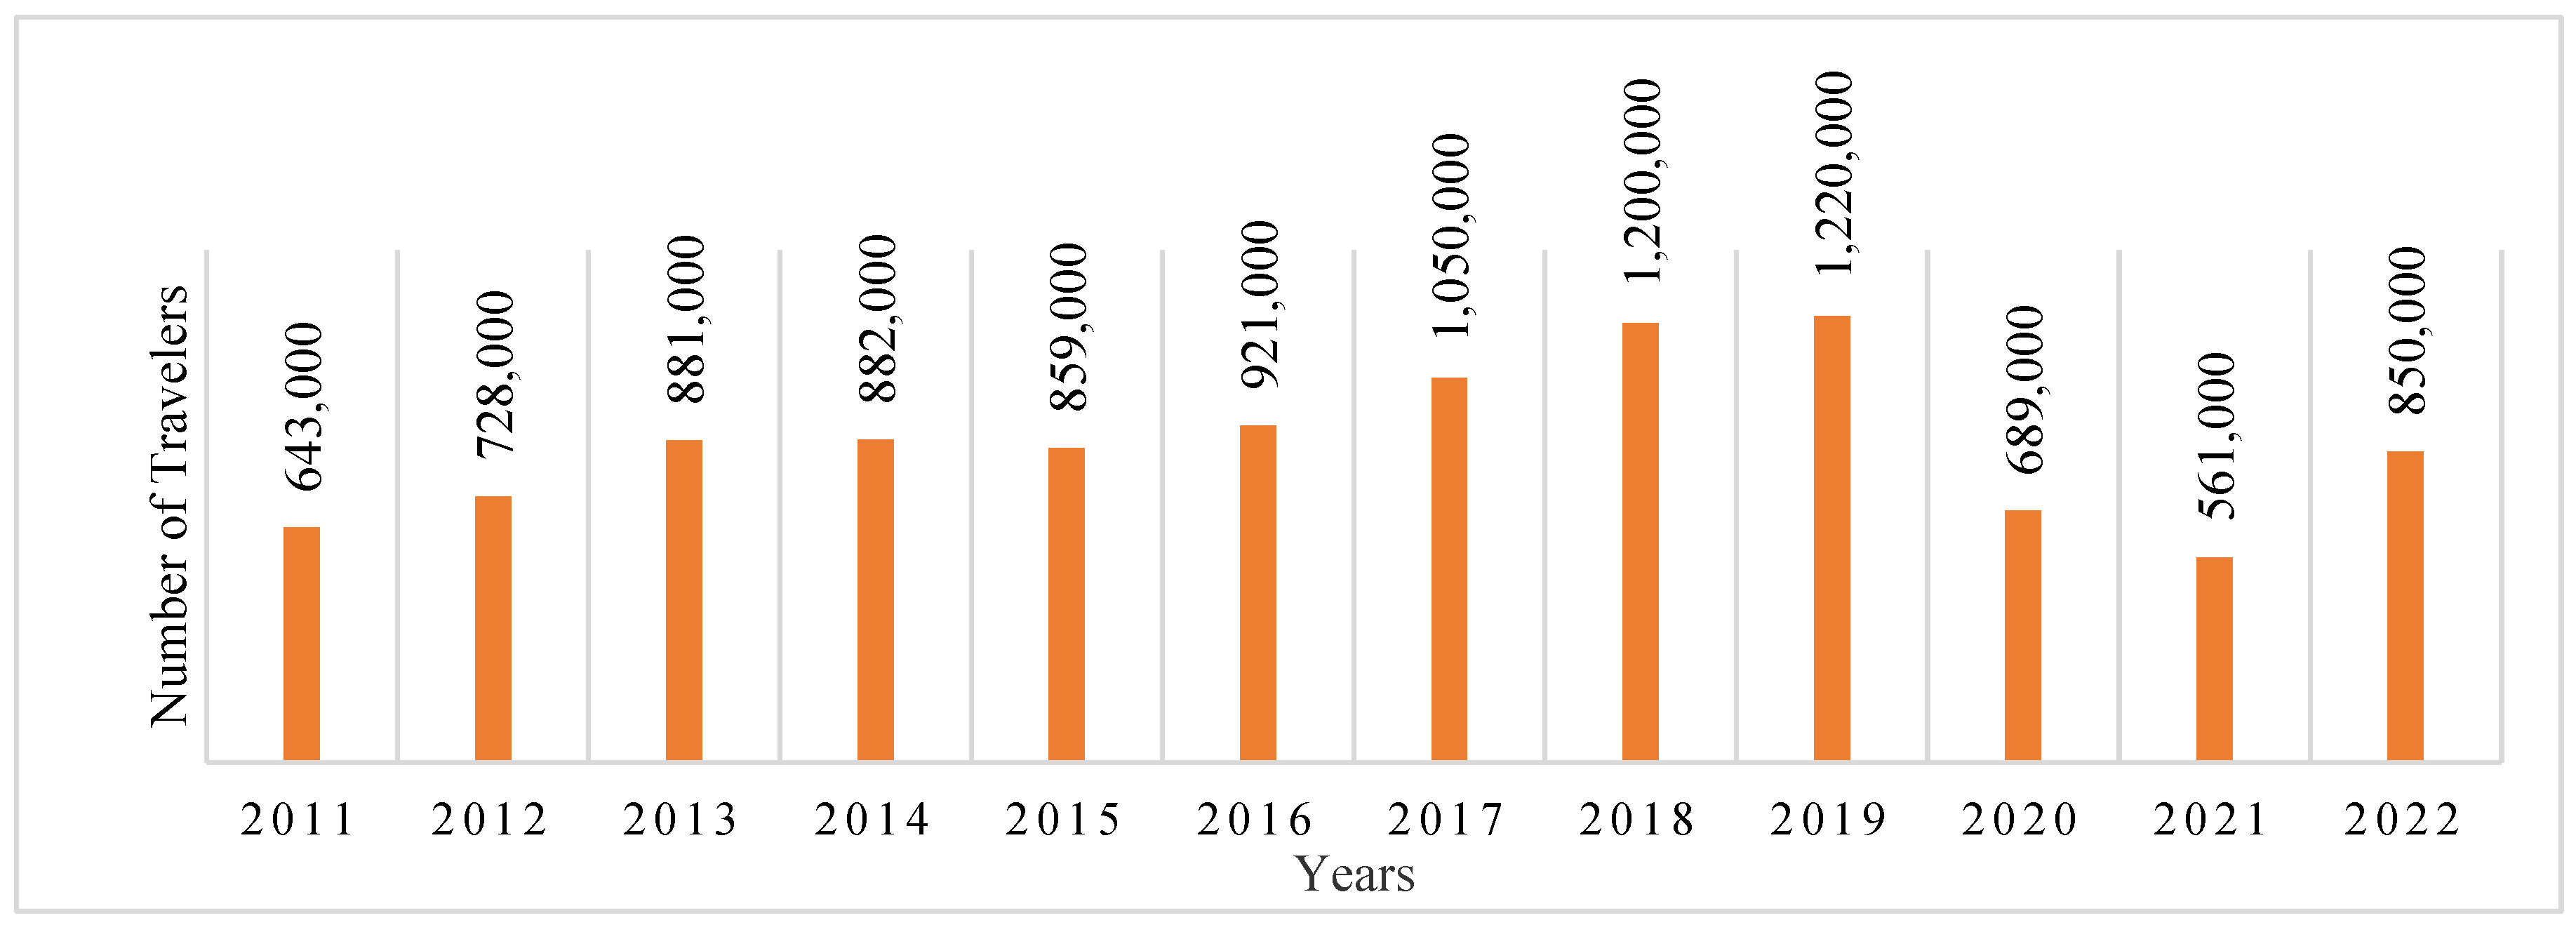
Compared to many Western nations, medical services in Malaysia are frequently more economical. Patients can receive high-quality medical care for much less money than they would in their native nations. The Malaysian government aggressively promotes healthcare professionals with assistance and incentives. This has aided in the growth of a thriving medical tourism sector. Figure 4 shows the healthcare traveler volume from 2013 to 2022.
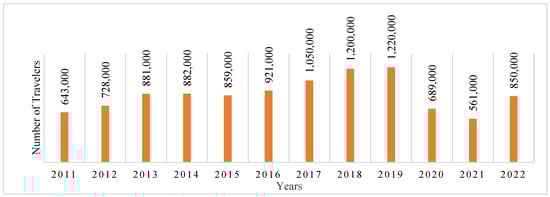
Figure 4.
Healthcare traveler volume (2011–2022) [9].
On the other hand, as a result of the growth of medical tourism, there can be worries regarding the price of healthcare services for locals. Healthcare prices may vary depending on whether medical tourists pay a different price structure than local patients [10]. Residents who depend on private healthcare providers may incur greater costs, especially if healthcare providers give priority to foreign patients who can afford higher charges. Residents who feel that the healthcare system is becoming less accessible and inexpensive for them may find this pricing gap to be a source of aggravation and unhappiness. It could prompt demands for the sector to adopt more open pricing and billing procedures.
An important topic that has been debated for around 30 years is how locals feel about tourists. According to resident’s perspectives, some research has looked at the effects of medical tourism on residents’ quality of life [11]. They discovered that community inhabitants’ support for medical travel is closely correlated with their opinions about the health of their neighborhood, which has an effect on resident’s quality of life. In this area, there has not been a lot of research conducted on the subject of how medical tourism affects quality of life from the perspective of locals. In studies where quality of life is a key component, there is a correlation between inhabitants’ contentment and their living conditions [11]. Medical tourism is defined as travel outside one’s natural medical authority for the improvement of the person’s health through medical mediation [12]. Medical tourism involves the complete physical, mental, and social well-being of an individual that also impacts the physical, psychological, social, and environmental dimensions of the tourism industry, as defined by the World Health Organization [13]. Several global and local travel agencies are known in the media for their contribution towards medical tourism development as well as in admitting compulsory, elective health; different therapies; food and beverages; and the entertainment facilities of a place [11].
Malaysia is placed in a strategically difficult domestic and global market in terms of healthcare positions [14]. Malaysia also faces an aging population, decreasing insurance facilities, increasing medical costs, and decreasing the number of healthcare professionals in the population [15]. Moreover, private medical costs are increasing globally, and there are long waiting lists in the government healthcare system where the patient-to-doctor ratio is high [16]. Malaysia has the ability to attract international patients for medical tourism. It promotes high-class medical tourism for international medical tourists for cheap costs [17]. According to the Malaysian medical tourism strategy, the Malaysian government has played an essential role in starting and spreading financial contributions as well as social welfare [11]. Developing quality of life, standard of living, and medical procedures; increasing tax revenues; and increasing job scopes in caring for international patients have improved domestic medical facilities [18]. On the other hand, medical tourism development has turned domestic medical facilities into business exploitation [19]. It has also created inconsistent effects such as high costs, decreased medical facilities, diversion of government funds, overcrowding of international patients, decreased traffic control, and negative connections between community residents and international patients [20,21]. Day by day, Malaysia is starting to develop medical tourism resources and also recognizes the community residents’ opinions regarding said development [22]. Medical tourism development in a community does not easily match the development of medical tourism with the additional demand of international patients [23]. However, Malaysian community residents are helpful for the development of medical tourism and enhance other residents’ quality of life.
Community resident’s quality of life and healthcare facilities are important for attracting international tourists as medical visitors [24]. Citizen support of medical tourism is mandatorily maintained by residents’ enjoyment and desires. Moreover, medical tourism improvement influences residents’ quality of life, which impacts individual investment and support for medical tourism development. This is an important topic that has been given proper attention to understand how resident’s perception of health tourism influences their quality of life [25]. Table 3 summarizes the research findings with future work related to the transformation of medical tourism.
Table 3.
Summary of the research findings with future work related to the transformation of medical tourism.
The economic benefits of medical tourism are well documented, including increased healthcare revenue, job creation, and infrastructure improvements. These advantages significantly enhance residents’ perceptions of economic well-being and their overall quality of life. However, concerns such as the commercialization of healthcare and unequal resource allocation remain. For instance, Afthanorhan [36] found that economic gains from medical tourism often fail to translate into equitable benefits for local communities.
Hypothesis 1a (H1a):
The economic performance of medical tourism significantly influences residents’ quality of life.
Hypothesis 1b (H1b):
The economic performance of medical tourism significantly influences perceived improvements in medical tourism development.
The personal benefits that residents derive from medical tourism such as access to advanced healthcare services and employment opportunities positively influence their quality of life. Similarly, satisfaction with healthcare services correlates strongly with residents’ support for tourism development [4]. However, unequal prioritization of foreign patients over locals can diminish these benefits and create dissatisfaction.
Hypothesis 2a (H2a):
Satisfaction with healthcare services significantly influences residents’ quality of life.
Hypothesis 2b (H2b):
Satisfaction with healthcare services significantly influences perceived improvements in medical tourism development.
Hypothesis 3a (H3a):
Personal benefits derived from medical tourism significantly enhance residents’ quality of life.
Hypothesis 3b (H3b):
Personal benefits derived from medical tourism significantly influence perceived improvements in medical tourism development.
Hypothesis 4a (H4a):
Overall community satisfaction derived from medical tourism significantly enhance residents’ quality of life.
Hypothesis 4b (H4b):
Overall community satisfaction derived from medical tourism significantly influence perceived improvements in medical tourism development.
Residents’ attitudes toward medical tourism play a critical role in shaping their perceptions of its impact on community well-being. Suess et al. [11] highlighted that positive attitudes often stem from perceived economic and infrastructural improvements. Conversely, negative attitudes may arise from concerns about healthcare accessibility and cultural disruption.
Hypothesis 5a (H5a):
Attitudes toward medical tourism significantly influence residents’ quality of life.
Hypothesis 5b (H5b):
Attitudes toward medical tourism significantly influence perceived improvements in medical tourism development.
Perceived improvements, such as better healthcare infrastructure and enhanced quality of services, mediate the relationship between economic performance, healthcare satisfaction, and quality of life. According to Nilashi et al. [14], these perceptions are essential for fostering community support for medical tourism initiatives.
Hypothesis 6 (H6):
Perceived improvements in medical tourism development positively influence residents’ quality of life.
The literature suggests that perceived improvements act as a mediator, linking economic performance, personal benefits, satisfaction with healthcare services, overall community satisfaction, and Attitudes toward medical tourism to quality of life. For example, Thomas et al. [37] argue that improvements in healthcare services often lead to broader social acceptance of medical tourism’s economic and infrastructural changes.
Hypothesis 7 (H7):
Perceived improvements mediate the relationship between economic performance and quality of life.
Hypothesis 8 (H8):
Perceived improvements mediate the relationship between personal benefits and quality of life.
Hypothesis 9 (H9):
Perceived improvements mediate the relationship between satisfaction with healthcare services and quality of life.
Hypothesis 10 (H10):
Perceived improvements mediate the relationship between overall community satisfaction and quality of life.
Hypothesis 11 (H11):
Perceived improvements mediate the relationship between attitudes toward medical tourism and quality of life.
3. Data Analysis
The collected data were thoroughly examined using the PLS-SEM technique to explore the relationships between exogenous and endogenous variables, as well as to assess the mediating and moderating effects within the model. Following the analysis, the findings from both the PLS measurement and structural models were systematically documented. Key areas covered include the response rate, respondent demographics, frequency distribution, descriptive statistical analysis, missing data management, normality testing, multicollinearity assessment, and a comprehensive evaluation of reliability and validity. Additionally, the analysis provides a clear summary of the hypotheses testing results, all of which were derived using the advanced capabilities of SmartPLS version 4.0 software.
3.1. Response Rate
The response rate refers to the percentage of participants who provide feedback in a survey, and it plays a crucial role in ensuring the accuracy and reliability of the results. For this study, a total of 500 questionnaires were distributed to participants via a physical survey, each accompanied by a formal request letter. Ethical approval for this study was obtained in accordance with the practices and guidelines set forth by the Multimedia University’s Research Ethics Committee. This study was reviewed and approved by the Multimedia University’s Research Ethics Committee. Informed consent was obtained from all participants involved in the study. Consent was written, and participants were fully briefed on the purpose of the research, their rights, and how their data would be used; respondents were assured of their anonymity and confidentiality. This transparent approach encouraged participation, contributing to a robust response rate, as detailed in Table 4.
Table 4.
Response to questionnaire survey.
As shown in Table 4, out of the 500 questionnaires distributed, 380 were successfully returned, resulting in an initial response rate of 76%. However, 19 of these were found to be incomplete, with significant portions of data missing, and thus were excluded from the final analysis, as their inclusion would not accurately represent the sample [38]. Ultimately, 361 fully completed questionnaires were deemed valid, bringing the effective response rate to 72.2%. This is well above the recommended minimum response rate of 30% for survey research, as suggested by Sekaran and Bougie [39], affirming the robustness of the data collected.
3.2. Respondent’s Profile
This section provides a detailed breakdown of the respondents’ demographic information, encompassing gender, age, education level, nationality, and race. In market research, understanding the demographic profile is crucial, as it offers valuable insights into consumer behaviors, including green consumption practices, and helps visualize market segmentation based on these profiles [40]. As illustrated in Table 5, the gender distribution is nearly balanced, with 182 respondents (50.4%) identifying as male and 179 (49.6%) as female. In terms of age, 16 respondents (4.4%) are below 17 years old, 103 respondents (28.5%) fall between the ages of 17 and 30, 148 respondents (41%) are between 31 and 49 years old, and 94 respondents (26%) are over 50 years of age. Regarding educational qualifications, 106 respondents (29.4%) hold a diploma, 115 (31.9%) have a bachelor’s degree, and 135 (37.4%) possess a master’s degree, while only a small fraction, 1.4% (five respondents), having completed higher secondary education. This diverse demographic data provide a clearer understanding of the characteristics of the study’s participants and aid in analyzing their behaviors and preferences.
Table 5.
Demography of the respondents.
Table 5 also shows the nationality of the respondents, where 334 (92.5 percent) are Malaysian and 27 (7.5 percent) are others. In terms of race of the respondents, 148 (41 percent) are Malay; 115 (31.9 percent) are Chinese; 64 (17.7 percent) are Indian, and the rest (34) of the respondents have another identity.
3.3. Descriptive Statistics Analysis
Descriptive analysis provides an overall statistical snapshot of the variables in this study, focusing on key metrics such as the minimum, mean, maximum, and standard deviation. The minimum value represents the lowest recorded responses, while the mean indicates the average response level among participants. The maximum reflects the highest response, and the standard deviation measures the degree of variability or dispersion in the data. In this study, the responses were gathered using a five-point Likert scale, ensuring a uniform approach to data collection. Table 6 summarizes the descriptive statistics for all the variables, offering insights into the distribution of responses. These metrics, including the minimum, maximum, mean, and standard deviation, help paint a clearer picture of how respondents perceive various aspects of this study, allowing for a deeper understanding of the data patterns.
Table 6.
Descriptive statistics of variables.
The descriptive statistics presented in Table 6 show that all variables in this study received a maximum response of 5 and a minimum response of 1. The mean values for all variables are higher than 3.5, with some nearing 4, indicating a generally positive response trend across the survey. The degree of variability in the data can be assessed through the standard deviation, which measures how spread out the responses are from the mean. A smaller standard deviation suggests that the data points are closely clustered around the mean, reflecting consistency in the responses. From Table 6, it is evident that the standard deviation for all variables is below 1, signifying relatively low variability. This indicates a high level of agreement among the respondents, with most responses showing minimal deviation from the average. The findings suggest a strong similarity in perceptions across the measured variables.
3.4. Missing Value Analysis
Missing values, or missing data, occur when valid responses for one or more variables are absent from the analysis [41], a common issue in multivariate analysis. To mitigate the negative impact of missing values, the researcher implemented precautionary measures in the field, checking for incomplete data upon retrieval of the questionnaires. Respondents were kindly asked to fill in any observed gaps, which likely helped minimize the occurrence of missing data.
As noted by Hair et al. [38], there are several reasons for missing data, including respondents’ difficulty in understanding certain questions or a lack of willingness to provide answers. It can also result from researcher error during data entry [41]. Given the prevalence of missing values in data analysis, various methods exist to handle them. In this study, the “drop the case method” was employed, following the recommendation of Reinartz et al. [42]. Consequently, 19 incomplete questionnaires were excluded from the analysis, while careful steps were taken to ensure that the remaining data were fully and accurately captured for further examination.
3.5. Normality Test
Normality, a key assumption in multivariate analysis, pertains to how closely the distribution of a metric variable aligns with the normal distribution [41]. While several researchers [43,44] have demonstrated that PLS-SEM can handle non-normal data effectively. Bagozzi [45] emphasizes that it is still important to consider data distribution. Their argument suggests that highly skewed data can increase bootstrap standard errors, potentially underestimating the statistical significance of path coefficients [46].
To address this, this study applied multivariate normality to assess the data distribution using Kurtosis (the degree of peakedness or flatness relative to a normal distribution) and Skewness (the symmetry of the data distribution around its center) [47]. Both Skewness and Kurtosis are empirically measured through various statistical software programs. The results, as presented in Table 7, show that the Skewness and Kurtosis values for the metric variables were below the critical threshold of 2.58 [48], thereby confirming that the data meet the normality assumption for this analysis.
Table 7.
Normality test results.
3.6. Multicollinearity
Before evaluating the structural model, it is essential to first check the measurement model for potential multicollinearity issues. Multicollinearity occurs when independent (exogenous) variables are highly correlated, which can distort the results of the analysis. To detect multicollinearity, this study analyzed both the Variance Inflation Factor (VIF) and tolerance values. The general rule of thumb suggests that VIF values should be 5 or lower, while tolerance values should be 0.20 or higher to avoid multicollinearity issues [48,49]. In this study, all exogenous variables had VIF values below 5, and tolerance levels were greater than 0.20, confirming the absence of any multicollinearity problems. This ensures that the relationships among the variables are stable and reliable, allowing for a more accurate assessment of the structural model [44,50].
4. PLS-SEM Analysis Results
In the interpretation of PLS-SEM analysis results, it is essential to emphasize that statistical significance, indicated by p-values, serves only as a measure of the compatibility of the data with the specified model and not as an indicator of the probability that the studied hypothesis is true or of the effect’s magnitude. While p-values provide valuable insights, they are not sufficient on their own to draw definitive scientific conclusions or inform business or policy decisions. To ensure robust inference, this study complements p-values with other statistical metrics, including path coefficients, t-values, and effect sizes, to provide a comprehensive understanding of the relationships between variables. Full transparency has been maintained by reporting all relevant coefficients, standard errors, and confidence intervals, as presented in Table 8. Furthermore, the practical implications of the findings have been discussed in detail to contextualize the statistical results, acknowledging the limitations of relying solely on statistical significance and emphasizing the real-world relevance of the outcomes. In Partial Least Squares Structural Equation Modeling (PLS-SEM) analysis, the PLS measurement model provides crucial insights into the relationships between variables by presenting results from reliability tests, validity tests, and path coefficients, along with the coefficient of determination (R2). In a PLS-SEM model, variables are interconnected, illustrating the direction and strength of relationships between exogenous (independent) and endogenous (dependent) variables. Specifically, the measurement model presents three key values: the path coefficient, item loadings, and the coefficient of determination (R2). In this study, five exogenous variables and one mediator, one moderator, and one endogenous variable are analyzed, with the findings documented in Table 8.
Table 8.
Measurement properties of constructs.
The reliability of the model is assessed by observing Cronbach’s alpha values and composite reliability scores, which indicate the internal consistency of the data. For validity, PLS-SEM evaluates two forms: convergent validity and discriminant validity. These tests ensure that the measurement model accurately captures the intended constructs and that the relationships between variables are reliable. The PLS-SEM measurement model is shown in Figure 5, illustrating the relationships between observed variables and their respective latent constructs. It highlights the outer model’s item loadings and the connections between the constructs, focusing on reliability and validity indicators such as Cronbach’s alpha and average variance extracted (AVE).
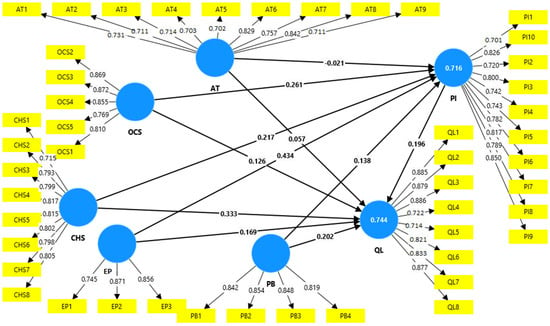
Figure 5.
PLS-SEM measurement model.
4.1. Reliability Test
The initial step in evaluating the measurement model (outer model) is to assess the reliability and validity of the constructs. Reliability, which reflects the internal consistency of the data, is gauged using Cronbach’s alpha and composite reliability values. According to established criteria, all constructs should achieve a Cronbach alpha value exceeding 0.70, and composite reliability values must also surpass this threshold [39,51].
As detailed in Table 8, all constructs in this study demonstrated Cronbach alpha and composite reliability values above 0.70, indicating a strong internal consistency within the data. This confirms that the constructs used in the analysis are reliable and consistent, thus establishing the robustness of the measurement model and supporting the overall validity of the study’s findings [38].
4.2. Convergent Validity
Convergent validity assesses how well individual items reflect a specific construct, particularly in comparison to items measuring different constructs [38]. To evaluate convergent validity, the average variance extracted (AVE) and factor loadings of each construct are analyzed. A construct is considered to have established convergent validity when its AVE value exceeds 0.50.
As presented in Table 8, all constructs in this study exhibit AVE values above 0.50, confirming their convergent validity. Additionally, the absolute standardized outer loadings for all items are above 0.70. While Sarstedt et al. [44] states that loadings exceeding 0.5 are generally acceptable. Hair et al. [48] indicates that loadings of 0.40 and above can be considered valid if other indicators are present within the block for comparison. Given that all item loadings in this study are higher than 0.70 and are statistically significant, this further affirms the convergent validity at the indicator level. Therefore, the AVE values above 0.50 for all constructs and item loadings above 0.70 collectively establish the convergent validity of the constructs in this research.
4.3. Discriminant Validity
Discriminant validity assesses the degree to which a specific latent construct is distinct from other latent constructs [38,44]. It is confirmed when the indicator loadings for a construct are significantly higher than their cross-loadings with other constructs, and when the square root of each construct’s average variance extracted (AVE) exceeds its correlations with other constructs [38]. The initial step in evaluating discriminant validity involves analyzing the indicator loadings in relation to all construct correlations. The SmartPLS algorithm is utilized to generate the cross-loadings for all items. As indicated in Table 9, each item loads significantly higher on its respective construct compared to its cross-loadings with other constructs, thereby meeting the criteria for establishing discriminant validity in the measurement model [38]. This confirms that each construct in the model is distinct and effectively measures its intended concept.
Table 9.
Factor loadings and cross-loadings.
Secondly, the square root of the average variance extracted (AVE) for each construct was compared with the correlations between that construct and all other constructs. As illustrated in Table 10, the square roots of the AVEs are greater than the highest correlation values between each construct and the other constructs. This finding further supports the discriminant validity of the constructs in this study, indicating that each construct is adequately distinct from the others [38,44] as shown in Table 10.
Table 10.
Discriminant validity assessment.
4.4. Coefficient of Determination (R2)
The coefficient of determination (R2) value indicates how much variation in endogenous variables is caused by the exogenous variables. This present study has a R2 value of 0.744 for quality of life, which indicates that all the exogenous variables can explain a quality of life of 74.40%, which is shown in Table 11.
Table 11.
Coefficient of determination (R2).
On the other hand, this present study reveals that the perceived improvement of medical tourism (R2, 0.716) is 71.60 percent, influenced by the exogenous variables.
5. Structural Model Assessment for Hypotheses Testing
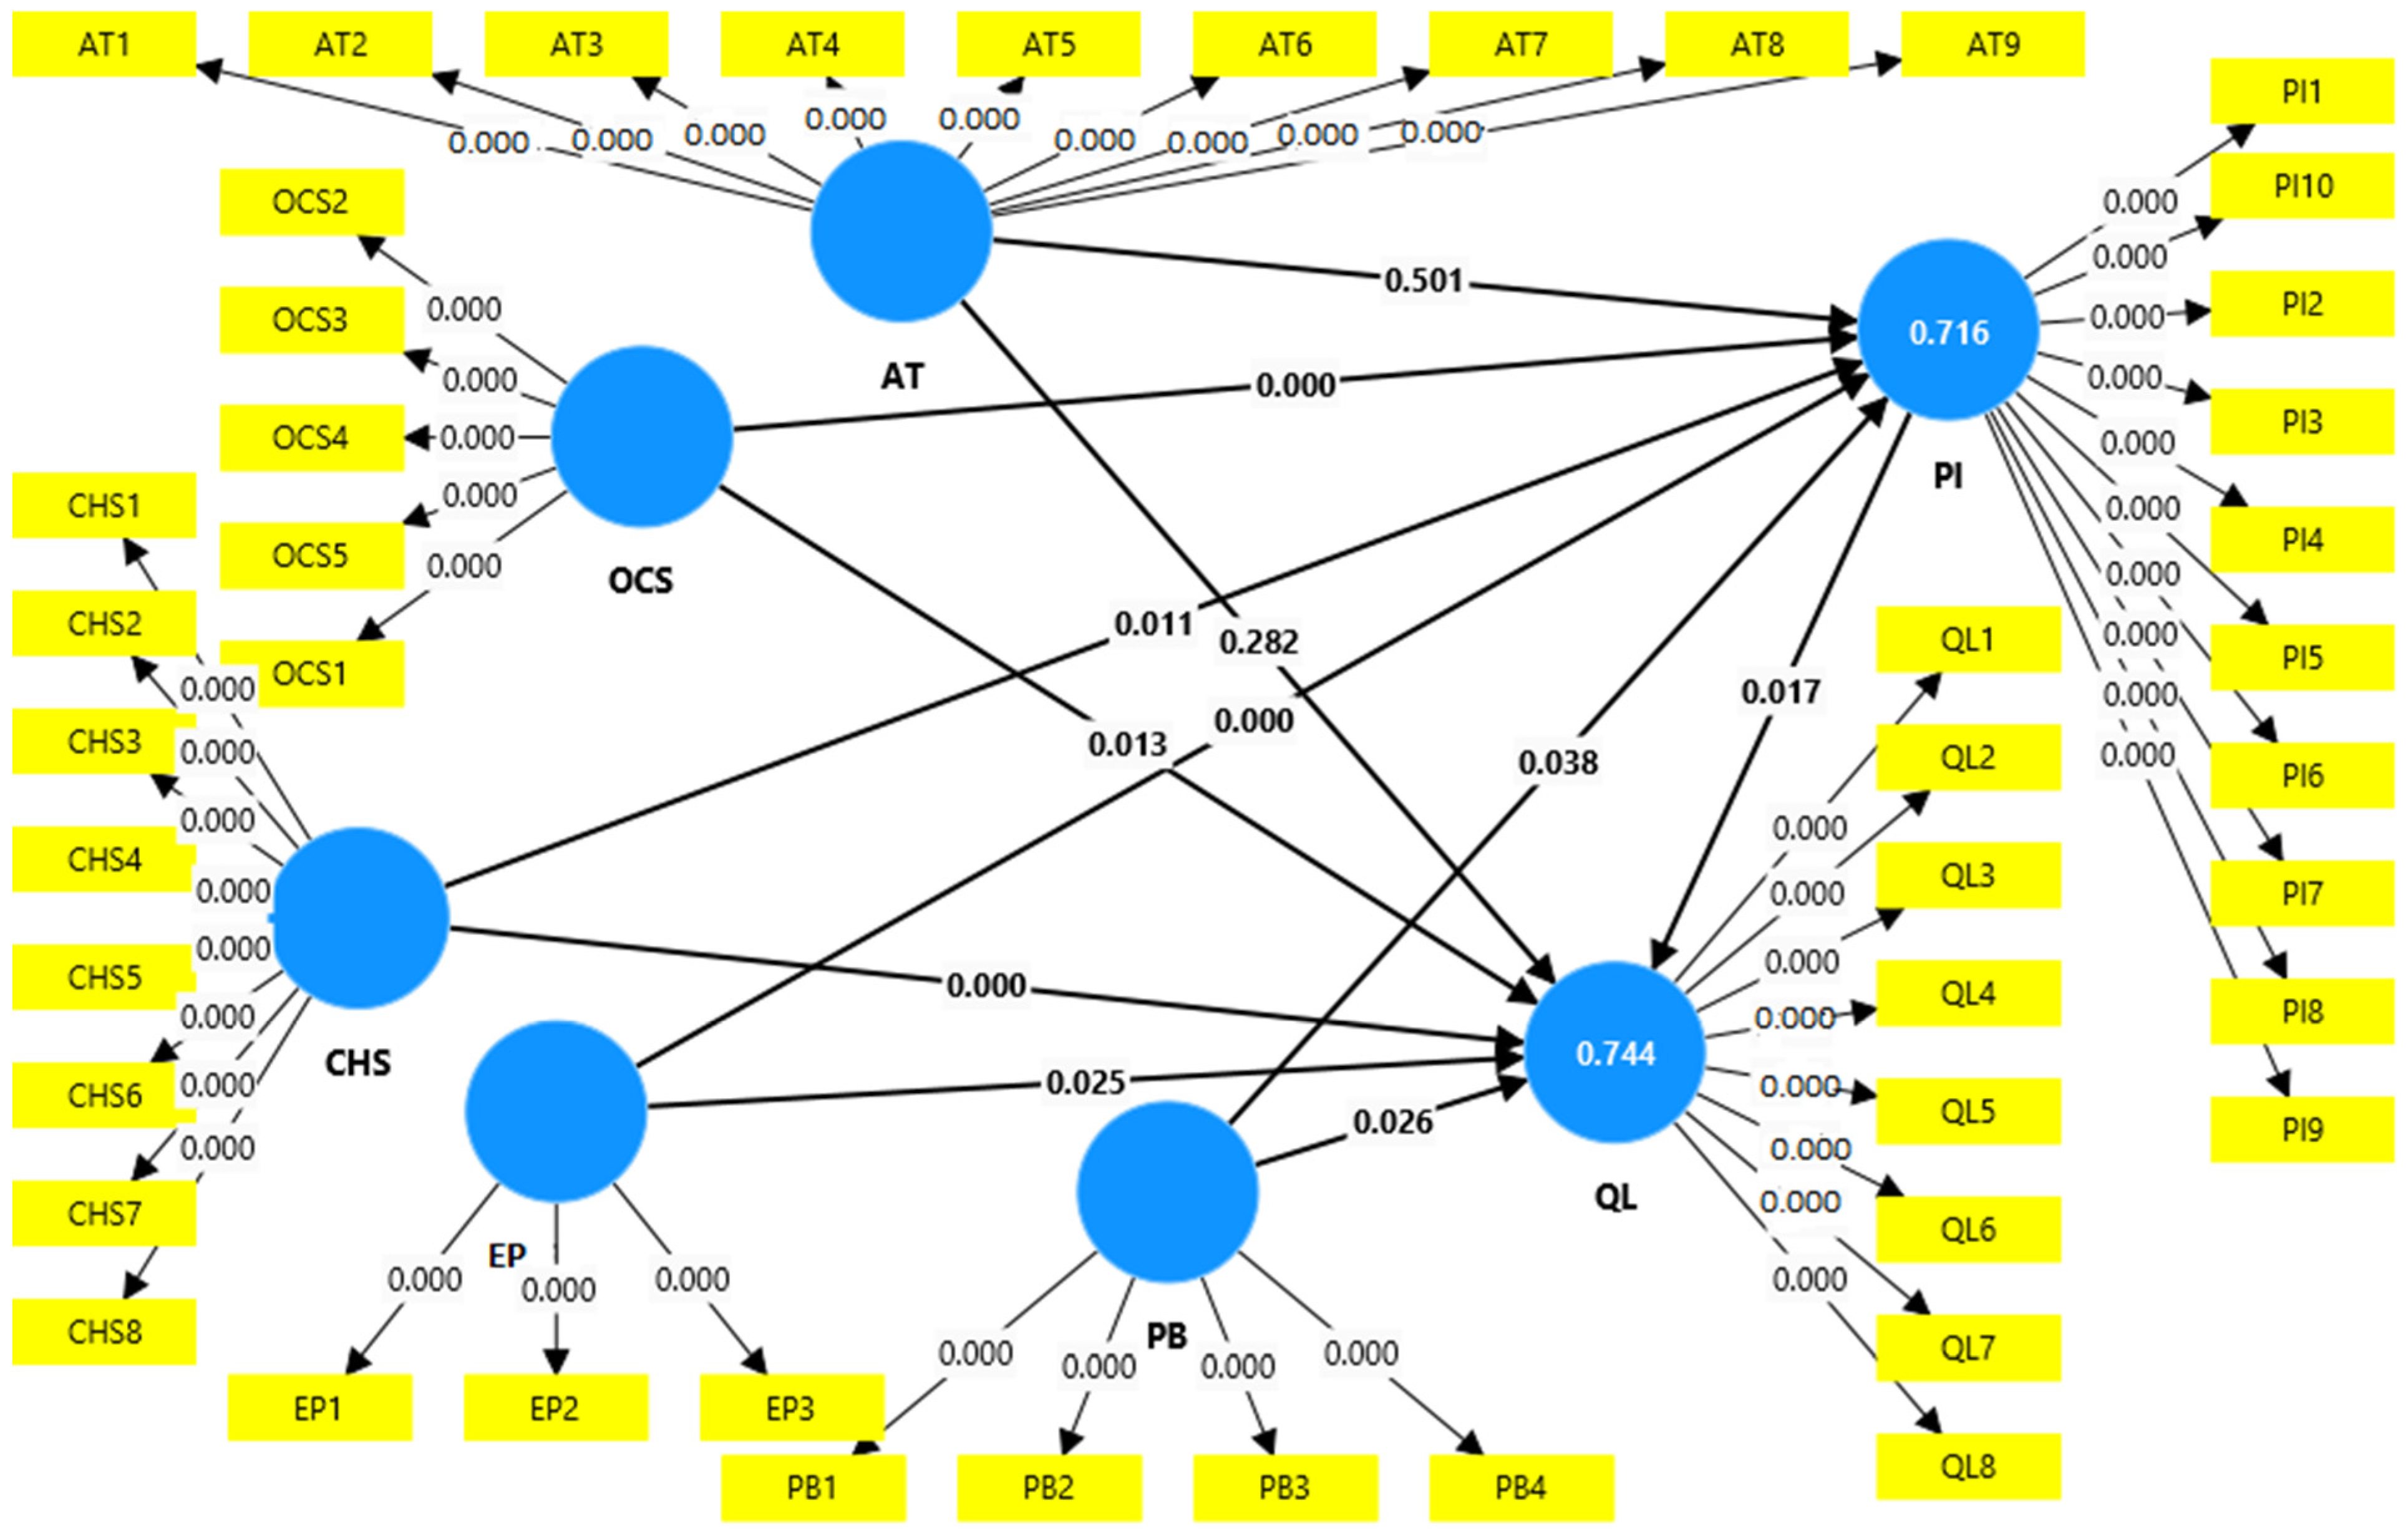
After evaluating the measurement model for reliability and validity, the next crucial step is to assess the structural model. In the context of PLS analysis, the structural model facilitates hypothesis testing by examining key metrics such as path coefficients, t-statistics, p-values, and associated errors. These elements collectively help to determine the strength and significance of the relationships among the constructs in the model. Table 12 presents the findings from the structural model, detailing the results of the hypotheses testing. Meanwhile, Figure 6 visually represents the structural model, illustrating the connections and relationships between the various constructs under investigation. This figure depicts the structural model, which examines the hypothesized relationships between latent constructs. It includes path coefficients, t-values, and significance levels derived from hypothesis testing, providing a visual representation of the endogenous and exogenous variable relationships and the strength of these effects. This comprehensive analysis allows for a deeper understanding of how the constructs interact and contribute to the overall framework of this study.
Table 12.
The structural estimates.

Figure 6.
The structural model.
To evaluate the proposed hypotheses, the significance of the path coefficients between latent variables was assessed. Following the execution of the PLS model, estimates for the path coefficients were generated, reflecting the hypothesized relationships among the latent constructs. To rigorously test these main hypotheses, a bootstrap approach was implemented, which involved performing 5000 resamples to determine the significance of the hypothesized relationships within the path model [48]. The number of bootstrap cases matched the original number of observations, enabling the generation of standard errors and the calculation of t-statistics [48]. A hypothesis is considered acceptable if it achieves a significance level of 5% (p < 0.05) or if the t-statistic exceeds the critical threshold of 1.96. This method ensures robust statistical testing of the relationships outlined in the structural model.
H1a: The economic performance of medical tourism has a significant influence on quality of life. The statistical findings support this hypothesis, with a path coefficient value of 0.169, significant at the 5% level (t = 2.253, p < 0.05). Hence, the economic performance of medical tourism positively affects quality of life.
H1b: The economic performance of medical tourism has a significant influence on perceived improvement from medical tourism development. This hypothesis is also supported, with a path coefficient value of 0.434, significant at the 1% level (t = 6.436, p < 0.01). Thus, the economic performance of medical tourism positively impacts perceived improvement from medical tourism development.
H2a: There is a positive and significant relationship between satisfaction with medical services and quality of life. The statistical findings support this hypothesis, with a path coefficient value of 0.333, significant at the 1% level (t = 5.126, p < 0.01). Hence, satisfaction with medical services positively influences quality of life.
H2b: There is a positive and significant relationship between satisfaction with medical services and perceived improvement from medical tourism development. The findings support this hypothesis, showing a path coefficient value of 0.218 and a t-statistic of 2.537 (p < 0.05), indicating a significant positive effect. Therefore, satisfaction with medical services enhances perceived improvement from medical tourism development.
H3a: There is a positive and significant association between personal benefit and quality of life. The statistical findings confirm this hypothesis, as the path coefficient value is 0.202, significant at the 5% level (t = 2.238, p < 0.05). Therefore, personal benefits from medical tourism significantly enhance quality of life.
H3b: The personal benefit of medical tourism has a significant influence on perceived improvement from medical tourism development. This hypothesis is also supported, with a path coefficient value of 0.138, significant at the 5% level (t = 2.077, p < 0.05). Hence, personal benefits from medical tourism positively influence perceived improvement from medical tourism development.
H4a: There is a significant association between overall community satisfaction and quality of life. This hypothesis is supported, as indicated in Table 12, where the path coefficient value is 0.126, with a t-statistic of 2.484 (p < 0.05) demonstrating a significant relationship. Thus, overall community satisfaction is positively associated with quality of life.
H4b: There is a significant association between overall community satisfaction and perceived improvement from medical tourism development. This hypothesis is also supported; Table 12 shows a path coefficient value of 0.261 and a t-statistic of 3.839 (p < 0.01), indicating a strong positive relationship. Therefore, overall community satisfaction significantly correlates with perceived improvement from medical tourism development.
H5a: There is a significant relationship between attitude towards medical tourism and quality of life. This hypothesis is not supported, as the path coefficient value is 0.057, which is insignificant (t = 1.077, p > 0.05). Consequently, no significant relationship exists between attitude towards medical tourism and quality of life.
H5b: There is a significant relationship between attitude towards medical tourism and perceived improvement of medical tourism development. This hypothesis is not supported either, as the path coefficient value is −0.021, which is insignificant (t = 0.673, p > 0.05). Thus, no significant relationship is found between attitude towards medical tourism and perceived improvement of medical tourism development.
H6: Perceived improvement from medical tourism development has a positive effect on quality of life. The findings support this hypothesis, as indicated by a path coefficient value of 0.196, significant at the 5% level (t = 2.401, p < 0.05). Therefore, perceived improvement from medical tourism development positively impacts quality of life
Mediating Effect Test
This present study tested the mediating effect of perceived improvement from medical tourism development in the relationships between the five IVs and the quality of life. Statistical findings support hypothesis 7 because the indirect effect here is significant (t = 2.333; p < 0.05). So, the perceived improvement from medical tourism development mediates the relationship between economic performance and quality of life.
Hypothesis 8 is not supported since the indirect effect here is insignificant (t = 1.543; p > 0.05). Hence there is no mediating effect of perceived improvement from medical tourism development in the relationship between personal benefit and quality of life.
Hypothesis 9 is not supported because the indirect effect is insignificant (t = 1.669; p > 0.05). Hence, there is no mediating effect of perceived improvement from medical tourism development in the relationship between satisfaction with healthcare services and quality of life.
The findings indicate that there is a mediating effect of perceived improvement from medical tourism development in the relationship between overall community satisfaction and quality of life because the indirect effect here is significant (t = 1.967; p < 0.05). So, hypothesis 10 is accepted.
The findings also do not support hypothesis 11, as the indirect effect is insignificant (t = 0.636; p > 0.05). Therefore there is no mediating effect of perceived improvement from medical tourism development in the relationship between attitude towards medical tourism and quality of life. The mediating effect test is shown in Table 13.
Table 13.
Mediating effect test.
6. Summary of Findings
Having presented all the results including the main and moderating effects in the earlier sections, a summary of the entire results of all the hypotheses testing is reproduced in Table 14. The comment column is directly based on the PLS-SEM results. Additionally, the specific results from Table 12 (Structural Estimates) and Figure 6 (Structural Model), correspond to the claims of “Supported” or “Not Supported.
Table 14.
Summary of hypotheses testing findings.
Data from 361 respondents were rigorously analyzed to evaluate the research model of this study. The analysis was conducted in two distinct phases using the Partial Least Squares Structural Equation Modeling (PLS-SEM) approach. In the initial phase, the PLS measurement model validated the reliability and validity of the data, as well as the overall fit of the model. All constructs demonstrated reliability, with Cronbach’s alpha values exceeding 0.70 and composite reliability scores surpassing 0.80. Furthermore, the criteria for convergent and discriminant validity were met, as all item loadings were above 0.70, and the average variance extracted (AVE) values were greater than 0.50, supported by the square roots of the AVE. In the subsequent phase, the structural model output was employed to test this study’s hypotheses. The results indicated that out of the seventeen hypotheses proposed, eleven were supported and six were not supported.
Residents’ impressions of the growth of medical tourism are significantly influenced by ethical issues. Residents’ opinions of the sector might be affected by worries about patient prioritizing, resource allocation, and potential labor exploitation. Residents who believe that foreign patients are given preferential treatment may feel unfairly treated as a result of perceptions of patient priority. These issues can be addressed with clear patient priority rules and openness in healthcare procedures. Resource distribution is a difficult ethical problem, with the potential for greater healthcare benefits for locals in areas with a large concentration of medical tourism services. A crucial ethical need is to guarantee that all citizens have fair access to high-quality healthcare services. Ethical questions are raised by the possible exploitation of healthcare workers, who must be treated fairly and ethically, particularly through suitable working conditions and pay. In examining the viewpoints of Malaysian residents regarding the development of medical tourism, several implications for quality of life emerge, which are shown in Table 15.
Table 15.
Development of medical tourism implications for quality of life.
Future recommendations for the development of medical tourism and its implications for quality of life are shown in Table 16.
Table 16.
Future recommendations for the development of medical tourism and its implications for quality of life.
7. Conclusions
This study provides a comprehensive analysis of the impacts of medical tourism on Malaysia’s local communities, particularly focusing on economic benefits and challenges related to healthcare accessibility and quality of life. The findings reveal that while medical tourism significantly boosts economic performance through increased healthcare revenue, job creation, and infrastructure improvements, it also poses social and ethical concerns, especially regarding healthcare accessibility for local residents. The influx of foreign patients may strain local healthcare resources, creating disparities between services provided to medical tourists and the local population. Using PLS-SEM analysis, this study confirms that economic benefits and perceived improvements in medical tourism positively influence the quality of life for residents. However, the results also indicate that attitudes towards medical tourism do not significantly affect residents’ perceptions of their quality of life, highlighting potential inequalities and dissatisfaction among certain community segments. To ensure sustainable development, this study recommends targeted policies that promote equitable healthcare access, manage resource distribution, and address the commercialization of medical services. Policymakers should focus on striking a balance between fostering economic growth through medical tourism and protecting the welfare of local communities by ensuring that healthcare remains accessible and affordable for all.
In conclusion, while medical tourism has the potential to enhance Malaysia’s economic and healthcare landscape, careful attention must be paid to the long-term social and cultural effects to ensure inclusive and sustainable growth.
Author Contributions
F.I., A.S. and N.K. were involved in the conception and design, analysis, and interpretation of the data; F.I. drafted the paper; F.I., A.S. and N.K. revised the paper critically for intellectual content and gave the final approval of the version to be published. All authors have read and agreed to the published version of the manuscript.
Funding
The funding for this project was provided by the Multimedia University under the graduate research assistantship scheme.
Institutional Review Board Statement
Ethical approval for this study was obtained in accordance with the practices and guidelines set forth by the Multimedia University’s Research Ethics Committee. This study was reviewed and approved by the Multimedia University’s Research Ethics Committee.
Informed Consent Statement
Informed consent was obtained from all participants involved in this study. Consent was written, and participants were fully briefed on the purpose of the research, their rights, and how their data would be used.
Data Availability Statement
The datasets generated and/or analyzed during this current study are available from the first author upon reasonable request.
Acknowledgments
The authors would like to acknowledge and thank Multimedia University for their financial and logistic support.
Conflicts of Interest
The authors declare that they have no conflicting interests.
References
- Smith, R.; Álvarez, M.M.; Chanda, R. Medical tourism: A review of the literature and analysis of a role for bi-lateral trade. Health Policy 2011, 103, 276–282. [Google Scholar] [CrossRef] [PubMed]
- Menvielle, L.; Menvielle, W.; Tournois, N. Medical tourism: A decision model in a service context. Tour. Int. Interdiscip. J. 2011, 59, 47–61. [Google Scholar]
- Medical Tourism Market in Malaysia. Factmr.com. Available online: https://www.factmr.com/report/malaysia-medical-tourism-market (accessed on 1 January 2025).
- Andereck, K.L.; Valentine, K.M.; Knopf, R.C.; Vogt, C.A. Residents’ perceptions of community tourism impacts. Ann. Tour. Res. 2005, 32, 1056–1076. [Google Scholar] [CrossRef]
- Ormond, M.; Mun, W.K.; Khoon, C.C. Medical tourism in Malaysia: How can we better identify and manage its advantages and disadvantages? Glob. Health Action 2014, 7, 25201. [Google Scholar] [CrossRef] [PubMed]
- Afthanorhan, A.; Awang, Z.; Fazella, S. Perception of tourism impact and support tourism development in Terengganu, Malaysia. Soc. Sci. 2017, 6, 106. [Google Scholar] [CrossRef]
- Ormond, M.; Sulianti, D. More than medical tourism: Lessons from Indonesia and Malaysia on South–South intra-regional medical travel. Curr. Issues Tour. 2017, 20, 94–110. [Google Scholar] [CrossRef]
- Thomas, S.; Beh, L.; Nordin, R.B. Health care delivery in Malaysia: Changes, challenges and champions. J. Public Health Afr. 2011, 2, e23. [Google Scholar] [CrossRef]
- Healthcare Traveller Statistics. Malaysia Healthcare Travel Council (MHTC). 9 July 2021. Available online: https://www.mhtc.org.my/statistics (accessed on 17 September 2023).
- Zain, N.A.M.; Connell, J.; Zahari, M.S.M.; Hanafiah, M.H. Intra-Regional Medical Tourism Demand in Malaysia: A Qualitative Study of Indonesian Medical Tourists’ Rationale and Preferences. Malays. J. Med. Sci. MJMS 2022, 29, 138. [Google Scholar] [CrossRef] [PubMed]
- Suess, C.; Baloglu, S.; Busser, J.A. Perceived impacts of medical tourism development on community wellbeing. Tour. Manag. 2018, 69, 232–245. [Google Scholar] [CrossRef]
- Carrera, P.M.; Bridges, J.F. Globalization and healthcare: Understanding health and medical tourism. Expert Rev. Pharmacoeconomics Outcomes Res. 2006, 6, 447–454. [Google Scholar] [CrossRef] [PubMed]
- Jordan, E.J.; Moore, J. An in-depth exploration of residents’ perceived impacts of transient vacation rentals. J. Travel Tour. Mark. 2018, 35, 90–101. [Google Scholar] [CrossRef]
- Nilashi, M.; Samad, S.; Manaf, A.A.; Ahmadi, H.; Rashid, T.A.; Munshi, A.; Almukadi, W.; Ibrahim, O.; Ahmed, O.H. Factors influencing medical tourism adoption in Malaysia: A DEMATEL-Fuzzy TOPSIS approach. Comput. Ind. Eng. 2019, 137, 106005. [Google Scholar] [CrossRef]
- Shah, S.A.; Safian, N.; Ahmad, S.; Nurumal, S.R.; Mohammad, Z.; Mansor, J.; Wan Ibadullah, W.A.; Shobugawa, Y.; Rosenberg, M. Unmet healthcare needs among elderly malaysians. J. Multidiscip. Healthc. 2021, 14, 2931–2940. [Google Scholar] [CrossRef]
- Bašković, M. The impact of telemedicine on the quality and satisfaction with the health care provided during the COVID-19 pandemic in the field of pediatrics with special reference to the surgical professions. Pol. J. Surg. 2021, 93, 53–60. [Google Scholar] [CrossRef]
- Harun, R.; Chiciudean, G.O.; Sirwan, K.; Arion, F.H.; Muresan, I.C. Attitudes and perceptions of the local community towards sustainable tourism development in Kurdistan regional government, Iraq. Sustainability 2018, 10, 2991. [Google Scholar] [CrossRef]
- Cohen, I.G. Patients with Passports: Medical Tourism, Law, and Ethics; Oxford University Press: Oxford, UK, 2014. [Google Scholar]
- Kanda, N.; Hashimoto, H.; Sonoo, T.; Naraba, H.; Takahashi, Y.; Nakamura, K.; Hatakeyama, S. Gram-negative organisms from patients with community-acquired urinary tract infections and associated risk factors for antimicrobial resistance: A single-center retrospective observational study in Japan. Antibiotics 2020, 9, 438. [Google Scholar] [CrossRef] [PubMed]
- Mohd Isa, S.; Lim, G.S.S.; Chin, P.N. Patients’ intent to revisit with trust as the mediating role: Lessons from Penang Malaysia. Int. J. Pharm. Healthc. Mark. 2019, 13, 140–159. [Google Scholar] [CrossRef]
- Connell, J. From medical tourism to transnational health care? An epilogue for the future. Soc. Sci. Med. 2015, 124, 398–401. [Google Scholar] [CrossRef] [PubMed]
- Heung, V.C.; Kucukusta, D.; Song, H. Medical tourism development in Hong Kong: An assessment of the barriers. Tour. Manag. 2011, 32, 995–1005. [Google Scholar] [CrossRef]
- Liang, Z.X.; Hui, T.K. Residents’ quality of life and attitudes toward tourism development in China. Tour. Manag. 2016, 57, 56–67. [Google Scholar] [CrossRef]
- Uysal, M.; Sirgy, M.J.; Woo, E.; Kim, H.L. Quality of life (QOL) and well-being research in tourism. Tour. Manag. 2016, 53, 244–261. [Google Scholar] [CrossRef]
- Majeed, S.; Lu, C.; Javed, T. The journey from an allopathic to natural treatment approach: A scoping review of medical tourism and health systems. Eur. J. Integr. Med. 2017, 16, 22–32. [Google Scholar] [CrossRef]
- Meng, C.K.; Piaralal, S.K.; Islam, M.A.; Yusof, M.F.B.; Chowdhury, R.S. International medical Tourists’ expectations and behavioral intention towards health resorts in Malaysia. Heliyon 2023, 9, e19721. [Google Scholar] [CrossRef] [PubMed]
- Reddy, S.G.; York, V.K.; Brannon, L.A. Travel for treatment: Students’ perspective on medical tourism. Int. J. Tour. Res. 2010, 12, 510–522. [Google Scholar] [CrossRef]
- Bagga, T.; Vishnoi, S.K.; Jain, S.; Sharma, R. Medical tourism: Treatment, therapy & tourism. Int J Sci Technol Res 2020, 9, 4447–4453. [Google Scholar]
- Malaysian Government. Economic Planning Unit. In Ninth Malaysian Plan (2006–2010); Malaysian Government: Kuala Lumpur, Malaysia, 2011. [Google Scholar]
- MHTC Healthcare Malaysia Magazine. Available online: https://www.mhtc.org.my/malaysia-healthcare-e-newsletter-q4-october-december-2023/ (accessed on 18 May 2024).
- Sandberg, D.S. Medical tourism: An emerging global healthcare industry. Int. J. Healthc. Manag. 2017, 10, 281–288. [Google Scholar] [CrossRef]
- Gopalan, N.; Mohamed Noor, S.N.; Salim Mohamed, M. The pro-medical tourism stance of Malaysia and how it affects stem cell tourism industry. Sage Open 2021, 11, 21582440211016837. [Google Scholar] [CrossRef]
- Majeed, S.; Lu, C.; Majeed, M.; Shahid, M.N. Health resorts and multi-textured perceptions of international health tourists. Sustainability 2018, 10, 1063. [Google Scholar] [CrossRef]
- Rai, A.; Rai, A. Medical tourism: An introduction. In Medical Tourism in Kolkata, Eastern India; Springer: Cham, Switzerland, 2019; pp. 1–41. [Google Scholar]
- Labonté, R.; Crooks, V.A.; Valdés, A.C.; Runnels, V.; Snyder, J. Government roles in regulating medical tourism: Evidence from Guatemala. Int. J. Equity Health 2018, 17, 150. [Google Scholar] [CrossRef]
- Afthanorhan, A.; Awang, Z.; Fazella, S. Developing the patients’ loyalty model for medical tourism industry: The case of Malaysia. Int. J. Soc. Syst. Sci. 2017, 9, 139–164. [Google Scholar] [CrossRef]
- Thomas, A.; Saroyan, A.; Dauphinee, W.D. Evidence-based practice: A review of theoretical assumptions and effectiveness of teaching and assessment interventions in health professions. Adv. Health Sci. Educ. 2011, 16, 253–276. [Google Scholar] [CrossRef] [PubMed]
- Hair, J.F.; Ringle, C.M.; Sarstedt, M. Partial least squares structural equation modeling: Rigorous applications, better results and higher acceptance. Long Range Plan. 2013, 46, 1–12. [Google Scholar] [CrossRef]
- Sekaran, U.; Bougie, R. Research Methods for Business: A Skill Building Approach, 6th ed.; John Wiley &Sons, Inc.: Chichester, UK, 2013. [Google Scholar]
- Lambin, J.J.; Schuiling, I. Market-Driven Management: Strategic and Operational Marketing; Bloomsbury Publishing: London, UK, 2012. [Google Scholar]
- Pallant, J. Survival manual. In A Step by Step Guide to Data Analysis Using SPSS, 4th ed.; Allen & Unwin: Crows Nest, Australia, 2011. [Google Scholar]
- Reinartz, W.; Haenlein, M.; Henseler, J. An empirical comparison of the efficacy of covariance-based and variance-based SEM. Int. J. Res. Mark. 2009, 26, 332–344. [Google Scholar] [CrossRef]
- Wetzels, M.; Odekerken-Schröder, G.; Van Oppen, C. Using PLS path modeling for assessing hierarchical construct models: Guidelines and empirical illustration. MIS Q. 2009, 33, 177–195. [Google Scholar] [CrossRef]
- Sarstedt, M.; Ringle, C.M.; Smith, D.; Reams, R.; Hair, J.F., Jr. Partial least squares structural equation modeling (PLS-SEM): A useful tool for family business researchers. J. Fam. Bus. Strategy 2014, 5, 105–115. [Google Scholar] [CrossRef]
- Bagozzi, R.P. Structural equation models in consumer research: Exploring intuitions and deeper meanings of SEMs. In APA Handbook of Consumer Psychology; American Psychological Association: Washington, DC, USA, 2022. [Google Scholar]
- Urbach, N.; Ahlemann, F. Structural equation modeling in information systems research using partial least squares. J. Inf. Technol. Theory Appl. (JITTA) 2010, 11, 2. [Google Scholar]
- Chen, C.F. Investigating structural relationships between service quality, perceived value, satisfaction, and behavioral intentions for air passengers: Evidence from Taiwan. Transp. Res. Part A Policy Pract. 2008, 42, 709–717. [Google Scholar] [CrossRef]
- Hair, J.F., Jr.; Howard, M.C.; Nitzl, C. Assessing measurement model quality in PLS-SEM using confirmatory composite analysis. J. Bus. Res. 2020, 109, 101–110. [Google Scholar] [CrossRef]
- Holmbeck, G.N. Toward terminological, conceptual, and statistical clarity in the study of mediators and moderators: Examples from the child-clinical and pediatric psychology literatures. J. Consult. Clin. Psychol. 1997, 65, 599. [Google Scholar] [CrossRef] [PubMed]
- Islam, F.; Sarwar, A.; Khan, N.; Bakar, R. Financial Liberalization and Its Impact on Efficiency, Productivity and Loan Quality of Commercial Banks. In Proceedings of the International e-Conference on New Normal in Education 2020 (IENNE 2020), Online, 28–29 November 2020; pp. 247–256. [Google Scholar]
- Islam, F.; Sarwar, A.; Khan, N. Medical Tourism Development and Its Impact on Residents’ Quality of Life. In Proceedings of the International e-Conference on New Normal in Education 2020 (IENNE 2020), Online, 28–29 November 2020; pp. 216–224. [Google Scholar]


Disclaimer/Publisher’s Note: The statements, opinions and data contained in all publications are solely those of the individual author(s) and contributor(s) and not of MDPI and/or the editor(s). MDPI and/or the editor(s) disclaim responsibility for any injury to people or property resulting from any ideas, methods, instructions or products referred to in the content. |
© 2025 by the authors. Licensee MDPI, Basel, Switzerland. This article is an open access article distributed under the terms and conditions of the Creative Commons Attribution (CC BY) license (https://creativecommons.org/licenses/by/4.0/).