Abstract
Today’s sharp competition has forced organizations to adopt effective improvement paradigms, including lean, agile, green, and resilience (LARG). However, an assessment tool is necessary to monitor the progress of LARG adoption and evaluate its effectiveness. This research, therefore, developed an index for assessing the effectiveness of LARG paradigms by evaluating their principles and practices with experts’ fuzzy evaluations. Initially, thorough research on LARG paradigms was conducted to determine the paradigm principles and their measures and prepare a comprehensive LARG survey. The Delphi method with four experts was used to rate item measures of LARG based on a five-point Likert scale. The principles and measures of each paradigm were represented by triangular fuzzy membership functions. Then, defuzzified values were obtained for each principle and set as inputs in the fuzzy inference system (FIS) to obtain a crisp value for each paradigm. Next, the defuzzified values of lean, agile, and green (LAG) were input in the FIS to obtain a crisp LAG index. Finally, the defuzzified values of the LAG and resilience (R) were measured and then inserted as inputs in the FIS to obtain a comprehensive defuzzified LARG value. The effectiveness of the proposed LARG framework was validated in pharmaceutical and chemical organizations. The results revealed that the LARG index is an effective tool for evaluating lean, agile, green, and resilience paradigms for both organizations. In conclusion, the LARG index provides valuable support to decision-makers in determining a business’s weaknesses and strengths and guides technical managers to possible improvement actions to enhance competitiveness and sustainability.
1. Introduction
Organizations face extreme challenges due to increased pressure from environmental consciousness and regulations, ever-changing customer expectations, demand fluctuations and market volatility, and sudden internal and unplanned external disturbances. Hence, a comprehensive assessment tool of organizational capabilities to adapt to changing market conditions, seize new opportunities, and overcome challenges is needed. Lean, agile, resilience, and green (LARG) paradigms are recognized as the foundations of competitiveness, and the adoption of their practices leads to increased efficiency, effectiveness, performance, and competitiveness [1,2].
The lean paradigm aims to identify and eliminate non-value-added processes and activities [3,4]. Adopting lean practices enhances quality, reduces costs and waste, and increases productivity [5,6,7]. The agile paradigm strengthens the ability of an organization to be flexible and responsive to rapidly changing market demands and uncertainty [8,9,10]. The green paradigm boosts eco-friendly behavior and commitment to green thinking by adopting environmentally friendly principles and practices that could create a balance between the environment, society, and economic aspects [11,12,13,14]. Finally, resilience is the capacity of an organizational system to anticipate risks and manage them effectively through appropriate adaptation of its actions, systems, and processes to ensure that its core functions are carried out in a stable and effective relationship with the environment [15,16,17].
Although various organizations reported that LARG paradigms have positively influenced their capabilities and competitiveness, a comprehensive assessment of LARG paradigms is necessary to sustain improvements and growth. Consequently, this research develops a framework for assessing the adoption of LARG paradigms and evaluating the effects of their principles and practices on business performance. Furthermore, experts often use linguistic terms during the assessment of LARG paradigms. Fuzzy logic is an effective technique to deal with fuzzy or vague evaluations [18]. This research, therefore, proposes a framework for measuring the LARG index to assess the LARG paradigms under fuzzy evaluations. The proposed LARG index helps organizations understand their strengths and weaknesses; measure their lean, agility, green, and resilience capabilities; and enables them to determine necessary improvement actions to achieve their goals and objectives and enhance capabilities and competitiveness. This research, including the introduction, is structured as follows. Section 2 presents relevant studies on the lean, agile, green, and resilience paradigms. Section 3 presents the proposed framework for measuring the LARG index. Section 4 provides two case studies for illustration. Section 5 conducts index validation. Section 6 summarizes the research conclusions.
2. Literature Review
Assessing the effective adoption of the lean, agile, green, and resilience paradigms has received significant research attention. For example, Carvalho et al. [19] proposed a composite index called the “AR index” for assessing the agility and resilience of supply chains. The index was implemented in four automotive companies: one automaker and three first-tier suppliers. Azevedo et al. [20] suggested an Ecosilient index to assess the greenness and resilience of the supply chain. Azevedo et al. [21] proposed a LARG index model to assess the behavior of companies and supply chains using fuzzy logic. Fazendeiro et al. [22] proposed a framework to assess the LARG index of a supply chain in a fuzzy context. Azevedo et al. [23] proposed a LARG index to assess companies and supply chains (SCs). A case study was implemented in an automotive supply chain. Amjad et al. [24] developed a comprehensive integration framework that integrates Industry 4.0 facets supplemented by the LARG paradigms. Salleh et al. [25] proposed LARG as a mechanism to improve the competitiveness of seaports. The compatible LARG criteria in the seaport supply chain were identified and analyzed using extensive literature and expert reviews. Fifteen experts from the maritime industry were selected to assign the relative importance of each LARG paradigm by using an Analytical Hierarchy Process. Raut et al. [26] investigated the role of big data analytics as a mediator between “sustainable supply chain business performance” and lean practices, social practices, environmental practices, organizational practices, supply chain practices, financial practices, and total quality management in thirty-seven Indian manufacturing firms. Anvari [27] combined LARG and sustainable paradigms in the supply chain management of petrochemical industries. Bottani et al. [28] proposed a framework for a LARG system for a food supply chain. Çeke [29] examined the applicability of LARG approaches to a manufacturing company in Turkey. Ferraro et al. [30] proposed a conceptual framework to assess the impact of LARG practices on logistics performance. Pabarja et al. [31] conducted an assessment model for LARG in Iran’s hospital medical equipment supply chain, especially in Hamadan. The FIS was used to evaluate LARG. Key indicators obtained from a comprehensive review of the literature and other published reports in the field of LARG were also confirmed by a focused group of experts in the medical equipment supply chain field. Ghazvinian et al. [32] proposed an integrated approach for supplier selection based on the lean, agile, resilience, green, and sustainable (LARGS) paradigm. This approach was validated using structural equation modeling and the intuitionistic fuzzy TOPSIS method.
However, this research proposes a framework for measuring the LARG index to assess the effectiveness of lean, agile, green, and resilience paradigms using fuzzy logic techniques. The framework incorporates the principles and measures of each paradigm, which enables assessing paradigms individually and concurrently. Furthermore, the framework supports decision-makers in determining the necessary actions to enhance performance. Finally, the LARG index is implemented in two industrial organizations to validate the credibility and reliability of this index.
3. Methodology
The framework for developing the LARG index is depicted in Figure 1.
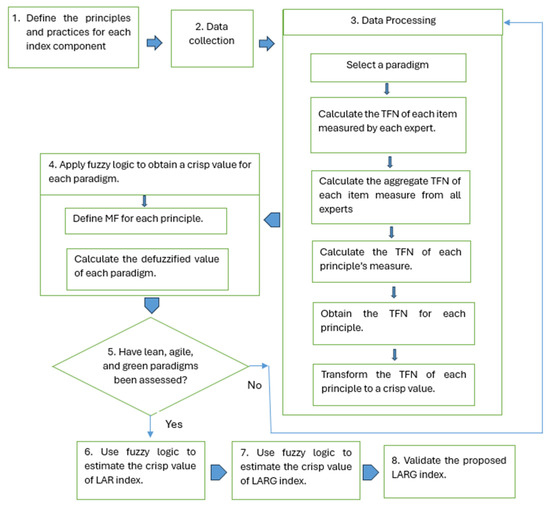
Figure 1.
Proposed framework for LARG assessment.
The framework includes the following steps:
- Step 1. Define the principles and practices for each index component
Table 1 lists the principles of lean, agile, and green paradigms with their corresponding measures. Four measures were identified for each paradigm. For example, the lean paradigm includes respect for people [33], value [34] and value stream [35,36], flow [37] and pull [38], and seeking perfection. Further, the agile principles cover responsiveness [39,40], concurrent engineering [41], use of information technology [42], and knowledge management and learning [43,44]. The green principles involve reverse logistics [34,35], environmental management systems [45,46], green IT implementation [47,48], and environmental monitoring [49,50,51].

Table 1.
Lean, agile, and green principles and measures.
The resilience principles include responding, monitoring, learning, and anticipating [52]. The practices for each resilience principle are displayed in Table 2 [53,54,55].
Table 2.
Resilience principles.
- Step 2. Data collection
The item measures were determined for each principle. Data were collected via a survey constructed based on an intensive review of relevant research and expert opinions [56]. The survey included 118 item measures for lean, agile, green, and resilience principles and practices. Table 3 and Table 4 display the item measures for the lean principle “respect for people” and the corresponding expert evaluations, respectively. The four experts, E1–E4, were assigned weights of 0.4, 0.2, 0.2, and 0.2, respectively. The Delphi method was used for expert evaluations of item measures using linguistic terms from very low (VL) to very high (VH), as shown in Table 5.
Table 3.
Likert scale.
Table 4.
Item measures of the “respect for people” principle of lean.
Table 5.
Expert responses to the lean principle “respect for people”.
- Step 3: Data processing. The responses to item measures were processed as follows:
Step 3.1: Calculate the triangular fuzzy number (TFN). For illustration, Table 4 and Table 5 display the item measures for the lean principle “respect for people” and the corresponding expert evaluations, respectively. The four experts, E1–E4, were assigned weights of 0.4, 0.2, 0.2, and 0.2, respectively.
Transform the responses for each item measure (question) into a triangular fuzzy number (TFN). For illustration, the TFN of the item measure “a culture of respect” in Table 5 is calculated as follows:
Step 3.1: Calculate the TFN of each item measure by multiplying the expert weight by the corresponding fuzzy rating. For example, the rating (VH) of Q1 by expert 1 is calculated as 0.4 × (4, 5, 5) = (1.6, 2, 2). The TFN of Q1 by experts 2, 3, and 4 are calculated similarly: (0.6, 0.75, 0.9), (0.6, 0.75, 0.9), and (0.8, 1.0, 1.0), respectively.
Step 3.2: Calculate the aggregate TFN from all four experts for each question. For example, the aggregate TFN for Q1 is (1.6 + 0.6 + 0.6 + 0.8, 2 + 0.75 + 0.75 + 1, 2 + 0.9 + 0.9 + 1) = (3.6, 4.5, 4.8). Similarly, the TFNs of Q2 and Q3 are calculated as 3.15 and 3.8, respectively.
Step 3.3: Calculate the TFN of the measures for each measure. For example, the TFN of the culture of respect measure (3.52, 4.42, 4.72) is obtained as follows:
Similarly, the TFNs of autonomous working, professional excellence and rapid learning, and personal networks and interaction are calculated as (2.63, 3.38, 4.13), (3.31, 4.17, 4.62), and (2.88, 3.63, 4.38), respectively.
Step 3.4: Obtain the TFN of each principle by dividing the sum of TFNs of its measures by the number of measures. For example, the TFN of “respect for people” is calculated from its four measures as follows:
Step 3.5: Transform the TFN of each principle to a crisp value, D, using Equation (1), where U, M, and L are the upper, middle, and lower elements of the TFN of the principle.
For example, the D value for the “respect for people” lean principle is calculated as:
Similarly, the calculated D values for value, flow and pull, and seeking perfection principles of lean are 3.66, 2.87, and 3.59, respectively.
- Step 4: Fuzzy logic theory can deal with imprecise, uncertain, vague, and subjective judgment problems [57]. The fuzzy logic system consists of three main steps: fuzzification, fuzzy inference system (FIS), and defuzzification. Apply fuzzy logic to calculate the defuzzified values for each principle as follows:
Step 4.1: Define membership functions (MF) for each principle, as shown in Figure 2, utilizing the fuzzy ratings (VL to VH) in Table 5. Then, establish the If–Then rules that relate inputs of the FIS to outputs, as shown in Figure 3.
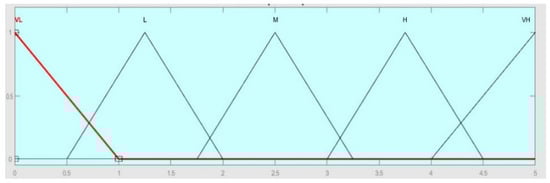
Figure 2.
The MFs for lean, agile, green, and resilience.
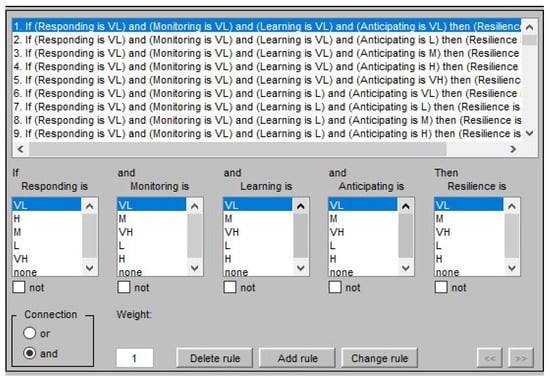
Figure 3.
A sample of the If–Then rules for resilience.
For illustration, a sample of the If–Then rules that relate the four measures: respect for people (I1), value (I2), flow and pull (I3), and seeking perfection (I4) principles for lean (L) as an output in the FIS are shown in Table 6.
Table 6.
Sample of the If–Then rules for lean.( I1 is VL and I2 is VL).
Step 4.2. Calculate the defuzzified value of each paradigm using the Mamdani inference system. The output of each rule is a fuzzy set. The output fuzzy sets are then combined into a single fuzzy set using the aggregation method (Max) of the FIS. Then, defuzzification is employed to obtain a crisp output value using centroid defuzzification. Figure 4 illustrates the use of fuzzy logic for the lean paradigm.
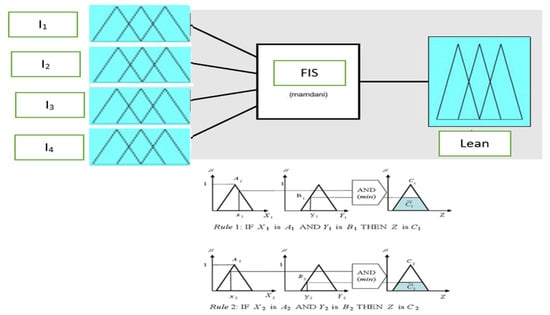
Figure 4.
Fuzzy logic for lean.
- Step 5. Repeat steps 1 to 4 to calculate the crisp values for agility, green, and resilience.
- Step 6. Use fuzzy logic to calculate the crisp values of the LAG index, where the inputs of the FIS are lean, agile, and green, while the output is the LAG index, as shown in Figure 5.
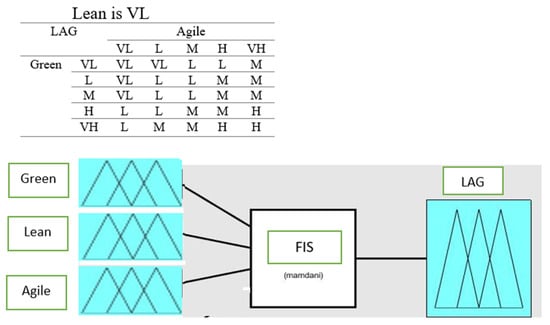 Figure 5. Fuzzy logic for LAG.
- Step 7. Use fuzzy logic to estimate the crisp value of the LARG index. The inputs of the FIS are crisp values of the LAG index and resilience, while the output is the LARG index, as shown in Figure 6.
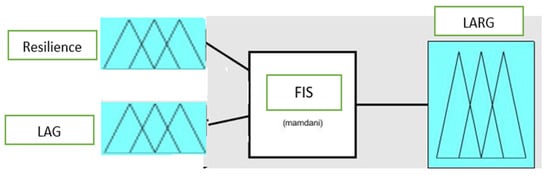 Figure 6. Fuzzy logic for LARG.
- Step 8. Validate the proposed LARG index in real-life applications. Discuss the results obtained and then suggest recommendations.
4. Applications of the LARG Index
Two firms specialized in chemicals (C) and pharmaceutical (P) products were considered to validate the reliability of the LARG index. Four experts, who have solid knowledge and experience in lean, agile, green, and resilience principles and practices, evaluated the survey. Then, TFNs of measures were calculated for all principles. Finally, TFNs of each principle were estimated for lean, agile, green, and resilience paradigms. Table 7, Table 8, Table 9 and Table 10 display the TFNs for the principles and measures of LARG paradigms, respectively.
Table 7.
The TFNs of resilience principles and measures.
Table 8.
The TFNs of agility principles and measures.
Table 9.
The TFNs of lean principles and measures.
Table 10.
The TFNs of green principles and measures.
The TFNs of principle measures were transformed into crisp values. Fuzzy logic was then utilized to determine the defuzzified values of LARG paradigms from their principles. Table 11 displays the resulting defuzzified values for both industries.
Table 11.
The defuzzified values of principles and measures.
From Table 11, the following results are obtained:
- -
- For the lean paradigm, the highest scores of 3.73 and 3.81 correspond to the respect for people principle (L1) in both the chemical (C) and pharmaceutical (P) industries. However, the lowest scores of 3.15 and 2.87 correspond to flow and pull (L3).
- -
- For the agility paradigm, concurrent engineering (A2) achieved the highest scores of 3.38 and 3.99 in both the C and P industries. However, the lowest scores of 2.97 and 3.16 correspond to the use of information technology (A3) and responsive supply chain (A1), respectively.
- -
- For the green paradigm, the highest scores of 2.75 and 3.06 in the C and P industries correspond to reverse logistics (G1), environmental monitoring of suppliers (G3), and green IT implementation (G2), respectively. However, their lowest scores of 2.56 and 2.46 correspond to G2 and G1, respectively.
- -
- For the resilience paradigm, the highest scores of 3.63 and 3.97 correspond to the responding (R1) and learning (R3) principles in the C and P industries, respectively. However, their lowest scores correspond to anticipating (R4) and monitoring (R2), 3.26 and 3.32, respectively.
5. Index Validation
Figure 7 conducts a comparison of the average score of paradigm measures between the C and P industries, where the following is noted:
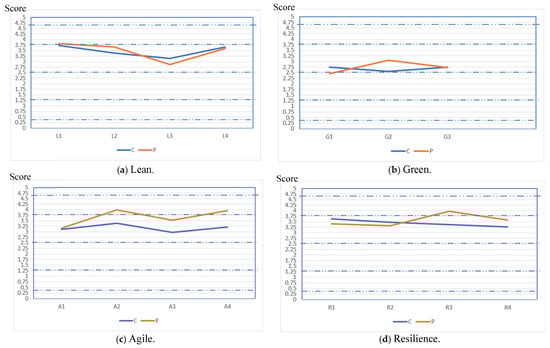
Figure 7.
A comparison of the average scores of paradigm measures between the C and P industries.
- -
- The pharmaceutical company has higher scores in L1 and L2. However, the chemical company surpasses the pharmaceutical company in L3 and L4.
- -
- The G2 score in the pharmaceutical company is significantly higher than in the chemical company.
- -
- The pharmaceutical company shows higher agility than the chemical company in all principles.
- -
- The chemical company has higher scores in R1 and R2. However, the pharmaceutical company surpasses the pharmaceutical company in R3 and R4.
Table 12 displays the rating to assess the principles and paradigms. Table 13 displays the assessment results of the principles and paradigms in both industries, where the following is found:
Table 12.
Assessment ranges.
Table 13.
Assessment of lean, agile, green, and resilience paradigms.
- -
- The level of lean adoption is high (H) in both industries. Meanwhile, opportunities for improvement can be made to enhance the “flow and pull” principle in both industries.
- -
- The agility is moderately high (M-H) and high in the C and P industries, respectively. The chemical industry should enhance the principles of “responsive supply chain”, “use of information technology”, and “knowledge management and learning”. Further, the pharmaceutical industry should enhance the principle “responsive supply chain”.
- -
- The overall level of the green paradigm is moderate (M) in both industries. Hence, enhancement of the three principles of “reverse logistics”, “green IT implementation”, and “Environmental monitoring of suppliers” are needed in both industries.
- -
- The resilience level is high in both industries. Moreover, high levels of responding, learning, anticipating, and monitoring are achieved in both firms.
- -
- Combining the lean, agile, and green paradigms, the LAG values are moderate (=2.87) and high (=3.75) in the C and P industries, respectively. This proves that the LAG index effectively assesses the overall levels of lean, agile, and green in both firms and can provide a reliable overall assessment.
- -
- Considering the lean, agile, green, and resilience paradigms, the levels of the LARG index are moderate (2.5) and high (3.75) in C and P, respectively. This proves the reliability and effectiveness of the LARG index in assessing the overall level of the four paradigms.
Compared to previous studies, the proposed index can provide the following advantages:
- -
- This study provides a comprehensive assessment of the lean, agile, green, and resilience paradigms by assessing their principles and measures. This enables decision-makers to identify weaknesses and strengths in their systems by assessing the measures of each principle.
- -
- The LARG provides a reliable overall assessment of lean, agile, green, and resilience paradigms, as validated in two distinct industries.
- -
- The assessment requires moderate skills in fuzzy logic, which makes it easily understandable and applicable to a wide range of business applications.
- -
- The proposed framework provides an effective assessment of each paradigm separately. This supports managers in prioritizing their efforts on the important paradigms.
6. Conclusions
The effective adoption of LARG paradigms has significantly enhanced organizations’ competitive advantages. To provide a quantitative assessment of LARG progress, this research developed a framework for assessing the effectiveness of LARG paradigms using the LARG index. The principles and their measures of LARG paradigms were defined. Then, a questionnaire was prepared and filled with four experts based on a five-point Likert scale. Using fuzzy logic, the defuzzified value was obtained for each of the LARG paradigms. Two case studies, pharmaceutical and chemical companies, were employed to illustrate and validate the proposed LARG index, in both of which the LARG index was found to be effective in evaluating the progress of each paradigm as well as of combined paradigms. Companies can utilize this index to assess the capabilities of their systems regarding lean, agile, green, and resilience paradigms. Moreover, the detailed evaluation of the LARG index enables organizations to determine the strengths and weaknesses in each paradigm and support them in planning and directing improvement actions. In conclusion, organizations can utilize the proposed LARG index to assess their improvement strategies and identify improvement directions and actions to enhance their operational, economic, and environmental performance. This research assumes that paradigms are independent; hence, each paradigm was assessed separately. Future research should consider developing an interpretive structural model for deploying lean, agile, green, and resilience principles enabled by Industry 4.0.
Author Contributions
Conceptualization, A.A.-R.; methodology, A.A.-R.; software, A.A.-R.; validation, A.A.-R. and N.L.; formal analysis, A.A.-R. and N.L.; investigation, A.A.-R. and N.L.; resources, A.A.-R. and N.L.; data curation, A.A.-R.; writing—original draft preparation, A.A.-R. and N.L.; writing—review and editing, A.A.-R.; visualization, A.A.-R.; supervision, A.A.-R. and N.L. All authors have read and agreed to the published version of the manuscript.
Funding
This research received no external funding.
Institutional Review Board Statement
Not applicable.
Informed Consent Statement
Not applicable.
Data Availability Statement
The original contributions presented in the study are included in the article; further inquiries can be directed to the corresponding authors.
Conflicts of Interest
The authors declare no conflict of interest.
References
- Thanki, S.J.; Thakkar, J.J. Value–value load diagram: A graphical tool for lean–green performance assessment. Prod. Plan. Control 2016, 27, 1280–1297. [Google Scholar] [CrossRef]
- Al-Refaie, A.; Jarrar, Y.; Lepkova, N. Sustainable design of a multi-echelon closed loop supply chain under uncertainty for durable products. Sustainability 2021, 13, 11126. [Google Scholar] [CrossRef]
- Al-Refaie, A.; Kokash, T. Optimization of sustainable reverse logistics network with multi-objectives under uncertainty. J. Remanufacturing 2023, 13, 1–23. [Google Scholar] [CrossRef]
- Al-Refaie, A.; Lepkova, N.; Camlibel, M.E. The relationships between the pillars of TPM and TQM and manufacturing performance using structural equation modeling. Sustainability 2022, 14, 1497. [Google Scholar] [CrossRef]
- Pakdil, F.; Leonard, K.M. Criteria for a lean organization: Development of a lean assessment tool. Int. J. Prod. Res. 2014, 52, 4587–4607. [Google Scholar] [CrossRef]
- Susilawati, A.; Tan, J.; Bell, D.; Sarwar, M. Fuzzy logic-based method to measure degree of lean activity in manufacturing industry. J. Manuf. Syst. 2015, 34, 1–11. [Google Scholar] [CrossRef]
- Thangarajoo, Y.; Smith, A. Lean thinking: An overview. Ind. Eng. Manag. 2015, 4, 159. [Google Scholar]
- Elmoselhy, S.A. Hybrid lean–agile manufacturing system technical facet, in automotive sector. J. Manuf. Syst. 2013, 32, 598–619. [Google Scholar] [CrossRef]
- Al-Refaie, A.; Abbasi, G.; Al-shalaldeh, H. Lean and agile practices to improve the performance of filling process via simulation and data envelopment analysis. SN Appl. Sci. 2019, 1, 1131. [Google Scholar] [CrossRef]
- Potdar, P.K.; Routroy, S.; Behera, A. Agile manufacturing: A systematic review of literature and implications for future research. Benchmarking Int. J. 2017, 24, 2022–2048. [Google Scholar] [CrossRef]
- Antwi, B.O.; Agyapong, D.; Owusu, D. Green supply chain practices and sustainable performance of mining firms: Evidence from a developing country. Clean. Logist. Supply Chain. 2022, 4, 100046. [Google Scholar] [CrossRef]
- Al-Refaie, A.; Abdelrahim, D.A.Y. A system dynamics model for green logistics in a supply chain of multiple suppliers, retailers and markets. Int. J. Bus. Perform. Supply Chain Model. 2021, 12, 259–281. [Google Scholar] [CrossRef]
- Trujillo-Gallego, M.; Sarache, W. An integral GSCM index for assessment of environmental performance in manufacturing companies. Benchmarking Int. J. 2019, 26, 1948–1971. [Google Scholar] [CrossRef]
- do Rosário Cabrita, M.; Duarte, S.; Carvalho, H.; Cruz-Machado, V. Integration of lean, agile, resilient and green paradigms in a business model perspective: Theoretical foundations. IFAC-PapersOnLine 2016, 49, 1306–1311. [Google Scholar] [CrossRef]
- McDonald, N. Organisational resilience and industrial risk. In Resilience Engineering: Concepts and Precepts; Hollnagel, E., Woods, D.D., Leveson, N., Eds.; Ashgate: Surrey, UK, 2006; Chapter 11; pp. 155–180. [Google Scholar]
- Al-Refaie, A.; Aljundi, H. A Fuzzy FMEA-Resilience Approach for Maintenance Planning in a Plastics Industry. Int. J. Progn. Health Manag. 2024, 15. [Google Scholar] [CrossRef]
- Wreathall, J. Properties of resilient organisations: An initial view. In Resilience Engineering: Concepts and Precepts; Hollnagel, E., Woods, D.D., Leveson, N., Eds.; Ashgate: Surrey, UK, 2022; Chapter 17; pp. 275–285. [Google Scholar]
- Al-Refaie, A.; Lepkova, N. A Proposed DEA Window Analysis for Assessing Efficiency from Asymmetry Dynamic Data. Symmetry 2023, 15, 1650. [Google Scholar] [CrossRef]
- Carvalho, H.; Azevedo, S.G.; Cruz-Machado, V. An innovative agile and resilient index for the automotive supply chain. Int. J. Agil. Syst. Manag. 2013, 6, 259–283. [Google Scholar] [CrossRef]
- Azevedo, S.G.; Govindan, K.; Carvalho, H.; Cruz-Machado, V. Ecosilient Index to assess the greenness and resilience of the upstream automotive supply chain. J. Clean. Prod. 2013, 56, 131–146. [Google Scholar] [CrossRef]
- Azevedo, S.G.; Fazendeiro, P.; Cruz-Machado, V. A Fuzzy LARG Index Model to the Automotive Supply Chain. In Airports and the Automotive Industry: Security Issues, Economic Efficiency and Environmental Impact; NOVA Publishers: Hauppauge, NY, USA, 2013. [Google Scholar]
- Fazendeiro, P.; Azevedo, S.G.; Cruz-Machado, V. A framework proposal to assess the LARG index of a supply chain in a fuzzy context. In Handbook of Research on Enterprise 2.0: Technological, Social, and Organizational Dimensions; IGI Global: Hershey, PA, USA, 2014; pp. 550–571. [Google Scholar]
- Azevedo, S.G.; Carvalho, H.; Cruz-Machado, V. LARG index: A benchmarking tool for improving the leanness, agility, resilience, and greenness of the automotive supply chain. Benchmarking Int. J. 2016, 23, 1472–1499. [Google Scholar] [CrossRef]
- Amjad, M.S.; Rafique, M.Z.; Khan, M.A. Modern divulge in production optimization: An implementation framework of LARG manufacturing with Industry 4.0. Int. J. Lean Six Sigma 2021, 12, 992–1016. [Google Scholar] [CrossRef]
- Salleh, N.H.M.; Abd Rasidi, N.A.S.; Jeevan, J. Lean, agile, resilience and green (LARG) paradigm in supply chain operations: A trial in a seaport system. Aust. J. Marit. Ocean Aff. 2020, 12, 200–216. [Google Scholar] [CrossRef]
- Raut, R.D.; Mangla, S.K.; Narwane, V.S.; Dora, M.; Liu, M. Big Data Analytics as a mediator in Lean, Agile, Resilient, and Green (LARG) practices effects on sustainable supply chains. Transp. Res. Part E Logist. Transp. Rev. 2021, 145, 102170. [Google Scholar] [CrossRef]
- Anvari, A.R. The integration of LARG supply chain paradigms and supply chain sustainable performance (A case study of Iran). Prod. Manuf. Res. 2021, 9, 157–177. [Google Scholar] [CrossRef]
- Bottani, E.; Bigliardi, B.; Rinaldi, M. Development and proposal of a LARG (lean, agile, resilient, green) performance measurement system for a food supply chain. IFAC-PapersOnLine 2022, 55, 2437–2444. [Google Scholar] [CrossRef]
- Çeke, H. Lean, Agile, Resilient and Green Supply Chain Management (LARG SCM). Master’s Thesis, Marmara Universitesi, İstanbul, Turkey, 2022. [Google Scholar]
- Ferraro, S.; Cantini, A.; Leoni, L.; De Carlo, F. A Conceptual Framework for Measuring the Impact of LARG Practices on Logistics Performance. In Conference on Performance Management; Springer Nature: Cham, Switzerland, 2023; pp. 121–132. [Google Scholar]
- Pabarja, R.; Jamali, G.; Salimifard, K.; Ghorbanpur, A. Analysis of the LARG of the Hospital Medical Equipment Supply Chain using the Fuzzy Inference System. Int. J. Res. Ind. Eng. 2024, 13, 116–151. [Google Scholar]
- Ghazvinian, A.; Feng, B.; Feng, J.; Talebzadeh, H.; Dzikuć, M. Lean, Agile, Resilient, Green, and Sustainable (LARGS) Supplier Selection Using Multi-Criteria Structural Equation Modeling under Fuzzy Environments. Sustainability 2024, 16, 1594. [Google Scholar] [CrossRef]
- Zhou, B. Lean principles, practices, and impacts: A study on small and medium-sized enterprises (SMEs). Ann. Oper. Res. 2016, 241, 457–474. [Google Scholar] [CrossRef]
- Costa, J.M.; Rossi, M.; Rebentisch, E.; Terzi, S.; Taisch, M.; Nightingale, D. What to measure for success in lean system engineering programs? Procedia Comput. Sci. 2014, 28, 789–798. [Google Scholar] [CrossRef]
- Silvério, L.; Trabasso, L.G.; Pereira Pessôa, M.V. A roadmap for a leanness company to emerge as a true lean organization. Concurr. Eng. 2020, 28, 3–19. [Google Scholar] [CrossRef]
- Andrés-López, E.; González-Requena, I.; Sanz-Lobera, A. Lean service: Reassessment of lean manufacturing for service activities. Procedia Eng. 2015, 132, 23–30. [Google Scholar] [CrossRef]
- Čiarnienė, R.; Vienažindienė, M. Lean manufacturing: Theory and practice. Econ. Manag. 2012, 17, 726–732. [Google Scholar] [CrossRef]
- Gupta, S.; Jain, S.K. A literature review of lean manufacturing. Int. J. Manag. Sci. Eng. Manag. 2013, 8, 241–249. [Google Scholar] [CrossRef]
- Stevenson, M.; Spring, M. Flexibility from a supply chain perspective: Definition and review. Int. J. Oper. Prod. Manag. 2007, 27, 685–713. [Google Scholar] [CrossRef]
- Hung Lau, K. Demand management in downstream wholesale and retail distribution: A case study. Supply Chain. Manag. Int. J. 2012, 17, 638–654. [Google Scholar] [CrossRef]
- Álvarez, J.M.; Roibás-Millán, E. Agile methodologies applied to Integrated Concurrent Engineering for spacecraft design. Res. Eng. Des. 2021, 32, 431–450. [Google Scholar] [CrossRef]
- Jiao, J.; Simpson, T.W.; Siddique, Z. Product family design and platform-based product development: A state-of-the-art review. J. Intell. Manuf. 2007, 18, 5–29. [Google Scholar] [CrossRef]
- Yeh, Y.J.; Lai, S.Q.; Ho, C.T. Knowledge management enablers: A case study. Ind. Manag. Data Syst. 2006, 106, 793–810. [Google Scholar] [CrossRef]
- Lee, H.; Choi, B. Knowledge management enablers, processes, and organizational performance: An integrative view and empirical examination. J. Manag. Inf. Syst. 2003, 20, 179–228. [Google Scholar]
- Govindan, K.; Nosrati-Abarghooee, S.; Nasiri, M.M.; Jolai, F. Green reverse logistics network design for medical waste management: A circular economy transition through case approach. J. Environ. Manag. 2022, 322, 115888. [Google Scholar] [CrossRef]
- Wu, J. Sustainable development of green reverse logistics based on blockchain. Energy Rep. 2022, 8, 11547–11553. [Google Scholar] [CrossRef]
- Mosgaard, M.A.; Bundgaard, A.M.; Kristensen, H.S. ISO 14001 practices–A study of environmental objectives in Danish organizations. J. Clean. Prod. 2022, 331, 129799. [Google Scholar] [CrossRef]
- Martins, F.; Fonseca, L. Comparison between eco-management and audit scheme and ISO 14001: 2015. Energy Procedia 2018, 153, 450–454. [Google Scholar] [CrossRef]
- Shahzad, M.; Qu, Y.; Rehman, S.U.; Zafar, A.U. Adoption of green innovation technology to accelerate sustainable development among manufacturing industry. J. Innov. Knowl. 2022, 7, 100231. [Google Scholar] [CrossRef]
- Al-Refaie, A.; Al-Tahat, M.; Lepkova, N. Modelling relationships between agility, lean, resilient, green practices in cold supply chains using ISM approach. Technol. Econ. Dev. Econ. 2020, 26, 675–694. [Google Scholar] [CrossRef]
- Ho, C.K.; Robinson, A.; Miller, D.R.; Davis, M.J. Overview of sensors and needs for environmental monitoring. Sensors 2005, 5, 4–37. [Google Scholar] [CrossRef]
- Okoh, P.; Haugen, S. Improving the robustness and resilience properties of maintenance. Process Saf. Environ. Prot. 2015, 94, 212–226. [Google Scholar] [CrossRef]
- Tong, Q.; Yang, M.; Zinetullina, A. A dynamic Bayesian network-based approach to resilience assessment of engineered systems. J. Loss Prev. Process Ind. 2020, 65, 104152. [Google Scholar] [CrossRef]
- Mentes, A.; Turan, O. A new resilient risk management model for Offshore Wind Turbine maintenance. Saf. Sci. 2019, 119, 360–374. [Google Scholar] [CrossRef]
- Park, J.; Seager, T.P.; Rao, P.S.C.; Convertino, M.; Linkov, I. Integrating risk and resilience approaches to catastrophe management in engineering systems. Risk Anal. 2013, 33, 356–367. [Google Scholar] [CrossRef] [PubMed]
- Grime, J.M.; Dama, J.F.; Ganser-Pornillos, B.K.; Woodward, C.L.; Jensen, G.J.; Yeager, M.; Voth, G.A. Coarse-grained simulation reveals key features of HIV-1 capsid self-assembly. Nat. Commun. 2016, 7, 11568. [Google Scholar] [CrossRef] [PubMed]
- Geramian, A.; Mehregan, M.R.; Mokhtarzadeh, N.G.; Hemmati, M. Fuzzy inference system application for failure analyzing in automobile industry. Int. J. Qual. Reliab. Manag. 2017, 34, 1493–1507. [Google Scholar] [CrossRef]


Disclaimer/Publisher’s Note: The statements, opinions and data contained in all publications are solely those of the individual author(s) and contributor(s) and not of MDPI and/or the editor(s). MDPI and/or the editor(s) disclaim responsibility for any injury to people or property resulting from any ideas, methods, instructions or products referred to in the content. |
© 2025 by the authors. Licensee MDPI, Basel, Switzerland. This article is an open access article distributed under the terms and conditions of the Creative Commons Attribution (CC BY) license (https://creativecommons.org/licenses/by/4.0/).