Article

Evaluating the Environmental and Safety Impacts of Eco-Driving in Urban and Highway Environments

by
Marios Sekadakis
,
Maria Ioanna Sousouni
,
Thodoris Garefalakis
*,
Maria G. Oikonomou
,
Apostolos Ziakopoulos
and
George Yannis
Department of Transportation Planning and Engineering, National Technical University of Athens, 5 Iroon-Polytechniou Str., 157 73 Athens, Greece
*
Author to whom correspondence should be addressed.
Sustainability 2025, 17(6), 2762; https://doi.org/10.3390/su17062762
Submission received: 7 February 2025 / Revised: 14 March 2025 / Accepted: 18 March 2025 / Published: 20 March 2025
(This article belongs to the Special Issue Sustainable Urban Mobility: Road Safety and Traffic Engineering)

Abstract

:
The present study aims to investigate the benefits of eco-driving in urban areas and on highways through an experiment conducted in a driving simulator. Within a group of 39 participants aged 18–30, multiple driving scenarios were conducted, both without and with eco-driving guides, to assess the impact of eco-driving behavior on environmental sustainability and safety outcomes. Data on pollutant emissions, including carbon dioxide (CO2), carbon monoxide (CO), and nitrogen oxides (NOx), as well as crash probability, were collected during the experiment. The relationships between driving behavior and pollutant emissions were estimated using linear regression models, while binary logistic regression models were employed to assess crash probability. The analysis revealed that eco-driving led to a significant reduction in pollutant emissions, with CO2 emissions decreasing by 1.42%, CO by 98.2%, and NOx by 20.7% across both urban and highway environments, with a more substantial impact in urban settings due to lower average speeds and smoother driving patterns. Furthermore, eco-driving reduced crash probability by 90.0%, with urban areas exhibiting an 86.8% higher crash likelihood compared to highways due to higher traffic density and more complex driving conditions. These findings highlight the dual benefit of eco-driving in reducing environmental impact and improving road safety. This study supports the integration of eco-driving techniques into transportation policies and driver education programs to foster sustainable and safer driving practices.

1. Introduction

As societies strive to balance economic development with environmental sustainability, transportation remains a focal point of concern due to its significant contribution to greenhouse gas emissions and urban air pollution [1,2]. The combustion of fossil fuels in vehicles generates various harmful compounds, including nitrogen oxides (NOx), carbon dioxide (CO2), and carbon monoxide (CO), which have detrimental effects on air quality, human health, and ecosystems. In urban areas, where nearly one-third of the population in Europe is exposed to pollutant levels exceeding EU air quality standards [3], road traffic is among the leading sources of emissions. According to estimates by the European Environment Agency, exposure to fine particulate matter (PM2.5) resulted in over 238,000 premature deaths across the European Union in 2020 alone [4]. This alarming statistic underscores the urgent need for cleaner and more sustainable transportation practices that prioritize both environmental preservation and public health.
Efforts to address these challenges have led to various technological, legislative, and behavioral interventions. Among these, eco-driving has emerged as a practical strategy with significant potential to reduce fuel consumption, minimize emissions, and enhance road safety. Eco-driving is a driving approach that prioritizes fuel efficiency and emission reduction by encouraging smooth acceleration, maintaining consistent speeds, optimizing gear usage, and anticipating road conditions to minimize unnecessary braking. Unlike conventional driving, which often involves abrupt speed changes and reactive maneuvers, eco-driving emphasizes proactive control and energy-efficient behaviors, ultimately leading to reduced fuel consumption and lower environmental impact [5].
Eco-driving is a vital tool in mitigating climate change, as transportation remains a significant contributor to global greenhouse gas emissions. While eco-driving plays a key role in reducing emissions, other factors such as vehicle design, friction reduction technologies, and advancements in fuel efficiency also contribute to minimizing the environmental impact of transportation [6,7]. Projections suggest that global temperatures could rise by 1.6 °C and 6.9 °C by the end of the century [8], emphasizing the need for immediate action. In countries like Greece, where the transport sector accounts for up to 22% of total greenhouse gas emissions [9], eco-driving presents an actionable and scalable solution to reduce environmental impact.
Additionally, the safety benefits of eco-driving are particularly noteworthy. Smoother driving techniques inherently reduce the likelihood of collisions, while consistent speeds and adequate following distances improve reaction times and overall road dynamics [10]. Studies have shown that adopting eco-driving practices can reduce crash rates by up to 10% and significantly improve road safety by promoting smoother driving behaviors [11]. Road traffic collisions remain a significant global challenge, particularly for children and young adults aged 5–29 years, who are disproportionately affected. According to the World Health Organization (WHO), road crashes result in approximately 1.19 million deaths annually and leave countless individuals injured. Beyond the human cost, these incidents cause a substantial financial strain, estimated at around 3% of global GDP [12]. This dual burden of fatalities and economic losses highlights the urgent need for comprehensive prevention strategies. Behavioral interventions, such as eco-driving, offer a valuable complement to technological advancements and infrastructure improvements by addressing safety and sustainability concerns simultaneously.
This study aims to analyze the benefits of eco-driving in urban environments and highways using a driving simulator, with a dual focus on its impact in reducing atmospheric emissions (CO2, CO, and NOx) and lowering the likelihood of road crashes. A key feature of this research is its methodological approach, combining precise data collection on driver behavior through simulation experiments with detailed participant characteristics obtained via questionnaires. This wide-ranging dataset enables the application of tailored analytical methods, resulting in robust insights. Additionally, this study incorporates a theoretical framework to develop mathematical models that quantify the influence of eco-driving on critical factors, offering a unique and systematic perspective on its environmental and safety benefits.
While previous studies have demonstrated the effectiveness of eco-driving in reducing emissions and improving road safety, research focusing specifically on young drivers (18–30 years old) remains limited. This demographic is particularly relevant, as younger drivers are more prone to risk-taking behaviors, which may affect their ability to adopt eco-driving techniques effectively. Additionally, many studies overlook the role of gender and driving experience in shaping eco-driving outcomes. Given the significant contribution of younger drivers to traffic-related incidents and emissions, a deeper understanding of their driving behavior is essential.
By addressing these gaps, this study provides a novel contribution by evaluating the impact of eco-driving strategies among young drivers in both urban and highway environments. Our findings will help inform the development of targeted interventions to enhance sustainable and safe driving practices, ultimately contributing to broader efforts in mitigating emissions and improving road safety.
This paper is structured into six main sections. Firstly, in the current section, the importance of eco-driving in reducing environmental impacts and improving road safety is established, providing the foundation for this study. Then, the relevant literature is reviewed to build on existing knowledge and identify the gaps addressed in this research. Following this, the design and execution of a driving simulator experiment are explained, highlighting the methods used to collect detailed data on driving behavior and its effects. Furthermore, the theoretical framework is outlined, explaining the regression models used to analyze the collected data and uncover key relationships. Our findings are presented and discussed in the context of their broader implications. Finally, this paper concludes by summarizing its contributions and offering recommendations for future studies and practical implementations.

2. Literature Review

Eco-driving has emerged as an important strategy for tackling environmental issues and improving road safety, and it has received considerable attention in the literature. Numerous studies have shown its potential to drastically cut emissions, with claimed reductions ranging from 5% to 40%. Morello et al. (2016) [13] used microscopic and macroscopic simulation models to evaluate the effect of eco-driving in Turin under different traffic situations. Their research found that free-flow traffic lowered CO2 emissions by up to 15%, whereas moderate congestion resulted in a somewhat lower reduction of 10%. Unexpectedly, in severe traffic circumstances, comprising around 8–10% of all traffic scenarios, the advantages were minimal, suggesting that eco-driving is more effective in less congested regions. In a similar vein, Arroyo-López et al. (2022) [14] discovered a reduction of almost 13 kg of CO2 per trip after analyzing 150 routes undertaken by 55 participants. Xu et al. (2022) [15] conducted a driving simulator experiment in Melbourne that emulated a real-world setting, their findings demonstrated the potential of eco-routing technology to minimize urban air pollution, showing significant reductions in NOx, CO, and CO2 emissions of 37.6%, 31.4%, and 21.5%, respectively.
Recent research offers further proof of eco-driving effectiveness. In a study by Wang and Boggio-Marzet (2018) [16], drivers who received eco-driving training achieved an average 6.3% drop in fuel consumption across different types of roads, with the most substantial gains on major arterial routes. In an additional study, Lois et al. (2019) [17] examined the interaction between driving behaviors, external factors, and fuel consumption in the context of eco-driving, noting fuel savings ranging from 5% to 12% in two Spanish cities, especially in low-congestion metropolitan regions. Furthermore, Ayyildiz et al. (2017) [18] examined freight transport and reported a 5.5% decrease in fuel consumption for heavy-duty trucks, coupled with valuable observations on driver behavior. These results together emphasize the extensive application of eco-driving tactics in urban environments, highlighting their significance in reducing emissions.
Eco-driving not only mitigates emissions, but its efficacy may vary according to the kind of route traversed. Research conducted by Fontaras et al. (2017) [7] revealed that uphill driving increases fuel consumption and elevates emissions by around 5% for each 1% gradient. Conversely, downhill driving could reduce emissions by around 3.5% with every 1% decrease. These findings highlight the importance of considering road topography when implementing eco-driving practices. Another study by Coloma et al. (2018) [19] investigated eco-driving across different road types under real-world conditions and found that the largest reductions in fuel consumption and emissions occurred on arterial roads, with comparatively smaller benefits observed on urban roads. Furthermore, Bakibillah et al. (2024) [20] proposed an optimized eco-driving system (EDS) that employs intelligent control models to modify driving behavior according to the forthcoming road conditions. Their approach demonstrated a remarkable 91% reduction in emissions on curved roads, showcasing the potential for adaptive systems to account for complex road geometries. A complementary study by Kim et al. (2018) [21] proposed an eco-driving trajectory optimization method considering road characteristics, achieving a significant reduction in fuel consumption through speed adjustments tailored to specific road profiles.
Beyond its environmental benefits, eco-driving is also a crucial factor in improving road safety. Hibberd et al. (2015) [22] studied the influence of in-vehicle eco-driving assistance systems through a driving simulator. They observed that reduced pedal variability and speed led to more stable and safer driving behavior. Similarly, Nævestad (2022) [23] documented significant reductions in crash rates, 52%, 36%, and 33%, across three companies that adopted eco-driving measures. Expanding on this, Nævestad et al. (2023) [24] analyzed a broader dataset of trucking companies and confirmed substantial crash rate reductions, further emphasizing the role of structured eco-driving programs in enhancing long-term safety outcomes. Reinforcing these findings, Huang et al. (2018) [25] reviewed eco-driving technologies and highlighted their potential to reduce both fuel consumption and road crashes by encouraging smoother acceleration and deceleration patterns. Similarly, Li et al. (2020) [26] explored the use of eco-safe automated driving HMI (Human–Machine Interface) systems and found that they not only improve fuel efficiency but also enhance road safety by promoting smoother driving behaviors and reducing mental workload for drivers. These findings emphasize the relevance of eco-driving in improving both environmental outcomes and traffic safety.
Despite extensive research on eco-driving, there is a gap in understanding how younger drivers (18–30 years old) respond to eco-driving strategies, particularly in relation to their gender and driving experience. Existing studies focus on broader driver populations but do not differentiate between different demographic factors that may influence eco-driving outcomes. Addressing this gap, this study applies a controlled driving simulator experiment to isolate the effects of eco-driving on young drivers, providing insights that could inform tailored eco-driving programs for this high-risk demographic.
While eco-driving has been widely recognized for its environmental and safety benefits, there is a need for a deeper understanding of how these benefits vary under different driving conditions and behaviors. Current knowledge often overlooks the combined interactions between driver actions and their cumulative effects on emissions, fuel consumption, and safety outcomes. This study addresses these gaps by conducting a thorough analysis using a controlled experimental setup to capture detailed data on driving behavior and its impacts. Our findings aim to contribute valuable insights into optimizing eco-driving strategies, paving the way for more targeted applications in urban and highway contexts and informing future policy and training initiatives.

3. Methods

3.1. Experiment Overview

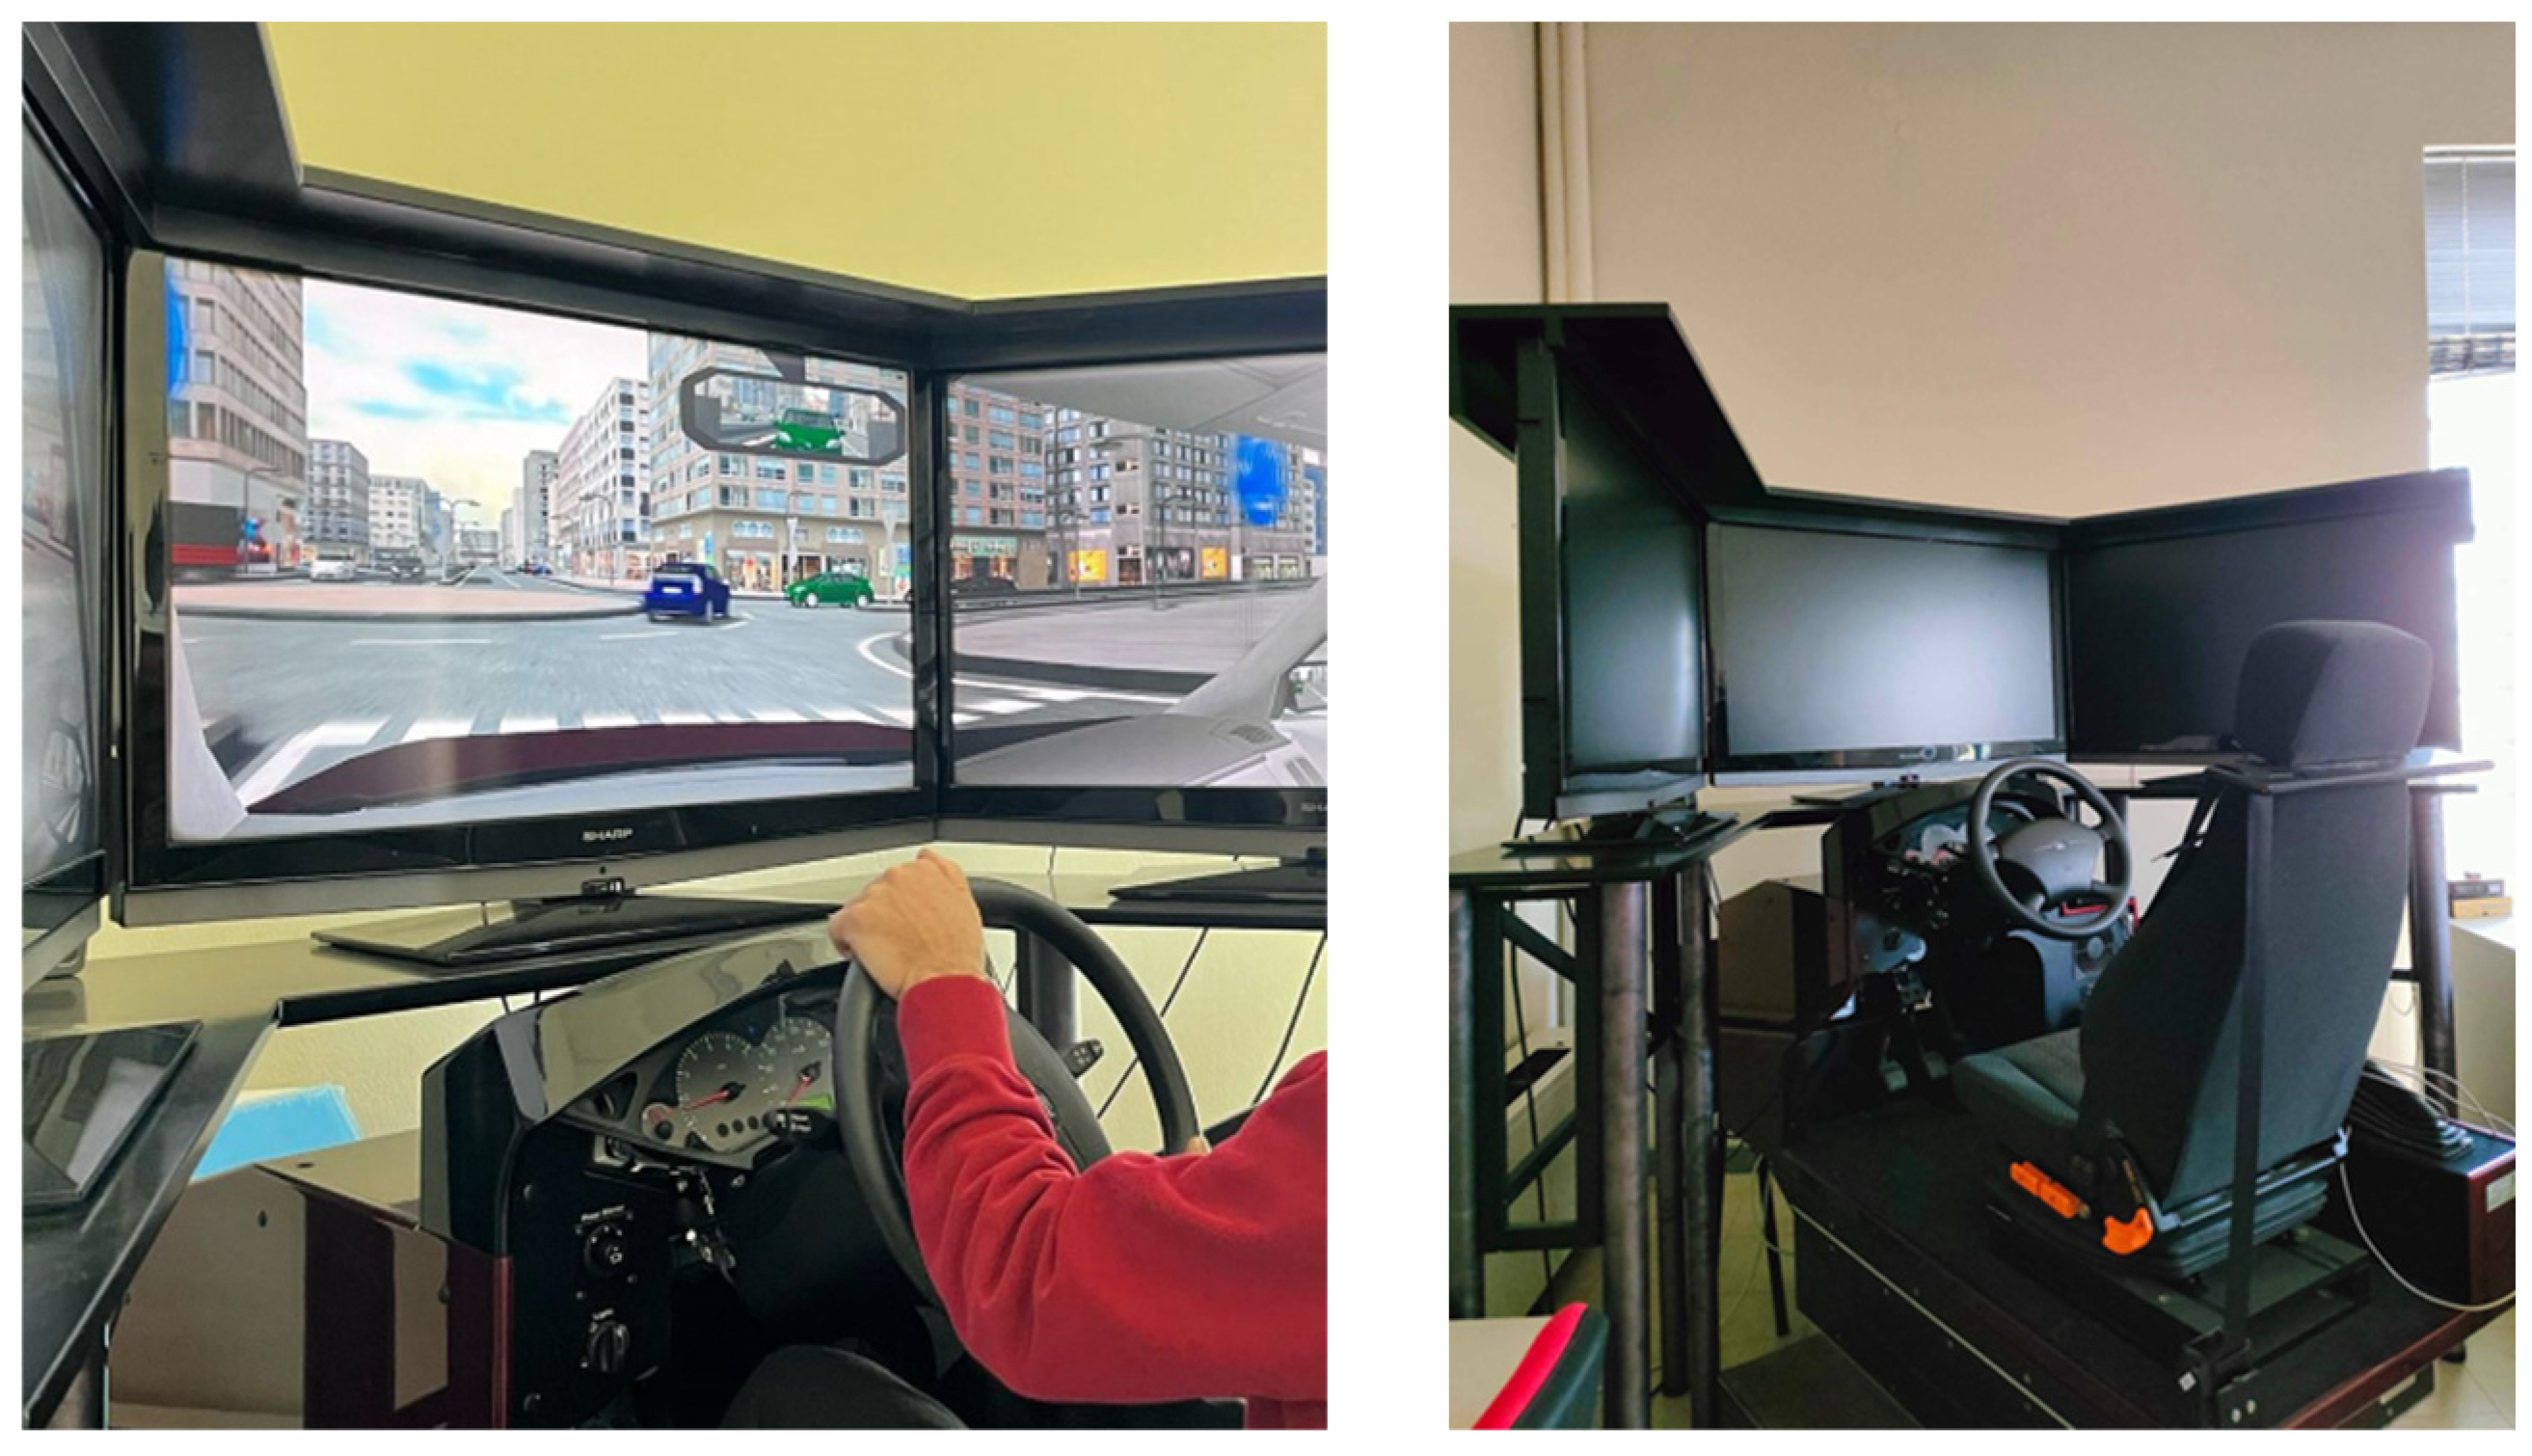
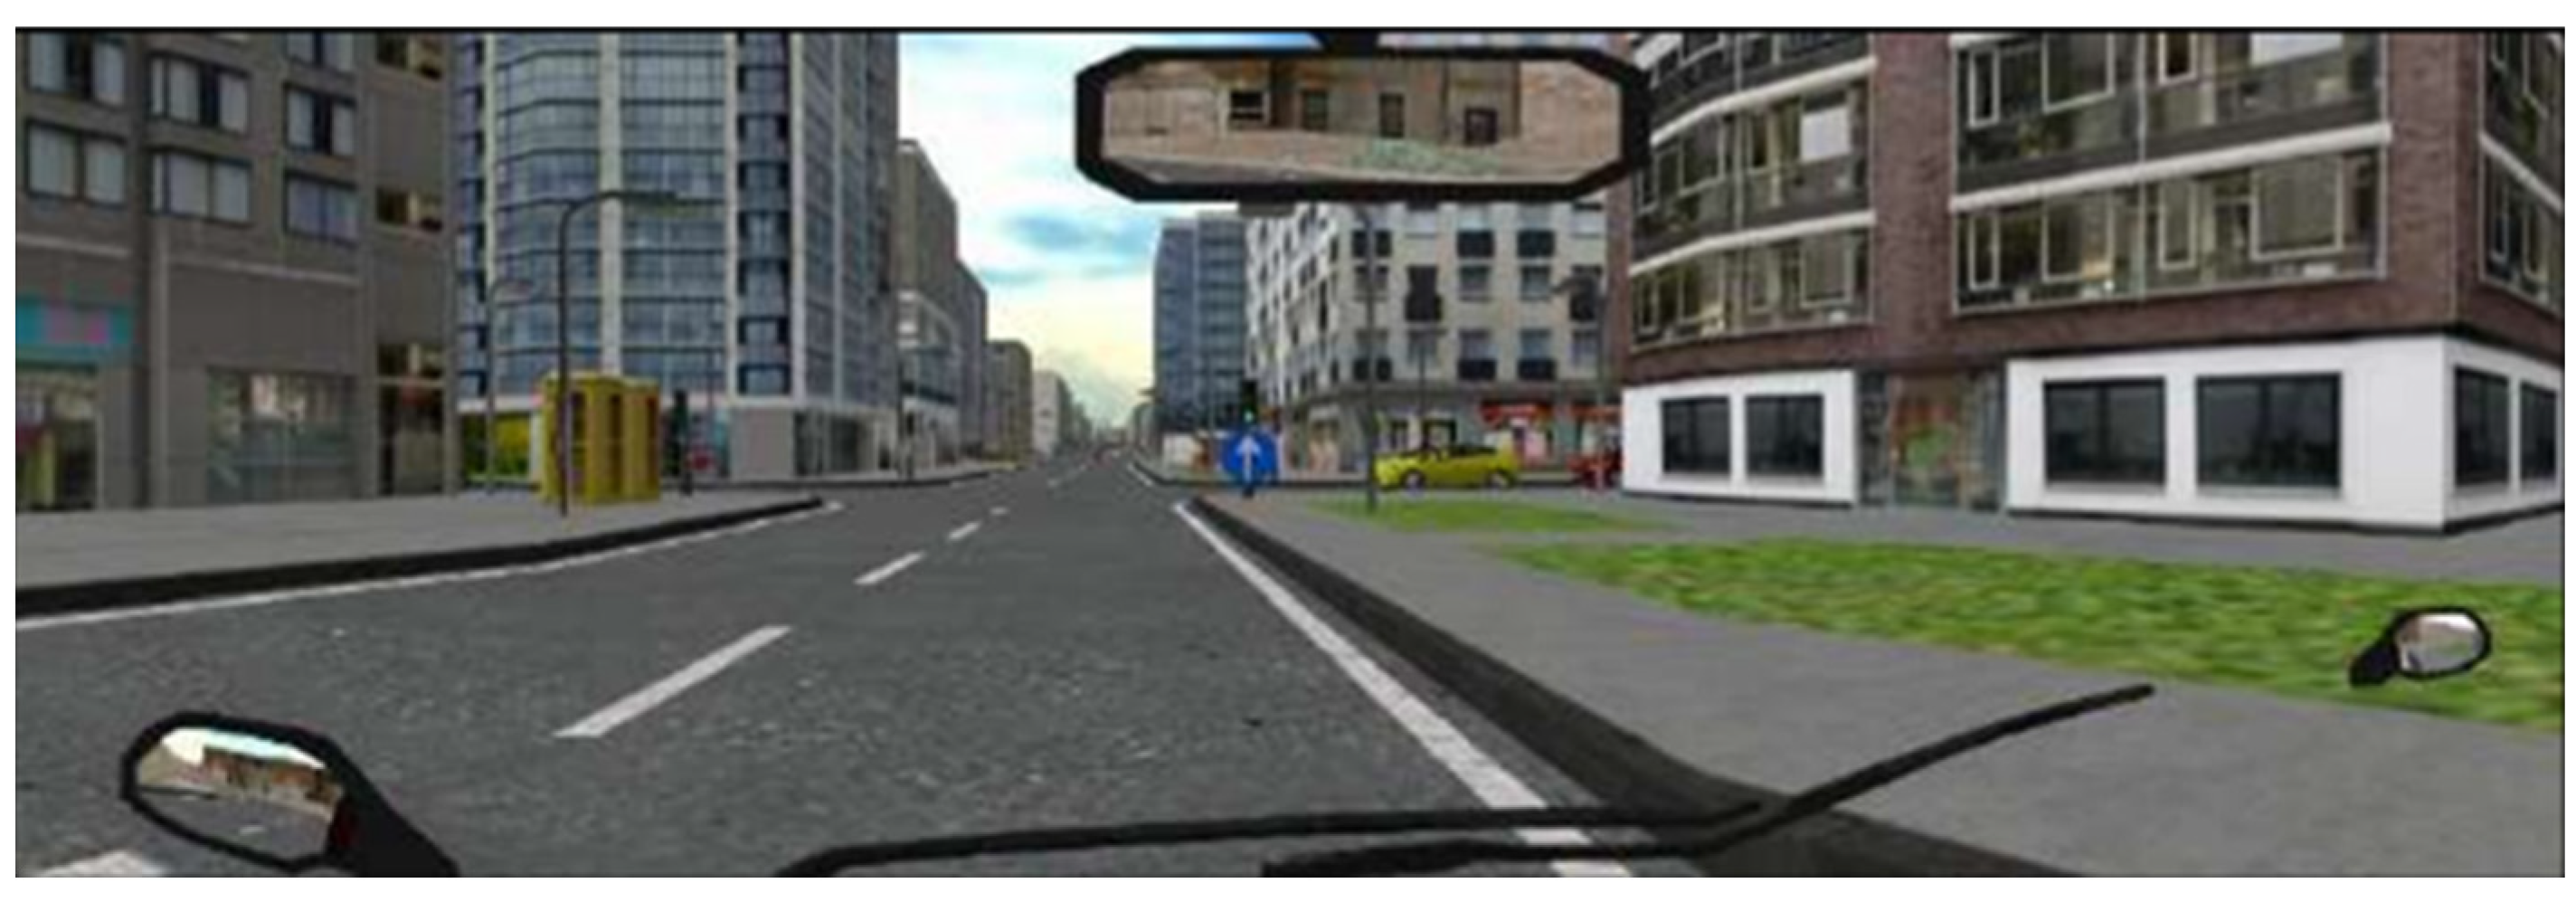
3.1.1. Driving Simulator Framework

To evaluate how eco-driving influences emissions and road safety, this study employed a driving simulator based at the National Technical University of Athens in the Department of Transportation Planning and Engineering. The simulator utilized was a FOERST FP Driving Simulator (Figure 1), consisting of a motion-enabled base, a driver seat, and three wide Full HD screens that provided a 170-degree field of view. The device, measuring 230 × 180 cm with a base width of 78 cm, allowed for realistic virtual driving environments.
The simulator reproduced various driving contexts, including urban, rural, and highway scenarios, with configurable conditions such as traffic density, weather patterns, and lighting. Randomized events, including unexpected pedestrian crossings and sudden obstacles, tested participants’ responses. The driving simulator logs a broad spectrum of variables to create detailed profiles of each session, with data recorded at 60 measurements per second. These include the exact moment in milliseconds from the start, spatial coordinates (x, y, z) of the vehicle, road identifiers, and the vehicle orientation and distance from the road start, measured in meters. It also records driving parameters such as distance traveled, speed, brake, accelerator, and clutch positions in percentages, as well as the gear position and engine RPM (Revolutions Per Minute). Safety-critical measures include the headway in meters, distances to road boundaries, and the steering wheel angle. Time-sensitive safety indicators are also tracked, such as time to headway, time-to-line crossing, and time to collision, all recorded in milliseconds. Additionally, lateral and longitudinal accelerations are logged, alongside event-related data such as the presence and distance of road events and various error codes detailing driving errors. All driving scenarios were conducted using gasoline-powered vehicles.

3.1.2. Experimental Scenarios

For the purposes of this study, as previously outlined, the experiment was conducted on two network types: an urban environment (Figure 2) and a highway environment (Figure 3). The provided digital urban environments feature roads with two-way traffic, offering one (1) or two (2) lanes in each direction along with roundabouts integrated into the city network. The highway sections include two (2) lanes per direction as well. Additionally, the two networks are equipped with traffic lights and appropriate signage. In each scenario, two hazardous events occur, such as a wild animal (e.g., wild deer) crossing or a pedestrian crossing or a side car unparking.

3.1.3. Study Protocol

For the driving experiment, young drivers holding valid licenses were voluntarily recruited from two age groups: 18–23 years and 24–30 years. Young drivers were selected due to their higher risk of road traffic crashes, as reported by the World Health Organization (2023) [12], which identifies road traffic injuries as the leading cause of death for individuals aged 5–29 years. This age group is particularly vulnerable due to inexperience, risk-taking behaviors, and increased susceptibility to distractions. The selection process aimed to assess driving behaviors influenced by varying levels of experience, ensuring an equitable representation of both genders. To achieve a balanced distribution, participants were evenly recruited across the 18–23 and 24–30 age groups. This study comprised 39 drivers, including 23 males and 16 females, who had an average of four years of driving experience. In terms of age distribution, 56% of the participants fell within the 18–23-year group, while the remaining 44% were aged between 24 and 30 years. Regarding gender, males accounted for 59% of the sample, and females made up the remaining 41%. Each driver completed a familiarization session of around five minutes, followed by four driving sessions (two for each road type) in randomized order. Each scenario lasted 4–5 min, resulting in a total driving time of approximately 20 min per participant. A questionnaire was also designed to capture detailed information about the driver profiles, with a particular emphasis on their eco-driving practices. Data collection spanned three phases.
  • Phase 1: Participants performed a test drive before completing two baseline scenarios.
  • Phase 2: Completing two baseline scenarios maintaining a regular driving style.
  • Phase 3: After completing an eco-driving briefing and reading an informational leaflet, participants repeated the scenarios, implementing eco-driving strategies outlined in the material provided.
To ensure methodological consistency in eco-driving practices, participants were provided with a training guide preceding Phase 3. This guide systematized fuel-efficient driving into three core principles: (1) adaptive speed regulation aligned with traffic dynamics, (2) optimization of acceleration–deceleration gradients, and (3) mitigation of mechanical strain on vehicular systems. Participants were instructed to drive at steady and moderate speeds, keep engine revolutions below 2000 RPM, synchronize their speed with surrounding traffic while maintaining a safe following distance, avoid abrupt speed changes (both accelerations and decelerations), and minimize throttle use on downhill sections while leveraging momentum for uphill driving. Post-experiment questionnaires (Appendix A Table A1) gathered self-reported driving behaviors, attitudinal dispositions, and vehicular characteristics into 31 quantifiable metrics. Subsequent analysis of the 39-case dataset explicated correlations between discrete driving behavioral variables, such as incremental acceleration patterns, and their measurable impacts on emission profiles and collision probability.

3.1.4. Emissions Calculation

Post-experiment, additional metrics for emissions, such as Vehicle Specific Power (VSP) and pollutants (CO2, CO, HC, and NOx), were calculated using established methodologies [27].
The Vehicle Specific Power (VSP) index, a microscale emissions modeling metric, was derived to quantify instantaneous vehicular power demand. The VSP was computed as a function of instantaneous speed u (m/s) and acceleration a (m/s2) using the following equation (Equation (1)):
V S P = 0.156461 × u + 0.00200193 × u 2 + 0.000492646 × u 3 + 1.4788 × u × a 1.4788
Pollutant emission rates (CO2, CO, HC, and NOx) were calculated using a binning methodology based on VSP values. As detailed by Zhao et al. (2015) [27], each VSP bin corresponds to empirically derived base emission rates for the respective pollutants.
Three datasets were integrated into a unified analytical framework: time-series driving simulator data capturing kinematic parameters, questionnaire responses on driving habits and vehicle characteristics, and environmental indicators. The integrated dataset comprised 313 observational cases (rows) and 112 variables (columns), enabling multivariate analysis of interactions between driving behavior, driving habits, vehicle characteristics, and environmental outcomes.

3.2. Regression Analysis

To investigate the benefits of eco-driving in both urban and highway environments, this study employs a controlled driving simulator experiment and applies regression models to analyze key parameters. Linear regression is used to estimate the relationship between eco-driving behavior and pollutant emissions, while binary logistic regression assesses crash probability in different driving scenarios. These modeling approaches were selected based on prior empirical research, which has demonstrated their effectiveness in emissions modeling and traffic safety analysis. For emissions estimation, multiple linear regression has been successfully applied to forecast CO2 emissions with high predictive accuracy [28,29]. Similarly, logistic regression has been validated as a reliable tool for crash probability analysis [30,31]. These modeling approaches ensure a rigorous quantification of the environmental and safety impacts of eco-driving, providing a statistically robust framework for evaluating its effectiveness.

3.2.1. Linear Regression Model (Emissions)

Linear regression was employed to examine the relationship between eco-driving behavior and continuous dependent variables such as pollutant emissions (CO2, CO, and NOx). The model is represented as follows (Equation (2)):
Yi = β0 + β1X1i + β2X2i + … + βnXni + εi
In this model, Yi represents the dependent variable, which in this context corresponds to pollutant emission levels. The independent variables, denoted as X1, X2, …, Xn, influence Yi, capturing variations in eco-driving behavior. The intercept β0 establishes the baseline measurement, while the residual term εi accounts for unexplained variability within the model, ensuring a comprehensive analysis of influencing factors. Previous studies have demonstrated that emissions exhibit a strong linear relationship with driving parameters. Chen (2024) applied multiple linear regression to predict CO2 emissions based on vehicle engine size and fuel consumption, achieving a high correlation coefficient of 0.9675, confirming the robustness of this approach [28]. Additionally, Cha et al. (2021) verified that regression models effectively predict real-world CO2 emissions in light-duty diesel vehicles based on speed, acceleration, and engine power, further supporting the validity of this method [29].

3.2.2. Binary Logistic Regression Model (Crash Probability)

To evaluate crash probability, a binary logistic regression model was applied. This model estimates the likelihood of a crash occurring based on driving behavior, accounting for variations in urban and highway environments. The equation is given as follows (Equation (3)):
Y i = ln P i 1 P i = β 0 + β 1 X 1 i + β 2 X 2 i + + β n X ni
Within this framework, Yi denotes the binary outcome variable, distinguishing between crash occurrences (1) and non-occurrences (0). The probability of a crash is influenced by the independent variables X1, X2, …, Xn, which capture key behavioral and contextual factors. The intercept β0 defines the baseline probability, and Pi quantifies the likelihood of a crash under given conditions, offering a predictive measure based on observed driving patterns. Kononen et al. (2011) demonstrated that logistic regression effectively predicts serious injuries in motor vehicle crashes, validating its application for crash risk analysis [31]. Furthermore, Das et al. (2015) successfully estimated the likelihood of future crashes for high-risk drivers using logistic regression, reinforcing its suitability for evaluating crash probability [30].

3.2.3. Model Validation and Evaluation Metrics

The selection of independent variables for the regression models was based on a structured evaluation process. Each independent variable included in the models was consistently assessed against the statistical criteria outlined in this section to ensure relevance, robustness, and contribution to explanatory power. In addition, Pearson’s correlation test was conducted for continuous independent variables, while Spearman’s rank correlation test was applied to discrete variables. This approach helped identify potential collinearity issues, ensuring that only independent predictors with meaningful contributions were retained in the final model.
The validation of mathematical models necessitates a consistent evaluation framework to ensure statistical robustness, theoretical consistency, and predictive efficacy. Statistical significance is assessed using p values for linear models and logistic models.
The overall linear regression model quality was quantified by the coefficient of determination, R2, which measures the proportion of variance in the dependent variable explained by the model. An R2 value approaching 1 indicates a strong linear relationship and more accurate predictions. R2 is computed as follows (Equation (4)):
R 2 = S S R S S T = i = 1 n ( Y i ^ Y ¯ ) 2 i = 1 n ( Y i Y ¯ ) 2 = 1 i = 1 n ( Y i Y i ^ ) 2 i = 1 n Y i Y ¯ 2
where Y i ^ denotes the predicted value for the ith observation, and Y ¯ represents the mean value of Yi.
To assess the reliability of the logistic regression, a model calibration check was performed. This involved computing the average predicted probability of a crash for each observation and comparing it to the actual average occurrence of crashes in the observed data. This approach ensures that the model’s estimated probabilities align with real-world crash distributions.

3.2.4. Results Interpretation

The elasticity of the independent variables (ei) was calculated to quantify the sensitivity of the dependent variable to variations in each predictor [32]. Specifically, elasticity provides a proportional measure of responsiveness; for instance, an elasticity value of 0.5 implies that a 1% increase in the independent variable leads to a 0.5% change in the dependent variable, holding all other factors constant. This enables a direct interpretation of the magnitude of influence exerted by each predictor. Furthermore, to facilitate a direct comparison of their relative impacts, a standardized elasticity measure (ei*—relevant elasticity) was derived by normalizing each elasticity value in relation to the variable with the smallest effect.
For continuous predictors, elasticity is defined as follows (Equation (5)):
e i = Δ Y ι Δ X ι   ( X ι Y ι )
For categorical predictors, pseudo-elasticity provides an equivalent measure, capturing the impact of categorical shifts. The mathematical formulations for discrete (Equation (6)) and continuous (Equation (7)) variables are defined as follows:
Ε x i n k P i = e β i k i = 1 I e β i x n i = 1 I e Δ ( β i x n ) 1
Ε x i n k P i = [ 1 i = 1 I P n ( i ) ] x i n k β i k
The variable i denotes the number of available alternatives, while Pi represents the probability associated with alternative i. The term xink specifies the value of variable k for alternative i concerning individual n. The function Δ (βixn) captures the adjustment in the model when the value of xink changes from 0 to 1, while βixn represents the corresponding parameter value when xnk is set at 0. Finally, βik is the parameter that quantifies the effect of variable xnk on the outcome

4. Results

4.1. Environmental Emissions Models

4.1.1. CO2 Emissions

The CO2 emissions regression model highlights key factors influencing emissions, providing insights through the regression equation and statistical outputs. The model demonstrates that CO2 emissions are significantly influenced by eco-driving practices and driving environments, reinforcing the effectiveness of eco-driving strategies. The empirical analysis reveals that adopting eco-driving techniques, characterized by lower speeds, gentler accelerations/decelerations, and reduced engine revolutions, leads to a measurable decrease in CO2 emissions. Meanwhile, highway environments, typically involving higher speeds, are associated with elevated emissions compared to urban networks. The regression equation for CO2 emissions is represented as follows (Equation (8)):
log (CO2/km) = 6.603 − 0.094 × (Eco) + 0.373 × (Environment) − 0.023 × (RoutesPerDay) + 0.019 × (AvgDRight)
where
  • CO2/km: CO2 emissions per kilometer driven (g/km);
  • Eco: Eco-driving scenario (e.g., 0 = non-eco-driving behavior and 1 = eco-driving behavior);
  • Environment: Driving environment (e.g., 0 = urban network, 1 = highway);
  • RoutesPerDay: Average number of trips per day (e.g., 0 = 0 trips, 1 = 1 trip, …, 6 = more than 5 trips);
  • AvgDRight: Average distance from the right side of the road (m).
Table 1 provides the regression coefficients (βi), standard errors, t-values, p-values, and elasticity measures (e, e*) for each independent variable. The t-test values for all variables appear to be above 1.7, and the p-values are below 0.05, indicating that each variable is statistically significant at the 95% confidence level. Furthermore, relative elasticity (e*) revealed that Environment has the strongest effect on CO2/km, at 3.974 times the smallest influence (AvgDRight). Similarly, RoutesPerDay outweighs the smallest effect by a factor of 1.476, indicating its moderate influence on emissions reduction. Among categorical variables, Eco exhibits the lowest relative elasticity, serving as the baseline reference (e* = 1.00). Finally, AvgDRight shows the smallest effect, with its relative elasticity set at 1.00, reinforcing its relatively minor role in shaping CO2 emissions compared to the other predictors.
The regression analysis reveals that eco-driving results in a 1.42% reduction of CO2. This finding aligns with expectations, as adopting an eco-driving style, characterized by lower speeds, reduced engine revolutions (RPM), and smoother acceleration and deceleration, effectively minimizes fuel consumption and emissions. The negative coefficient for the Eco variable confirms this relationship, indicating that drivers following eco-driving practices produce fewer emissions compared to non-eco-drivers. Regarding the Environment variable, its positive coefficient suggests that emissions increase by 5.65% when transitioning from urban to highway driving. While highway driving generally features steadier conditions with fewer stop-and-go movements, the increased speeds lead to higher fuel consumption and, consequently, elevated CO2 emissions. This finding emphasizes the necessity of additional strategies, such as optimizing speed and using fuel-efficient vehicles, to mitigate emissions in highway settings. In addition, the RoutesPerDay variable exhibits a negative coefficient, suggesting that, as the number of daily trips increases, CO2 emissions decrease slightly. More specifically, emissions decrease by 0.35% per additional daily trip. This finding implies that frequent driving helps drivers develop more efficient habits over time, leading to lower fuel consumption. Lastly, the AvgDRight variable has a positive coefficient, meaning that CO2 emissions tend to increase by 0.29% when the driver positions the vehicle farther from the right side of the lane. This result suggests that drivers who maintain a more central or leftward position may exhibit more aggressive driving behaviors, such as frequent overtaking and higher speeds, which increase emissions. Conversely, drivers who stay closer to the right side of the lane likely adopt a more defensive and steady driving style, reducing fuel consumption.
In conclusion, the model achieves an R2 value of 0.789, and 78.9% of the variance in CO2 emissions is explained by eco-driving behavior, driving environment, routes per day, and the vehicle lateral position (AvgDRight). Overall, these findings underscore the importance of smoother driving practices and cautious maneuvering, as well as the impact of driving at highway speeds, in shaping CO2 emissions.

4.1.2. CO Emissions

The CO emissions model highlights key factors influencing emissions, providing insights through the regression equation and statistical outputs. The model demonstrates that CO emissions are significantly influenced by eco-driving practices and driving environments, reinforcing the effectiveness of eco-driving strategies. The empirical analysis reveals that adopting eco-driving techniques, characterized by lower speeds, gentler accelerations/decelerations, and reduced engine revolutions, leads to a measurable decrease in CO emissions. Meanwhile, highway environments, typically involving higher speeds, are associated with elevated emissions compared to urban networks. The regression equation for CO emissions is represented as follows (Equation (9)):
log (CO/km) = 0.318 − 0.49 × (Eco) + 0.472 × (Environment) − 0.03 × (RoutesPerDay) + 0.075 × (AvgDRight)
where
  • CO/km: CO emissions per kilometer driven (g/km);
  • Eco: Eco-driving scenario (e.g., 0 = non-eco-driving behavior and 1 = eco-driving behavior);
  • Environment: Driving environment (e.g., 0 = urban network, 1 = highway);
  • RoutesPerDay: Average number of trips per day (e.g., 0 = 0 trips, 1 = 1 trip, …, 6 = more than 5 trips);
  • AvgDRight: Average distance from the right side of the road (m).
The regression coefficients along with associated statistics for each variable in the CO emissions model are summarized in Table 2. Additionally, relative elasticity (e*) analysis indicates that Eco has the most substantial effect on CO emissions, being 2.738 times greater than the variable with the smallest impact (AvgDRight). Likewise, Environment exerts a strong influence, with an effect size 2.64 times that of the smallest variable. Meanwhile, RoutesPerDay demonstrates a moderate influence, serving as a reference variable (e* = 1.00). Finally, AvgDRight, with an e* value of 1.00, exhibits the smallest relative effect among the predictors.
The summarized results indicate that adopting eco-driving techniques leads to a 98.2% decrease in CO emissions. This reduction is attributed to fuel-efficient driving behaviors, such as lower engine revolutions (RPM), smoother accelerations, and reduced braking intensity. The negative coefficient of the Eco variable supports this finding, confirming that eco-driving leads to substantially lower emissions compared to standard driving behavior. The Environment variable reveals that emissions increase by 94.6% when transitioning from urban to highway driving. While higher speeds on highways generally lead to greater fuel consumption, this effect may be mitigated by steadier driving conditions with fewer instances of acceleration and braking. The elasticity measure indicates that the driving environment plays a significant role in shaping emissions levels, reinforcing the importance of road type in emissions modeling. The RoutesPerDay variable has a negative coefficient, suggesting that a higher number of daily trips contributes to a slight but consistent decrease in CO emissions. Specifically, emissions decrease by 35.8%. This finding suggests that regular driving experience may help drivers refine their efficiency, leading to a moderate reduction in fuel consumption and emissions over time. Finally, the AvgDRight variable has a positive coefficient, meaning that CO emissions increase by 0.2% when the driver maintains a greater distance from the right side of the road. Similar to CO2 outcomes, this trend suggests that drivers positioned closer to the left lane may engage in more aggressive driving behaviors, such as overtaking and higher-speed maneuvers, which increase fuel consumption and emissions. Conversely, those who stay closer to the right side of the lane tend to adopt a more defensive and steady driving style, reducing fuel consumption. However, the low elasticity value indicates that this factor plays a relatively minor role compared to the other variables in the model.
The model achieves an R2 value of 0.690, indicating that 69.0% of the variance in CO emissions is explained by the selected predictor variables, including eco-driving behavior, driving environment, trip frequency, and lateral positioning (AvgDRight). While external factors may also contribute to emissions variability, the model provides a strong statistical foundation for understanding the key determinants of CO output.

4.1.3. NOx Emissions

The NOx model provides insights into the primary factors influencing nitrogen oxide (NOx) emissions, presenting the regression equation and statistical outputs. The findings demonstrate that NOx emissions are significantly influenced by eco-driving practices, driving environment, driver behavior, and demographic factors. The results demonstrate that engaging in eco-driving, marked by controlled speeds, smooth acceleration and braking, and efficient engine usage, leads to a tangible decline in NOx emissions. Furthermore, emissions levels are affected by the road type, with highway environments being associated with increased NOx emissions due to higher speeds and greater fuel consumption compared to urban networks. The regression equation for NOx emissions is expressed as follows (Equation (10)):
log (NOx/km) = −2.149 − 0.495 × (Eco) + 1.04 × (Environment) − 0.00004× (AvgTTC) − 0.082 × (Avgrspur) + 0.089 × (Gender)
where
  • NOx/km: NOx emissions per kilometer driven (g/km);
  • Eco: Eco-driving scenario (e.g., 0 = non-eco-driving behavior and 1 = eco-driving behavior);
  • Environment: Driving environment (e.g., 0 = urban network, 1 = highway);
  • AvgTTC: Time to collision from the leading vehicle (ms);
  • Avgrspur: Lateral offset of the vehicle from the center of the road (m);
  • Gender: Driver’s gender (e.g., 1 = Male, 2 = Female).
Table 3 presents the regression coefficients and statistical metrics for each predictor in the nitrogen oxides (NOx) model. Furthermore, the relative elasticity (e*) analysis indicates that Environment has the strongest effect on NOx emissions, being 5.827 times greater than the smallest effect (AvgTTC). Similarly, Eco-driving plays a significant role in emissions reduction, with an impact 2.771 times larger than the lowest influence. Meanwhile, Gender and AvgTTC serve as reference points (e* = 1.00), while Avgrspur exhibits an exceptionally high relative elasticity, suggesting a substantial role in shaping NOx emissions patterns.
The regression results indicate that adopting eco-driving techniques leads to a 20.7% reduction in NOx emissions. This reduction is attributed to fuel-efficient driving behaviors, such as maintaining lower speeds, reducing abrupt accelerations and braking, and optimizing engine operation. The negative coefficient of the Eco variable confirms this effect, demonstrating that eco-driving effectively minimizes NOx emissions compared to conventional driving behavior. The Environment variable reveals that NOx emissions increase by 43.6% when transitioning from urban to highway driving. This result is expected, as higher speeds on highways tend to elevate fuel consumption, leading to increased nitrogen oxide emissions. The elasticity measure (e = 0.436) indicates that road type is a significant factor influencing NOx emissions, reinforcing the role of driving conditions in emissions patterns. The AvgTTC variable has a negative coefficient, indicating that, as the time to collision increases, NOx emissions decrease slightly. Specifically, emissions drop by 0.00003% for every millisecond increase in time to collision. This suggests that drivers who maintain a greater following distance tend to avoid sudden braking, reducing emissions. While the effect size is small, the elasticity value (e = −0.0000003) highlights that maintaining safe headway contributes, albeit minimally, to emissions reduction. The Avgrspur variable also has a negative coefficient, meaning that NOx emissions decrease by 0.03% when drivers stay closer to the center of their lane. This finding suggests that drivers who deviate more laterally may engage in more dynamic maneuvers, such as frequent lane changes, which can result in increased emissions due to variations in acceleration and braking. The exceptionally high relative elasticity value (e* = 2215.138) suggests that this variable exerts a uniquely strong proportional effect on NOx emissions within the model. Lastly, the Gender variable has a positive coefficient, meaning that NOx emissions increase by 7.5% when the driver is female. This result may suggest that male drivers, on average, exhibit more stable driving behaviors, potentially leading to lower NOx emissions. However, this finding should be interpreted cautiously, as differences in driving patterns among individuals may vary widely beyond gender classification.
The selected independent variables, which include eco-driving behavior, driving environment, following distance (AvgTTC), lateral positioning (Avgrspur), and driver gender, account for 81.3% of the variation in NOx emissions, according to the model’s R2 value of 0.813. While external factors may also contribute to emissions variability, the model effectively captures key determinants of NOx emissions.

4.2. Crash Probability Model

The crash probability model provides a detailed examination of the factors that influence the likelihood of a crash, utilizing statistical outputs to quantify the effects of driving behavior, road environment, and driver experience. The results demonstrate that eco-driving practices contribute significantly to reducing crash probability, as drivers adopting fuel-efficient behaviors tend to maintain lower speeds, smoother acceleration patterns, and better anticipation of road conditions. These characteristics enhance reaction time and allow for safer maneuvering, reducing the likelihood of a crash. The driving environment also plays a key role, with higher crash probability in urban networks, where drivers must respond to traffic signals, pedestrians, and other vehicles. Conversely, highway driving is associated with lower crash risk due to more predictable traffic flow. Additionally, driving experience helps reduce crash probability, as more experienced drivers develop improved hazard perception and better decision-making skills. The probability of a crash is estimated using the logistic function (Equation (11)), while NumOfCrashesAverage is determined by the following equation (Equation (12)):
C r a s h   P r o b a b i l i t y = e N u m O f C r a s h e s A v e r a g e e N u m O f C r a s h e s A v e r a g e + 1
NumOfCrashesAverage = 2.3497 2.608 × ( Eco ) 2.326 × ( Environment ) 0.2538 × ( Years license )
where
  • NumOfCrashesAverage: Indicator of crash occurrence (e.g., 0 = No and 1 = Yes);
  • Eco: Eco-driving scenario (e.g., 0 = non-eco-driving behavior and 1 = eco-driving behavior);
  • Environment: Driving environment (e.g., 0 = urban network, 1 = highway);
  • Years license: Years of driving license possession.
According to Table 4, the results indicate that all variables are statistically significant at the 95% confidence level, with z-values above 1.96 and p-values below 0.05. The relative elasticity (e*) analysis shows that eco-driving has the strongest influence on crash probability, being 1.037 times greater than the effect of driving experience (Years license). Similarly, the driving environment exhibits a nearly equal impact, with an effect 1.00 times the smallest variable.
The results show that eco-driving reduces crash probability by 90.0%. This effect is closely linked to eco-driving techniques that encourage lower speeds, gentler acceleration and braking, greater anticipation of road conditions, and fewer abrupt maneuvers, which in turn minimize the risk of losing vehicle control and enhance overall safety. The driving environment also plays a substantial role in crash likelihood, with the probability of a crash being 86.8% lower on highways compared to urban networks. This result is expected, as urban driving demands continuous attention to external factors such as traffic lights, road signs, pedestrians, and other vehicles. In contrast, highway driving is more structured, with fewer variables requiring immediate driver attention, thus allowing for faster reaction times and better hazard management. The elasticity measure (e = −0.868) underscores the substantial influence of the road environment on crash probability. The Years license variable has a negative coefficient, meaning that each additional year of driving experience is associated with a 63.6% lower crash probability. More experienced drivers tend to develop more effective hazard perception, improved defensive driving skills, and greater familiarity with road risks, reducing their likelihood of being involved in crashes. The elasticity measure (e = −0.636) highlights the moderate but significant role of driving experience in reducing collision risk. The model calibration assessment showed that the average predicted probability of a crash was 0.3269, which closely matched the actual observed crash occurrence of 0.3269. This suggests that the model provides well-calibrated probability estimates of crash risk. Eco-driving plays a key role in accident prevention, while urban environments pose a greater crash risk compared to highways. Additionally, driving experience significantly reduces crash probability, highlighting the importance of skill development over time.

5. Discussion

The present study examines how eco-driving affects both environmental pollutants and road safety in urban and highway settings. Our findings indicate that eco-driving not only reduces pollutant emissions but also decreases crash probability, underscoring its importance as a fundamental strategy for modern transportation [16,33]. This section critically evaluates the results, positioning them within the broader discourse on sustainable mobility and traffic safety, while considering their implications for policy, practice, and future research directions.
The results confirm that eco-driving significantly lowers CO2, CO, and NOx emissions. A reduction of 1.42% in CO2 emissions was observed, with urban environments displaying the most notable benefits. Previous simulator-based studies have reported CO2 reductions between 5% and 6.1% when implementing eco-driving strategies, demonstrating the effectiveness of these interventions in controlled settings [27,34]. Similar, naturalistic eco-driving studies have reported 5% to 12% reductions in CO2 emissions, depending on environmental and traffic conditions [35]. While the overall trend remains consistent across methodologies, the magnitude of reduction in this study is lower, which could be attributed to variations in driving conditions, route characteristics, or specific eco-driving implementation strategies. Many earlier investigations have focused on long-term eco-driving behaviors [36,37]; the present findings emphasize immediate advantages derived from short-term interventions. Moreover, this study identified a remarkable 98.2% decrease in CO emissions, exceeding reductions reported in comparable research. Recent simulator-based studies have reported CO reductions of 17.03% in intersection driving scenarios [38], indicating that the reduction observed in this study is substantially higher. Real-world studies have demonstrated more variable results, with some reporting inconsistent CO trends, where emissions either decreased or increased depending on driver adaptation to eco-driving strategies [39]. The substantial reduction observed in this study reflects the optimized conditions of the simulator, where eco-driving techniques are consistently applied, demonstrating their effectiveness.
The link between braking variability and CO emissions highlights the need for smoother driving. Additionally, NOx emissions dropped by 20.7%, underscoring the role of consistent driving speeds in mitigating emissions [40,41]. Recent naturalistic studies report NOx reductions of 9% [39], which is lower than the reduction observed in this simulator-based study. While the trend is similar across methodologies, the discrepancy is likely due to the controlled nature of the simulator environment, where drivers adhere more strictly to eco-driving strategies, and external traffic disruptions are eliminated. Unlike previous work that emphasized fuel type as a major determinant of NOx output, these findings suggest that behavioral modifications alone can produce substantial benefits.
Eco-driving was also associated with a 90% reduction in crash probability for participants adhering to its principles. This supports earlier findings that link smoother driving with lower collision risks [42]. Previous studies have documented significant crash rate reductions, with Nævestad (2022) reporting decreases of 52%, 36%, and 33% across different transport companies, reinforcing the effectiveness of structured eco-driving programs [23]. Although findings are consistent across methodologies, the greater reduction in this study likely results from the controlled simulator setting, where external influences are absent. While previous research frequently concentrated on professional drivers, this study demonstrates that young, everyday drivers can also gain safety benefits from eco-driving. Additionally, the crash probability was considerably higher in urban environments compared to highways, likely due to the presence of pedestrians, intersections, and sudden speed changes in city driving. These findings align with recent research advocating targeted safety interventions in urban areas [33,43] and highlight the value of integrating eco-driving into broader traffic safety strategies to reduce risks in urban settings.
From a policy and practice perspective, the results reinforce the potential of integrating eco-driving principles into driver education and transportation policies. Incorporating eco-driving modules into licensing programs could normalize sustainable driving at an early stage, promoting long-term adherence. Additionally, economic incentives such as tax reductions and insurance discounts may encourage more widespread eco-driving adoption, reflecting prior recommendations that emphasize the effectiveness of financial motivators [5,44]. Technological developments present further avenues to enhance eco-driving adherence. Real-time feedback systems, as shown in recent studies, can support and reinforce behavioral changes. Moreover, integrating eco-driving metrics into vehicle dashboards would allow drivers to continuously monitor and improve their environmental and safety performance [45].
Despite these promising outcomes, this study has certain limitations. This study focused on young drivers aged 18–30, which may limit its generalizability to drivers of all age groups and experience levels. Broadening the participant pool to include older and more experienced drivers would offer a more comprehensive understanding of eco-driving effectiveness across varied demographics. Further studies could also explore eco-driving in different vehicle types, including electric and hybrid vehicles, as fuel type may influence eco-driving effectiveness.

6. Conclusions

This study examined how eco-driving practices affect both environmental pollutants and road safety, using a driving simulator for controlled observations. The results revealed that eco-driving markedly reduces emissions and lowers crash risk. By encouraging gentler acceleration, reduced speeds, and more efficient gear usage, eco-driving curtails pollutant emissions. These benefits are especially pronounced in urban areas, where lower speeds and fewer sudden maneuvers help maximize efficiency gains.
In terms of safety, this study also revealed a noteworthy drop in crash probability among those who adopted eco-driving habits. Smoother driving behaviors enhance a driver’s ability to anticipate hazards and lessen the likelihood of collisions, factors that are particularly vital in dense urban settings, where road conditions are often unpredictable. As a whole, these findings highlight the importance of integrating eco-driving techniques into driver training programs and transportation policies to foster both safer and more sustainable mobility.
Looking ahead, real-world validation through on-road studies is essential to capture the full spectrum of driving complexities. Approaches such as offering financial incentives and real-time feedback can further encourage the adoption of eco-driving. Overall, this research underscores eco-driving as a valuable strategy for reducing environmental impact and improving road safety, ultimately supporting more sustainable urban transportation.

Author Contributions

Conceptualization, G.Y.; methodology, M.S., M.I.S. and A.Z.; software, M.S. and M.I.S.; validation, M.I.S.; formal analysis, M.I.S.; resources, G.Y.; data curation, M.S. and M.I.S.; writing—original draft preparation, T.G.; writing—review and editing, M.S., T.G. and M.G.O.; visualization, M.I.S.; supervision, G.Y. All authors have read and agreed to the published version of the manuscript.

Funding

This research received no external funding.

Institutional Review Board Statement

Not applicable.

Informed Consent Statement

Not applicable.

Data Availability Statement

The data presented in this study are available on request from the corresponding author.

Conflicts of Interest

The authors declare no conflicts of interest.

Appendix A

Table A1. Questionnaire variables and coding.
QuestionVariableCoding
A1Years since obtaining a driving license (Years license)0: [0], 1: [1], 2: [2], …, 12: [12]
A2Years of actual driving experience0: [0], 1: [1], 2: [2], …, 12: [12]
A3Days per week driving in urban areas1: [1], 2: [2], …, 7: [7], 8: [Fewer]
A4Days per week driving on highways1: [1], 2: [2], …, 7: [7], 8: [Fewer]
A5Average kilometers per week in urban areas1: [<20], 2: [20–50], …, 5: [>150]
A6Average kilometers per week on highways1: [<20], 2: [20–50], …, 5: [>150]
A7Average number of routes per day (RoutesPerDay)0: [0], 1: [1], …, 6: [>5]
A8Average kilometers driven per day-
B1Vehicle ownership status1: [Yes], 2: [No]
B2Fuel type used by the participant’s vehicle1: [Gasoline], 2: [Diesel], 3: [LPG], 4: [Natural Gas], 5: [Electric]
B3Monthly fuel expenditure1: [<50], 2: [51–100], 3: [101–200], 4: [>200]
B4Age of the vehicle-
C1Familiarity with eco-driving principles1: [Yes], 2: [No]
C2Frequency of eco-driving1: [Never], 2: [Rarely], 3: [Sometimes], 4: [Often], 5: [Always]
C3Degree of adherence to speed limits1: [Not at all], 2: [A little], 3: [Quite a bit], 4: [Much], 5: [Very much]
C4.1Frequency of driving at low speeds1: [Not at all], 2: [Rarely], 3: [Sometimes], 4: [Often], 5: [Always]
C4.2Frequency of maintaining a constant speed1: [Not at all], 2: [Rarely], 3: [Sometimes], 4: [Often], 5: [Always]
C4.3Coordination of speed with traffic flow1: [Not at all], 2: [Rarely], 3: [Sometimes], 4: [Often], 5: [Always]
C4.4Keeping engine speed low1: [Not at all], 2: [Rarely], 3: [Sometimes], 4: [Often], 5: [Always]
C4.5Control over acceleration1: [Not at all], 2: [Rarely], 3: [Sometimes], 4: [Often], 5: [Always]
C4.6Control over deceleration1: [Not at all], 2: [Rarely], 3: [Sometimes], 4: [Often], 5: [Always]
C4.7Maintaining safe distance from other vehicles1: [Not at all], 2: [Rarely], 3: [Sometimes], 4: [Often], 5: [Always]
C4.8Applying eco-driving techniques on downhill roads1: [Not at all], 2: [Rarely], 3: [Sometimes], 4: [Often], 5: [Always]
C4.9Applying eco-driving techniques on uphill roads1: [Not at all], 2: [Rarely], 3: [Sometimes], 4: [Often], 5: [Always]
C5Awareness of fuel reduction methods1: [Yes], 2: [No]
C6Importance assigned to eco-driving1: [Not at all], 2: [A little], 3: [Quite a bit], 4: [Much], 5: [Very much]
D1Participant’s age-
D2Gender of the participant (Gender)1: [Male], 2: [Female], 3: [Other]
D3Interest in driving1: [Yes], 2: [No]
D4Marital status1: [Single], 2: [Married], 3: [Divorced], 4: [Widowed]
D5Annual family income1: [<10,000], 2: [10,000–25,000], 3: [>25,000]
D6Educational level1: [Primary], 2: [Secondary], 3: [Undergraduate], 4: [Postgraduate], 5: [Doctorate], 6: [Other]

References

  1. Rajbhandari, S.; Shrestha, S.L.; Bhandari, R.; Jha, A.K.; Darlami, H.B. Contribution to the Net-Zero Emissions Target from the Transport Sector through Electric Mobility—A Case of Kathmandu Valley. Sustainability 2024, 16, 1211. [Google Scholar] [CrossRef]
  2. Boucher, M. Transportation Electrification and Managing Traffic Congestion: The Role of Intelligent Transportation Systems. IEEE Electrif. Mag. 2019, 7, 16–22. [Google Scholar] [CrossRef]
  3. Fameli, K.M.; Assimakopoulos, V.D. Development of a Road Transport Emission Inventory for Greece and the Greater Athens Area: Effects of Important Parameters. Sci. Total Environ. 2015, 505, 770–786. [Google Scholar] [CrossRef]
  4. European Environment Agency. Air Quality in Europe 2022; European Environment Agency: Copenhagen, Denmark, 2022. [Google Scholar]
  5. Allison, C.K.; Stanton, N.A. Eco-Driving: The Role of Feedback in Reducing Emissions from Everyday Driving Behaviours. Theor. Issues Ergon. Sci. 2019, 20, 85–104. [Google Scholar] [CrossRef]
  6. Gkagkas, K.; Ponnuchamy, V.; Dašić, M.; Stanković, I. Molecular Dynamics Investigation of a Model Ionic Liquid Lubricant for Automotive Applications. Tribol. Int. 2017, 113, 83–91. [Google Scholar] [CrossRef]
  7. Fontaras, G.; Zacharof, N.-G.; Ciuffo, B. Fuel Consumption and CO2 Emissions from Passenger Cars in Europe—Laboratory versus Real-World Emissions. Prog. Energy Combust. Sci. 2017, 60, 97–131. [Google Scholar] [CrossRef]
  8. Betts, R.A.; Collins, M.; Hemming, D.L.; Jones, C.D.; Lowe, J.A.; Sanderson, M.G. When Could Global Warming Reach 4 °C? Philos. Trans. R. Soc. A Math. Phys. Eng. Sci. 2011, 369, 67–84. [Google Scholar] [CrossRef]
  9. Paschalidou, A.K.; Petrou, I.; Fytianos, G.; Kassomenos, P. Anatomy of the Atmospheric Emissions from the Transport Sector in Greece: Trends and Challenges. Environ. Sci. Pollut. Res. 2022, 29, 34670–34684. [Google Scholar] [CrossRef]
  10. Guzek, M. Driver’s Reaction Time in the Context of an Accident in Road Traffic. In Research Methods and Solutions to Current Transport Problems; Mirosław, S., Krzykowska, K., Eds.; Springer International Publishing: Cham, Switzerland, 2020; pp. 184–193. [Google Scholar]
  11. Alam, M.S.; McNabola, A. A Critical Review and Assessment of Eco-Driving Policy & Technology: Benefits & Limitations. Transp. Policy 2014, 35, 42–49. [Google Scholar] [CrossRef]
  12. World Health Organization. Global Status Report on Road Safety. 2023. Available online: https://www.who.int/publications/i/item/9789240086517 (accessed on 6 March 2024).
  13. Morello, E.; Toffolo, S.; Magra, G. Impact Analysis of Ecodriving Behaviour Using Suitable Simulation Platform (ICT-EMISSIONS Project). Transp. Res. Procedia 2016, 14, 3119–3128. [Google Scholar] [CrossRef]
  14. Arroyo-López, P.; Velázquez-Martínez, J.C.; Gámez-Pérez, K.M. Past Behavior as a Predictor of Eco-Driving Practices: The Case of a Sustained Intervention in a Mexican Transportation Company. Int. J. Sustain. Transp. 2022, 16, 989–1002. [Google Scholar] [CrossRef]
  15. Xu, Z.; Jiang, T.; Zheng, N. Developing and Analyzing Eco-Driving Strategies for on-Road Emission Reduction in Urban Transport Systems—A VR-Enabled Digital-Twin Approach. Chemosphere 2022, 305, 135372. [Google Scholar] [CrossRef]
  16. Wang, Y.; Boggio-Marzet, A. Evaluation of Eco-Driving Training for Fuel Efficiency and Emissions Reduction According to Road Type. Sustainability 2018, 10, 3891. [Google Scholar] [CrossRef]
  17. Lois, D.; Wang, Y.; Boggio-Marzet, A.; Monzon, A. Multivariate Analysis of Fuel Consumption Related to Eco-Driving: Interaction of Driving Patterns and External Factors. Transp. Res. D Transp. Environ. 2019, 72, 232–242. [Google Scholar] [CrossRef]
  18. Ayyildiz, K.; Cavallaro, F.; Nocera, S.; Willenbrock, R. Reducing Fuel Consumption and Carbon Emissions through Eco-Drive Training. Transp. Res. Part F Traffic Psychol. Behav. 2017, 46, 96–110. [Google Scholar] [CrossRef]
  19. Coloma, J.F.; García, M.; Wang, Y. Eco-Driving Effects Depending On The Travelled Road. Correlation Between Fuel Consumption Parameters. Transp. Res. Procedia 2018, 33, 259–266. [Google Scholar] [CrossRef]
  20. Bakibillah, A.S.M.; Kamal, M.A.S.; Tan, C.P.; Hayakawa, T.; Imura, J. Optimal Eco-Driving Scheme for Reducing Energy Consumption and Carbon Emissions on Curved Roads. Heliyon 2024, 10, e23586. [Google Scholar] [CrossRef]
  21. Kim, K.; Lee, H.; Song, C.; Kang, C.; Cha, S.W. Optimization of Speed Trajectory for Eco-Driving Considering Road Characteristics. In Proceedings of the 2018 IEEE Vehicle Power and Propulsion Conference (VPPC), Chicago, IL, USA, 27–30 August 2018; IEEE: Piscataway, NJ, USA, 2018; pp. 1–5. [Google Scholar]
  22. Hibberd, D.L.; Jamson, A.H.; Jamson, S.L. The Design of an In-Vehicle Assistance System to Support Eco-Driving. Transp. Res. Part C Emerg. Technol. 2015, 58, 732–748. [Google Scholar] [CrossRef]
  23. Nævestad, T.-O. Eco Driving as a Road Safety Measure: Before and after Study of Three Companies. Transp. Res. Part F Traffic Psychol. Behav. 2022, 91, 95–115. [Google Scholar] [CrossRef]
  24. Nævestad, T.-O.; Milch, V.; Blom, J. Traffic Safety Effects of Economic Driving in Trucking Companies. Transp. Res. Part F Traffic Psychol. Behav. 2023, 95, 322–342. [Google Scholar] [CrossRef]
  25. Huang, Y.; Ng, E.C.Y.; Zhou, J.L.; Surawski, N.C.; Chan, E.F.C.; Hong, G. Eco-Driving Technology for Sustainable Road Transport: A Review. Renew. Sustain. Energy Rev. 2018, 93, 596–609. [Google Scholar] [CrossRef]
  26. Li, X.; Vaezipour, A.; Rakotonirainy, A.; Demmel, S.; Oviedo-Trespalacios, O. Exploring Drivers’ Mental Workload and Visual Demand While Using an in-Vehicle HMI for Eco-Safe Driving. Accid. Anal. Prev. 2020, 146, 105756. [Google Scholar] [CrossRef]
  27. Zhao, X.; Wu, Y.; Rong, J.; Zhang, Y. Development of a Driving Simulator Based Eco-Driving Support System. Transp. Res. Part C Emerg. Technol. 2015, 58, 631–641. [Google Scholar] [CrossRef]
  28. Chen, Z. A Forecast of CO2 Emissions Based on the Fuel Consumption Rating of a Particular Vehicle. Highlights Sci. Eng. Technol. 2024, 92, 87–93. [Google Scholar] [CrossRef]
  29. Cha, J.; Park, J.; Lee, H.; Chon, M.S. A Study of Prediction Based on Regression Analysis for Real-World CO2 Emissions with Light-Duty Diesel Vehicles. Int. J. Automot. Technol. 2021, 22, 569–577. [Google Scholar] [CrossRef]
  30. Das, S.; Sun, X.; Wang, F.; Leboeuf, C. Estimating Likelihood of Future Crashes for Crash-Prone Drivers. J. Traffic Transp. Eng. (Engl. Ed.) 2015, 2, 145–157. [Google Scholar] [CrossRef]
  31. Kononen, D.W.; Flannagan, C.A.C.; Wang, S.C. Identification and Validation of a Logistic Regression Model for Predicting Serious Injuries Associated with Motor Vehicle Crashes. Accid. Anal. Prev. 2011, 43, 112–122. [Google Scholar] [CrossRef]
  32. Washington, S.; Karlaftis, M.; Mannering, F.; Anastasopoulos, P. Statistical and Econometric Methods for Transportation Data Analysis, 2nd ed.; Chapman and Hall/CRC: Boca Raton, FL, USA, 2011. [Google Scholar]
  33. Caban, J.; Vrábel, J.; Šarkan, B.; Ignaciuk, P. About Eco-Driving, Genesis, Challenges and Benefits, Application Possibilities. Transp. Res. Procedia 2019, 40, 1281–1288. [Google Scholar] [CrossRef]
  34. Matsumoto, Y.; Tsurudome, D. Evaluation of Providing Recommended Speed for Reducing CO2 Emissions from Vehicles by Driving Simulator. Transp. Res. Procedia 2014, 3, 31–40. [Google Scholar] [CrossRef]
  35. Coloma, J.F.; Garcia, M.; Boggio-Marzet, A.; Monzón, A. Developing Eco-Driving Strategies Considering City Characteristics. J. Adv. Transp. 2020, 2020, 2083074. [Google Scholar] [CrossRef]
  36. Beusen, B.; Broekx, S.; Denys, T.; Beckx, C.; Degraeuwe, B.; Gijsbers, M.; Scheepers, K.; Govaerts, L.; Torfs, R.; Panis, L.I. Using On-Board Logging Devices to Study the Longer-Term Impact of an Eco-Driving Course. Transp. Res. D Transp. Environ. 2009, 14, 514–520. [Google Scholar] [CrossRef]
  37. Savković, T.; Miličić, M.; Tanackov, I.; Pitka, P.; Koleška, D. Short-Term and Long-Term Impacts of Eco-Driving on Dynamics of Driving Behaviour and Operating Parameters. Transport 2020, 35, 143–155. [Google Scholar] [CrossRef]
  38. Jin, Q.S.; Song, G.H.; Ye, M.M.; Yu, L. Optimization of Eco-Driving Trajectories at Intersections for Energy Saving and Emissions Reduction. In CICTP 2015; American Society of Civil Engineers: Reston, VA, USA, 2015; pp. 2684–2695. [Google Scholar]
  39. Ng, C.Y.; Huang, Y.; Hong, G.; Zhou, J.; Surawski, N.; Ho, J.; Chan, E. Effects of an On-Board Safety Device on the Emissions and Fuel Consumption of a Light Duty Vehicle; SAE Technical Paper: Warrendale, PA, USA, 2018. [Google Scholar]
  40. Fafoutellis, P.; Mantouka, E.G.; Vlahogianni, E.I. Eco-Driving and Its Impacts on Fuel Efficiency: An Overview of Technologies and Data-Driven Methods. Sustainability 2020, 13, 226. [Google Scholar] [CrossRef]
  41. Coloma, J.F.; García, M.; Wang, Y.; Monzón, A. Green Eco-Driving Effects in Non-Congested Cities. Sustainability 2017, 10, 28. [Google Scholar] [CrossRef]
  42. Li, X.; Vaezipour, A.; Rakotonirainy, A.; Demmel, S. Effects of an In-Vehicle Eco-Safe Driving System on Drivers’ Glance Behaviour. Accid. Anal. Prev. 2019, 122, 143–152. [Google Scholar] [CrossRef] [PubMed]
  43. Goes, G.; Bandeira, R.; Gonçalves, D.; de Almeida D’Agosto, M.; Oliveira, C. The Effect of Eco-Driving Initiatives toward Sustainable Urban Waste Collection. Int. J. Sustain. Transp. 2020, 14, 569–578. [Google Scholar] [CrossRef]
  44. Tu, R.; Xu, J.; Li, T.; Chen, H. Effective and Acceptable Eco-Driving Guidance for Human-Driving Vehicles: A Review. Int. J. Environ. Res. Public Health 2022, 19, 7310. [Google Scholar] [CrossRef]
  45. Xu, N.; Li, X.; Liu, Q.; Zhao, D. An Overview of Eco-Driving Theory, Capability Evaluation, and Training Applications. Sensors 2021, 21, 6547. [Google Scholar] [CrossRef]
Figure 1. NTUA FOERST Driving Simulator.
Sustainability 17 02762 g001
Figure 2. Urban driving simulator environment.
Sustainability 17 02762 g002
Figure 3. Highway driving simulator environment.
Sustainability 17 02762 g003
Table 1. Model of CO2/km prediction.
Independent VariablesβiStd. Errort Valuep-Valueee*
Discrete variables
(Constant)6.6030.032205.4190.00 ***
Eco−0.0940.018−5.1070.00 ***−0.0141.00
Environment−0.3730.006−14.0020.00 ***0.056−3.974
RoutesPerDay−2.0360.009−3.9360.00 ***−0.0211.476
Continuous variables
AvgDRight0.0190.4712.2020.02 *0.000021.00
R2 = 0.789
Adjusted R2 = 0.783
* Significance at the 95% confidence level/*** 99.9%.
Table 2. Model of CO/km prediction.
Independent VariablesβiStd. Errort Valuep-Valueee*
Discrete variables
(Constant)0.3180.08023.9600.00 ***
Eco−0.490.0458−10.6880.00 ***−0.9822.738
Environment−0.4720.06647.1110.00 ***0.946−2.64
RoutesPerDay−0.030.01463−2.0380.04 *−0.3581.00
Continuous variables
AvgDRight0.0750.021543.4910.00 ***0.0021.00
R2 = 0.690
Adjusted R2 = 0.681
* Significance at the 95% confidence level/*** 99.9%.
Table 3. Model of NOx/km prediction.
Independent VariablesβiStd. Errort Valuep-Valueee*
Discrete variables
(Constant)−2.1490.1003−21.4180.00 ***
Eco−0.4950.0438−11.3030.00 ***−0.207−2.771
Environment−1.040.053219.5500.00 ***0.4365.827
Gender0.0890.04352.0510.04 *0.0751.00
Continuous variables
AvgTTC0.000040.00−5.4010.00 ***−0.00000031.00
Avgrspur−0.0820.0222−3.6860.001 **−0.00032215.138
R2 = 0.813
Adjusted R2 = 0. 806
* Significance at the 95% confidence level/** 99%/*** 99.9%.
Table 4. Model of crash probability.
Independent VariablesβiStd. Errorz Valuep-Valueee*
Discrete variables
(Constant)2.34970.6253.7620.0002 ***
Eco−2.6080.499−5.2220.00 ***−0.9001.037
Environment−2.3260.488−4.7650.00 ***−0.8681.00
Continuous variables
Years license−0.25380.1104−2.2990.0215 *−0.6361.00
Model Calibration Assessment
Average Predicted Probability = 0.3269
Average Observed Occurrence = 0.3269
* Significance at the 95% confidence level/*** 99.9%.
Disclaimer/Publisher’s Note: The statements, opinions and data contained in all publications are solely those of the individual author(s) and contributor(s) and not of MDPI and/or the editor(s). MDPI and/or the editor(s) disclaim responsibility for any injury to people or property resulting from any ideas, methods, instructions or products referred to in the content.

