Article

Clarification of Effluents Industry Using Nb2O5

by
Gustavo Yuho Endo
1,
Angelo M. Tusset
1,
Lariana Negrão Beraldo de Almeida
1,
Onélia A. A. dos Santos
2,3 and
Giane G. Lenzi
1,*
1
Department of Production Engineering, Federal University of Technology-Paraná, Paraná-Doutor Washington Subtil Chueire St. 330, Ponta Grossa 84017-220, Brazil
2
Department of Chemical Engineering, State University of Maringá, Colombo Ave. 5790, Maringá 87020-900, Brazil
3
Department of Chemistry, Federal University of Technology-Paraná, Via do Conhecimento, s/n—km 01, Pato Branco 85503-390, Brazil
*
Author to whom correspondence should be addressed.
Sustainability 2025, 17(7), 3204; https://doi.org/10.3390/su17073204
Submission received: 3 February 2025 / Revised: 16 March 2025 / Accepted: 31 March 2025 / Published: 3 April 2025
(This article belongs to the Special Issue Sustainable Waste Management Strategies for Circular Economy)

Abstract

:
The effluent treatment from the packaging industry, particularly color removal, is strongly influenced by process interferences. High concentrations of dyes often make water reuse unfeasible. In this context, the present work aims to study the clarification of the dye used in the packaging industry by the photocatalytic process. Niobium was used as a catalyst, which was characterized by different techniques. Before verifying the catalytic activity in the industrial effluent, tests were performed with synthetic dye solutions. As a characterization result, it was possible to identify typical characteristics of the semiconductor. The results with the synthetic effluent indicated that the photocatalytic reaction was adequate for the decolorization of the solution. The optimized conditions indicated pH conditions without adjustments (4.2) and a catalyst concentration of 1.0 g L−1, obtaining a decolorization of 98%. Tests with industrial effluent revealed that the optimum conditions were also obtained with an unadjusted pH (6.2) and catalyst concentration of 6.0 g L−1, obtaining, however, 42% discoloration. This result highlights the influence of the organic load and other interfering factors such as additives. However, the process is promising in the clarification of the effluent, which possibly, with a 42% reduction in color, can be reused in the process generating water sustainability. A curve adjustment was proposed to determine the best conditions obtained for both synthetic and industrial effluents.

1. Introduction

There are many materials that can make up packaging, such as metals, plastics, paper, and cardboard, among others. Among these materials, there is pulp or molded fiber, which consists of a material made basically of paper and water. Both fiber and water can be reused in the manufacturing process, resulting in a low level of waste [1]. However, these effluents, before being reused in the process or released into bodies of water, must be removed by specific treatments.
Dye clarification processes have been studied, with special emphasis on photocatalysis [2], adsorption [3], coagulation [4], among others. Photocatalysis has been highlighted mainly using titanium-based catalysts [5]. Heterogeneous photocatalysis occurs when a photocatalyst (semiconductor) receives, through irradiation, photons with energy greater than or equal to its band gap energy, enabling the electronic transition. In other words, under irradiation, an electron leaves the valence band (BV) and goes to the conduction band (BC), creating a gap (h+) in the BV with a positive potential and, through water molecules adsorbed on the surface of the photocatalyst, generating hydroxyl radicals (HO•), which can subsequently react with the organic pollutant, oxidizing it to CO2 and H2O. This reaction is called indirect photocatalysis, in which, in direct photocatalysis, the compounds can be oxidized directly in the gap in the BV with a positive potential [6,7,8,9].
As an alternative to the use of TiO2, we have niobium, which has been used because it has similar characteristics. In the literature, there are reports on the use of niobium in photocatalytic reactions for the decolorization of textile dyes [10], Nb2O5 added to TiO2 for the decolorization of methylene blue and methylene orange dyes [11], for the degradation of emerging contaminants [12], applied in the photocatalytic degradation of caffeine [13], and used in the adsorption and photoreduction of Cr (VI) [14]. Furthermore, the band gap energy of Nb2O5 varies between 3.2 and 5 eV, being near to the band gap energy of TiO2, which is close to 3.2. Examples of this are 3.84 eV [14], 2.97 eV [15], and 3.0 eV [16].
Some parameters can influence photocatalytic activity. pH can change the surface properties of the catalyst as well as modify the characteristics of the organic pollutants to be degraded [17,18]. For [19], pH strongly influences catalytic activity, since protonation or deprotonation of substrates can considerably alter their physicochemical behavior in photocatalytic systems.
According to [20], the reaction rate is closely related to the photocatalyst concentration. In summary, the authors say that as the photocatalyst concentration increases, the reaction rate increases since more active sites are available. Ref. [21] indicated that, with a higher catalyst concentration, a greater amount of photons is adsorbed and, consequently, a higher degradation rate. On the other hand, when the photocatalyst concentration reaches an optimum point, if more photocatalysts are added, the reaction may be damaged since radiation penetration tends to decrease; this condition is called the light shielding effect.
In this sense, the contribution of this work is to conduct a study applying niobium as a catalyst for the clarification of an industrial effluent (C.I. Basic Yellow 96) from the production of molded packaging. Tests were performed on synthetic effluents in order to evaluate the interference of other compounds. In addition, a curve adjustment was proposed using the least squares method to determine the best pH and catalyst concentration conditions.

2. Materials and Methods

2.1. Catalyst and Characterization

The catalysts used in the photocatalytic process were niobium (Nb2O5) supplied by CBMM (Brazilian Metallurgy and Mining Company Ltda, Araxá, Brazil) and titanium dioxide (P25 Aeroxide, Evonik, Essen, Germany). The catalyst was previously characterized by (i) X-ray diffraction (XRD) patterns were obtained by a Rigaku Miniflex 600 instrument (Tokyo, Japan) with copper radiation (CuKα, λ = 1.5418 Å). The measurements were conducted within a Bragg angle range of 3 to 90° in step-scan mode; (ii) To investigate the morphology of the oxides and determine the distribution of the elements and the surface’s chemical composition of the samples, SEM analyzes with energy dispersive detectors (EDS) were conducted using a MEV-FEG Tescan Mira 3 LM equipment with coupled EDS (Saint Petersburg, Russia). (iii) N2 adsorption and desorption measurements: for analysis, the measurements were performed at 77 K, and the equipment used was the Quantachrome Autosorb Automated Gas Sorption System (Boynton Beach, FL, USA). The calculation of the specific area was performed using the B.E.T. method [22], and the pore volume and mean pore diameter were determined at a relative pressure of 0.99 using the B.J.H. method [23]. (iv) To determine the point of zero charge (PCZ) of Nb2O5, the 11-point methodology was used to determine the pHPCZ [24].

2.2. Photocatalytic Tests
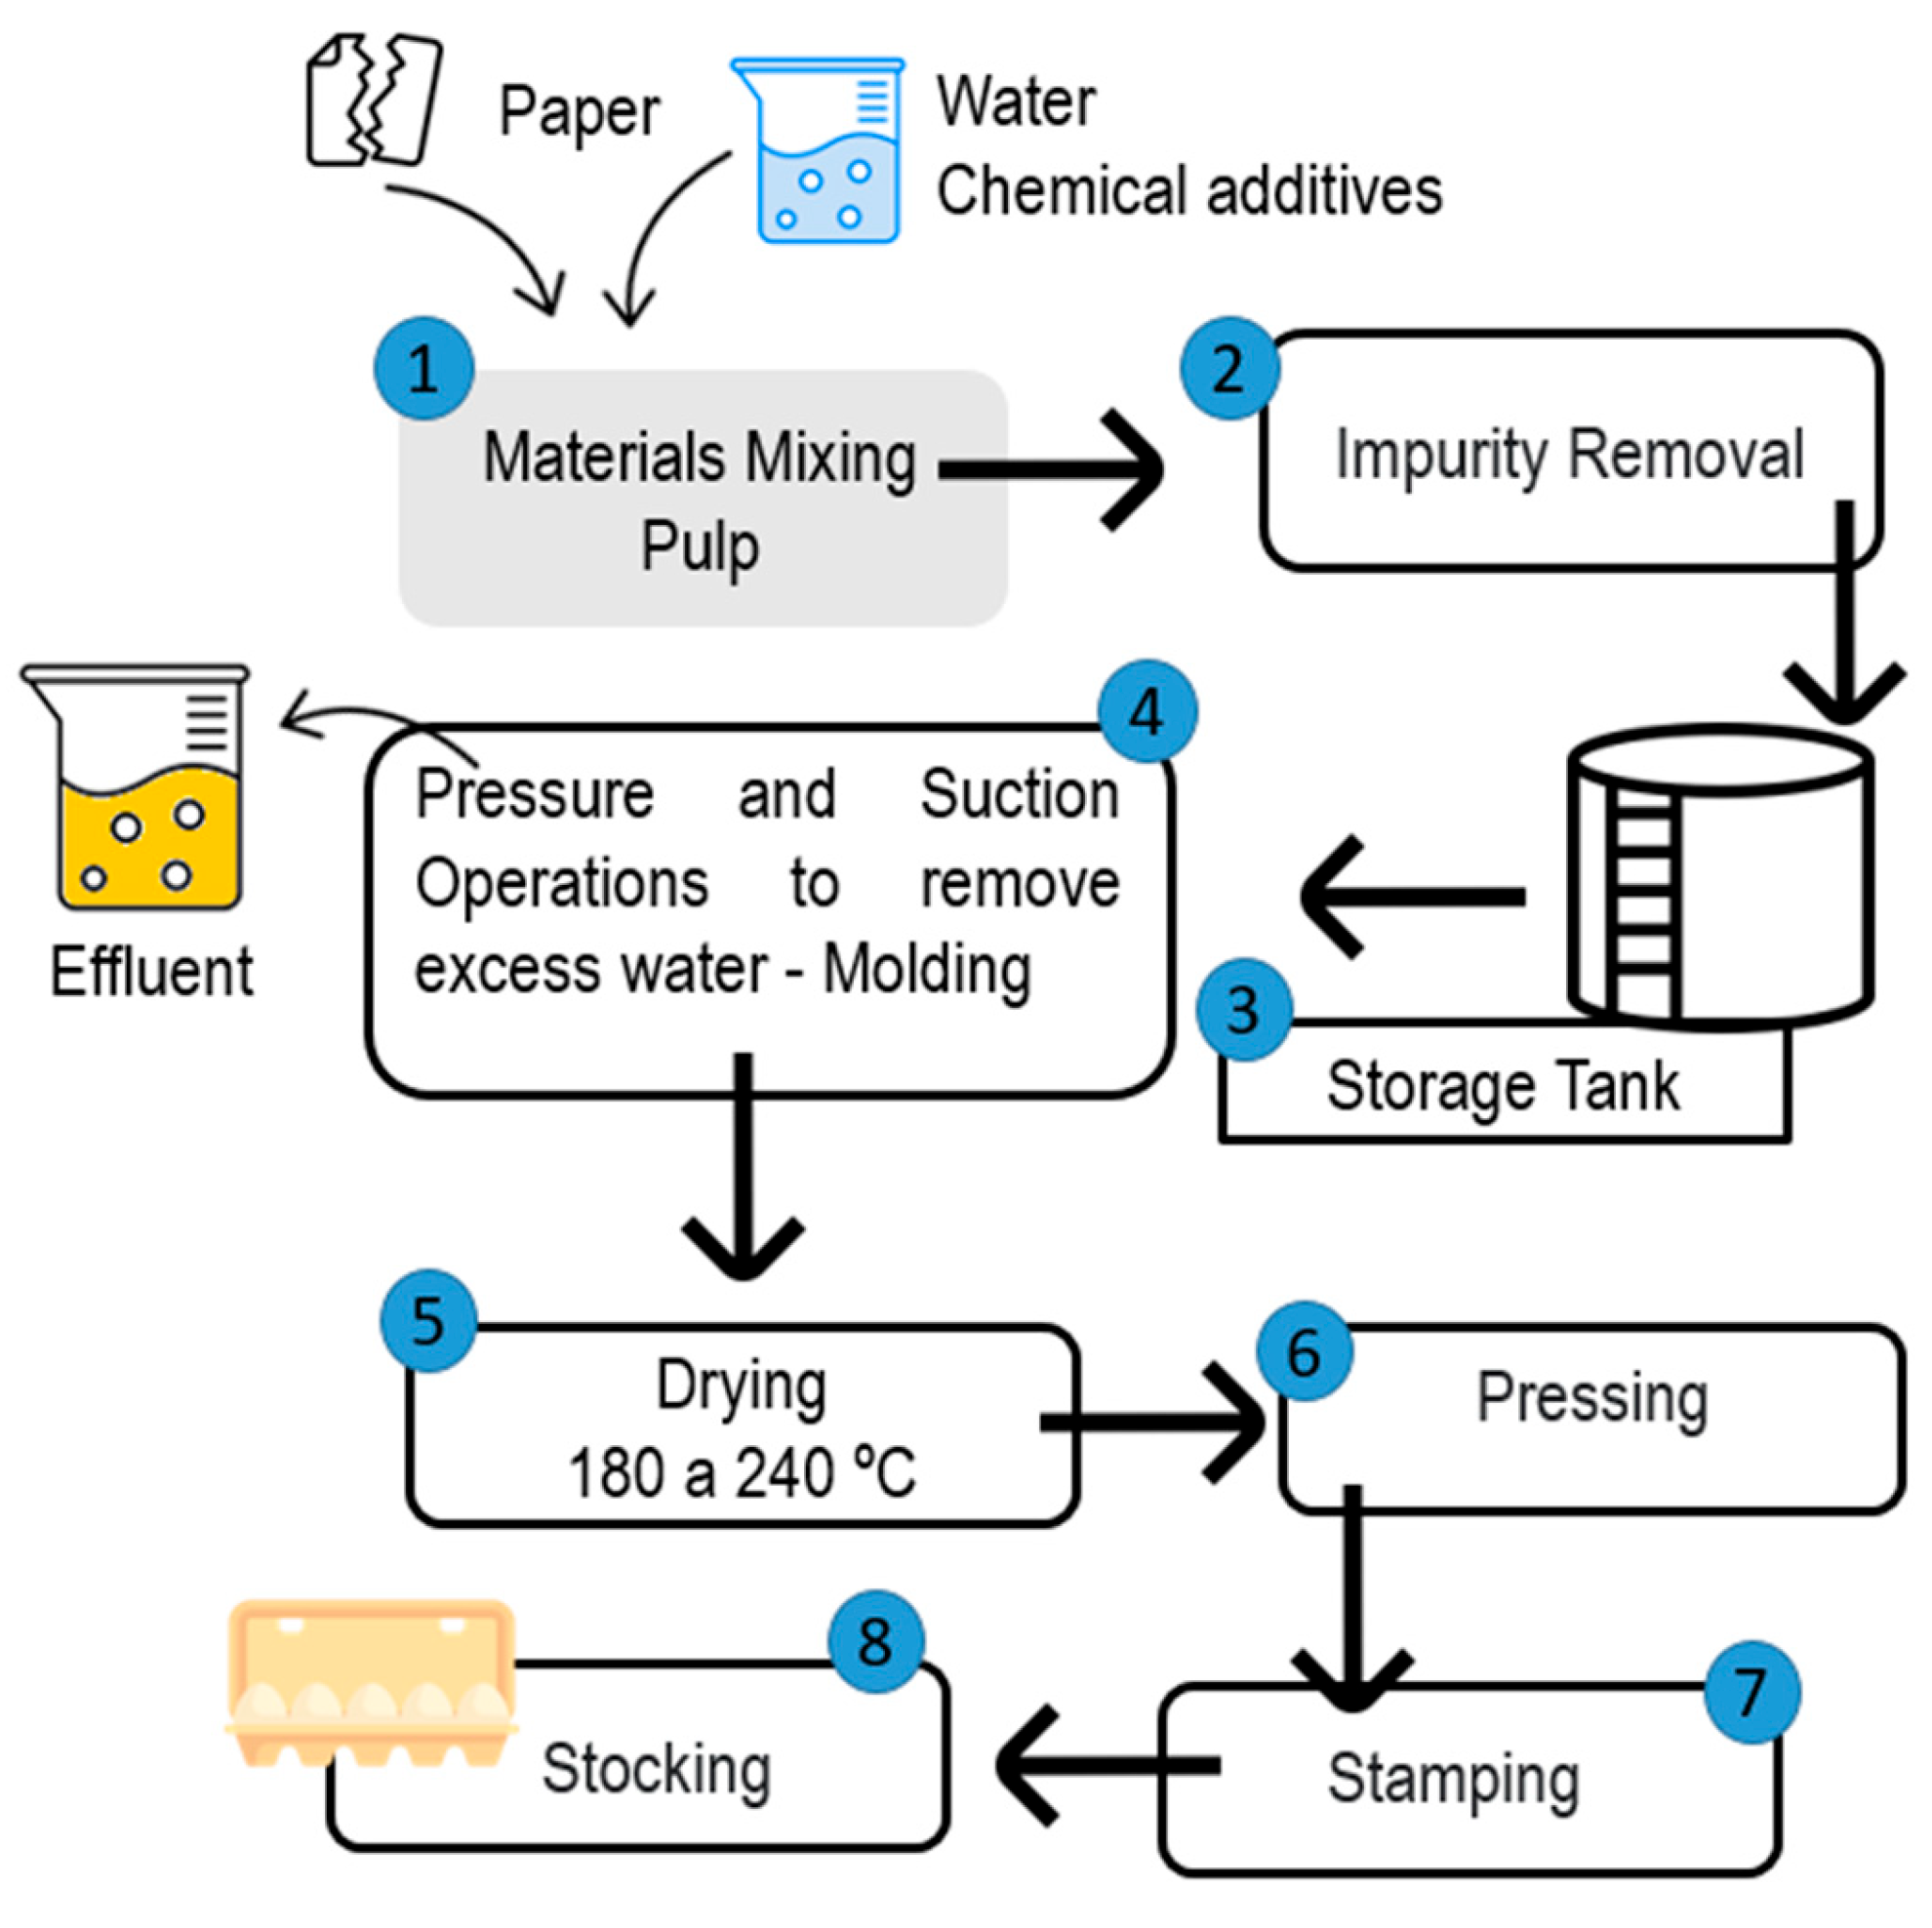
The experimental tests followed the same methodology for both effluents (synthetic or industrial). A reactor with 500 mL of effluent was used for the photocatalytic reactions. The reactor was open to the environment, and an air flow bubbled into the reaction medium at a volumetric flow rate of 0.5 L min−1. The radiation was provided by a 250 W mercury vapor lamp without a protective bulb, attached just above the reactor, and, to maintain homogeneity of the mixture, the system also contained a magnetic stirrer. The reactor had a cooling jacket (~12 °C). The samples were collected and centrifuged, and the residual dye concentration was analyzed in a UV-Vis spectrophotometer (Femto-800 XI, Somerville, MA, USA) at a wavelength of 431 nm. The first step of the process was focused on the discoloration of effluent synthetic using the Nb2O5 catalyst to define the best operating conditions (pH and initial catalyst concentration). Tests were performed with catalyst concentrations ranging from 0.5 to 6.0 g L−1 and at an unadjusted pH (pH s.a) of ~4.2. After identifying the optimized concentration for photocatalytic reactions, tests were performed at pH ranges from 2 to 8.4. Furthermore, adsorption and photolysis tests were also performed with the synthetic effluent.
In addition, a test using the commercial TiO2-P25 catalyst for industrial effluent was added for comparison.

Effluent

The synthetic solutions were prepared with distilled water and the liquid dye Basazol Yellow 46 L to obtain a concentration of 10 µL L−1 because this value is close to the average found for industrial effluent. The equipment used to read dye concentrations in solutions, both synthetic and industrial, was the UV-Vis spectrophotometer (Femto-800 XI) at a wavelength of 431 nm previously identified through a calibration curve.
The industrial effluent obtained comes from the packaging manufacturing process (Figure 1), with which experimental tests were carried out, among other compounds, on the same dye, Basazol Yellow 46 L. The effluent was submitted to reactions without any other prior treatment. Chemical oxygen demand (COD) was measured in a range of 1600–1800 mg L−1.

2.3. Mathematical Modeling

To obtain the mathematical models in this work, curve adjustments will be considered using the least squares method for second and third-degree functions. The choice of using the least squares method in curve fitting is due to the fact that the method is widely known and used in reaction problems, thus enabling the reproduction of the results obtained in this article by other researchers. The least squares method minimizes the squared error given by the following equation [25].
S = i = 1 m y i ( f ( x i ) 2
where S is the sum of the squared errors, y i is the actual output value, m is the total number of data points, f x i is the adjustment function to be used, and x _ i are the actual input data. f x = a 0 + a 1 x + a 2 x 2 is a quadratic polynomial function and f x = a 0 + a 1 x + a 2 x 2 + a 3 x 3 is a cubic polynomial function. The objective is to determine the parameters a 0 , a 1 , a 2 and a 3 that minimize the sum S. To verify the effectiveness of the obtained model, one can consider the quadratic correlation coefficient R 2 , or mean absolute error (MAE) [25]:
M A E = i = 1 m ( f x i y i m

3. Results and Discussion

3.1. Characterization

The results obtained for the scanning electron microscopy (SEM) and energy-dispersive X-ray spectroscopy (EDS) analyzes for the catalyst are shown in Figure 2. In the analyses obtained, it can be observed that the surface of Nb2O5 is composed of 65% niobium (Nb) and 35% oxygen. The dispersion on the surface of the sample is noted, which appears rough. Thus, it is possible to verify that the material is composed of small particles, often forming agglomerations, with a spherical tendency.
Figure 3 shows the diffractogram obtained for the photocatalyst. This analysis indicates that the sample is in an amorphous state, that is, non-crystalline, presenting broad peaks. This characteristic is often considered unfavorable for the material. According to [26], it tends to facilitate the separation and diffusion of photogenerated charge carriers, which is essential for obtaining high photocatalytic efficiency, thus avoiding electron-hole pair recombination. On the other hand, amorphous structures, in particular Nb2O5, have already shown to be excellent photocatalysts for Cr (VI) reduction [14], sulfide oxidation [27], and dye degradation [26].
Figure 4a shows the isotherm (N2 physisorption: specific area (S0), pore volume (Vp), mean pore diameter (dm), are described in the detail of Figure 4a). When comparing the Nb2O5 isotherm of the present work with the isotherm of hydrated Nb2O5 in the work of [28], it can be seen that the curves are very similar, and the authors also considered a type 4 isotherm and the material as being mesoporous. Costa et al. [29] identified a value of 111 m2 g−1 for a sample also of Nb2O5, and Nunes and Brackmann [28] identified a value of 187 m2 g−1 for hydrated niobium, the value being closest to that of the Nb2O5 studied here (183 m2 g−1). The curve and the value obtained from the experimental tests of PCZ of the Nb2O5 samples are shown in Figure 4b. The PCZ value of 6.9 was compared in previously published studies. [30] found a PCZ value close to 5. [16] found a value close to 4. This indicates that the value of 6.9 is above the values found in previous works.

3.1.1. Photocatalytic Tests Results

Synthetic Solution

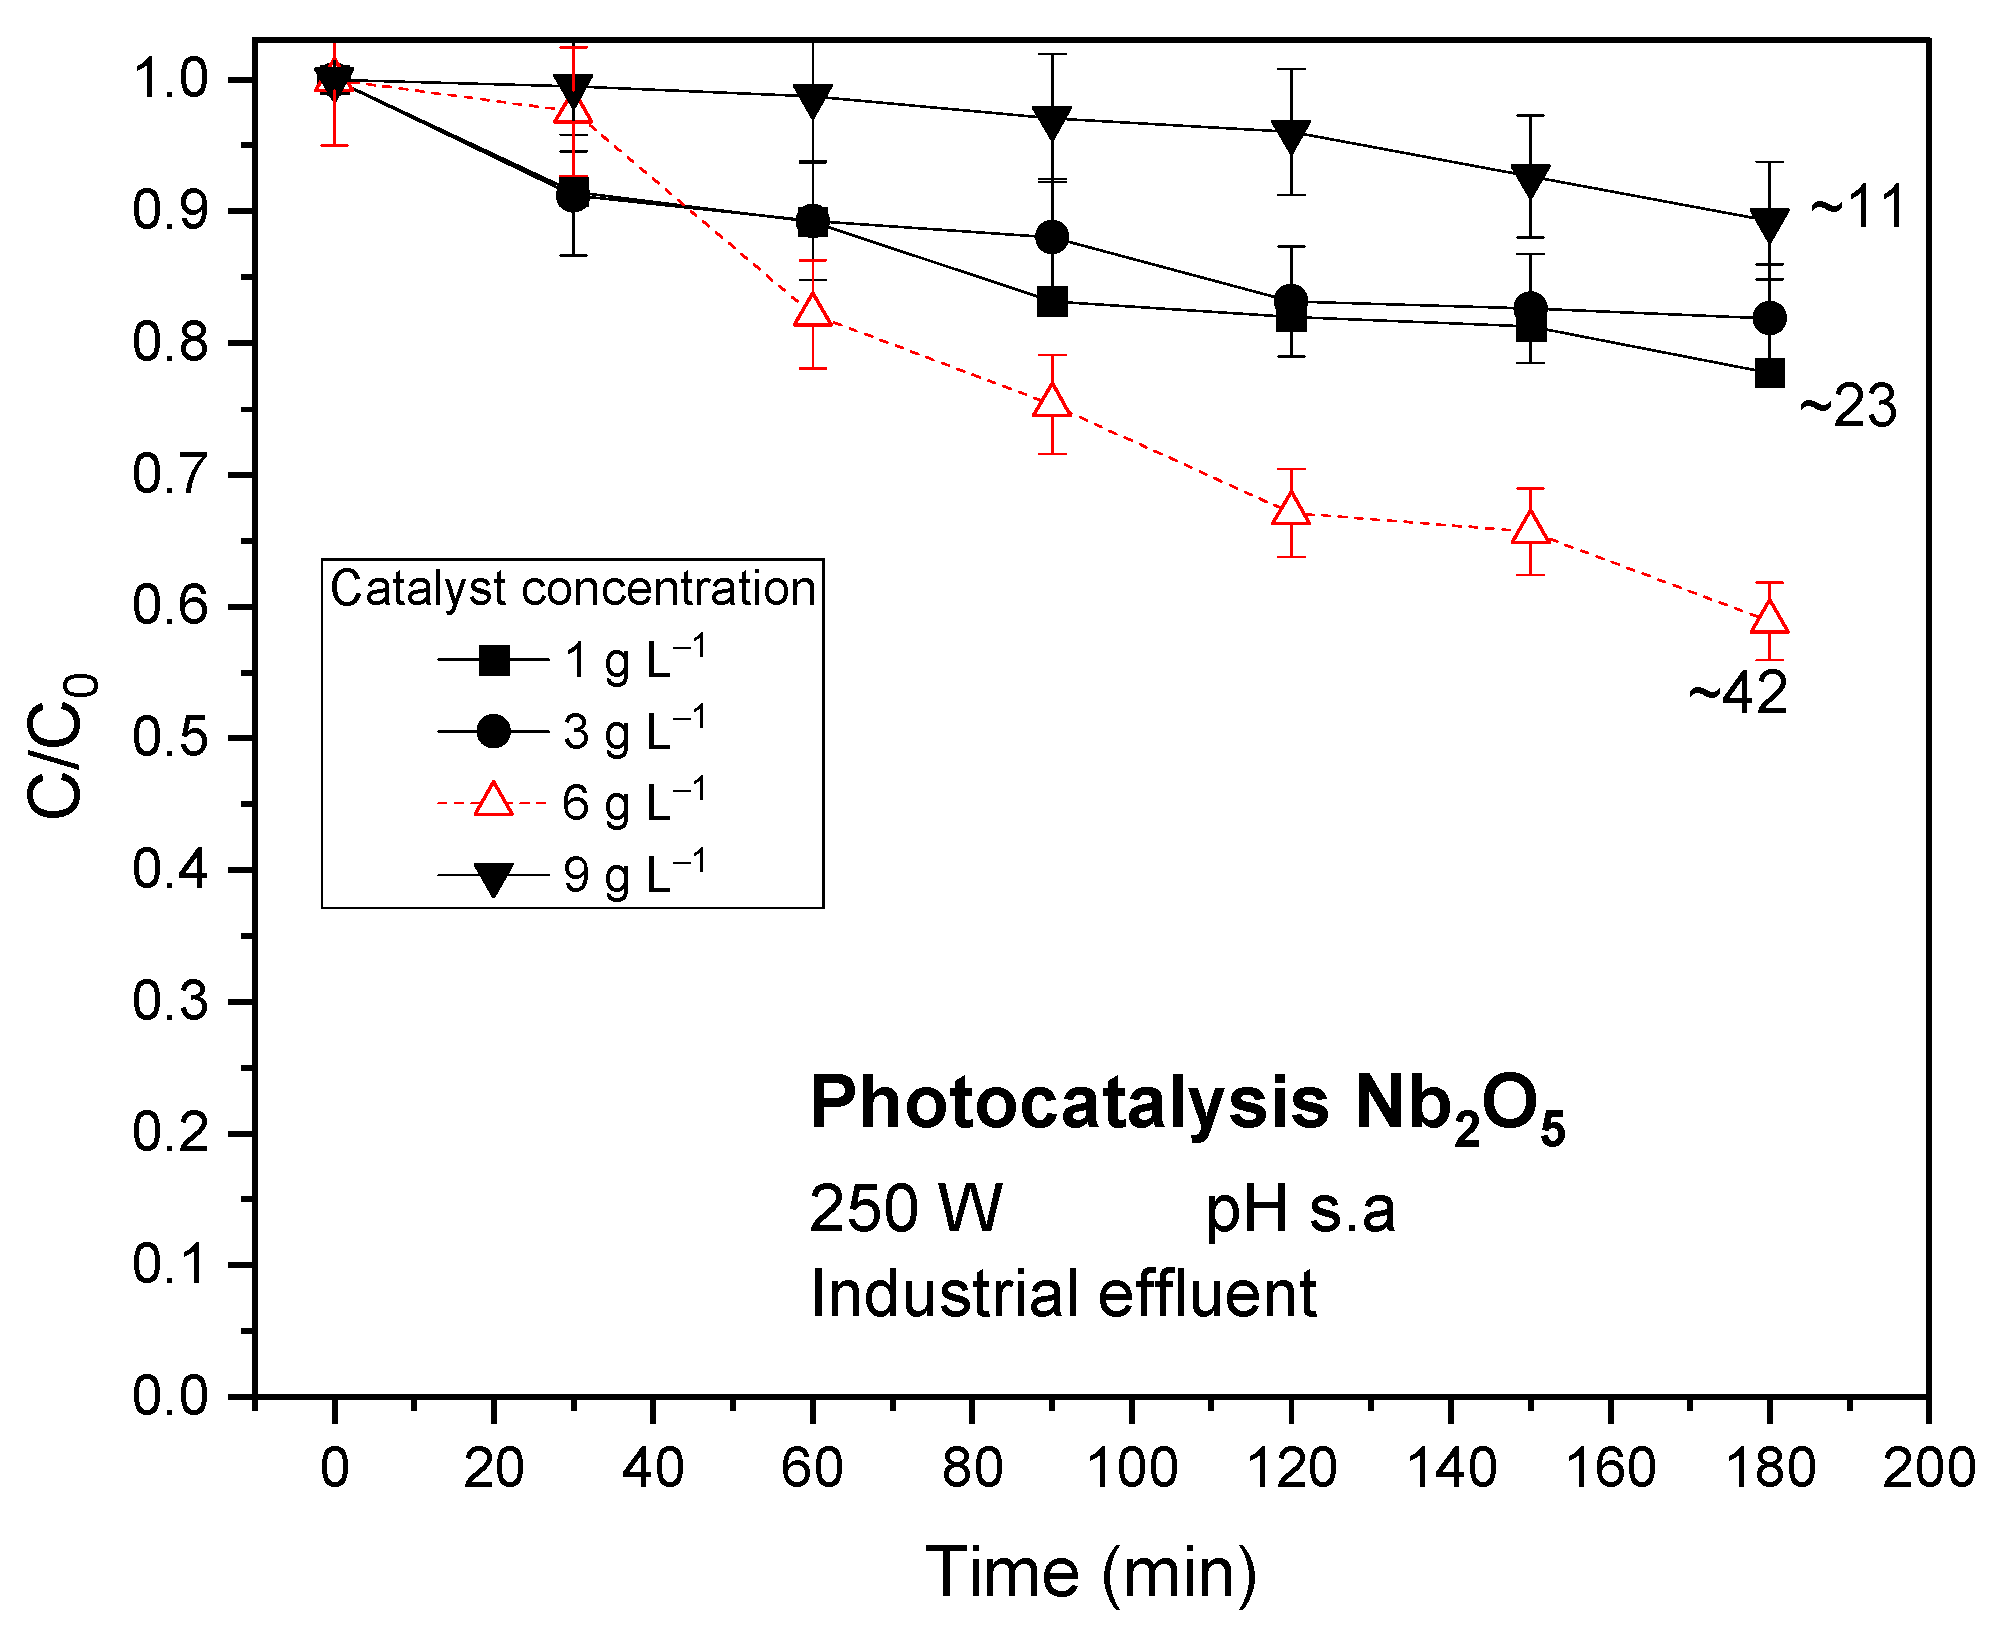
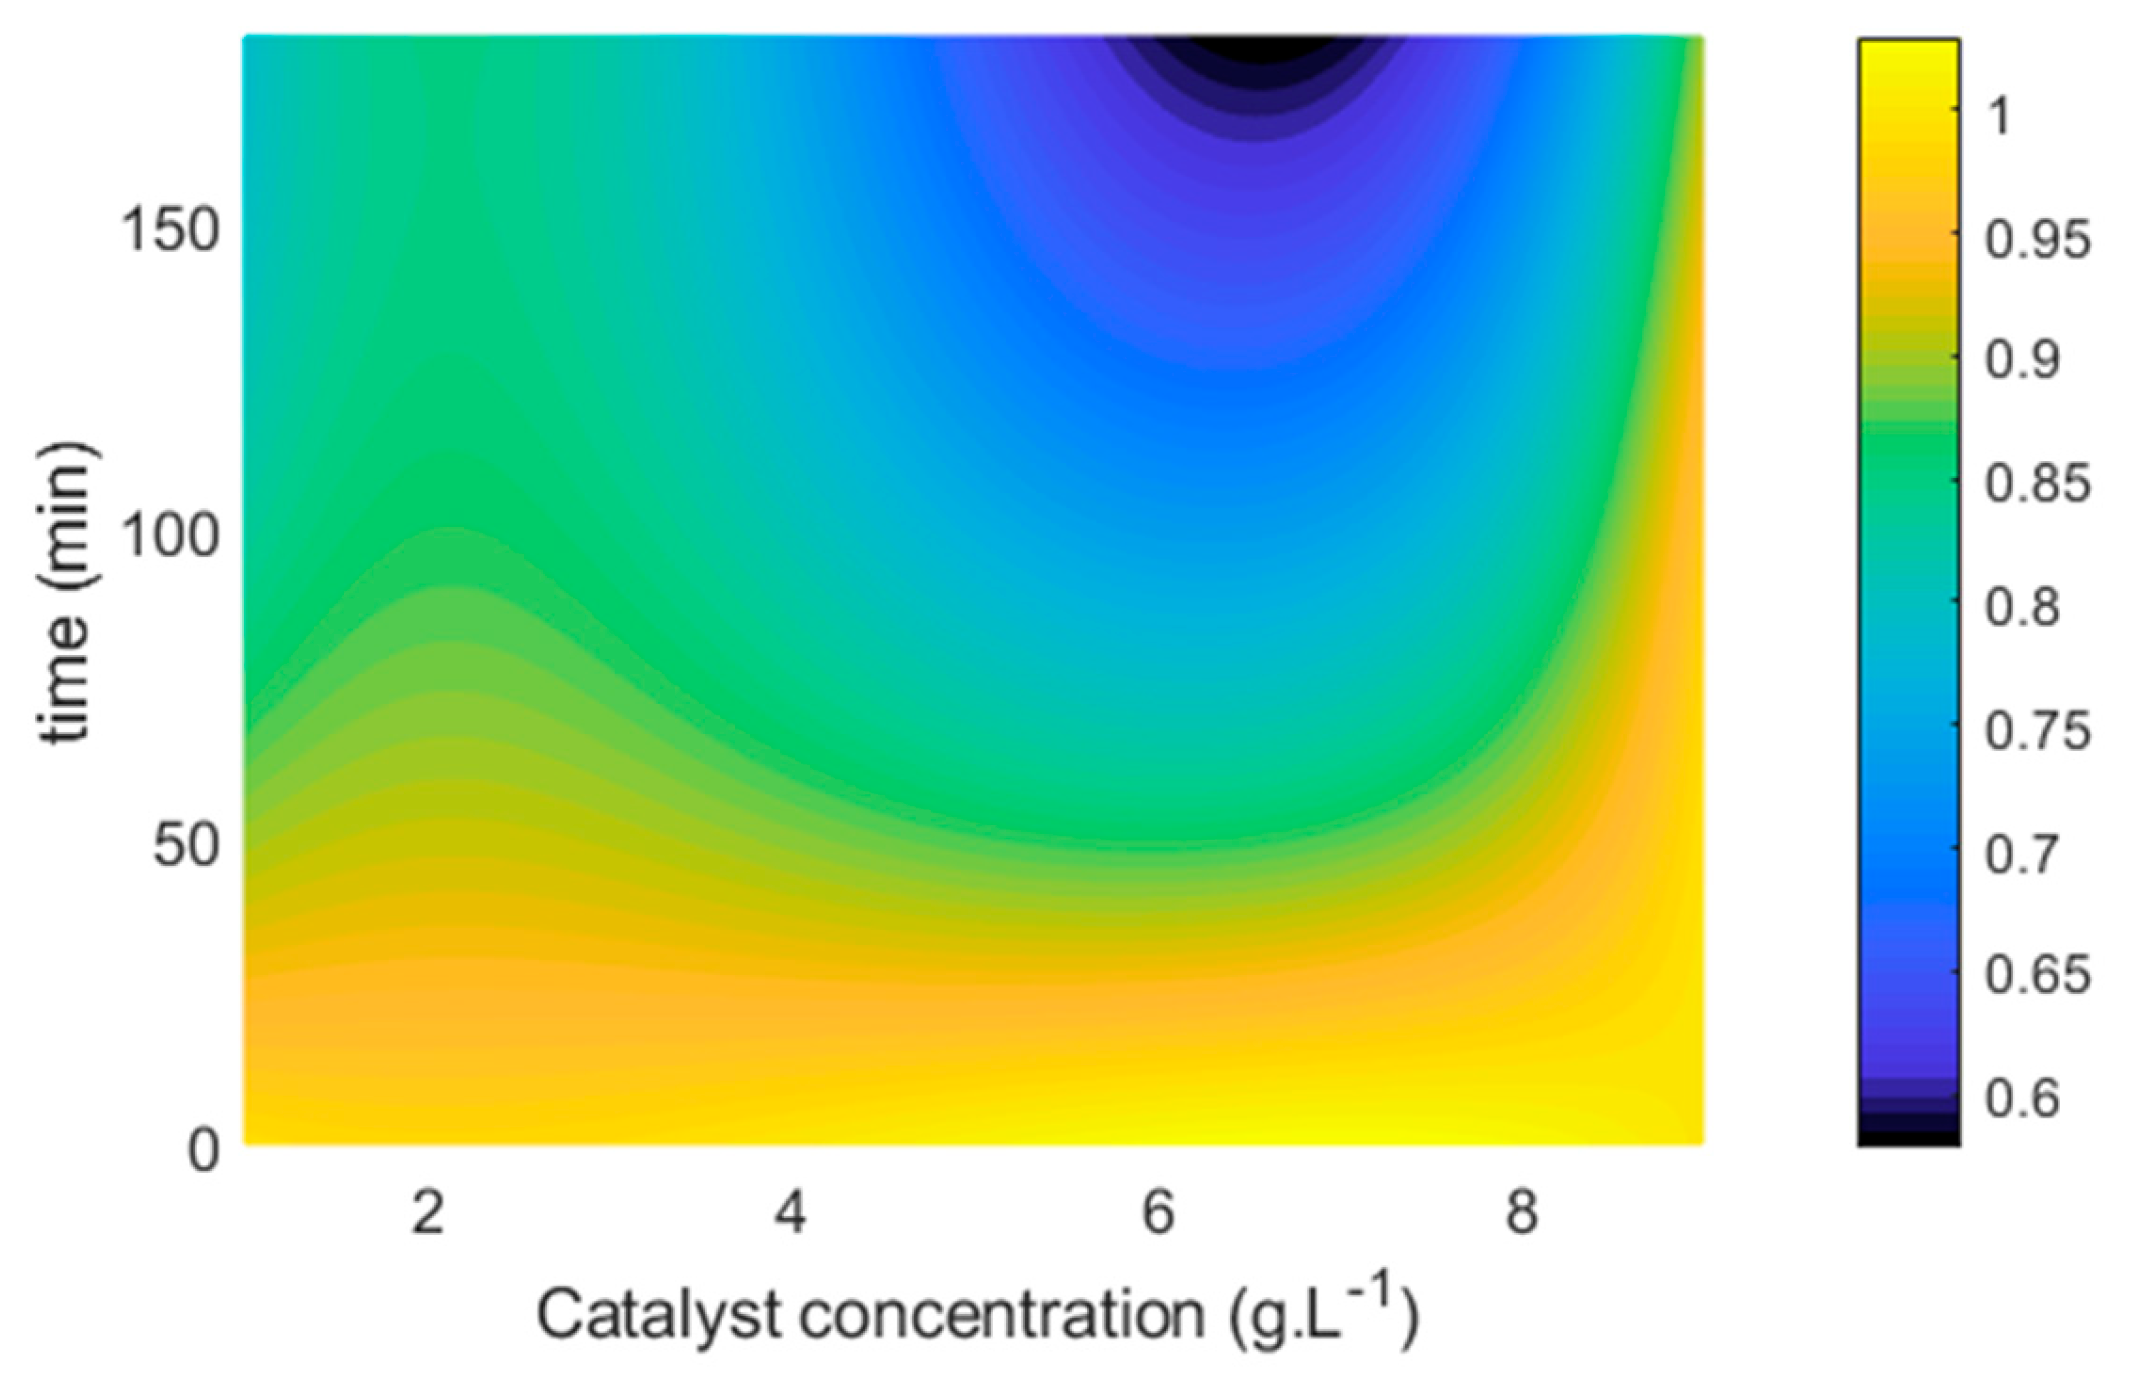
  • Figure 5 indicates the results obtained for the photocatalytic reactions to evaluate the catalyst concentration.
2.
It is possible to observe that, with the lowest catalyst concentration (0.5 g L−1), a slower kinetic curve was obtained in relation to the other concentrations evaluated for all catalysts studied. As the catalyst concentration increased from 0.5 to 1.0 g L−1, a notable increase in the reaction rate occurred, and this may be related to the greater availability of active sites and, therefore, greater formation of the electron-hole pair and greater generation of hydroxyl radical, a compound that participates in the degradation of organic pollutants such as the dye under study [31].
3.
The concentration of 1.0 g L−1 was defined as optimal for all catalysts, and, when this condition is reached, if an excess of photocatalyst is added, the efficiency of the reaction may be impaired. This most likely occurs due to a decrease in suspension homogeneity and an increase in turbidity, which hinders the passage of radiation and reduces the availability of active sites for photocatalysis [20,32,33]. For concentrations above 1 g L−1 of Nb2O5, it was clearly found that the reaction was impaired in terms of speed.
4.
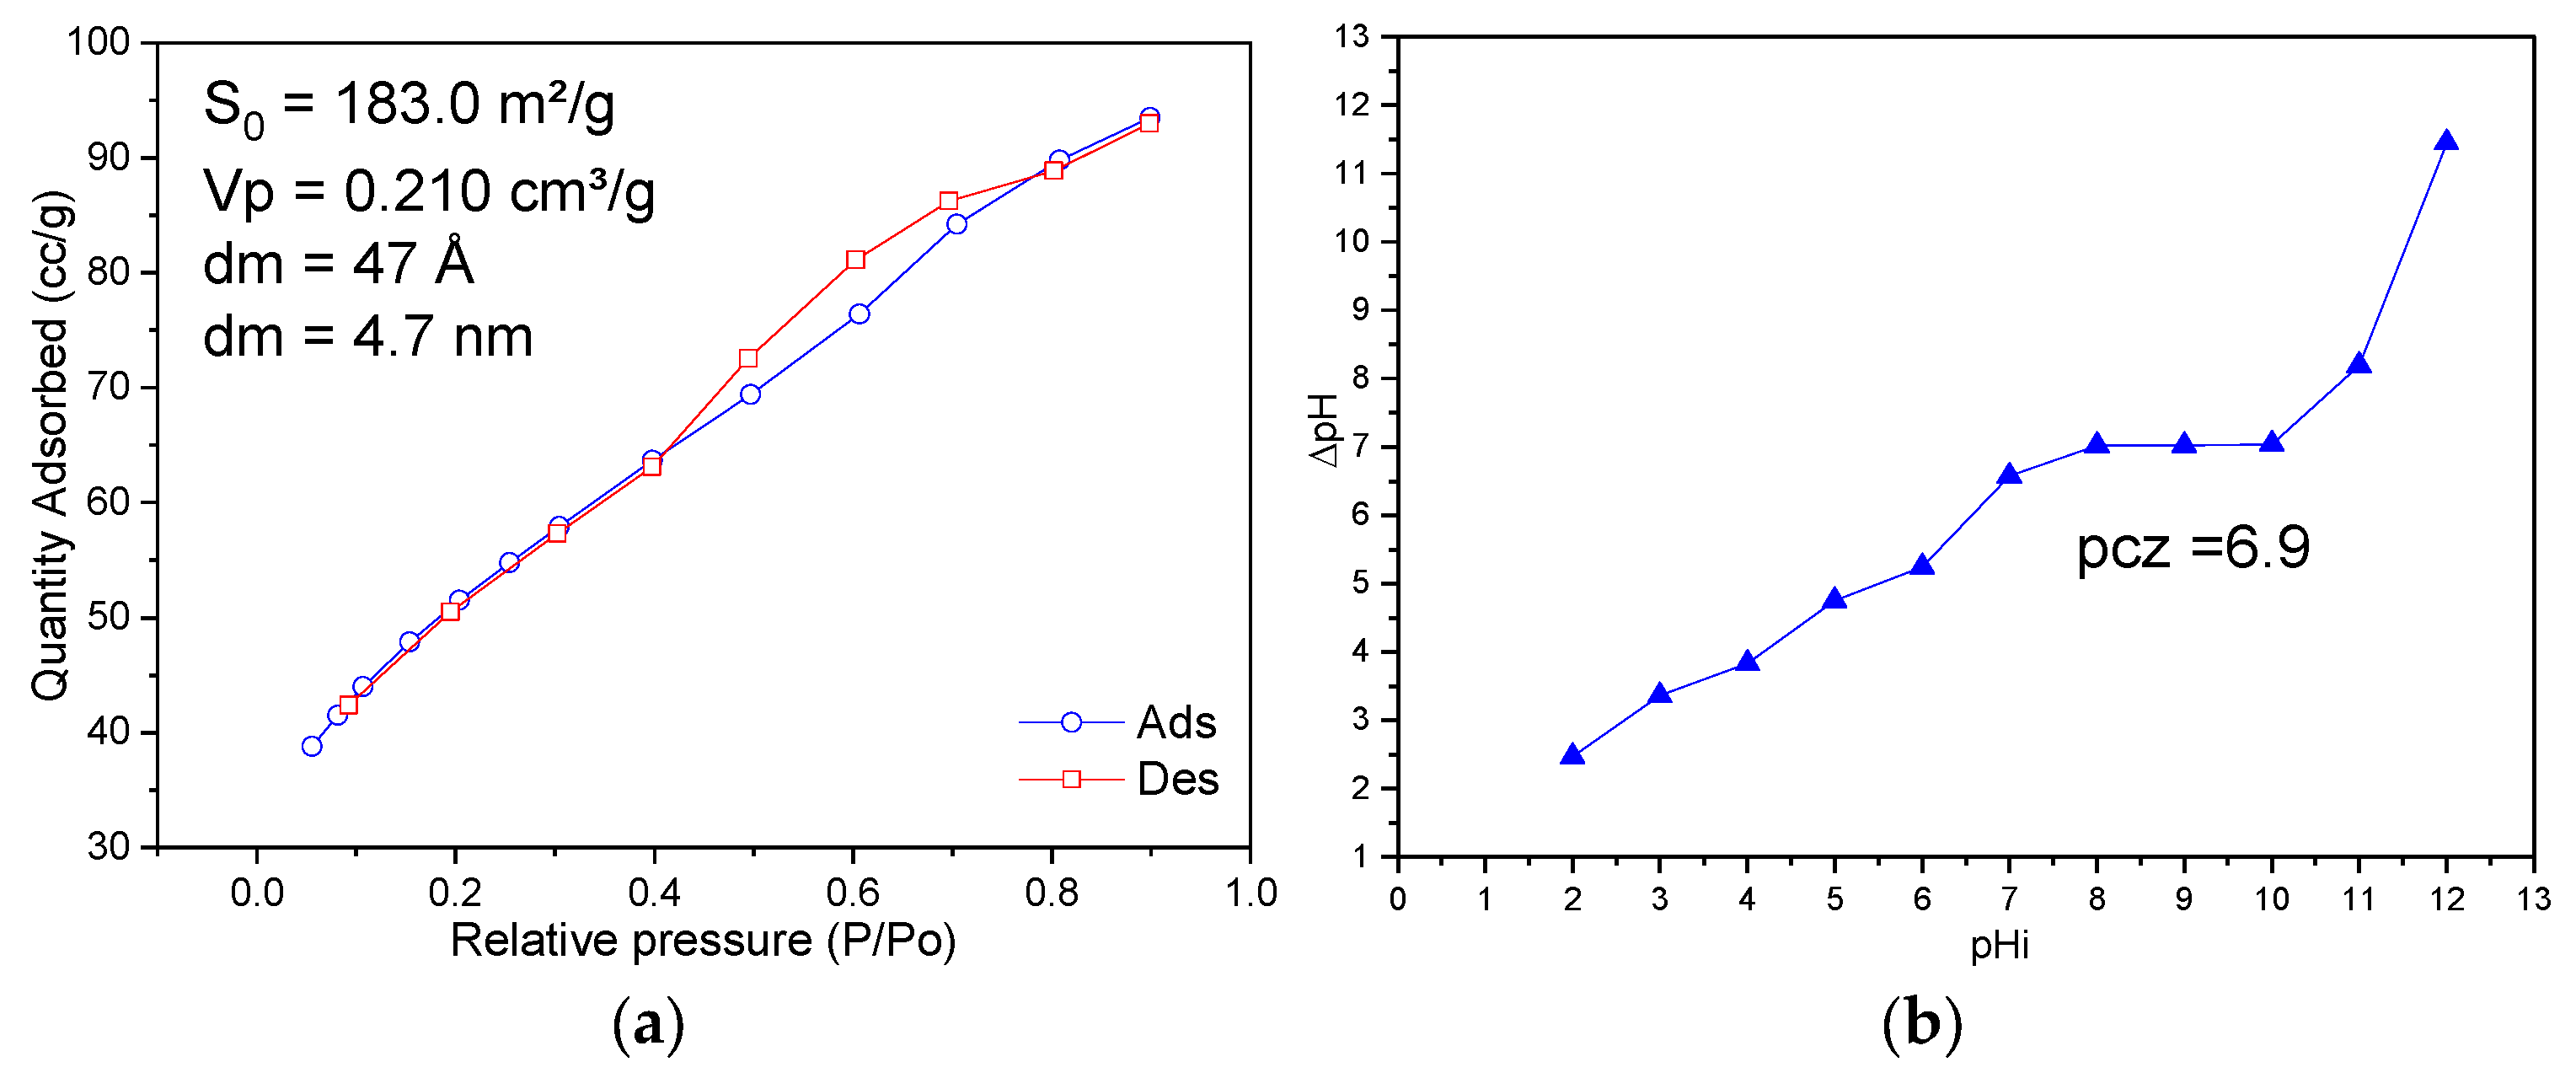
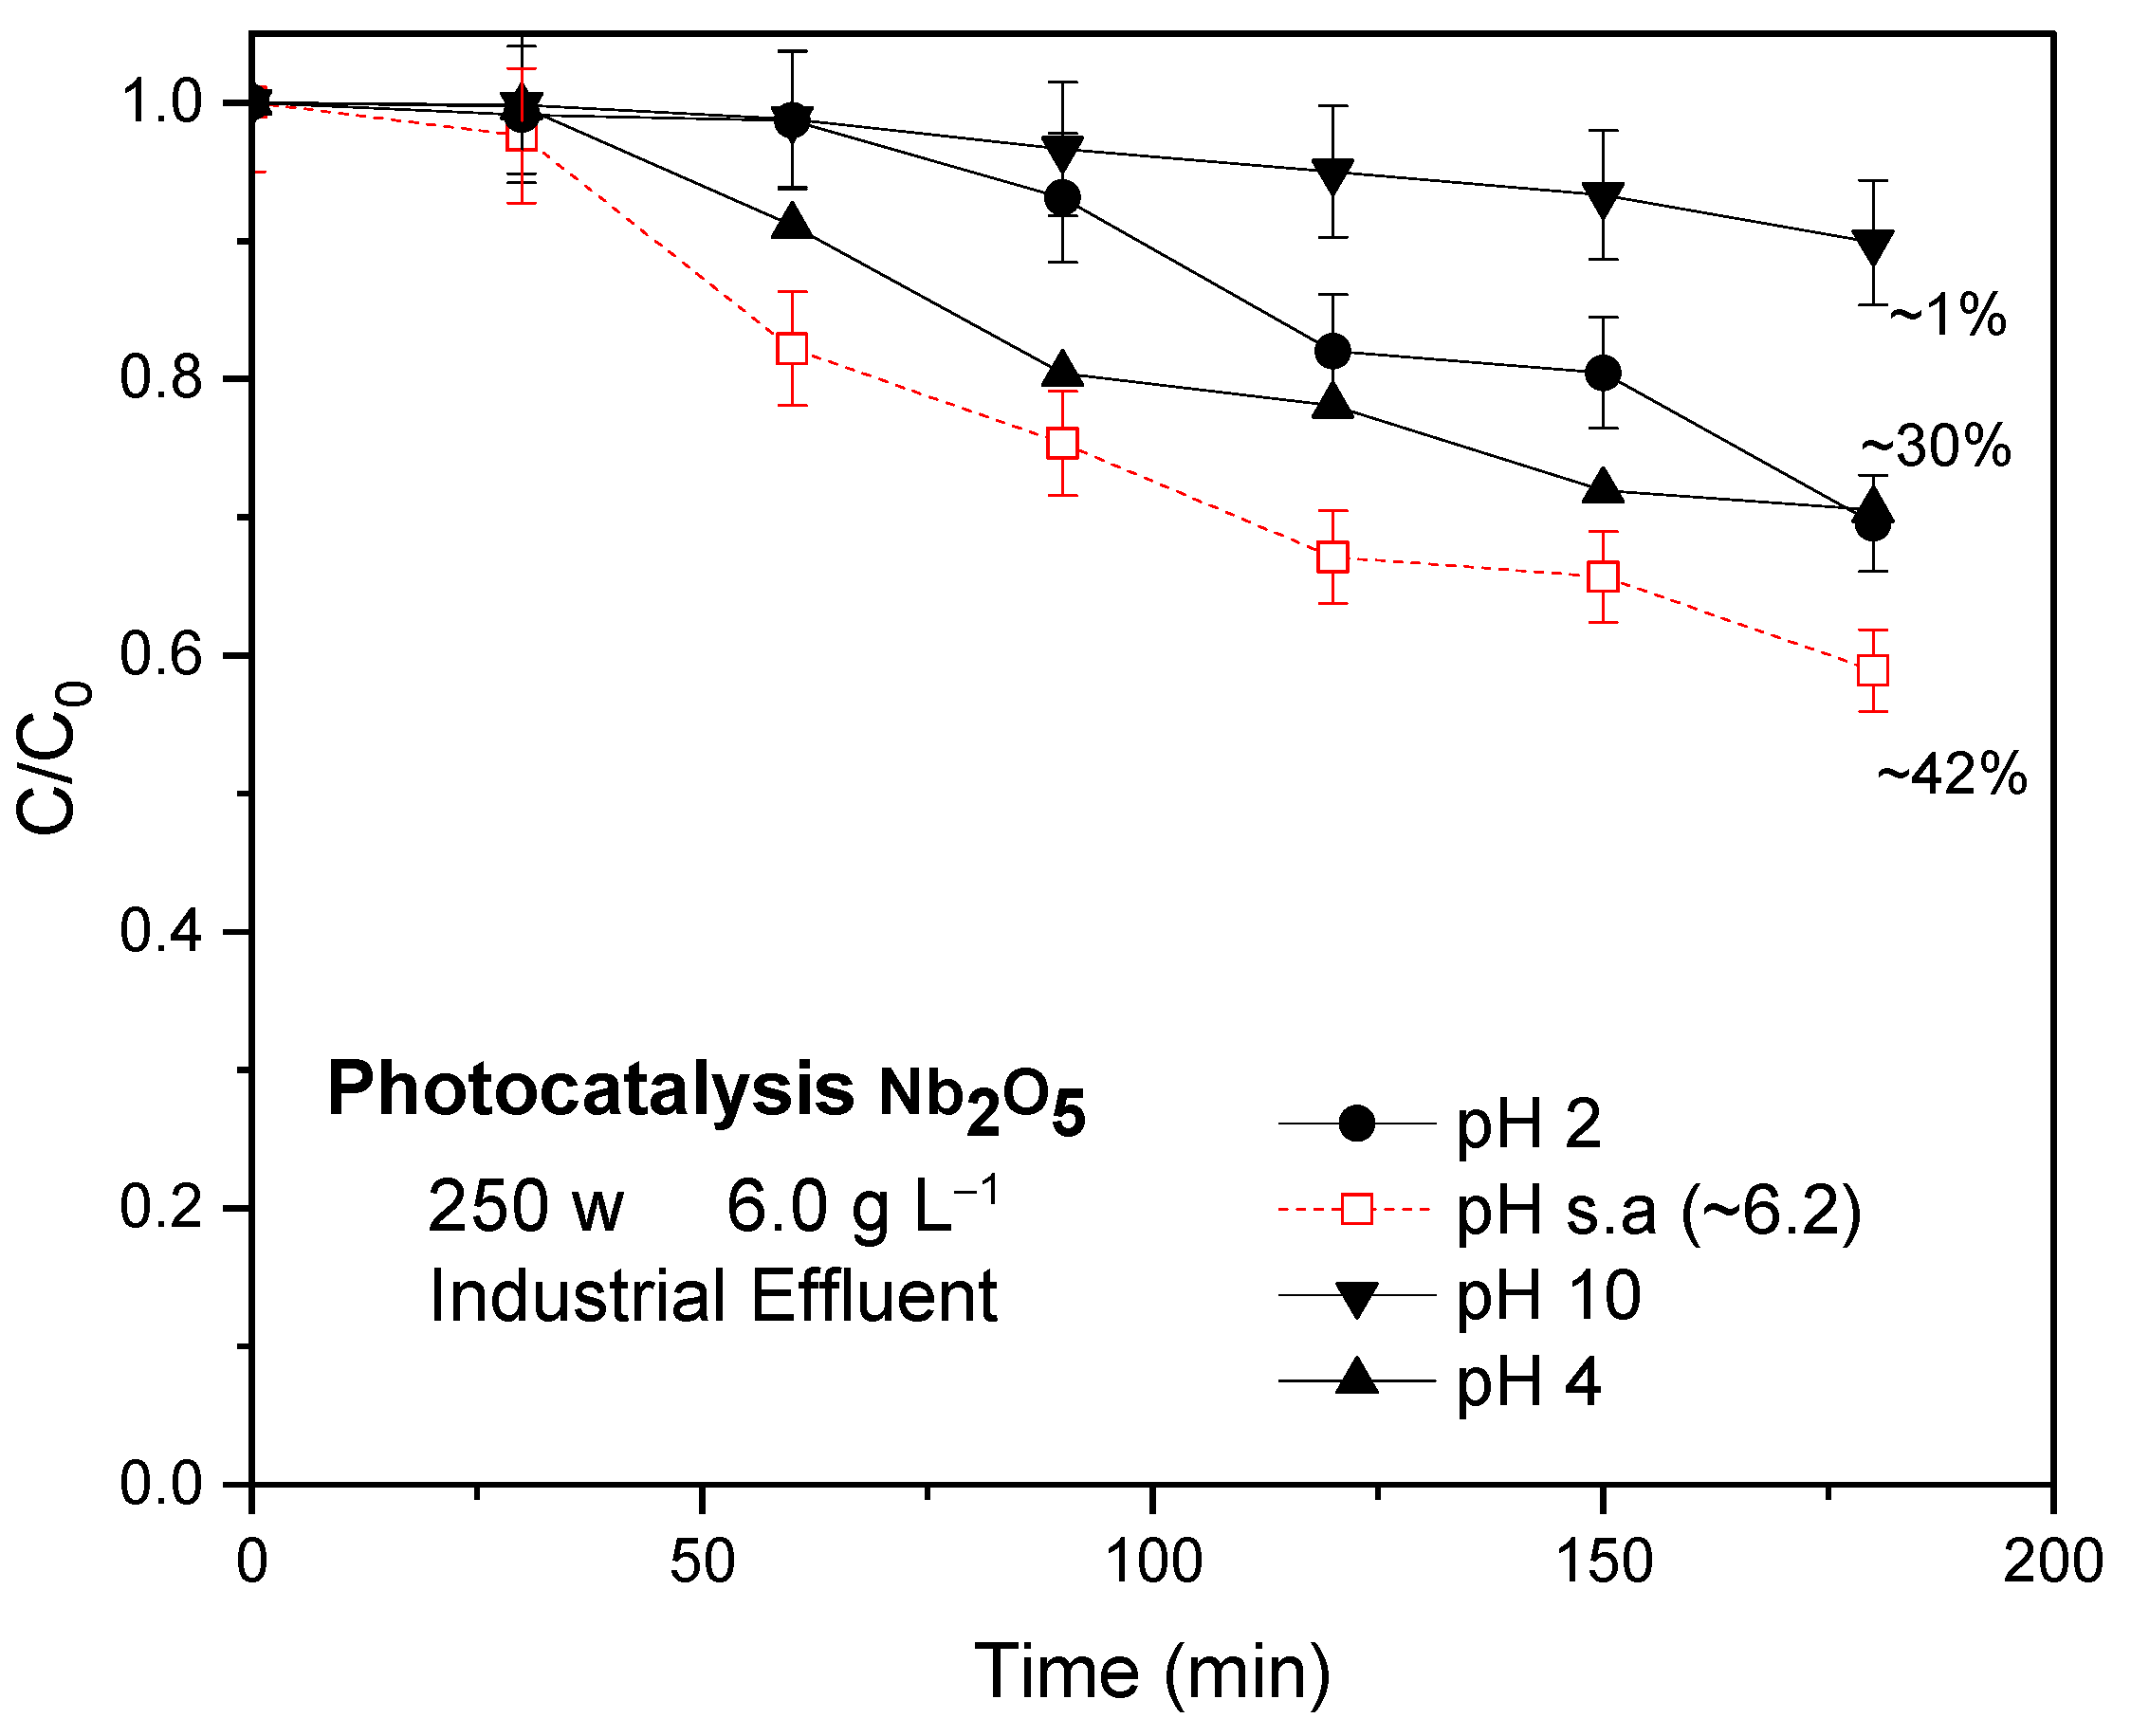
The tests to verify the influence of pH are shown in Figure 6. It can be seen that the unadjusted pH (natural pH of the synthetic solution itself, 4.2) was determined as the most suitable regardless of which catalyst was used. It can be seen that any variation in pH, whether to a more acidic or basic medium, affected the reaction rate, which also leads to considering the unadjusted pH as the most advantageous for the development of subsequent reactions. A change in the pH value can cause changes in the surface properties of the catalytic materials as well as in the surface properties of the organic pollutant, thus modifying the behavior of the photocatalytic reactions [14]. The dye studied here as a pollutant is, as previously mentioned, classified as a basic or cationic dye [34]. Cationic dyes are easily adsorbed in solutions whose reaction medium pH is basic because the surface of the adsorbent/catalyst will be negatively charged and consequently will attract the cationic dye, which has a positive charge [35]. However, if only this phenomenon were involved during the reactions, regardless of the catalyst, the behavior would be the same, because it is also worth remembering the materials characterizations, in particular, the analysis of the point of zero charge in which a value of 6.9 was obtained.
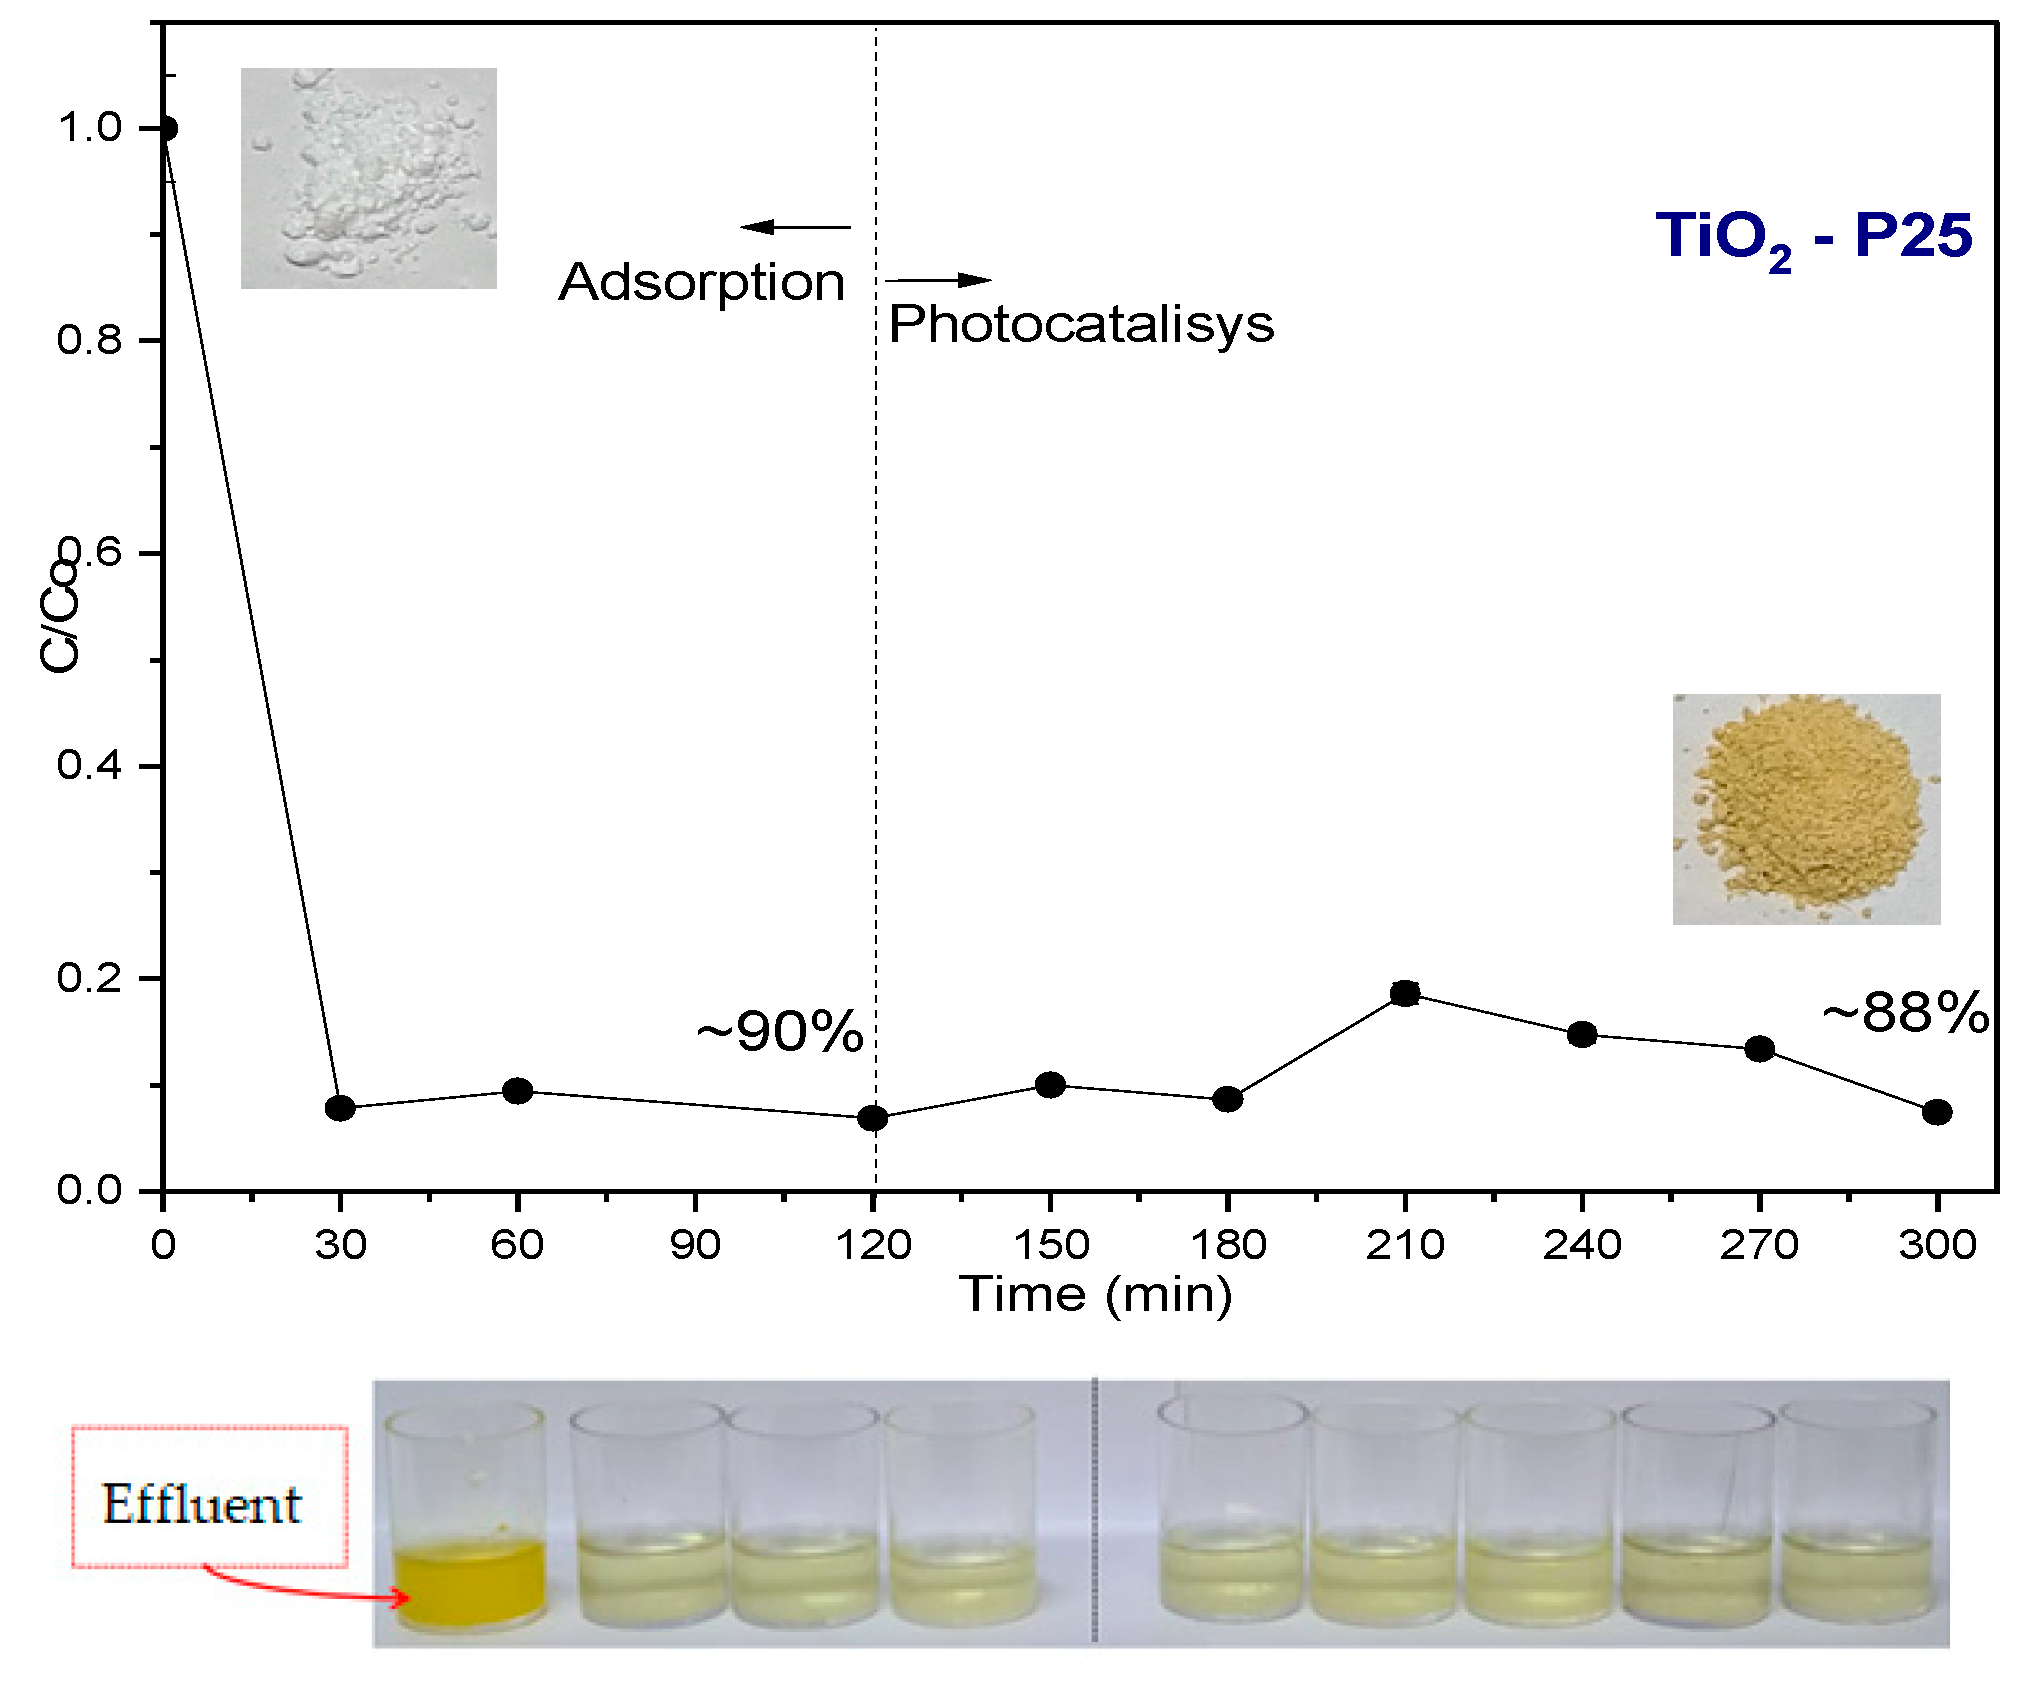
To estimate discoloration, a third-degree polynomial adjustment will be considered, using the least squares method, according to Equation (3).
C C 0 ( t , c ) = a 0 + a 1 t + a 2 t 2 + a 3 t 3
where a 0 , a 1 ,   a 2 and a 3 depend on the variation of the concentration rate and will be estimated by a third-degree polynomial adjustment using the least squares method, according to Equation (4). For this case, the following functions are obtained:
a 0 c = 1.12472341991354 0.245550931457612 c + 0.0969448073593845 c 2 0.00996086724386950 c 3
a 1 c = 0.0388875097883903 0.105434147883658 c + 0.0425695126984375 c 2 0.00441541164021432 c 3
a 2 ( c ) = 0.000593626604136996 + 0.00134459610109105 c 0.000542539905002722 c 2 + 5.63971276254949 ( 10 5 ) c 3
a 3 ( c ) = 1.61424794238690 10 6 1.70922890946511 10 6 c + 3.75892661179716 10 7 c 2 2.34014060356665 ( 10 8 ) c 3
Substituting (4), (5), (6), and (7) in (3), we obtain the mathematical model for adjusting the dye reduction according to the variation of time (t) and niobium concentration in the catalyst. A correction coefficient of R 2 0.97 and mean absolute error M A E < 0.043 are obtained. Figure 7 shows the variation of the dye reduction for t = 0 : 180 and niobium concentration c = 0.5 : 6 .
As we can see in Figure 7, we obtain the lowest levels of dyes in a catalyst concentration range between 1 and 2.5 gL−1 and a time variation between 40 and 100 min. On the other hand, for catalyst concentrations between 4 and 5.5 and time between 5 and 80 min, a lower efficiency in the process is observed.
To estimate the pH, a third-degree polynomial adjustment will be considered, using the least squares method, according to Equation (8).
C C 0 ( t , p H ) = a 0 + a 1 t + a 2 t 2 + a 3 t 3
where a 0 , a 1 ,   a 2 and a 3 depend on the variation of the concentration rate and will be estimated by a third-degree polynomial adjustment using the least squares method, according to Equation (9).
a 0 , 1 , 2 ( p H ) = b 0 + b p H + b 2 p H 2 + b 3 p H 3
For this case, the following functions are obtained:
a 0 p H = 1.19447464494516 0.149568578041779 p H + 0.0301836015384696 p H 2                                                       0.00178934401976468 p H 3
a 1 p H = 0.0929873352972423 0.0764231323418003 p H + 0.0149002290530665 p H 2                                                       0.000853616739482805 p H 3
a 2 ( p H ) = 0.00110432167223417 + 0.000861270205024907 p H 0.000168050972047833 p H 2                                                         + 9.66732369114991 ( 10 6 ) p H 3
a 3 ( p H ) = 3.26113516581755 10 6 2.52003961944099 10 6 p H + 4.89576625715775 10 7 p H 2                                                       2.80118675108684 ( 10 8 ) p H 3
Substituting (10)–(13) in (9), we obtain the mathematical model of pH according to the variation of time (t) and catalyst concentration (c).
A correction coefficient of R 2 0.97 and mean absolute error M A E < 0.029 are obtained. Figure 8 shows the variation of the dye reduction for t = 0 : 180 and p H = 2 : 8 .
As we can see in Figure 8, we observe that pHs between 3.5 and 4.5 are the most suitable for discoloration, with an exposure time > 50 min.

Industrial Effluent

A real effluent has interferers and a more complex degradation. It can be seen that the tests using industrial effluent showed a smaller and slower discoloration compared to the tests with artificial effluent (Figure 9). Furthermore, another point observed, independent of the material used, is the increase in the concentration considered adequate of catalyst from 1 g L−1 in the synthetic effluent to 6 g L−1 for the industrial effluent. This increase in the catalyst concentration may be related to the effluent composition. The synthetic effluent had only water and dye, while the industrial effluent, in addition to water and dye, also had the presence of additives added during production, possible traces of dyes from other batches, and a high organic load.
In the analysis of the pH influence (Figure 10), it was observed that the pH adjustment to both acid and base discoloration negatively influenced the industrial effluent, and the pH without adjustments was more stable and, consequently, was adopted as the most adequate for the reactions. This same behavior was observed for the synthetic solution. Probably, the adjustments made with NaOH and HCl modified the properties of the Nb2O5 surface, which disfavored the discoloration of the dye in both synthetic and industrial effluents. Ref. [36] report that the pH of the reaction medium can modify the size of the surface aggregates, the position of the valence and conduction bands, and thus favor or not the photoreaction.
To estimate discoloration, a second-degree polynomial adjustment will be considered, using the least squares method, according to Equation (14).
C C 0 ( t , c ) = a 0 + a 1 t + a 2 t 2
where a 0 , a 1 , and a 2 depend on the variation of the concentration rate and will be estimated by a third-degree polynomial adjustment using the least squares method, according to Equation (15).
a 0 , 1 , 2 ( c ) = b 0 + b c + b 2 c 2 + b 3 c 3
a 0 = 1.01487967857142 0.0343994067460112 c + 0.0107881521164053 c 2 + 0.000796757275131964 c 3
a 1 = 0.00360477589285733 + 0.00207777772817473 c + 0.000657217162698450 c 2                                                       + 5.23819940476212 ( 10 5 ) c 3
a 2 = 7.47012896825468 ( 10 6 ) 2.67453648589154 ( 10 5 ) c + 8.88862066431717 ( 10 7 ) c 2                                                     8.07508450911355 ( 10 8 ) c 3
Substituting (16)–(18) in (14), we obtain the mathematical model for adjusting the dye reduction according to the variation of time (t) and catalyst concentration.
For this model, a correction coefficient of R 2 0.97 was obtained, and mean absolute error M A E < 0.0114 . Figure 11 shows the variation of the dye reduction for t = 0 : 180 and niobium concentration c = 1 : 9 .
As we can see in Figure 11, we obtain the best results with catalyst concentrations between 6 and 7 gL−1 and time > 170 min.
To estimate pH, a second-degree polynomial adjustment will also be considered, using the least squares method, according to Equation (19), and the parameters a 0 , a 1 and a 2 will also be obtained using a third-degree polynomial adjustment using the least squares method, according to Equation (20).
p H ( t , p H ) = a 0 + a 1 t + a 2 t 2
a 0 , 1 , 2 ( p H ) = b 0 + b p H + b 2 p H 2 + b 3 p H 3
Given a 0 , a 1 and a 2 , the following functions are obtained:
a 0 p H = 0.948465255427621 + 0.0398387868547447 pH 0.00605396379544350 p H 2   + 0.000260169922233959   p H 3
a 1 p H = 0 . 00298287065607627 0.00170299005766492   pH + 5.29122264534409 ( 10 5 ) p H 2 + 8.63643822761378 ( 10 6 ) p H 3
a 2 p H = 3.29177170016995 10 5 0.00170299005766492 p H + 5.29122264534409 10 5 p H 2                                                         + 6.55846679887866 ( 10 8 ) p H 3
Substituting (21)–(23) in (19), we obtain the mathematical model of pH according to the variation of time (t) and pH variation. In the case of pH, the model obtained has a correction coefficient R 2 0.97 and mean absolute error MAE < 0.0025. Figure 12 shows the pH variation for t = 0 : 180 and niobium concentration p H = 2 : 10 .
It is estimated that the best results will be found using pH in the range of 6–8 and a time > 170 min.
Industrial effluent, especially in a closed system, will rarely have the same composition and color for many days. Effluents were collected over a period from the same point in the packaging industry. During this period, industrial changes and alterations that varied the quality of the effluent were observed (Figure 13), such as addition/removal/change of dye during the processes, change and/or alteration in the concentration of additives, factory shutdown and change of water in the entire system, and time reuse of water in the system. Such events can make it difficult to conclude the results and identify a pattern.
With optimized conditions, photocatalytic tests were carried out. Some of these tests can be observed in Figure 14. It was possible to verify periods in which there was a greater photocatalytic efficiency for the discoloration of industrial effluent.
The unstable behavior of the reactions is directly related to variations in the composition of the industrial effluent. Previous studies [37,38] have shown that the decolorization of synthetic effluents containing dyes is more efficient than that of real industrial effluents. Both authors attributed this behavior to the possible presence of interfering ions and organic load introduced during the product preparation process, which, in the present study, corresponds to molded pulp packaging.
The concentration fluctuations observed in Figure 14 can be attributed to desorption phenomena, secondary reactions, or variations in intermediate byproducts that affect absorbance readings.
Figure 15 presents the results obtained with TiO2-P25 for the industrial effluent.
For TiO2-P25, the adsorption process was very important for the discoloration of the effluent, 90% discoloration, which was not observed with Nb2O5. In this sense, it was observed that at the end of the process the catalyst had its color modified (detail in Figure 15). This change is due to the adsorption of the dye on the catalytic surface. In photocatalysis, this phenomenon has also been identified; in the study by Josué et al. (2020) in the photoreduction of Chromium (VI) to Chromium (III), the authors found that after the reaction, the Nb2O5 catalyst presented a yellow coloration, indicating that Chromium (III) was adsorbed on the surface of the material [14]. However, Nb2O5, in this work, did not present significant adsorption results for the dye, and the commercial catalyst had a higher efficiency with this effluent, in particular.

4. Conclusions

The results indicated that niobium was efficient in the synthetic effluent clarifying, obtaining approximately 98% color removal. The optimized conditions to obtain this result were 1 g L−1 and solution pH (4.2). On the other hand, for the industrial effluent, a maximum of 42% removal was obtained with a 6-fold increase in catalyst concentration (6 g L−1) and effluent pH (6.2), without adjustments. This difference is due to the interferents from the industrial process, such as additives and paper waste. It was also observed that the effluent obtained at different times showed a change in the catalyst activity. Therefore, if the process is implemented, there is a need for greater control in changing the parameters.

Author Contributions

Conceptualization, L.N.B.d.A., G.G.L. and O.A.A.d.S.; methodology, L.N.B.d.A. and A.M.T.; validation, G.Y.E.; formal analysis, G.G.L.; investigation, L.N.B.d.A. and A.M.T.; writing—original draft preparation, G.G.L., A.M.T. and G.Y.E., writing—review and editing. All authors have read and agreed to the published version of the manuscript.

Funding

This research received external funding (Fundação Araucária, process: 3793-1 13873-8).

Institutional Review Board Statement

Not applicable.

Informed Consent Statement

Not applicable.

Data Availability Statement

Data are contained within the article.

Acknowledgments

The authors acknowledge the CAPES, FA, and CNPq, both Brazilian research funding agencies.

Conflicts of Interest

The authors declare no conflicts of interest.

References

  1. Martínez, K.Y.P.; Toso, E.A.V.; Morabito, R. Production Planning in the Molded Pulp Packaging Industry. Comput. Ind. Eng. 2016, 98, 554–566. [Google Scholar] [CrossRef]
  2. Jamil, A.; Bokhari, T.H.; Javed, T.; Mustafa, R.; Sajid, M.; Noreen, S.; Zuber, M.; Nazir, A.; Iqbal, M.; Jilani, M.I. Photocatalytic Degradation of Disperse Dye Violet-26 Using TiO2 and ZnO Nanomaterials and Process Variable Optimization. J. Mater. Res. Technol. 2020, 9, 1119–1128. [Google Scholar] [CrossRef]
  3. Periyasamy, A.P. Recent Advances in the Remediation of Textile-Dye-Containing Wastewater: Prioritizing Human Health and Sustainable Wastewater Treatment. Sustainability 2024, 16, 495. [Google Scholar] [CrossRef]
  4. Mcyotto, F.; Wei, Q.; Macharia, D.K.; Huang, M.; Shen, C.; Chow, C.W.K. Effect of Dye Structure on Color Removal Efficiency by Coagulation. Chem. Eng. J. 2021, 405, 126674. [Google Scholar] [CrossRef]
  5. Shabil Sha, M.; Anwar, H.; Musthafa, F.N.; Al-Lohedan, H.; Alfarwati, S.; Rajabathar, J.R.; Khalid Alahmad, J.; Cabibihan, J.-J.; Karnan, M.; Kumar Sadasivuni, K. Photocatalytic Degradation of Organic Dyes Using Reduced Graphene Oxide (rGO). Sci. Rep. 2024, 14, 3608. [Google Scholar] [CrossRef]
  6. Braslavsky, S.E.; Braun, A.M.; Cassano, A.E.; Emeline, A.V.; Litter, M.I.; Palmisano, L.; Parmon, V.N.; Serpone, N. Glossary of Terms Used in Photocatalysis and Radiation Catalysis (IUPAC Recommendations 2011). Pure Appl. Chem. 2011, 83, 931–1014. [Google Scholar] [CrossRef]
  7. Herrmann, J.-M. Photocatalysis Fundamentals Revisited to Avoid Several Misconceptions. Appl. Catal. B Environ. 2010, 99, 461–468. [Google Scholar] [CrossRef]
  8. Oliveira, I.E.; Silva, R.M.; Girão, A.V.; Faria, J.L.; Silva, C.G.; Silva, R.F. Facile Preparation of ZnO/CNTs Nanocomposites via ALD for Photocatalysis Applications. Eur. J. Inorg. Chem. 2020, 2020, 1743–1750. [Google Scholar] [CrossRef]
  9. Ziolli, R.L.; Jardim, W.F. Mecanismo de fotodegradação de compostos orgânicos catalisada por TiO2. Quím. Nova 1998, 21, 319–325. [Google Scholar] [CrossRef]
  10. Silva, M.K.; Marques, R.G.; Machado, N.R.C.F.; Santos, O.A.A. Evaluation of Nb2O5 and Ag/Nb2O5 in the Photocatalytic Degradation of Dyes from Textile Industries. Braz. J. Chem. Eng. 2002, 19, 359–363. [Google Scholar] [CrossRef]
  11. Zarrin, S.; Heshmatpour, F. Photocatalytic Activity of TiO2/Nb2O5/PANI and TiO2/Nb2O5/RGO as New Nanocomposites for Degradation of Organic Pollutants. J. Hazard. Mater. 2018, 351, 147–159. [Google Scholar] [CrossRef] [PubMed]
  12. Abreu, E.; Fidelis, M.Z.; Fuziki, M.E.; Malikoski, R.M.; Mastsubara, M.C.; Imada, R.E.; Diaz De Tuesta, J.L.; Gomes, H.T.; Anziliero, M.D.; Baldykowski, B.; et al. Degradation of Emerging Contaminants: Effect of Thermal Treatment on Nb2O5 as Photocatalyst. J. Photochem. Photobiol. Chem. 2021, 419, 113484. [Google Scholar] [CrossRef]
  13. Almeida, L.N.; Lenzi, G.G.; Pietrobelli, J.M.T.A.; Santos, O.A. Performance Evaluation of Catalysts of ZnO in Photocatalytic Degradation of Caffeine Solution. Chem. Eng. Trans. 2017, 57, 667–672. [Google Scholar] [CrossRef]
  14. Josué, T.G.; Almeida, L.N.B.; Lopes, M.F.; Santos, O.A.A.; Lenzi, G.G. Cr (VI) Reduction by Photocatalyic Process: Nb2O5 an Alternative Catalyst. J. Environ. Manag. 2020, 268, 110711. [Google Scholar] [CrossRef]
  15. Rani, S.; Sanghi, S.; Agarwal, A.; Khasa, S. Influence of Nb2O5 on the optical band gap and electrical conductivity of Nb2O5·BaO·B2O3. IOP Conf. Ser. Mater. Sci. Eng. 2009, 2, 2–6. [Google Scholar]
  16. Boruah, B.D. Zinc Oxide Ultraviolet Photodetectors: Rapid Progress from Conventional to Self-Powered Photodetectors. Nanoscale Adv. 2019, 1, 2059–2085. [Google Scholar] [CrossRef]
  17. Santos, A.J.; Batista, L.M.B.; Martínez-Huitle, C.A.; Alves, A.P.D.M.; Garcia-Segura, S. Niobium Oxide Catalysts as Emerging Material for Textile Wastewater Reuse: Photocatalytic Decolorization of Azo Dyes. Catalysts 2019, 9, 1070. [Google Scholar] [CrossRef]
  18. Teixeira, C.P.A.B.; Jardim, W.F. Influence of Several Factors on the Heterogeneous Photocatalytic Degradation of Phenol. Rev. Quím. 2004, 18, 3–10. [Google Scholar]
  19. Loddo, V.; Bellardita, M.; Camera-Roda, G.; Parrino, F.; Palmisano, L. Heterogeneous Photocatalysis. In Current Trends and Future Developments on (Bio-) Membranes; Elsevier: Amsterdam, The Netherlands, 2018; pp. 1–43. ISBN 978-0-12-813549-5. [Google Scholar]
  20. Wetchakun, K.; Wetchakun, N.; Sakulsermsuk, S. An Overview of Solar/Visible Light-Driven Heterogeneous Photocatalysis for Water Purification: TiO2- and ZnO-Based Photocatalysts Used in Suspension Photoreactors. J. Ind. Eng. Chem. 2019, 71, 19–49. [Google Scholar] [CrossRef]
  21. Reza, K.M.; Kurny, A.; Gulshan, F. Parameters Affecting the Photocatalytic Degradation of Dyes Using TiO2: A Review. Appl. Water Sci. 2017, 7, 1569–1578. [Google Scholar] [CrossRef]
  22. Brunauer, S.; Emmett, P.H.; Teller, E. Adsorption of Gases in Multimolecular Layers. J. Am. Chem. Soc. 1938, 60, 309–319. [Google Scholar]
  23. Barrett, E.P.; Joyner, L.G.; Halenda, P.P. The Determination of Pore Volume and Area Distributions in Porous Substances. I. Computations from Nitrogen Isotherms. J. Am. Chem. Soc. 1951, 73, 373–380. [Google Scholar]
  24. Fidelis, M.Z. Degradação de Triclosan e 2,8-Diclorodibenzeno-p-Dioxina via Sistema Fe/Nb2O5/UV. Master’s Thesis, Universidade Tecnológica Federal do Paraná, Ponta Grossa, Brazil, 2019. [Google Scholar]
  25. Burden, R.L.; Faires, J.D. Numerical Analysis; Cengage Learning: Stamford, CT, USA, 2007. [Google Scholar]
  26. Zhang, P.; Wang, M.; Wang, J.; Teng, X.; Zhang, S.; Xie, H.; Ding, S. Facile Synthesis and Characterization of Low Crystalline Nb2O5 Ultrafine Nanoparticles as a New Efficient Photocatalyst. J. Non-Cryst. Solids 2018, 500, 371–376. [Google Scholar] [CrossRef]
  27. Zhang, J.; Jiang, T.; Mai, Y.; Wang, X.; Chen, J.; Liao, B. Selective Catalytic Oxidation of Sulfides to Sulfoxides or Sulfones over Amorphous Nb2O5/AC Catalysts in Aqueous Phase at Room Temperature. Catal. Commun. 2019, 127, 10–14. [Google Scholar] [CrossRef]
  28. Nunes, S.C.; Brackmann, R. Catalisadores Cu-Fe/Nb2O5 Para Aplicação Na Redução Catalítica Seletiva de NO Por CO. In Proceedings of the “20º CBCat: Expandindo as Fronteiras da Catálise”, o 20º Congresso Brasileiro de Catálise, São Paulo, Brazil, 1–7 September 2019. [Google Scholar]
  29. Costa, G.P.; Rafael, R.A.; Soares, J.C.S.; Gaspar, A.B. Synthesis and Characterization of ZnO-Nb2O5 Catalysts for Photodegradation of Bromophenol Blue. Catal. Today 2020, 344, 240–246. [Google Scholar] [CrossRef]
  30. Bolzon, L.B.; Prado, A.G.S. Effect of Protonation and Deprotonation on Surface Charge Density of Nb2O5: A Thermodynamic Approach. J. Therm. Anal. Calorim. 2011, 106, 427–430. [Google Scholar] [CrossRef]
  31. Nguyen, D.N.; Bui, H.M.; Nguyen, H.Q. Heterogeneous Photocatalysis for the Removal of Pharmaceutical Compounds. In Current Developments in Biotechnology and Bioengineering; Elsevier: Amsterdam, The Netherlands, 2020; pp. 161–183. ISBN 978-0-12-819594-9. [Google Scholar]
  32. Mangrulkar, P.A.; Joshi, M.M.; Tijare, S.N.; Polshettiwar, V.; Labhsetwar, N.K.; Rayalu, S.S. Nano Cobalt Oxides for Photocatalytic Hydrogen Production. Int. J. Hydrogen Energy 2012, 37, 10462–10466. [Google Scholar] [CrossRef]
  33. Taffarel, S.R.; Lansarin, M.A.; Moro, C.C. Styrene Photocatalytic Degradation Reaction Kinetics. J. Braz. Chem. Soc. 2011, 22, 1872–1879. [Google Scholar] [CrossRef]
  34. Knutson, K.P. Enzymatic Biobleaching of Recalcitrant Paper Dyes; Georgia Institute of Technology: Atlanta, GA, USA, 2004. [Google Scholar]
  35. Zanoni, M.V.B.; Yamanaka, H. Corantes: Caracterização Química, Toxicológica, Métodos de Detecção e Tratamento, 1st ed.; Cultura Acadêmica Editora: São Paulo, Brazil, 2016; ISBN 978-85-7983-780-7. [Google Scholar]
  36. Mills, A.; Davies, R.H.; Worsley, D. Water Purification by Semiconductor Photocatalysis. Chem. Soc. Rev. 1993, 22, 417. [Google Scholar] [CrossRef]
  37. Jada, A.; Akbour, R.A. Adsorption and Removal of Organic Dye at Quartz Sand-Water Interface. Oil Gas Sci. Technol. 2014, 69, 405–413. [Google Scholar] [CrossRef]
  38. Ceretta, M.B.; Vieira, Y.; Wolski, E.A.; Foletto, E.L.; Silvestri, S. Biological degradation coupled to photocatalysis by ZnO/polypyrrole composite for the treatment of real textile wastewater. J. Water Process. Eng. 2020, 35, 101230. [Google Scholar] [CrossRef]
Figure 1. Packaging manufacturing process.
Sustainability 17 03204 g001
Figure 2. SEM-EDS of the Nb2O5 catalyst.
Sustainability 17 03204 g002
Figure 3. XRD pattern of Nb2O5 catalyst sample.
Sustainability 17 03204 g003
Figure 4. (a) N2 adsorption and desorption isotherms; (b) zero charge point result.
Sustainability 17 03204 g004
Figure 5. Influence of catalyst concentration—synthetic effluent.
Sustainability 17 03204 g005
Figure 6. pH Influence—Synthetic Effluent.
Sustainability 17 03204 g006
Figure 7. Estimation of discoloration with variation of time and catalyst concentration—Synthetic Effluent.
Sustainability 17 03204 g007
Figure 8. Estimation of discoloration with variation of time and pH—Synthetic Effluent.
Sustainability 17 03204 g008
Figure 9. Influence of catalyst concentration—industrial effluent.
Sustainability 17 03204 g009
Figure 10. pH influence—industrial effluent.
Sustainability 17 03204 g010
Figure 11. Discoloration estimation with variation of time and catalyst concentration—Industrial Effluent.
Sustainability 17 03204 g011
Figure 12. Discoloration estimation with variation of time and pH—industrial effluent.
Sustainability 17 03204 g012
Figure 13. Industrial effluents collected in different periods.
Sustainability 17 03204 g013
Figure 14. Industrial effluent collected in different periods.
Sustainability 17 03204 g014
Figure 15. Industrial effluent, TiO2-P25: Adsorption and photocatalysis.
Sustainability 17 03204 g015
Disclaimer/Publisher’s Note: The statements, opinions and data contained in all publications are solely those of the individual author(s) and contributor(s) and not of MDPI and/or the editor(s). MDPI and/or the editor(s) disclaim responsibility for any injury to people or property resulting from any ideas, methods, instructions or products referred to in the content.

