Abstract
Due to the intermittency of wind power generation, it is very hard to manage its system operation and planning. In order to incorporate higher wind power penetrations into power systems that maintain secure and economic power system operation, an accurate and efficient estimation of wind power outputs is needed. In this paper, we propose the stochastic prediction of wind generating resources using an enhanced ensemble model for Jeju Island’s wind farms in South Korea. When selecting the potential sites of wind farms, wind speed data at points of interest are not always available. We apply the Kriging method, which is one of spatial interpolation, to estimate wind speed at potential sites. We also consider a wind profile power law to correct wind speed along the turbine height and terrain characteristics. After that, we used estimated wind speed data to calculate wind power output and select the best wind farm sites using a Weibull distribution. Probability density function (PDF) or cumulative density function (CDF) is used to estimate the probability of wind speed. The wind speed data is classified along the manufacturer’s power curve data. Therefore, the probability of wind speed is also given in accordance with classified values. The average wind power output is estimated in the form of a confidence interval. The empirical data of meteorological towers from Jeju Island in Korea is used to interpolate the wind speed data spatially at potential sites. Finally, we propose the best wind farm site among the four potential wind farm sites.
1. Introduction
The demand for wind energy is growing rapidly all over the world. According to the Global Wind Energy Council (GWEC), there will be 350 GW of wind power capacity installed by 2020 [1]. The European Wind Energy Association (EWEA) expects an increase of 320 GW in European wind power capacity by 2030 [2]. As wind generation capacity increases, various related technologies are considered. The maximum power point tracking (MPPT) of wind turbines is a way to obtain maximum output with certain wind resources using pitch control and dynamic operation [3,4,5]. The transient stability analysis of the microgrid or power system integrated with large wind farms is also under study [6,7]. In this paper, before considering stable operation and efficient control of the wind turbine, we focus on predicting the wind resources efficiently and estimating the output of the wind turbine at potential wind farm sites.
Before constructing new wind farms, it is essential to estimate the average wind power output or capacity factor in potential sites [8,9,10]. Generally, researchers use the wind energy density of the potential location or the turbine power curve provided by the manufacturer to estimate the wind power outputs or capacity factor. This approach can be a deterministic method and may be difficult to estimate the wind power output if there is no measured data at potential locations. In this paper, we propose a stochastic approach for wind power estimation using a spatial interpolation, terrain characteristic, and Weibull distribution. First, we introduce a method of spatial interpolation, called the Kriging method, and the wind profile power law to estimate the wind speed at a given point of interest. This spatial approach differs from various time series or neural network-based wind speed forecasting methods using historical data [11,12]. The spatial approach can predict the wind speed at different points of interest spatially using only the current wind speed data. Second, we propose the method for wind power estimation using a Weibull distribution. Finally, we apply our method based on empirical data from the meteorological towers from Jeju Island in South Korea. The unknown wind speed data for potential points can be estimated using spatial interpolation and empirical meteorological data at various points in Jeju Island. Later, estimated wind speed data is used to model the Weibull distribution. Any wind turbine power curve data can be used to estimate the average turbine output. Based on the proposed method, we propose the best one among the four potential wind farm sites.
2. Enhanced Ensemble Model Based on Spatial Techniques
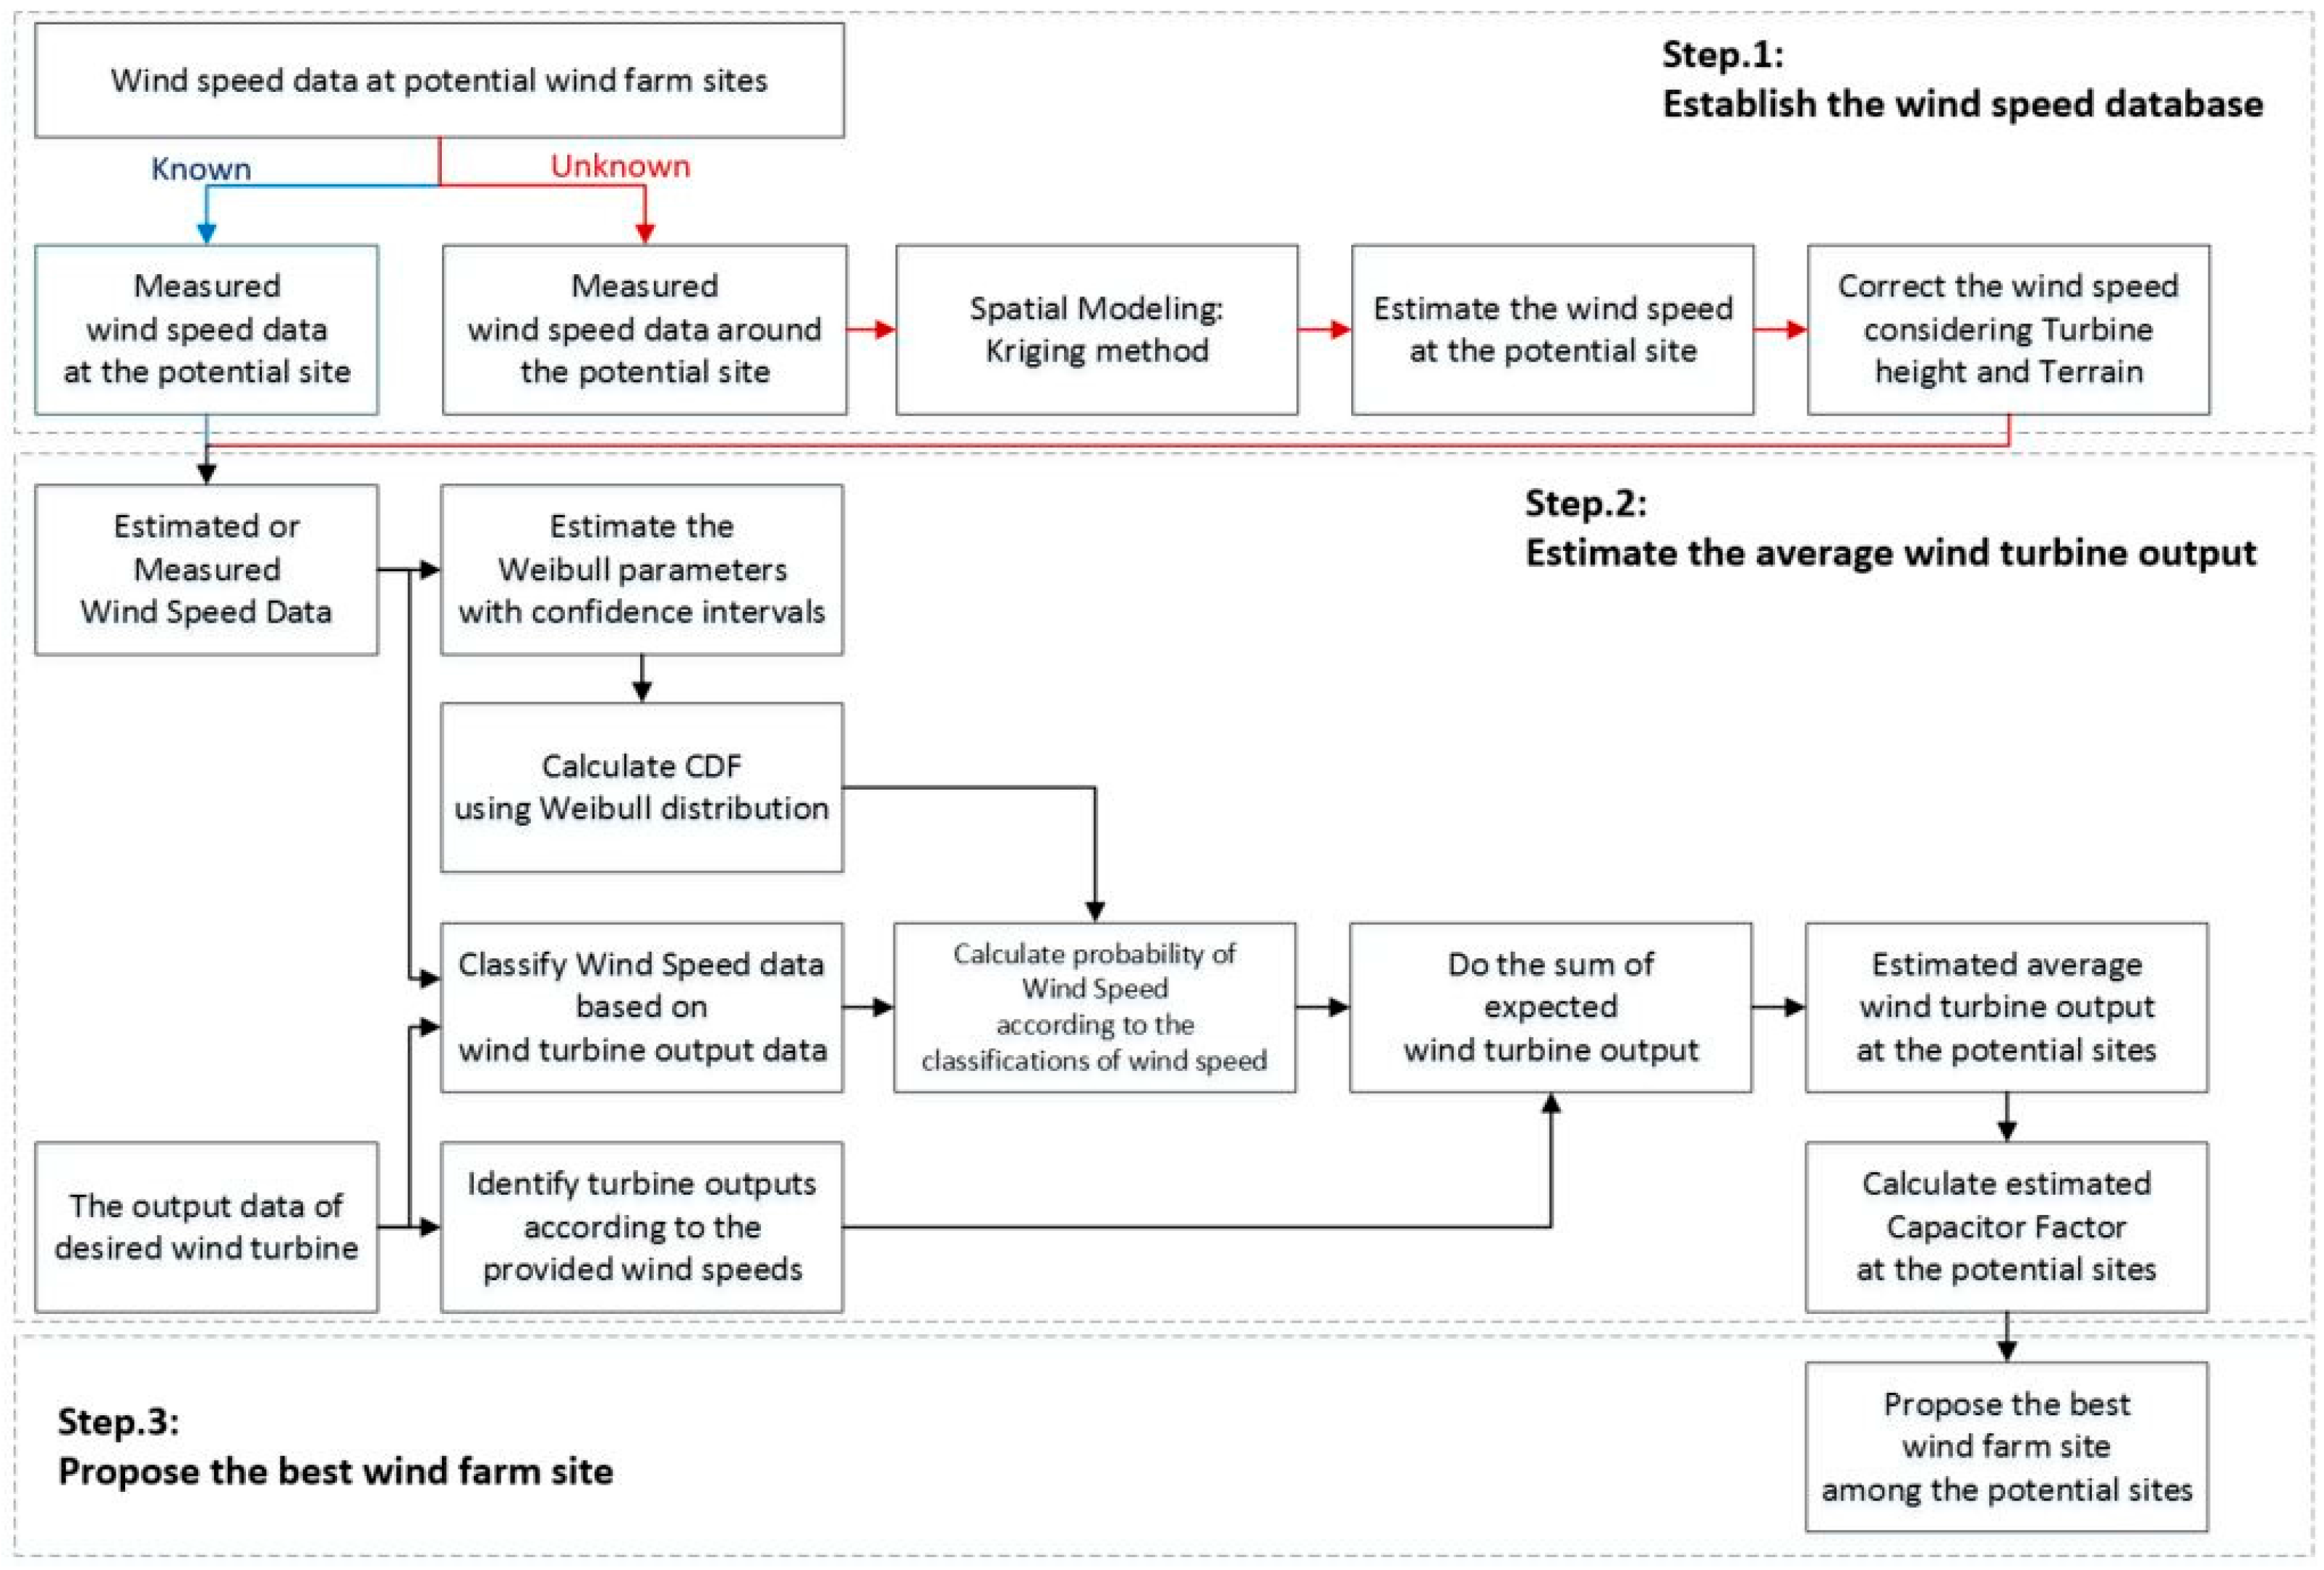
We propose the stochastic method to select the best wind farm among the potential wind farm sites using the spatial method and Weibull distribution. When planning to build a wind farm, we consider the wind speed resources at potential sites. In most cases, however, it is difficult to obtain wind speed data for the sites. In this paper, we consider the case where we do not know the wind speed data of the area of interest. We apply spatial interpolation called the Kriging method to obtain wind speed data for specific sites, thereby reducing the estimation cost of selecting the proper wind farm. The flowchart for proposed method is shown in Figure 1.
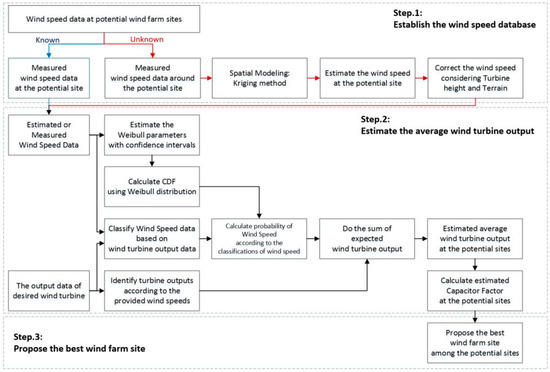
Figure 1.
Flowchart for the enhanced ensemble model.
2.1. Step 1: Establish the Wind Speed Database Using a Spatial Modeling
Spatial modeling is a modeling technique for analyzing spatially distributed physical phenomena and data. It is widely used in various fields such as Geographic Information System (GIS), ecology, energy, and engineering [13,14,15,16]. Spatial modeling can estimate the value of the specific site without the accumulation of historical data. It is a useful technique for considering the proper wind farm site in that it does not require time-consuming works to acquire wind resource data.
The Kriging is one of the spatial interpolation methods based on regression against observed values of neighbor data points, weighted according to spatial covariance values. The general formula for the Ordinary Kriging method is shown in Equation (1) [17,18].
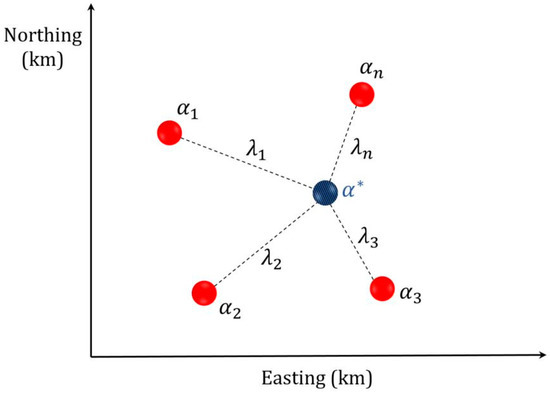
Figure 2.
Graphical expression of the Kriging method.
The estimated wind speed is corrected according to the height of turbine and the characteristics of the terrain. We use the wind profile power law in the proposed method. The wind profile power law is a relationship between the elevation and wind speeds. The wind profile power law equation is shown in Equation (2), where is the wind speed at measured height , and is the wind speed at extrapolated height h [19].
The wind speed shear exponent relies on the terrain characteristic of the installed wind turbine. The general wind speed shear exponents depending on the terrain characteristic are shown in Table 1 [20].

Table 1.
Influence of terrain characteristic on wind speed shear [20].
2.2. Step 2: Estimate the Average Wind Turbine Output Using a Weibull Distribution
A Weibull distribution is a putative statistical tool for analyzing wind speed data [21,22,23]. The two-parameter Weibull distribution consists of scale and shape parameters. The probability density function of a Weibull distribution is shown in Equation (3), where is the shape parameter, is the scale parameter, and variable is the wind speed.
The cumulative density function of the Weibull distribution is represented by Equation (4), where each variable is the same as Equation (3) [24].
There are various methods for estimating Weibull distribution parameters such as the linear least square method (LLSM), the maximum likelihood estimator (MLE), and the moments method [25]. For large and complex datasets, both the LLSM and the MLE provide almost consistent results. Extensive simulation shows that the MLE method is more accurate than the LLSM method for relatively few samples [26]. As a result, we selected the MLE method to estimate the Weibull distribution parameters. Simplified estimations of these parameters using the MLE method are shown in Equations (5) and (6) [25].
2.3. Estimation of Average Wind Turbine Output Using a Weibull Distribution
The proposed stochastic algorithm for estimating the average output of a wind turbine is shown in Figure 1. The two-parameter Weibull distribution is calculated from the wind speed data, which is estimated by the Kriging method. At this point, the Weibull distribution parameters have a specific confidence interval. The estimated wind speed can be classified according to wind speed values of turbine output data that is provided by the manufacturer. The classifications of the measured wind speed data are given probabilistically using the cumulative density function of the Weibull distribution. The probability can be calculated using Equation (9) after solving Equation (4). The wind turbine output that corresponds to the classifications of wind speed can be identified through the manufacturer’s power curve data. The average output of the turbine can be calculated using Equation (10).
Here, is the number of classified wind speed dataset; is the upper limit of the th wind speed dataset; is the probability value corresponding to the wind speed range ; and signifies the wind power output that corresponds with . The variable is the mean output of the wind turbine, and will have a specific range along the upper or lower limit of the Weibull distribution parameters.
3. Case Study: Stochastic Prediction of Wind Generating Resources in Jeju Island’s Wind Farms in South Korea
3.1. Empirical Data and Estimated Wind Speed Using a Spatial Interpolation
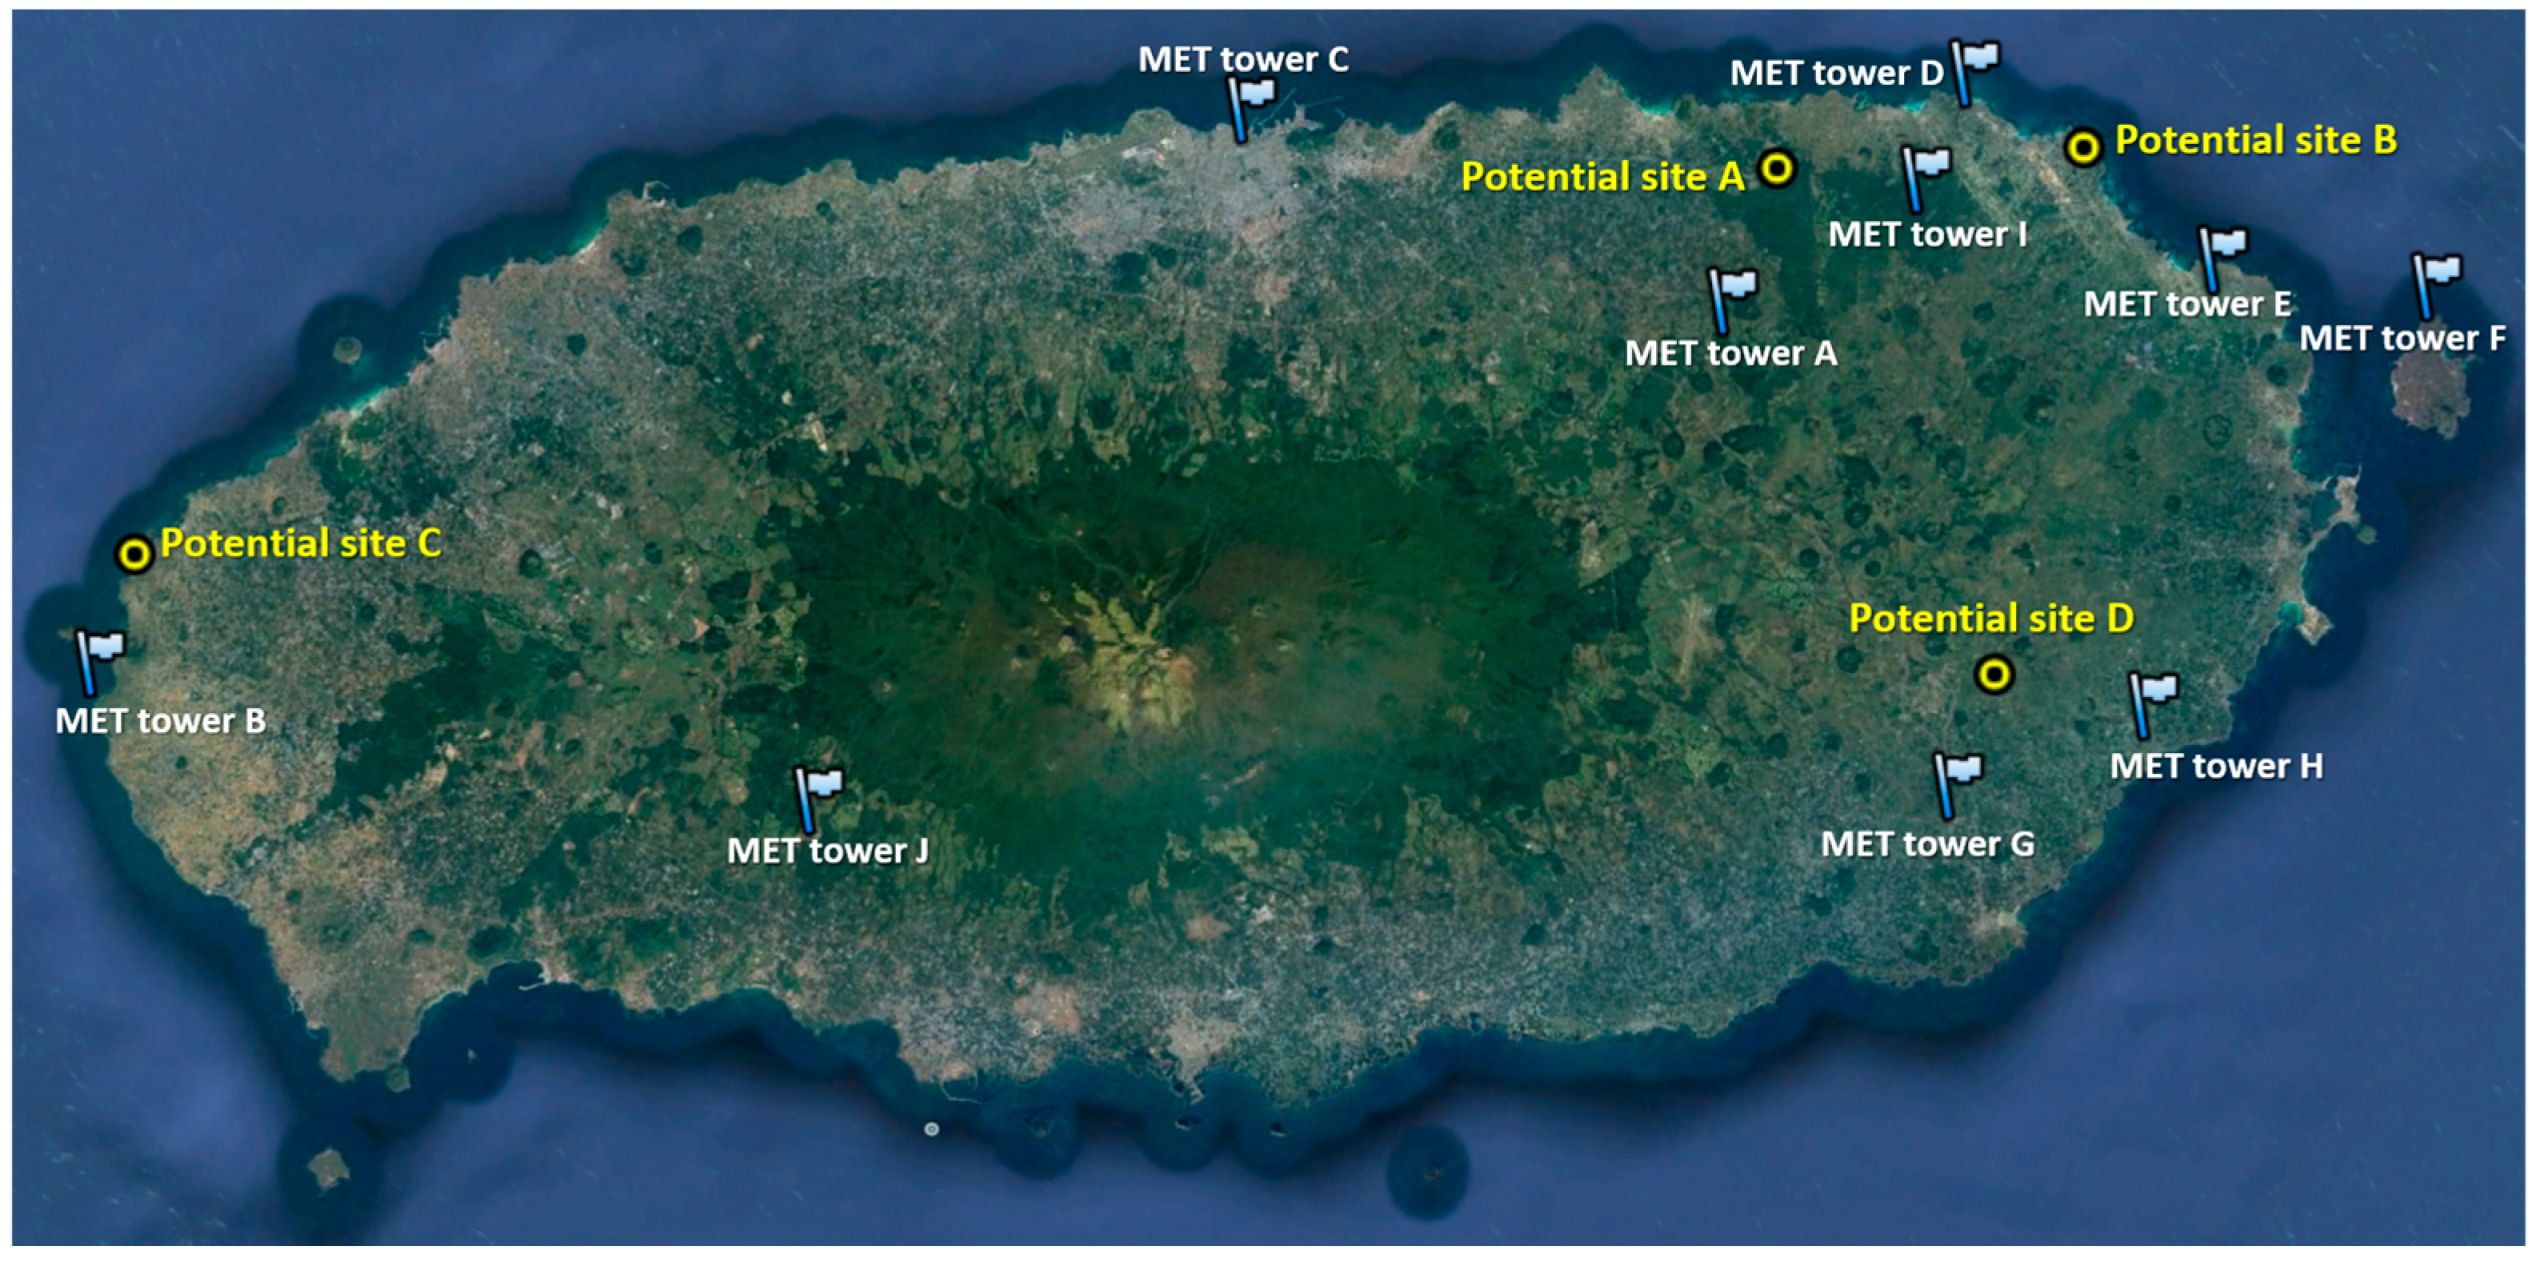
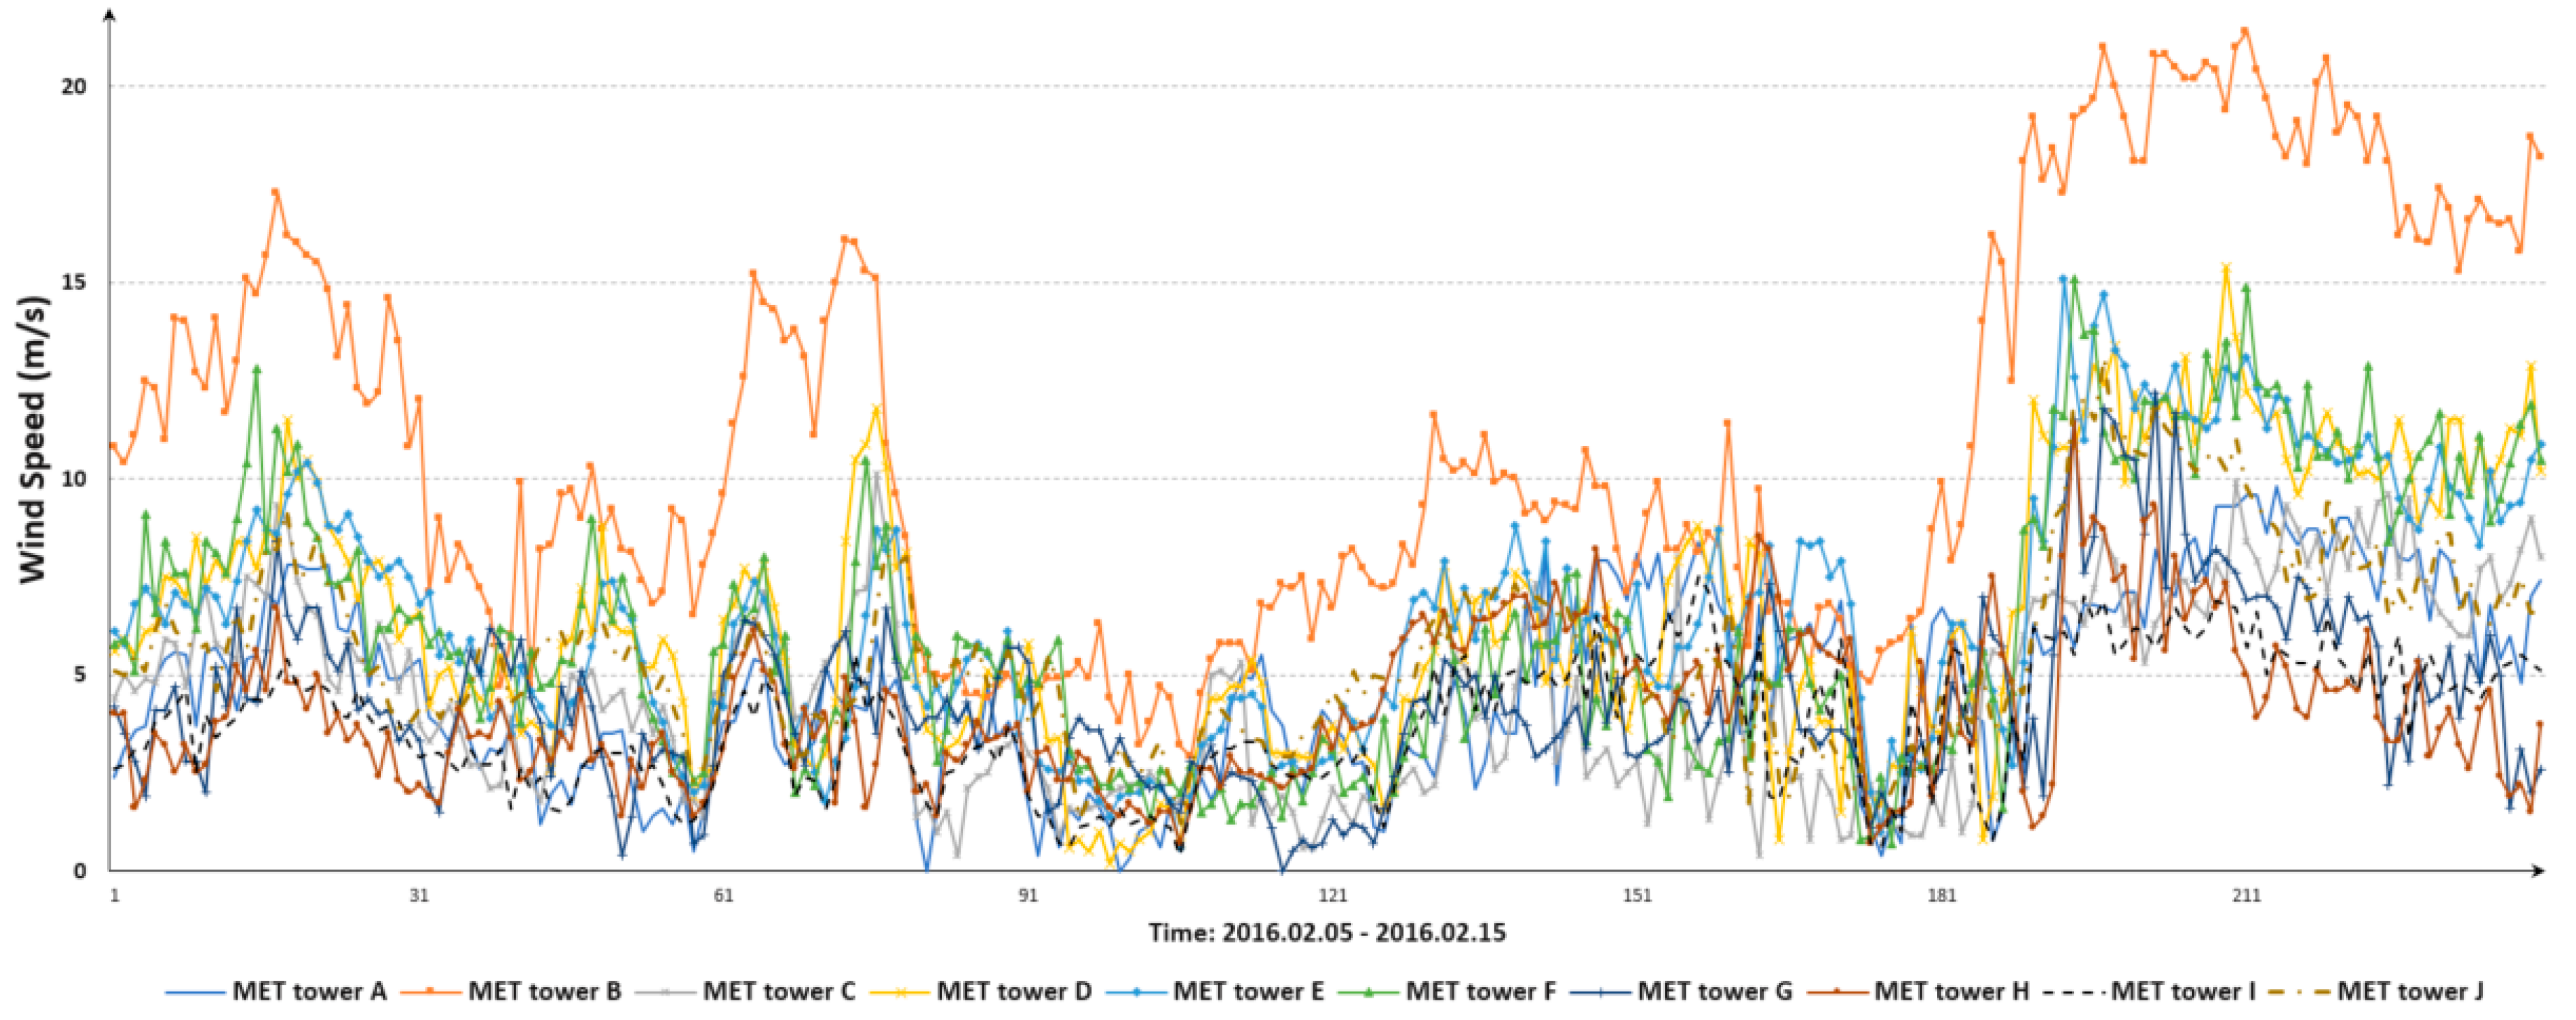
In this case study, we select Jeju Island, which has many potential sites for wind power generation. To apply the Kriging method, we use location information and wind speed data measured in the 10 meteorological (MET) towers in Jeju Island of South Korea. We consider the optimal wind farm among four potential wind farm sites. Figure 3 shows four potential wind farm sites and 10 neighbor meteorological towers in Jeju Island using Google Maps. Before applying the Kriging method, we collect latitude, longitude, and elevation data for 10 meteorological towers and four potential wind farm sites. This coordinate data used in this paper is shown in Table 2. The wind speed was measured at the meteorological towers on 5–15 February 2016 in one-hour intervals, and its time series plot is shown in Figure 4.

Figure 3.
The location for four potential wind farms and 10 meteorological towers.
Table 2.
The coordinates data for Kriging method.

Figure 4.
Measure wind speed data at 10 meteorological towers.
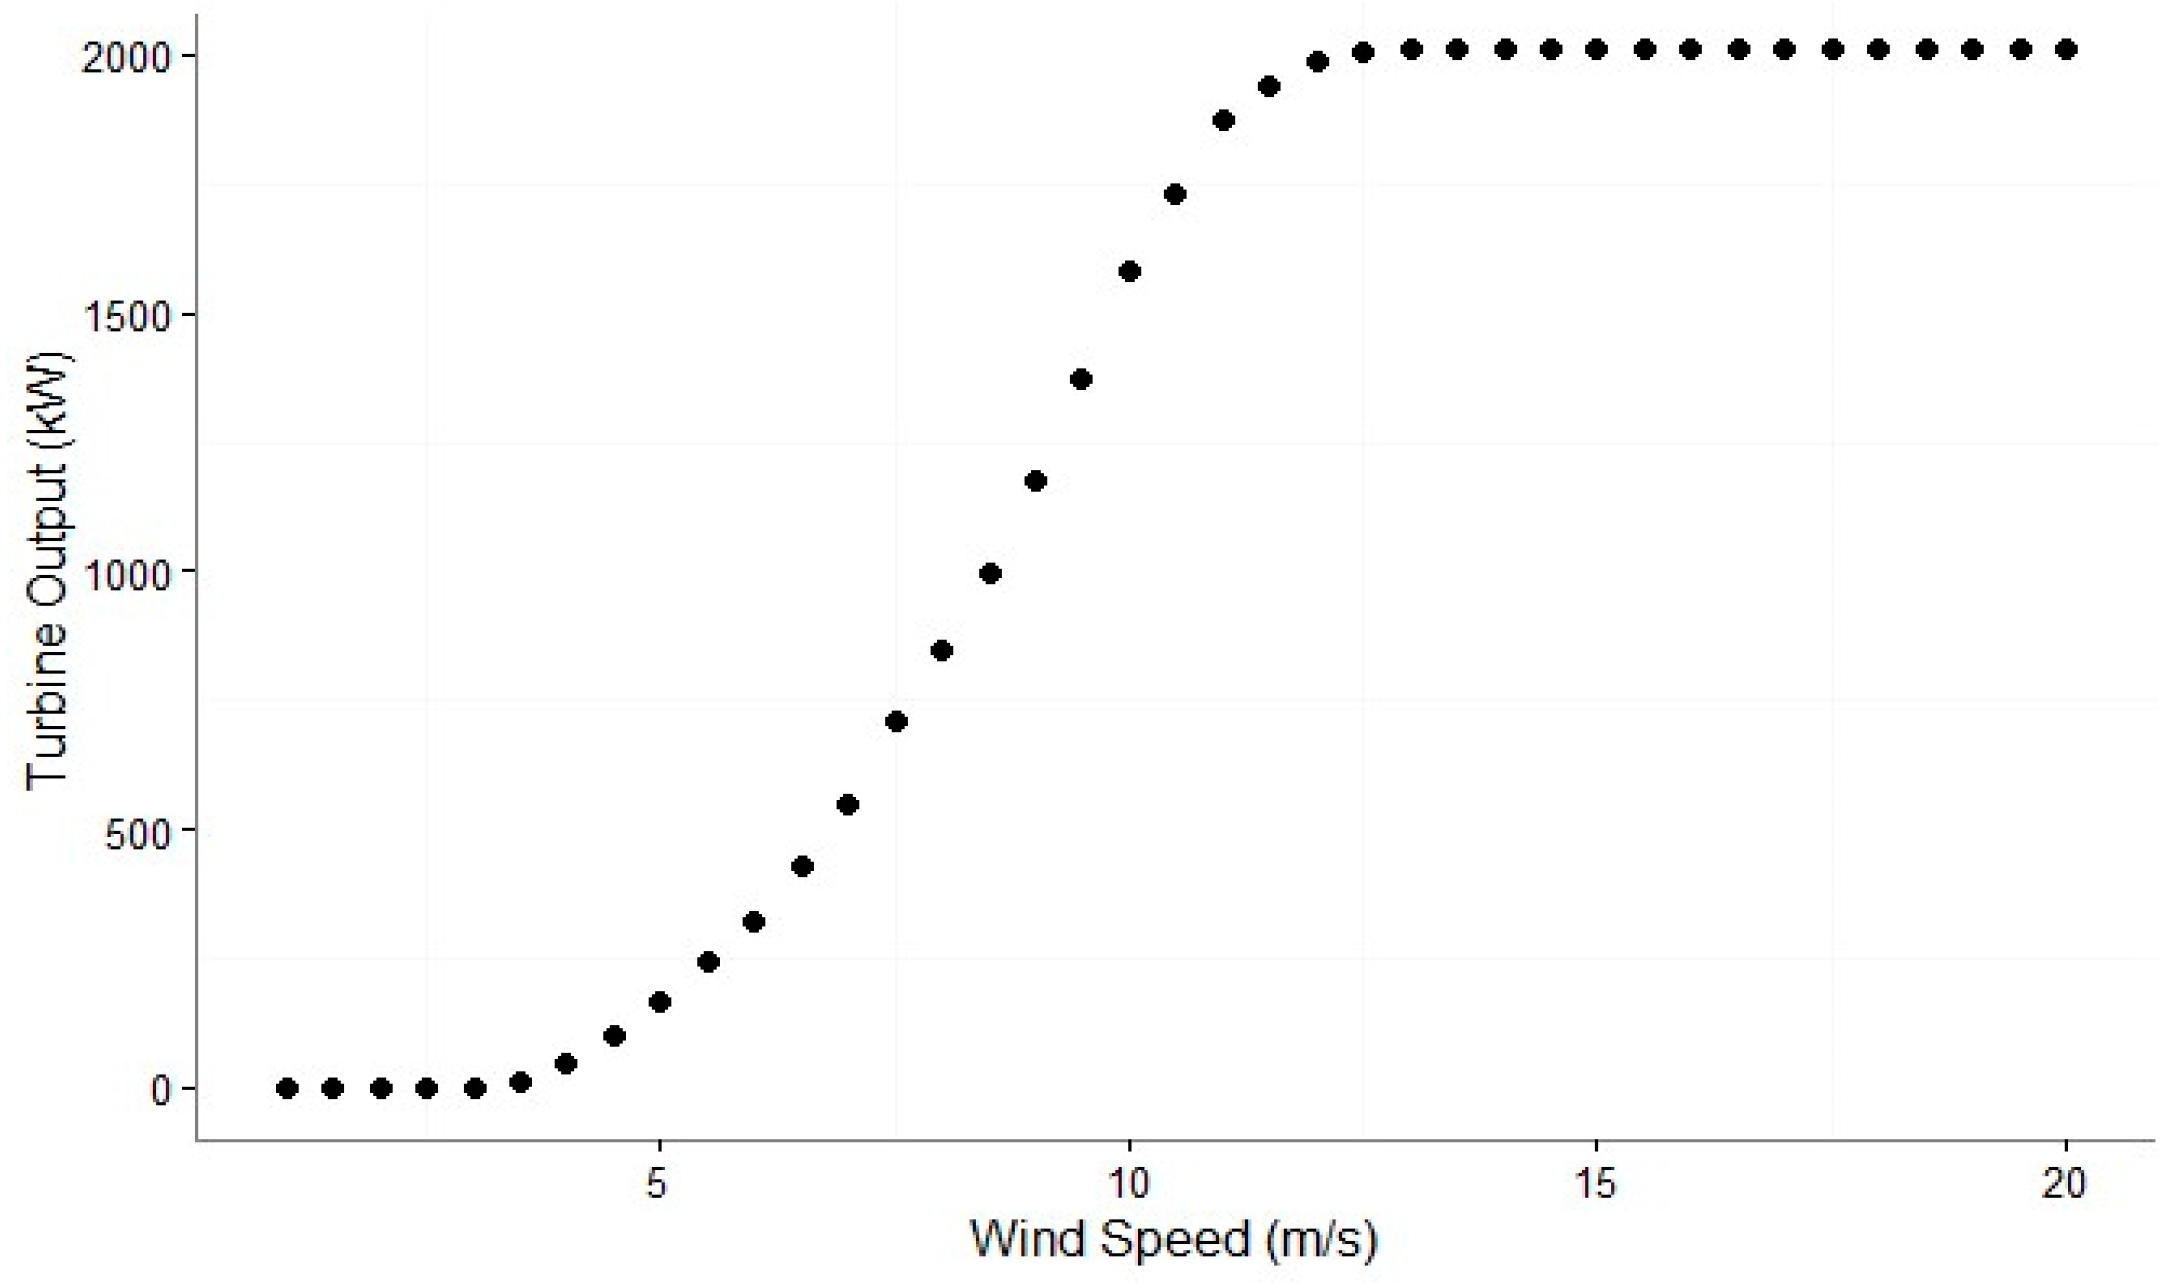
We used wind turbine model HJWT-2000, which has been used in some wind farms in Jeju Island for simulation. The selected turbine model can be replaced depending on the turbine to be installed if a power curve data is available. The power curve data provided by the manufacturer is shown in Figure 5. The technical data of the turbine is shown below in Table 3.
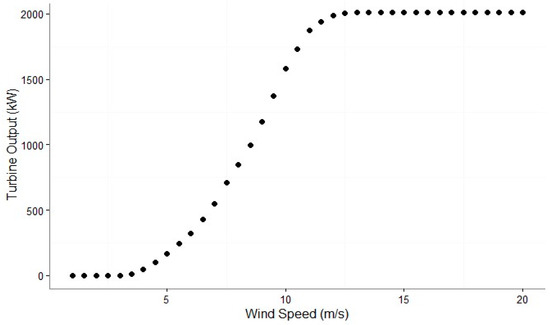
Figure 5.
Power curve data used in simulation.
Table 3.
Technical specifications of wind turbine.
We correct the estimated wind speeds at four potential sites based on the elevation of potential sites and hub height using Equation (2). We determine the wind shear exponent according to the terrain characteristic of potential sites. The determined wind shear exponents are shown in Table 4. The results of estimating the wind speeds at four potential sites using the Ordinary Kriging method and the wind profile power law are shown in Figure 6. At that time, the estimated Kriging parameters, which are the weights for each neighbor meteorological tower, are shown in Table 5.
Table 4.
Wind shear exponent based on the terrain characteristic.
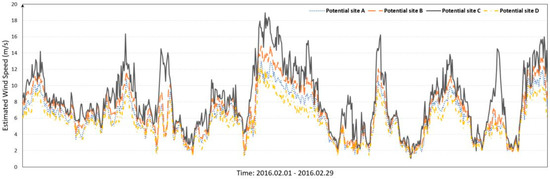
Figure 6.
Estimated wind speed for the four potential wind farm sites.
Table 5.
Ordinary Kriging parameter information for the potential sites.
3.2. Estimate the Average Wind Turbine Output Using a Weibull Distribution
We estimate the Weibull distribution parameters based on the estimated wind speed data for four potential wind farms using Equations (5)–(8). Each Weibull parameter has 97.5% confidence limits according to Equations (7) and (8), and the results are shown in Table 6. In Table 6, we show the mean value and 97.5% confidence limits of the estimated Weibull distribution parameters.
Table 6.
Estimated Weibull distribution parameters.
The probability density function of estimated wind speed can be calculated based on the estimated Weibull distribution parameters. Figure 7 shows the probability density function of estimated wind speed for Potential Wind Farm C, where upper and lower bound represent values of the confidence level 0.975.
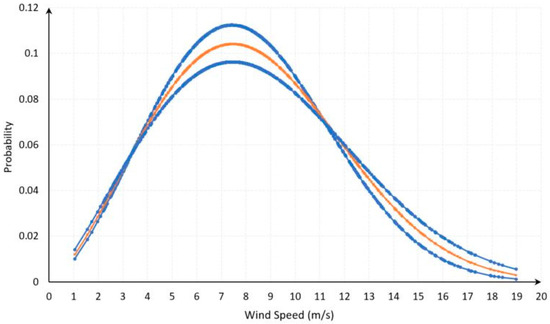
Figure 7.
Probability density function of estimated wind speed for Potential Wind Farm C.
In this paper, the estimated wind speed data is divided into approximately intervals of 0.5, from 1 to cut-out speed, with respect to the turbine output from the power curve data. In our selected wind turbine, the wind speed can be divided into 39 datasets. 8 samples of simulation results for Potential Wind Farm C using Equations (9) and (10) is shown in Table 7 and Table 8, wherein the confidence level of probability is 97.5%.
Table 7.
Samples of estimated probability of the wind speed and power curve data for simulations.
Table 8.
Estimation of expected turbine outputs based on Weibull distribution.
In Table 8, the average turbine output represents one-hour electric generation. This simulation procedure can be applied equally to the remaining three potential wind farms. As a result, we estimate the average wind turbine outputs of four potential wind farms for February 2016 in Jeju Island. In addition, the capacity factor can be calculated in Equation (11).
The simulation results for the four potential wind farms are shown in Table 9. It is estimated that Potential Wind Farm C has the highest efficiency in February.
Table 9.
Turbine output estimation of four potential wind farms in February.
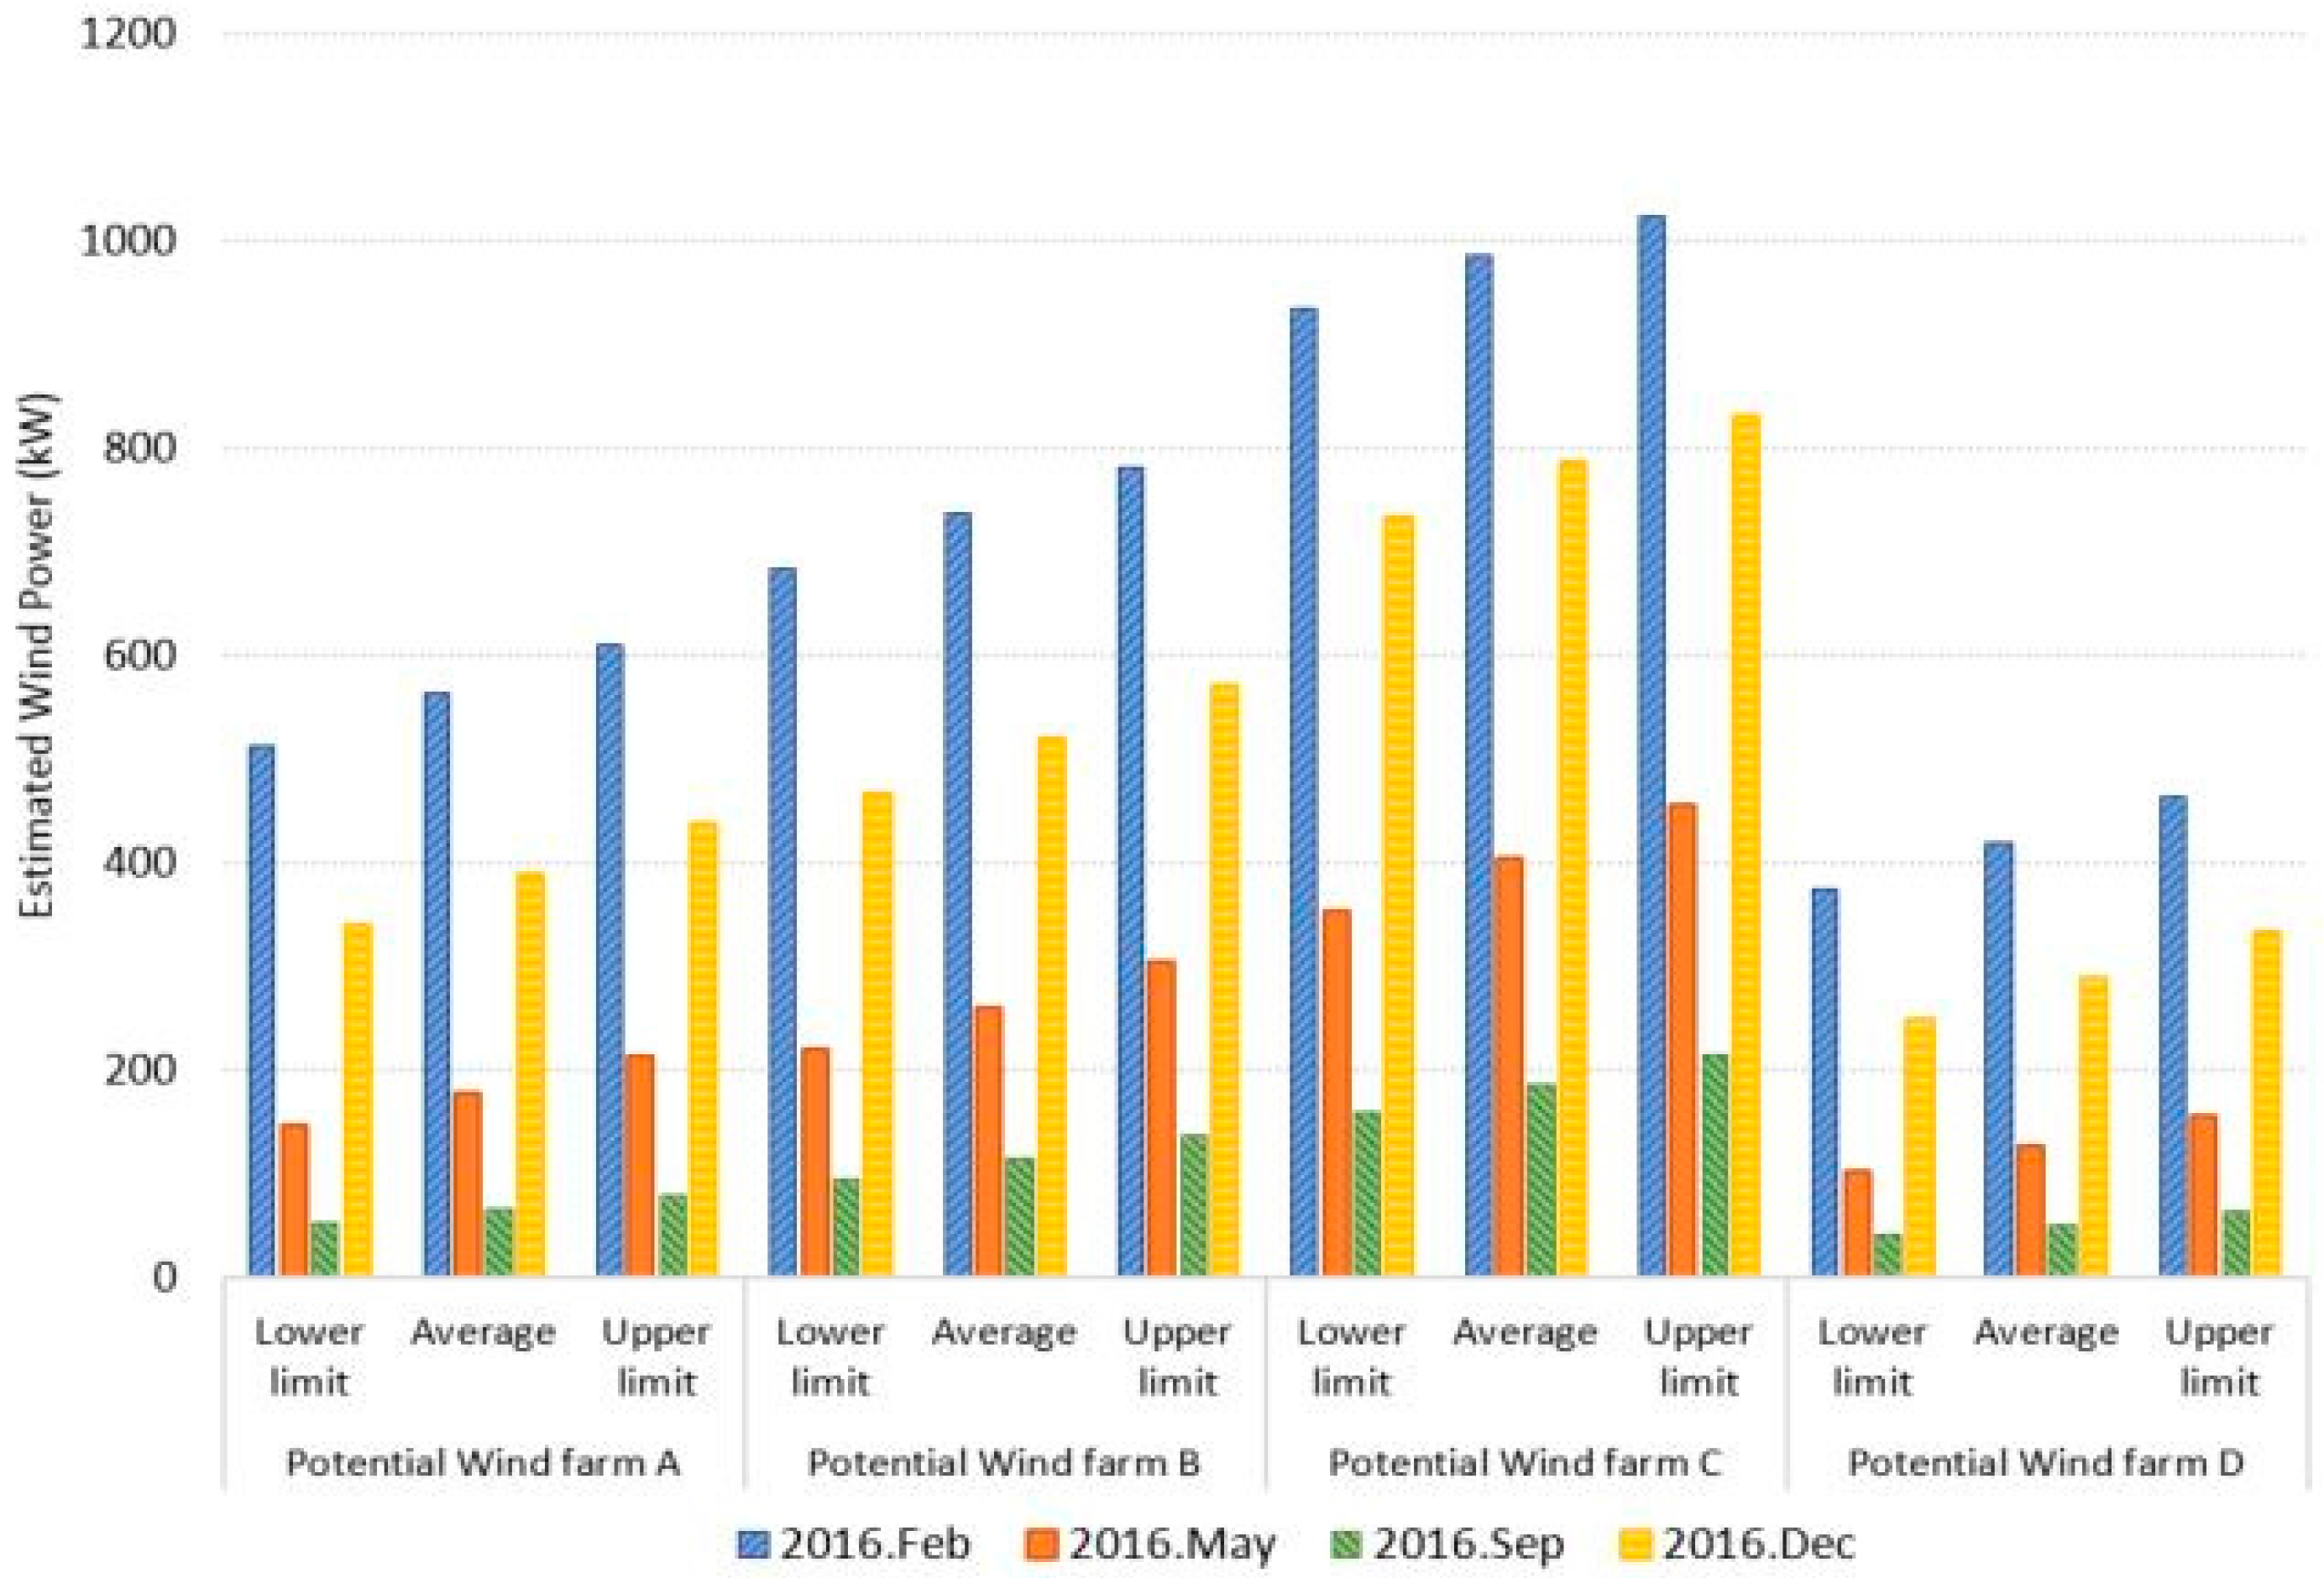
We also simulate the turbine output in May, September, and December using the proposed method. Each month represents different wind speeds, which can reveal the seasonal effects. The simulation results for the four months are shown in Table 10 and Figure 8.
Table 10.
Turbine output estimation of four potential wind farms in season.
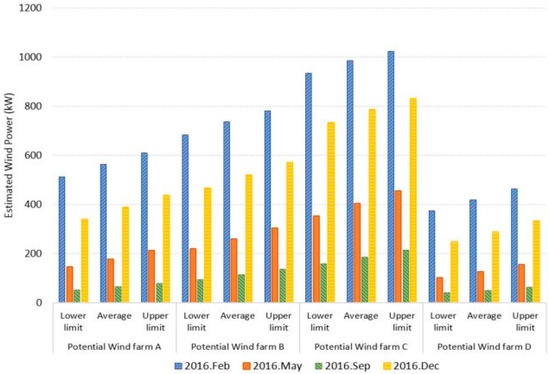
Figure 8.
Comparison for Turbine output estimation at four potential wind farms.
As a result, Potential Wind Farm C represents the highest efficiency of the turbine output. Considering only the generation output, we can purpose the Site C among the four potential wind farms as a new wind farm.
4. Conclusions
Wind energy is rapidly increasing globally due to its high economic efficiency and lack of carbon. In terms of planning a new wind farm, a flexible and economical estimation of wind turbine output is needed to select potential installation sites. In this paper, we use one of the spatial interpolation methods called Kriging to estimate wind speed. When considering new potential wind farms, wind speed data for most new spots do not exist. Using our proposed method, when estimating the wind power, it has the economic advantages of not requiring the installation of additional meteorological towers or the accumulation of historical data to evaluate wind resources at given points of interests. The proposed method can estimate wind power when a desired turbine is installed at any desired point based on the spatial approach. In this paper, we simulate the method to propose the best wind farm in terms of electrical generation in Jeju Island in South Korea. We use wind speed measured in 10 existing meteorological towers and coordinate data at potential wind farms in Jeju Island. From the simulation results, Potential Wind Farm C is selected as the best wind farm. Considering the seasonal and spatial characteristics of wind, Potential Wind Farm C is expected to generate higher outputs than other potential wind farms. This estimated output depends on the general power characteristics of the wind resource and turbine only and can be improved using pitch control and dynamic turbine operation. In our proposed method, the estimated wind power is provided with deterministic and probabilistic outputs. Such a method benefits from the operational aspects of the wind integrated power systems. Probabilistic outputs can indicate uncertainties in estimated power generation to system planners and operators when properly selecting new wind farm sites and operating the grid after the selected wind farm is installed. In the future, we will consider laminar wind condition and turbulence in the calculation of the optimal probability function of wind speed and perform a verification of the methodology based on the measured output data from the selected wind farm site.
Acknowledgments
This work was supported by the Korea Institute of Energy Technology Evaluation and Planning (KETEP) and the Ministry of Trade, Industry & Energy (MOTIE) of the Republic of Korea (No. 20161210200560).
Author Contributions
Jin Hur conceived and designed the overall research; Deockho Kim developed the enhanced ensemble model and conducted the experimental simulation; Jin Hur and Deockho Kim wrote the paper; and Jin Hur guided the research direction and supervised the entire research process.
Conflicts of Interest
The authors declare no conflict of interest.
References
- Global Wind Energy Council. Global Wind Report 2015. 2015. Available online: https://www.gwec.net/wp-content/uploads/vip/GWEC-Global-Wind-2015-Report_April-2016_19_04.pdf (accessed on 13 May 2017).
- The European Wind Energy Association. Wind Energy Scenarios for 2030. 2015. Available online: https://www.ewea.org/fileadmin/files/library/publications/reports/EWEA-Wind-energy-scenarios-2030.pdf (accessed on 13 May 2017).
- Lin, W.; Hong, C.; Ou, T.; Chiu, T. Hybrid intelligent control of PMSG wind generation system using pitch angle control with RBFN. Energy Convers. Manag. 2011, 52, 1244–1251. [Google Scholar] [CrossRef]
- Ou, T.-C.; Hong, C.-M. Dynamic operation and control of microgrid hybrid power systems. Energy 2014, 66, 314–323. [Google Scholar] [CrossRef]
- Hong, C.-M.; Ou, T.C.; Lu, K.-H. Development of intelligent MPPT (maximum power point tracking) control for a grid-connected hybrid power generation system. Energy 2013, 50, 270–279. [Google Scholar] [CrossRef]
- Ou, T.-C. A novel unsymmetrical faults analysis for microgrid distribution systems. Int. J. Electr. Power Energy Syst. 2012, 43, 1017–1024. [Google Scholar] [CrossRef]
- Ou, T.-C.; Lu, K.-H.; Huang, C.-J. Improvement of transient stability in a hybrid power multi-system using a designed NIDC (Novel Intelligent Damping Controller). Energies 2017, 10, 488. [Google Scholar] [CrossRef]
- Biswal, G.C.; Shukla, S.P. Site selection for wind farm installation. IJIREEICE 2015, 3, 59–61. [Google Scholar]
- Milligan, M.R.; Artig, R. Choosing wind power plant locations and sizes based on electric reliability measures using multiple-year wind speed measurements. In Proceedings of the U.S. Association for Energy Economics Annual Conference, Orlando, FL, USA, 29 August–1 September 1999. [Google Scholar]
- Kim, J.Y.; Kang, K.S.; Oh, K.Y.; Lee, J.S.; Ryu, M.S. A study on the site selection of offshore wind farm around Korean peninsula. In Proceedings of the International Conference on Ocean Energy, Bilbao, Spain, 6 October 2010. [Google Scholar]
- Zhang, J.; Wei, Y.; Tan, Z.; Wang, K.; Tian, W. A hybrid method for short-term wind speed forecasting. Sustainability 2017, 9, 596. [Google Scholar] [CrossRef]
- Quan, H.; Srinivasan, D.; Khosravi, A. Incorporating wind power forecast uncertainties into stochastic unit commitment using neural network-based prediction intervals. IEEE Trans. Neural Netw. Learn. Syst. 2015, 26, 9. [Google Scholar] [CrossRef] [PubMed]
- Matejicek, L. Spatial modelling of air pollution in urban areas with GIS: A case study on integrated database development. Adv. Geosci. 2005, 4, 63–68. [Google Scholar] [CrossRef]
- Griffith, D.A.; Peres-Neto, P.R. Spatial modeling in ecology: The flexibility of eigenfunction spatial analysis. Ecol. Soc. Am. 2006, 87, 2603–2613. [Google Scholar] [CrossRef]
- Gonzalez-Longatt, F.; Medina, H.; Gonzalez, J.S. Spatial interpolation and orographic correction to estimate wind energy resource in Venezuela. Renew. Sustain. Energy Rev. 2015, 48, 1–16. [Google Scholar] [CrossRef]
- Holdaway, M.R. Spatial modeling and interpolation of monthly temperature using Kriging. Clim. Res. 1996, 6, 215–221. [Google Scholar] [CrossRef]
- Stein, M.L. Interpolation of Spatial Data: Some Theory for Kriging; Springer: New York, NY, USA, 1999. [Google Scholar]
- Montero, J.-M.; Aviles, G.F.; Mateu, J. Spatial and Spatio-Temporal Geostatistical Modeling and Kriging; Wiley: New York, NY, USA, 2015. [Google Scholar]
- Wagner, R.; Courtney, M.; Gottschall, J.; Lindelow-Marsden, P. Accounting for the Speed Shear in Wind Turbine Power Performance Measurement; Risø National Laboratory for Sustainable Energy: Roskilde, Denmark, 2010. [Google Scholar]
- Devenport, A.G. Rationale for determining Design Wind Velocities. Am. Soc. Civil Eng. 1960, 86, 39–68. [Google Scholar]
- Carrillo, C.; Cidras, J.; Diaz-Dorado, E.; Obando-Montano, A.F. An approach to determine the Weibull parameters for wind energy analysis: The case of Galicia (Spain). MDPI Energies 2014, 7, 2676–2700. [Google Scholar] [CrossRef]
- Saxena, B.K.; Rao, K.V.S. Estimation of wind power density at a wind farm site located in western Rajasthan region of India. Procedia Technol. 2016, 24, 492–498. [Google Scholar] [CrossRef]
- Anurag Chauhan, R.P. Saini, statistical analysis of wind speed data using weibull distribution parameters. In Proceedings of the International Conference on Non Conventional Energy, Kalyani, WB, India, 16–17 January 2014. [Google Scholar]
- McCool, J.I. Using the Weibull distribution: Reliability, Modeling and Inference; Wiley: New York, NY, USA, 2012. [Google Scholar]
- Bhattacharya, P. Weibull Distribution for Estimating the Parameters; InTech: Rijeka, Croatia, 2011; ISBN 978-953-307-336-1. [Google Scholar]
- Genschel, U.; Meeker, W.Q. A comparison of maximum likelihood and median-rank regression for weibull estimation. Qual. Eng. 2016, 22, 230–255. [Google Scholar] [CrossRef]
- NCSS. Distribution (Weibull) Fitting. Available online: https://ncss-wpengine.netdna-ssl.com/wp-content/themes/ncss/pdf/Procedures/NCSS/Distribution-Weibull-Fitting.pdf (accessed on 11 May 2017).


© 2017 by the authors. Licensee MDPI, Basel, Switzerland. This article is an open access article distributed under the terms and conditions of the Creative Commons Attribution (CC BY) license (http://creativecommons.org/licenses/by/4.0/).