Abstract
The elimination of multiplicative speckle noise is the main issue in synthetic aperture radar (SAR) images. In this study, a SAR image despeckling filter based on a proposed extended adaptive Wiener filter (EAWF), extended guided filter (EGF), and weighted least squares (WLS) filter is proposed. The proposed EAWF and EGF have been developed from the adaptive Wiener filter (AWF) and guided Filter (GF), respectively. The proposed EAWF can be applied to the SAR image, without the need for logarithmic transformation, considering the fact that the denoising performance of EAWF is better than AWF. The proposed EGF can remove the additive noise and preserve the edges’ information more efficiently than GF. First, the EAWF is applied to the input image. Then, a logarithmic transformation is applied to the resulting EAWF image in order to convert multiplicative noise into additive noise. Next, EGF is employed to remove the additive noise and preserve edge information. In order to remove unwanted spots on the image that is filtered by EGF, it is applied twice with different parameters. Finally, the WLS filter is applied in the homogeneous region. Results show that the proposed algorithm has a better performance in comparison with the other existing filters.
1. Introduction
Despeckling of synthetic aperture radar (SAR) images is one of the main topics of recent studies []. SAR images have been widely used in many fields, such as disaster monitoring, environmental, protection, and topographic mapping []. It is not even affected by cloud cover or variation in solar illumination. A SAR image is formed by the continuous interaction of emitted microwave radiance with targeted regions, which causes random constructive and destructive noisiness resulting in multiplicative noise called speckle noise. Several methods have been proposed to remove these unwanted patterns, and some noise removal methods are based on spatial filtering, for instance, Frost filtering [] and Lee filtering []. However, the spatial methods tend to darken the despeckled SAR images. In recent years, model-based filters are being used for SAR image despeckling [] such as the block sorting for the SAR image denoising algorithm []. These filters are useful for solving different inverse problems but they are often time-consuming. Lately, scientists have presented many image fusion methods, the two known image fusion filters among which are Multi-scale image fusion filters and data-driven image fusion filters []. However, these Filters do not fully consider spatial consistency and tend to produce color distortion and brightness.
Other popular filters include the partial differential equation (PDE), nonlinear, linear, multiresolution, hybrid, and denoising filters based on fuzzy logic.
The linear types of filtering are performed through a procedure known as convolution. The filters are obtained by the weighted sum of the neighbor pixels of the mask window. For example, the Gaussian and mean methods belong to linear filters. Due to its inability to detect image areas (edge, homogeneous, and details), the mean filter shows a low-edge preservation performance []. However, the Gaussian method shows good performance in small variance and the blurring phenomenon occurs within the edge areas.
In the nonlinear method, the output is not a linear function of its input (e.g., median filter, bilateral filter (BF) [], non-local mean (NLM) filters [], Weibull multiplicative model, etc). The median filter is similar to the mean filter representation of good performance and weak performance in homogenous regions and edge preservation, respectively. The BF and NLM filters have good performance in edge preservation, but in Rayleigh distribution of noise (speckle noise), the denoising performance is poor. In addition, BF represents gradient distortion and high complexity []. Moreover, Anantrasirichai [] suggested an adaptive bilateral filter (ABF) for the imaging of optical coherence tomography. The range parameter is determined by the variance of the most homogeneous block, and it is automatically adapted based on speckle noise variations. But, given the sensitivity of variance to noise, the variance cannot correctly identify the homogeneous image in high noise. The NLM filter functions based on BF that is appropriate to additive white gaussian noise (AWGN) denoising, not despeckling []. Another popular model is the Weibull distribution but it is appropriate for urban scenes and sea clutter [].
The PDE methods are useful to eliminate noise. In order to obtain a noise-free image, a noisy image is transformed into PDE forms []. Some filtering methods such as the adaptive window diffusion (AWAD) [] are based on PDE, which is able to control the mask size and direction and shows good performance in edge preservation. However, the AWAD method that is based on a new diffusion function does not perform speckle denoising in homogeneous regions, so it has a low de-speckle performance.
In the field of fuzzy noise removal, Cheng et al. [] developed a denoising method of synthetic aperture radar images, which is based on fuzzy logic and estimates the fuzzy edges of each pixel in the filter window and uses these to weigh the contributions of neighboring pixels to perform fuzzy filtering. Nonetheless, it is appropriate only for images with large homogenous regions, which is its main drawback. In addition, Babu et al. [] proposed adaptive despeckling based on fuzzy logic for the classification of image regions. Then, the most appropriate filter was selected for the particular image region used only averaging and median filters, though.
The transform domain filters are mostly based on multi-resolution transforms such as Shearlet-domain SAR image denoising [] and wavelet-domain []. Because multiresolution filters are able to eliminate noise at different frequencies, they are employed for despeckling. However, because of some inherent flaws, the transform domain methods cause pixel distortion, so hybrid filters have become more popular. Zhang and Gunturk [] stated that noise may exist in the detailed and approximate sub-bands of images in the wavelet transform, so for speckle noise removal, different filters can be applied to individual sub-bands. Loganayagi et al. [] proposed a robust denoising method based on BF. In addition, Kumar et al. proposed speckle denoising using tetrolet wavelets []. Since the BF is a single resolution, not all frequency components of the image are available. Accordingly, the wavelet filter is used to form a scale-space for the noisy image. The wavelet filter decomposition is able to distinguish signal from noise at various scales []. Mehta proposed a method that exploits the wavelet filter features with the estimation ability of the Wiener filter. To achieve better performance, they used the adaptive Wiener filter (AWF) to denoise the components of the wavelet sub-bands. Zhang proposed ultrasound image denoising using a combination of bilateral filtering and stationary wavelet []. Speckle noise in the low-pass approximation and high-pass detail are filtered by the fast bilateral filter and wavelet thresholding, respectively. Sari et al. proposed a denoising method through the subsequent application of bilateral filters and wavelet thresholding []. In these mentioned hybrid articles, wavelet decomposition is employed to divide the information of an image into approximation sub-band and detail sub-bands. A bilateral or Wiener filter is applied in different positions of the sub-bands. These algorithms show low speckle noise suppression ability due to the low ability to choose the optimal position and optimal parameters of filters. However, it is impossible to completely remove speckle noise in the degraded image because both the noise and signal may have a continuous power spectrum. Therefore, denoising is performed through an MMSE filter. We used the AWF for despeckling and improved the AWF structure in order to increase noise reduction efficiency via EAWF. In addition, the main tool in image despeckling is an edge-aware method [], such as a guided filter (GF). It can be applied as an edge-preserving operator, such as the well-known BF, but functions better near to the edges. In this study, we improved the performance of GF with the proposed edge detection method. The extended guided filter (EGF) outcome shows better speckle noise removal than the GF outcome. We focused on despeckling SAR images using a hybrid combination of EAWF, EGF, and weighted least squares (WLS) filter to make it more efficient. First, the EAWF is applied to the input image. Then, a logarithmic transformation is applied to the resulting EAWF image in order to convert multiplicative noise into additive noise. Next, to remove the additive noise and preserve edge information, EGF is used. Finally, in order to eliminate speckle noise in homogeneous regions, the WLS filter is used (Figure 1). The organization of this study is as follows: The materials and methods are explained in Section 2. In Section 3, the proposed algorithm is shown. Experimental outcomes and experiments on real SAR images are described in Section 4 and Section 5. Finally, Computational Complexity, Discussion, and the concluding remarks are given in Section 6, Section 7 and Section 8 respectively.
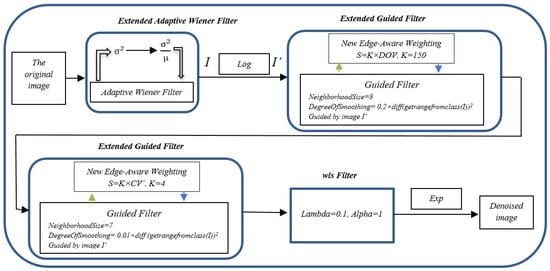
Figure 1.
The flow diagram of the proposed algorithm.
2. Materials and Methods
2.1. Measurement of Performance
After enhancement, the image quality was measured by comparing it with the noise-free images using some metrics. In Section 3, we use six parameters of PSNR, PFOM, SNR, SSIM, IQI, and MAE. In Section 5, we use one parameter of the equivalent number of look (ENL) and standard deviation (STD) and in the remaining sections we use two parameters of PSNR and SSIM. PSNR is an engineering term for the ratio between the maximum possible power of a signal and the power of corrupting noise that affects the fidelity of its representation. Next, SNR compares the level of the desired signal to the level of background noise and SSIM is a procedure to predict the perceived quality of digital television, cinematic pictures, and other kinds of digital images. In addition, IQI is considered the fourth parameter for assessing the quality of denoised images, and MAE is the average of all absolute errors for measuring the proximity of forecasts or predictions to the eventual outcomes. PFOM is Pratt’s figure of merit used here as an assessment criterion for the standard edge detectors.
2.2. Adaptive Wiener Filter
One of the first methods developed for denoising in digital images is based on Wiener filtering. If we assume (n1, n2) is a particular pixel location, the AWF is given by [].
where I is the input image, variance () and mean µ are locally estimated from the set ℵ of (N × M) local neighborhood of each pixel. So that
In addition, () is the variance of the noise.
2.3. Guided Filter
GF transforms the output qi for the guidance Ik.of the window , and k is the center pixel in the window, as follows:
where ωk is a square window with the size of (2r +1) × (2r +1) and linear coefficients of ak and bk are constants estimated from the window .
qi = akIk + bk’ ∀i ∈ ωk
Generally,
where ni and pi define the noise and input image, respectively. The linear coefficients can be estimated by minimizing the squared difference between the input pi and the output qi, as follows:
where is a normalization parameter. It can serve to prevent ak from becoming immeasurably large. The coefficients bk and ak can be solved by linear regression.
where and are the variance and the mean of the guidance image in the window and indicates the number of pixels in , and =. As and the window size adjustment, the noise is deleted and the edge regions are preserved.
qi = pi − ni
3. Proposed Algorithm
3.1. Improvement of Adaptive Wiener Filter
In Equation (1), we used the dispersion index instead of the variance. The dispersion index is for determining if a set of observed occurrences are clustered or dispersed. It is defined as the ratio of the variance to the mean.
To enhance performance, a dispersion index is also used to obtain the noise estimate instead of the variance. We can simplify Equation (10) in the form of Equation (11).
In fact, is almost the same as the noise but with a different sign. Meanwhile, speckle noise is a multiplicative noise. Therefore, noise has less of an effect in lower light intensity. By multiplying the mean in , a better approximation of noise is obtained (). Figure 2 shows the comparison between AWF, homogeneous adaptive Wiener filter (HAWF), and EAWF.

Figure 2.
(a) Noisy image (), (b) homogeneous adaptive Wiener filter (HAWF), (c) adaptive Wiener filter (AWF), (d) extended adaptive Wiener filter (EAWF).
To evaluate this method, we compared the EAWF and existing methods with PSNR, SSIM, IQI and Pratt’s FOM quantitative measurements (Figure 3). In this comparison, a 250x250 Lena image is used.
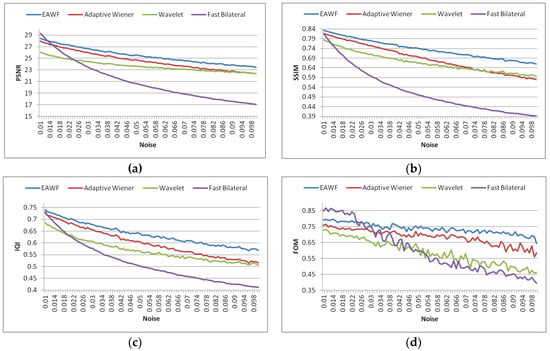
Figure 3.
Comparisons of the HAWF the EAWF, the homogeneous fast bilateral filter and the homogeneous wavelet filter with the PSNR, SSIM, IQI, and Pratt’s FOM quantitative measurements: (a) the EAWF and existing methods are compared by PSNR, (b) the EAWF and existing methods are compared by SSIM, (c) the EAWF and existing methods are compared by IQI, (d) the EAWF and existing methods are compared by Pratt’s FOM.
3.2. SAR Speckle Noise Model and Logarithmic Transformation
The following model is appropriate for images with multiplicative noise:
where f(x, y),g(x, y),ηm(x, y) and ηa(x, y) are the real noisy image, unknown noise-free image, and additive and multiplicative noise functions, respectively. Since additive noise is considered to be less than multiplicative noise, we considered Equation (13) for speckle noise.
where f(x, y) defines the SAR image degraded by speckle noise. g(x, y) indicates a radar scattering characteristic of the ground target (i.e., the noise-free image). ƞm(x,y) also defines the speckle due to fading. g(x,y) and ƞm(x,y) are independent. ƞm(x,y) conforms to a Gamma distribution where the variance is and the mean is one.
where N 0, L 1, and L is the equivalent number of looks (ENL), where a bigger L defines weaker speckling. The noise of the speckles present in images is the noise of multiplicative. Therefore, we preferred to carry out a logarithmic transform of the noisy image and multiplicative noise becomes addictive as it is shown in the following equation []:
f(x,y) = g(x,y).ƞm(x,y) + ƞa(x,y)
f(x,y) = g(x,y).ƞm(x,y)
Logf(x,y) = logg(x,y) + ƞm(x,y)
3.3. Extended Guided Filter
3.3.1. A New Edge-Aware Weighting
- 1.
- Coefficient of Variation
The coefficient of variation (CV) is determined as a ratio of standard deviation (σ) to the average (μ). Because the CV is unitless, the CV value is similar in extreme variances in regions with high intensity and low variances in regions with lower intensity. This leads to a similar function for regions with different brightness (Figure 4). The formula for CV is defined as follows:
Where Sa and ma are the standard deviation and mean, respectively. Therefore, high, low, and intermediate CV values correspond to ‘edges’, ‘homogenous’, and ‘detail’.

Figure 4.
Comparisons of the CV performance and performance of the Standard deviation of the image (a). Noisy image (b). the result of applying the Standard deviation on noisy image (c). the result of applying the CV on noisy image.
In order to better identify the edges, the mean of the image is added to the local mean.
where M is the mean of the image.
- 2.
- Difference of variances
The difference of variances (DoV) is the difference between the noise variance estimation and standard deviation of the local window, so homogeneous regions close to zero and edge regions have greater values.
where std (x) and estimate_noise (X) are the standard deviation of the local window (x) and the noise variance estimation of image (X), respectively. Its window size is w = (5 × 5). Figure 5 shows the outcome of DoVw=5 in different speckle noise. As can be seen, DoV5 is stable during changes in noise intensity.
DoVw = (std(x) - estimate_noise(X))
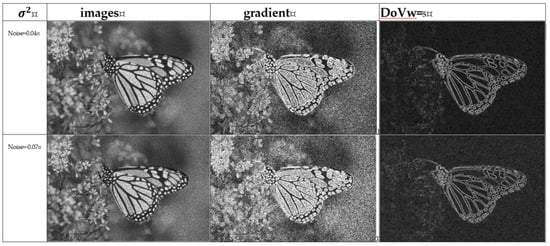
Figure 5.
The outcome of the difference of variances (DoV) in different speckle noise.
3.3.2. The Proposed Extended Guided Filter
We define the proposed edge-aware weighting (PEAW) s as follows:
where K is a constant obtained experimentally and S is combined into the cost function E(ak, bk). The criterion of a ”homogeneous area” or an ”edge area” is determined by the parameter and the areas with variance (σ2) < are smoothed, whilst the areas with variance (σ2) > are preserved. Therefore, by replacing ε with in Equation (6) it is possible to maintain the edge more efficiently. In addition, the window size of DoV is 5 and if w becomes greater than 5, the edges of the DoV image become blurry and the guide filter cannot smooth the homogeneous areas around the edges properly. As mentioned, an EGF minimizes the output qi and the input pi. Equation (20) shows a cost function with applied PEAW.
S = K × DOVw=5
The optimal value of and the optimal value are calculated as:
Finally, is defined as follows:
where is the mean values of and is within the window, respectively. Figure 6 shows the effect of a guide filter with DoV and without DoV on a Lena image.
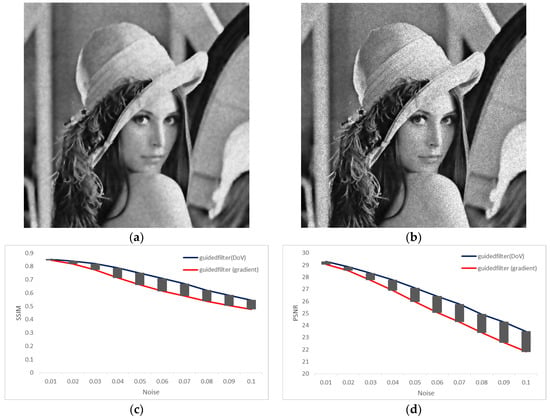
Figure 6.
Comparisons of the EGF performance and GF performance. (a) the result of EGF on noisy image; (b) the result of GF on noisy image; (c) Comparison of SSIM values for denoised image by EGF and SSIM values for denoised image by GF; (d) Comparison of PSNR values for denoised image by EGF and SSIM values for denoised image by GF.
4. Experimental Results
All the experimental outcomes are assessed in MATLAB = R2018b on Intel(R) Core(TM) i5-8500 CPU M 430 @ 3.0 GHz, 16 GB RAM and 64-bit operating system. Table 1 presents the simulation conditions for the proposed method.

Table 1.
Present the simulation conditions for the proposed method.
During the experimental work, simulation SAR images, real SAR images, and standard optical images impressed with speckles are used. In the simulation SAR outcomes, the presence of the speckle is already there in the reference SAR image, so the real effectiveness and strength of despeckling scheme is checked by experimenting with the proposed method in 14 standard optical images (i.e., ‘Lena’, ’Boat’,…) in speckle adding experiments instead of using SAR images that have already been impressed with speckle noise.
In the beginning, we used six standard images and the original images are shown in Figure 7. Speckle noise is added for speckle noise removal at noise (σ = 0.04 and number of looks L = 25).
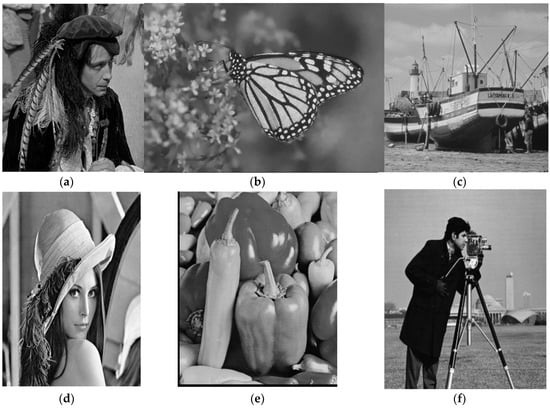
Figure 7.
(a) Man (512 × 512); (b) Monarch (748 × 512); (c) Boat (512 × 512); (d) Lena (512 × 512); (e) Peppers (512 × 512); (f) Cameraman (512 × 512);.
First, the EAWF was applied to the input image. Figure 8a–f shows three noisy images and EAWF outcomes. Then, a logarithmic transformation was applied to the resulting EAWF image in order to convert multiplicative noise into additive noise. Next, to remove the additive noise and preserve edge information, EGF was used. Figure 8j–l shows the application of EGF for the first time with s = K × DoV, K = 150, where the filtering process is guided by image G which is the outcome of EAWF. As can be seen in Figure 8j–l, after applying the EGF on the image, some spots appear on homogeneous areas, which can be reduced by re-applying the EGF with different windows. The use of CV will be useful for softening the areas with high homogeneity (Figure 8m–o). In order to avoid over-softening, the parameters of this filter are also considered to be in small amounts. In addition, if the WLS filter is applied, after the first use of EGF, adjusting the WLS filter parameters leads to the removal of image details to achieve the desired ENL. Therefore, the EGF is applied to the image for the second time with s = K × CV’, K = 4 (Figure 8p–r), where the filtering process is guided by image G which is the outcome of the EAWF. Finally, in order to achieve the desired ENL, WLS Filter is applied to a homogenous region of the image (Figure 8s–u). Equation (24–26) shows the steps of applying the WLS filter to homogeneous regions.
where I is the result of the EGF despeckling. Figure 8s–u shows the final outcome of image despeckling.
Homogenous region = (1-CV’)
Edge region = CV’
Denoised image = WLS (I× (1-CV’)) + I × (CV’)
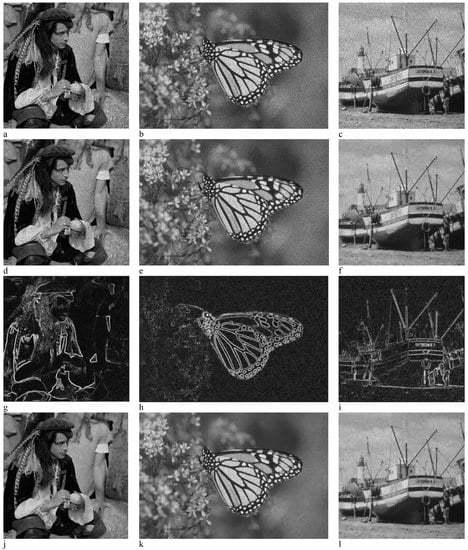
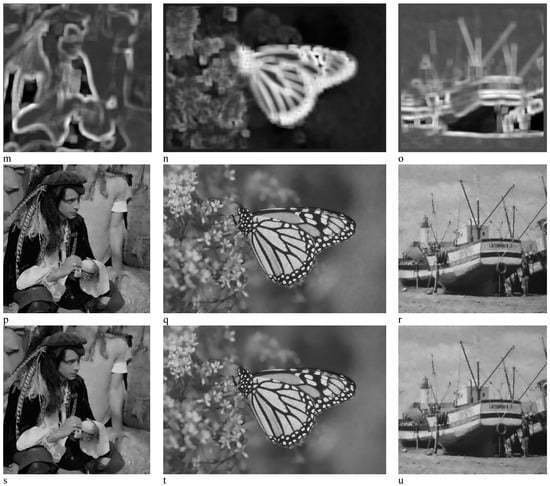
Figure 8.
Proposed filter steps. (a–c) Noisy image; (d–f) Applying the EAWF; (g–i) DOV with window = (5 × 5); (j–l) Applying the EGF for the first time; (m–o) CV’ with window= (21 × 21); (p–r) Applying the EGF for the second time; (s–u) Final outcome of image despeckling.
To mention the advantages of EAWF and EGF in the proposed method, we studied the performance of the sub-filters of the proposed method. The denoising result of EAWF+EGF+WLS, EGF+WLS, and EAWF+WLS are shown step by step in Table 2 to verify the correctness and necessity of the designed components in the proposed method. Table 2 shows ENL, PSNR (dB), STD, and SSIM values of the despeckled standard images using the sub-filters of the proposed method. The ENL measures the degree of speckle reduction in a homogenous area. Generally, a higher ENL value corresponds to better speckle elimination but a large STD corresponds to higher speckle noise

Table 2.
The sub-filters performance of the proposed method.
According to Table 2, the denoising performance of EGF+WLS filter is reduced for the monarch image (PSNR = 25.86506 (-12.67%), SSIM = 25.86 (-21.57%), ENL = 230.84 (-90.34%) and STD = 0.030 (-64.44%)). In other images, the conditions are the same. The mean of the decline rate in EGF+WLS filter is reduced (PSNR = -12.53%, SSIM = -24.15%, ENL = -88.83% and STD = -66.25%). Therefore, the use of EAWF can increase PSNR by 12.53%, SSIM by 24.15%, ENL by 88.83% and STD by -66.25%. On the other hand, the use of EGF can increase PSNR by 3.32%, SSIM by 10.06%, ENL by 82.73% and STD by -58.80%. As can be seen from the mean of the decline rate in Table 2, the EAWF+ WLS filter has a better performance compared to the EGF + WLS filter. Thus, the EAWF is more efficient than EGF. Since EAWF+ EGF+ WLS has the best performance, the combination of these filters is synergistic and compensates for individual weaknesses. When considering the EAWF + EGF + WLS, the PSNR value may be slightly reduced by adding filters (Monarch, Man, Boat, Peppers, and Cameraman). This decrease is less than 2%, but the ENL value is increased by adding filters for all images. This increase is between 41% and 329% for the monarch image, between 22% and 476% for the man image, between 40% and 318% for the Boat image, between 29% and 647% for the Lena image, between 14% and 340% for the Peppers image, and between 13% and 506% for the Cameraman image. In addition, the STD value is improved similarly to ENL but the SSIM changes are minor.
In the next comparison, we used 14 standard images. The original images are shown in Figure 9. Speckle noise is added for speckle noise removal at noise (σ = 0.04 and number of looks L = 25). The standard methods used for comparison between different filters are SAR-BM3D [], NLM [], WLS [], bitonic [], guided [], Lee [], Frost [], anisotropic diffusion filter with memory based on speckle statistics (ADMSS) [], non-local low-rank (NLLR) [], SRAD-guided [], SRAD [], and Choi et al. []. Table 3 illustrates the optimal parameters of existing filters.
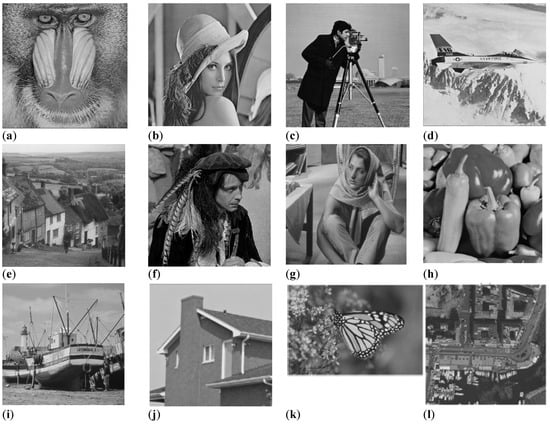
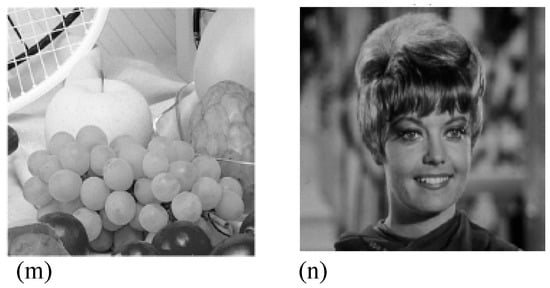
Figure 9.
Test images. (a) Baboon (512 × 512); (b) Lena (512 × 512); (c) Cameraman (256 × 256); (d) Airplane (512 × 512); (e) Hill (512 × 512); (f) Man (512 × 512); (g) Barbara (512 × 512); (h) Peppers (256 × 256); (i) Boat (512 × 512); (j) House (256 × 256); (k) Monarch (748 × 512); (l) Napoli (512 × 512); (m) Fruits (512 × 512); (n) Zelda (512 × 512).

Table 3.
The optimal parameters of existing filters in standard images.
Table 4 and Table 5 show the SSIM and PSNR values of the despeckled standard images using the proposed and the standard methods. The best value of the SSIM and PSNR are shown in bold and the second-best value of the SSIM and PSNR are shown in red color

Table 4.
Peak signal-to-noise (PSNR) (in dB) results for each standard image (The best value is shown in bold and the second-best value is shown in red color).

Table 5.
Structural similarity (SSIM) results for each standard image (The best value is shown in bold and the second-best value is shown in red color).
The SAR-BM3D filter shows the best despeckling in the Barbara image (PSNR = 28.32 dB - the best value), Airplane image (PSNR = 28.10 dB - the best value), Hill image (PSNR = 28.30 dB - the best value), and House image (PSNR = 29.83 dB - the best value). Nevertheless, the proposed method in the Barbara image, Airplane image, and House image demonstrate second-best values. The proposed method of Choi et al. [] shows the best despeckling in the Lena image (PSNR = 30.13 dB), Man image (PSNR = 28.55 dB), Monarch image (PSNR = 29.64 dB), and Zelda image (PSNR = 32.77 dB). However, SAR-BM3D in the Lena image shows slightly smaller values of PSNR than the method proposed by Choi et al. (PSNR = 29.91 dB - second-best value) and the proposed method in the Man image (PSNR = 28.00 dB), Monarch image (PSNR = 29.59 dB), and Zelda image (PSNR = 32.58 dB) show second-best values. The PSNR values of the proposed method exhibit the best performance of despeckling in the images (Boat = 28.24 dB; Cameraman = 28.43 dB; Fruits = 27.79 dB; Napoli = 26.83 dB and Peppers = 28.53 dB)
The SSIM values of the proposed and the standard methods are shown in Table 5. As can be seen, the SRAD filter provides the best edge preservation performance in Baboon = 0.65 and Hill= 0.73 and the proposed method of Choi et al. provides the best edge preservation performance in Fruits = 0.78 and Hill = 0.73. SAR-BM3D provide the highest edge preservation performance, with Zelda = 0.87, Monarch = 0.90, House = 0.84, Hill = 0.73 Fruits = 0.78, Barbara = 0.84, and Airplane = 0.84. The proposed method exhibits the best edge preservation performance in Airplane = 0.84, Boat = 0.79; Cameraman = 0.82; Fruits = 0.78, Lena = 0.85; Man = 0.78; Monarch = 0.90; Napoli = 0.80; and Peppers = 0.85. The proposed method and SAR-BM3D exhibit the same edge preservation performance in Monarch = 0.90, Fruits = 0.78, and Airplane = 0.84. Table 4 and Table 5 confirm that the proposed method outcomes represent an excellent performance compared to the existing standard methods. Table 6 shows the number of the best, the second best, and the sum of both.

Table 6.
The number of best, second best, and the sum of both.
As shown in Table 6, the performance of the proposed method is better than other methods. Figure 10 exhibits the comparison among the filtering result images of GF, Frost, Lee, bitonic, WLS, NLLR, ADMSS, SRAD, SRAD-Guided, SAR-BM3D filters, the proposed method of Choi et al., and our proposed method, respectively.
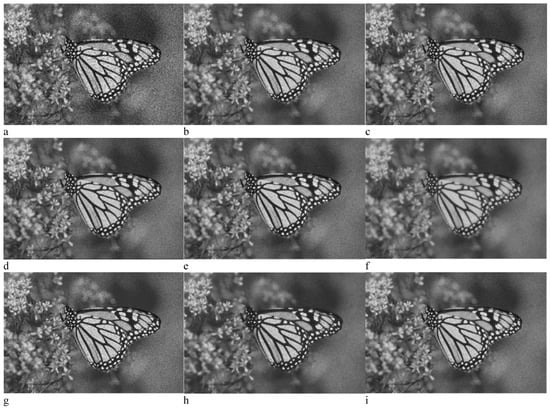
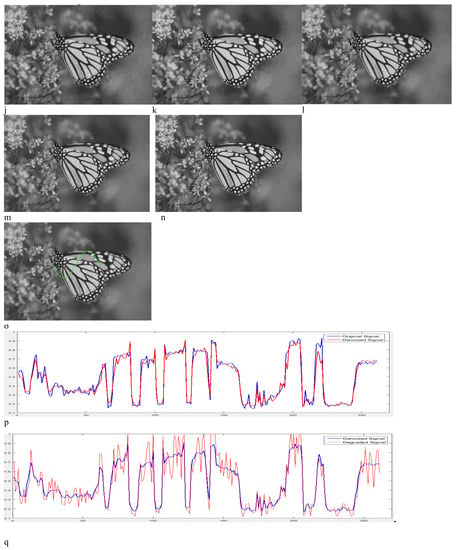
Figure 10.
Performance comparison of different techniques using the Monarch image. (a) Noisy; (b) guided; (c) Frost; (d) Lee; (e) bitonic; (f) WLS; (g) NLLR; (h) ADMSS; (i) SRAD; (j) SRAD-guided; (k) SARBM3D; and (l) proposed method of Hyunho Choi et al. (m) Proposed method, (n) original image, (o) signal on image, (p) comparison of the original signal and denoised signal, (q) comparison of the denoised signal and degraded signal.
In Figure 10b–e and 10g–i, the noise of speckle residue is represented in homogeneous areas. Speckle noise reduction performance of the SRAD-guided and the WLS methods are better than the GF, Frost, Lee, Bitonic, NLLR, ADMSS, and SRAD methods, as these methods show a blurring in the image. The visual quality and edge reservation performance of the method proposed by Choi et al. and SAR-BM3D filters are also excellent, but these filters show artifacts in the homogeneous area (Figure 10k–l). As can be seen, the proposed method exhibits robust denoising and edge preservation abilities.
5. Experiments on Real SAR Images
To consider the actual performance of the proposed filter, we examined the proposed filter in the real SAR image. In this section, three SAR images are described (Figure 11, Figure 12, and Figure 13). The actual SAR image depicts a rural scene (512 × 512) [], capitol building scene (1232 × 803), and an image of a C-130s on a flight line (600 × 418) []. Table 7 shows that the proposed method has the best performance in terms of ENL. The WLS filter also has the second rank in speckle noise suppression performance. For SAR images, the level of noise is related to L. When the look number is not known, finding the mean of several ENL is a common way to obtain the L []. According to Table 7, the estimated look number is L = 15.
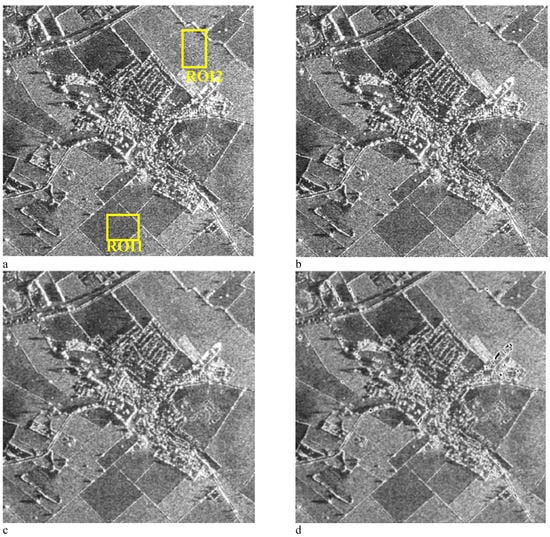
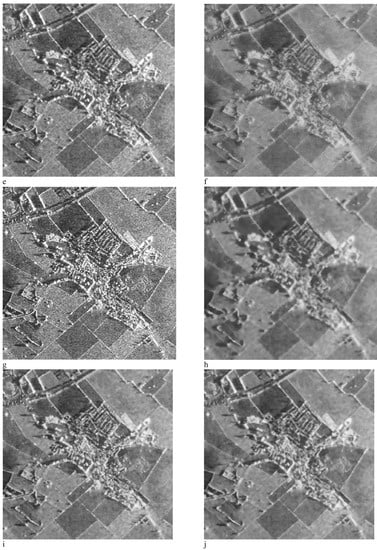
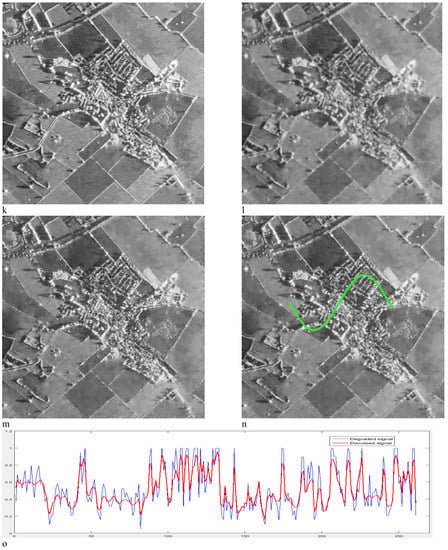
Figure 11.
Performance comparison of different techniques in SAR image 2. (a) Noisy; (b) guided; (c) Frost; (d) Lee; (e) bitonic; (f) WLS; (g) NLLR; (h) ADMSS; (i) SRAD; (j) SRAD-guided; (k) SAR-BM3D; and (l) proposed method of Choi et al. (m) Proposed method, (n) signal on image (o) Comparison of the denoised signal and degraded signal.
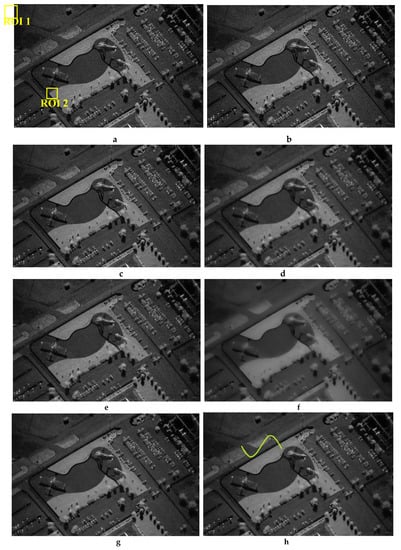
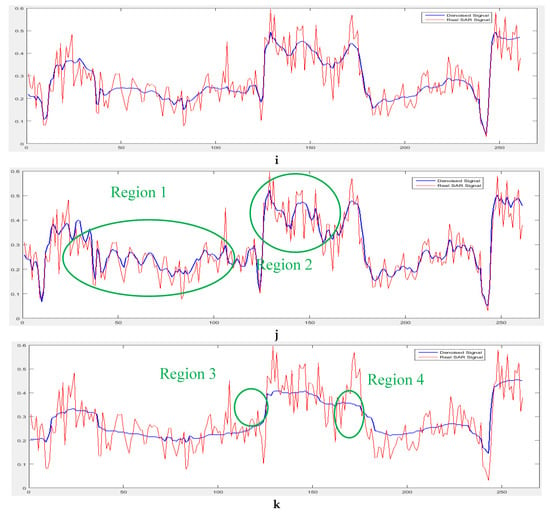
Figure 12.
(a) Real SAR image 2, (b) denoised SAR image by DPAD filter, (c) denoised SAR image by SAR-BM3D filter, (d) denoised SAR image by fast bilateral filter, (e) denoised SAR image by bilateral filter, (f) denoised SAR image by WLS filter, (g) denoised SAR image by the proposed method, (h) signal on proposed denoised image, (i) comparison of proposed denoised signal and degraded signal, (j) Comparison of SAR-BM3D denoised signal and degraded signal, (k) comparison of WLS filter denoised signal and degraded signal.
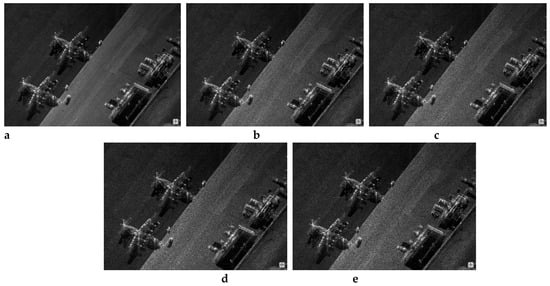
Figure 13.
(a) SAR image, (b) noisy image (noise variance = 0.04), (c) noisy image (noise variance = 0.06), (d) Noisy image (noise variance = 0.08), (e) noisy image (noise variance = 0.1).

Table 7.
Equivalent number of looks (ENL) results for SAR image 1.
Figure 11 shows the outcomes of despeckled filters, demonstrating that some methods, like guided, Frost, Lee, bitonic, NLLR, and SRAD, do not have a strong robust denoising ability (Figure 11b–e,g,i). Table 7 shows that the proposed method demonstrates the best ENL value and WLS exhibits second-best ENL value, but it shows a blurring phenomenon (Figure 11f). Compared with SAR-BM3D and Choi et al. proposed method, the SAR-guided method exhibits lower edge preservation and denoising performances. The SAR-BM3D and Choi et al. methods have good edge preservation and despeckling performance; meanwhile, artifacts in the homogeneous areas are noticeable (Figure 11k). A comparison of the proposed method with Choi et al. and SAR-BM3D filters shows that the proposed method has a better edge preservation performance (Figure 11m).
In the following, another real SAR image is evaluated by ENL and STD (Figure 12, Table 8). Generally, a large STD corresponds to higher speckle noise. The standard methods used for comparison are GF, SAR-BM3D, Bilateral filter, Fast Bilateral filter, WLS, DPAD, DPAD, and the proposed method of Fang et al. []. Table 9 presents the parameters of different filters.

Table 8.
ENL and STD results for SAR image 2.

Table 9.
The parameters of different filters used in this comparison.
Figure 12 exhibits that bilateral filter does not show strong despeckling ability (Figure 12e). The WLS and fast bilateral filter show a blurring phenomenon in the despeckled image (Figure 12d–f). Based on Table 8, the proposed method represents the second-best ENL and STD values. However, it exhibits excellent performance in edge preservation abilities (Figure 12g). According to Table 8, the estimated look number is 23. Table 8 shows that the filter SAR-BM3D has a good performance but, as can be seen in Figure 12—region1 and Figure 12—region 2, sharp changes in the homogeneous area lead to artifacts in the homogeneous areas. Table 8 shows that WLS represents the best ENL and STD values. In order to compare the proposed method and WLS filter, we examined the pixel changes of these two filters and the real SAR image. WLS filter shows a smoothing at the edge area (Figure 12—region 3 and Figure 12—region 4) but the proposed method can preserve the edges of the image.
In the simulated SAR image experiment, the generation of speckle noise is performed through modeling of the multiplicative speckle noise using Equation (14). The noise distribution in the actual SAR images is unknown. Therefore, the actual SAR images are not possible to test the algorithm at different noise variances. For this purpose, the concept of simulated SAR images is introduced []. Furthermore, a simulated SAR image is evaluated by PSNR, SNR, SSIM, and MAE (Table 10). Figure 13 shows the original SAR image and the noisy image, respectively, whose number of looks L=25, 16, 12, and 10, and the variance of the noise, were 0.04, 0.06, 0.08, and 0.1. The purpose of showing the outcome in the simulated SAR image is to test the validity, robustness, effectiveness, and adaptive features of the despeckling method at diverse noise variances. The despeckling is applied to a speckled SAR image (600 × 418) to validate the efficiency of the proposed method.

Table 10.
PSNR, SNR, SSIM, and MAE results for SAR image 3 (The best value is shown in bold and the second-best value is shown in red color).
According to Table 10, the proposed method achieved the best results in the three evaluation indexes of SNR, PSNR, and MAE when noise variance is 0.06, 0.08, and 0.1. Table 10 shows that the proposed method represents the second-best SSIM values when noise variance is 0.04 and 0.08. This means that this algorithm showed satisfactory results. Generally, the proposed method can preserve the edges of the image, suppress the noise effectively, and retain the edge details to some extent.
6. Computational Complexity
The time consumption of the proposed and the standard methods for 17 images are shown in Table 11, Table 12, Table 13, Table 14, Table 15, Table 16, Table 17 and Table 18. According to Table 11, Table 12, and Table 13, the proposed method is faster than Lee, NLLR, ADMSS, SRAD, SRAD-guided, SAR-BM3D, and Choi et al. In addition, according to Table 14 and Table 16, the proposed method is faster than the bilateral filter, DPDA, SRAD, SRAD-guided, SAR-BM3D, and Fang et al. The average time cost of the proposed method with fourteen images and three SAR images is about 1.92 s, 2.76 s, 11.20 s, and 3.31 s, respectively. In addition, for precise examination, the runtimes of all sub-filters of the proposed method are studied (Table 12, Table 15, Table 16 and Table 18)

Table 11.
Computational complexity results (in seconds) of the despeckling methods for each standard image (512 × 512 and 256 × 256). (the second-best value is shown in red color.).

Table 12.
The runtime of all the filters in the proposed method. (the second-best value is shown in red color.).

Table 13.
Computational complexity results of the despeckling methods for the real SAR images 1 (512 × 512).

Table 14.
Computational complexity results of the despeckling methods for the real SAR image 2 (1323 × 803).

Table 15.
Computational complexity results of all the filters in the proposed method for the real SAR image 1 (512 × 512);.

Table 16.
Computational complexity results of all the filters in the proposed method for the real SAR image 2 (1323 × 803).

Table 17.
Computational complexity results of the despeckling methods for the real SAR images 3 (600 × 418).

Table 18.
Computational complexity results of all the filters in the proposed method for the real SAR image 3 (600 × 418).
7. Discussion
This study used the EAWF, EGF, and WLS filters for the despeckling of SAR images. The most conventional methods are developed for additive white Gaussian noise. Therefore, additive noise in sensing systems and imaging is common. Since speckle noise is a multiplicative noise, EAWF is employed to reduce noise levels and increase PNSR.
During the experimental work, the simulation SAR images, real SAR images, and standard optical images impressed with speckles are used. To consider the actual performance of the proposed filter, we examined the proposed filter in the real SAR image. The purpose of using the simulated SAR image is to test the validity, robustness, effectiveness, and adaptive feature of the despeckling method at diverse noise variances. In the simulation SAR outcomes, the presence of the speckle is already there in the reference SAR image, so the real effectiveness and strength of the despeckling scheme are checked by standard optical images impressed with speckles. According to Table 2, the use of EAWF can increase PSNR by 12.53%, SSIM by 24.15%, ENL by 88.83%, and STD by −66.25%. On the other hand, the use of EGF can increase PSNR by 3.32%, SSIM by 10.06%, ENL by 82.73%, and STD by -58.80%. Thus, the EAWF is more efficient than EGF. Since EAWF + EGF + WLS has the best performance, the combination of these filters is synergistic. When considering EAWF + EGF + WLS, the increase in PSNR value may be slight (about 2%), but the ENL value is increased between 41% and 329% for the Monarch image, between 22% and 476% for the Man image, between 40% and 318% for the Boat image, between 29% and 647% for the Lena image, between 14% and 340% for the Peppers image, and between 13% and 506% for Cameraman image.
The EGF shows excellent noise removal and edge preservation. As can be seen in Figure 6, the new edge-aware EGF filter is better than classic GF. According to Table 7, the WLS filter exhibits the best ENL value (between all filters except the proposed method) and edge preservation performance. Therefore, we adopted the WLS method to increase ENL. As shown in Table 4, Table 5, and Table 6, the proposed method has the best outcome in PNSR (5 best and 7 second best—the PSNR values of the proposed method exhibit the best performance of de-speckling in the images (Boat = 28.24 dB; Cameraman = 28.43 dB; Fruits = 27.79 dB; Napoli = 26.83 dB and Peppers = 28.53 dB)) and SSIM (9 best and 4 second best—the proposed method exhibits the best edge preservation performance in Airplane = 0.84, Boat = 0.79; Cameraman = 0.82; Fruits = 0.78, Lena = 0.85; Man = 0.78; Monarch = 0.90; Napoli = 0.80; and Peppers = 0.85). In SAR image 1, the proposed method demonstrates the best ENL value in Table 7. In SAR image 2, the proposed method has second-best ENL and STD values in Table 8. In SAR image 3, according to Table 10, the proposed method achieved the best results in the three evaluation indexes of SNR, PSNR, and MAE, when the noise variance is 0.06, 0.08, and 0.1. It also shows that the proposed method represents the second-best SSIM values when noise variance is 0.04 and 0.08. According to Table 11, Table 12, Table 13, Table 14, Table 15 and Table 16, the proposed method is faster than Lee, NLLR, ADMSS, SRAD, SRAD-guided, SAR-BM3D, Bilateral filter, DPAD, the proposed method of Fang et al., and the proposed method of Choi et al. The average time cost of the proposed method for fourteen images and three SAR images is about 1.92 s (image size: 512 × 512 and 256 × 256), 2.76 s (image size: 512 × 512), 11. 20 s (image size: 1323 × 803) and 3.31 s (image size: 600 × 418) respectively. The experimental outcome shows that the proposed method exhibits outstanding despeckling and low time complexity while preserving edge information.
8. Conclusions
We propose a hybrid filter based on EAWF, EGF, and WLS Filter to remove the speckle noise. For this purpose, the EAWF method was used as a preprocessing filter. EAWF is applied to the SAR image, directly. After that, the logarithmic transform was applied to create additive noise from the multiplicative noise. We also developed GF based on new edge-aware weighting. The proposed EGF can remove the additive noise and preserve the edge information more efficiently than GF. After applying the EGF to the image, some spots appear in homogeneous areas, which can be reduced by re-applying the EGF with different windows. Finally, in order to achieve the desired ENL, the WLS Filter is applied to a homogenous region of the image. For better evaluation, we used the simulation SAR images, real SAR images, and standard optical images with speckle noise. The experimental outcome shows that the proposed method has the best despeckling and edge preservation and has an acceptable runtime as well.
Author Contributions
H.S. wrote this paper and implemented the simulation. J.V. and T.A. examined and analyzed the results and A.K. and S.Y.B.R. edited this paper edited this paper. All authors have read and agreed to the published version of the manuscript.
Funding
This paper was not funded.
Conflicts of Interest
The authors declare no conflict of interest.
References
- Choi:, H.; Jeong, J. Speckle Noise Reduction Technique for SAR Images Using Statistical Characteristics of Speckle Noise and Discrete Wavelet Transform. Remote Sens. 2019, 11, 1184. [Google Scholar] [CrossRef]
- Lopes, A.; Touzi, R.; Nezry, E. Adaptive speckle filters and scene heterogeneity. IEEE Trans. Geosci. Remote Sens. 1990, 28, 992–1000. [Google Scholar] [CrossRef]
- Lee, J.S. Refined filtering of image noise using local statistics. Comput. Graph. Image Process. 1981, 15, 380–389. [Google Scholar] [CrossRef]
- Liu, s.; Liu, T.; Gao, L.; Li, H.; Hu, Q.; Zhao, J.; Wang, C. Convolution neural network and guided filtering for sar image denoising. Remote Sens. 2019, 11, 702. [Google Scholar] [CrossRef]
- Liu, S.; Hu, Q.; Li, P.; Zhao, J.; Zhu, Z. SAR image denoising based on patch ordering in nonsubsample shearlet domain. Turk. J. Electr. Eng. Comput. Sci. 2018, 26, 1860–1870. [Google Scholar] [CrossRef]
- Li, S.; Kang, X.D.; Fang, L.; Hu, J.; Yin, H. Pixel-level image fusion: A survey of the state of the art. Inform. Fusion. 2017, 33, 100–112. [Google Scholar] [CrossRef]
- Barash, D.A. Fundamental relationship between bilateral filtering, adaptive smoothing and the nonlinear diffusion equation. IEEE Trans. Pattern Anal. Machine Intell. 2002, 24, 844–867. [Google Scholar] [CrossRef]
- Tomasi, C.; Manduchi, R. Bilateral Filtering for Gray and Color Images. In Proceedings of the Sixth International Conference on Computer Vision, Bombay, India, 4–7 January 1998; pp. 839–846. [Google Scholar]
- Liu, G.; Zhong, H. Nonlocal Means Filter for Polarimetric SAR Data Despeckling Based on Discriminative Similarity Measure 2014; Volume: 11, Issue: 2, pp. 514 - 518. IEEE Geosci. Remote Sens. Letters 2014, 11, 514–518. [Google Scholar] [CrossRef]
- Zhang, M.; Gunturk, B.K. Multiresolution Bilateral Filtering for Image Denoising. IEEE Trans. Image Process. 2008, 17, 2324–2333. [Google Scholar] [CrossRef]
- Anantrasirichai, N.; Nicholson, L.; Morgan, J.E.; Erchova, I.; Mortlock, K.; North, R.V.; Albon, J.; Achim, A. Adaptive-weighted bilateral filtering and other pre-processing techniques for optical coherence tomography. Comput. Med. Imaging Graph. 2014, 38, 526–539. [Google Scholar] [CrossRef]
- Torres, L.; Sant’Anna, S.J.S.; Freitas, C.D.C.; Frery, C. Speckle reduction in polarimetric SAR imagery with stochastic distances and nonlocal means. Pattern Recognit. 2014, 47, 141–157. [Google Scholar] [CrossRef]
- Martín-de-Nicolás, J.; Jarabo-Amores, M.; Mata-Moya, D.; del-Rey-Maestre, N.; Bárcena-Humanes, J. Statistical analysis of SAR sea clutter for classification purposes. Remote Sens. 2014, 6, 9379–9411. [Google Scholar] [CrossRef]
- Xu, W.; Tang, C.; Gu, F.; Cheng, J. Combination of oriented partial differential equation and shearlet transform for denoising in electronic speckle pattern interferometry fringe patters. Appl. Opt. 2017, 56, 2843–2850. [Google Scholar] [CrossRef] [PubMed]
- Li, J.C.; Ma, Z.H.; Peng, Y.X.; Huang, H. Speckle reduction by image entropy anisotropic diffusion. Acta Phys. Sin. 2013, 62, 099501. [Google Scholar]
- Cheng, H.; Tian, J. Speckle reduction of synthetic aperture radar images basedon fuzzy logic. In Proceedings of the First International Workshop on Education Technology and Computer Science, IEEE Computer Society, Wuhan, China, 7–8 March 2009; pp. 933–937. [Google Scholar]
- Babu, J.J.J.; Sudha, G.F. Adaptive speckle reduction in ultrasound images using fuzzy logic on Coefficient of Variation. Biomed. Signal Processing and Control. 2016, 23, 93–103. [Google Scholar] [CrossRef]
- Rezaei, H.; Karami, A. SAR image denoising using homomorphic and shearlet transforms. In Proceedings of the International Conference on Pattern Recognition & Image Analysis, Shahrekord, Iran, 19–20 April 2017; pp. 1–5. [Google Scholar]
- Min, D.; Cheng, P.; Chan, A.K.; Loguinov, D. Bayesian wavelet shrinkage with edge detection for SAR image despeckling. IEEE Trans. Geosci. Remote Sens. 2004, 42, 1642–1648. [Google Scholar] [CrossRef]
- Loganayagi, T.; Kashwan, K.R.A. Robust edge preserving bilateral filter for ultrasound kidney image. Indian J Sci Technol. 2015, 8, 1–10. [Google Scholar] [CrossRef][Green Version]
- Kumar, M.; Diwakar, M. CT Image Denoising Using Locally Adaptive Shrinkage Rule In Tetrolet Domain. J. King Saud Univ. – Comput. Inf. Sci. 2016, 30, 41–50. [Google Scholar] [CrossRef]
- Mehta, S. Speckle noise reduction using hybrid wavelet packets-Wiener filter. Int. J. Comput. Sci. Eng. 2017, 5, 95–99. [Google Scholar] [CrossRef]
- Zhang, J.; Lin, G.; Wu, L.; Wang, C.; Cheng, Y. Wavelet and fast bilateral filter based de-speckling method for medical ultrasound images. Biomed. signal processing and control. 2015, 18, 1–10. [Google Scholar] [CrossRef]
- Sari, S.; Al Fakkri, S.Z.H.; Roslan, H.; Tukiran, Z. Development of denoising method for digital image in low-light condition. In Proceedings of the IEEE International Conference on Control System, Computing and Engineering, Penang, Malaysia, 29 November–1 December 2013. [Google Scholar]
- Dai, L.; Yuan, M.; Tang, L.; Xie, Y.; Zhang, X.; Tang, J. Interpreting and extending the guided filter via cyclic coordinate descent. IEEE Trans. Image Process. 2019, 28, 767–778. [Google Scholar] [CrossRef] [PubMed]
- Loizou, C.P.; Pattichis, C.S. Despeckle filtering for ultrasound imaging and video, Volume I: Algorithms and Software; Second Ed. Morgan & Claypool Publishers: San Rafael, CA, USA, 2015. [Google Scholar]
- Xue, B.; Huang, Y.; Yang, J.; Shi, L.; Zhan, Y.; Cao, X. Fast nonlocal remote sensing image denoising using cosine integral images. IEEE Geosci. Remote Sens. Lett. 2013, 10, 1309–1313. [Google Scholar] [CrossRef]
- Parrilli, S.; Poderico, M.; Angelino, C.V.; Verdoliva, L. A nonlocal SAR image denoising algorithm based on LLMMSE wavelet shrinkage. IEEE Trans. Geosci. Remote Sens. 2012, 50, 606–616. [Google Scholar] [CrossRef]
- Buades, A.; Coll, B.; Morel, J.-M. A non-local algorithm for image denoising. In Proceedings of the 2005 IEEE Computer Society Conference on Computer Vision and Pattern Recognition, San Diego, CA, USA, 20–25 June 2005; pp. 60–65. [Google Scholar]
- Farbman, Z.; Fattal, R.; Lischinski, D.; Szeliski, R. Edge-preserving decomposition for multi-scale tone and detail manipulation. ACM Trans. Graph. 2008, 27, 1–67. [Google Scholar] [CrossRef]
- Treece, G. The bitonic filter: Linear filtering in an edge-preserving morphological framework. IEEE Trans. Image Process. 2016, 25, 5199–5211. [Google Scholar] [CrossRef] [PubMed]
- He, K.; Sun, J.; Tang, X. Guided image filtering. IEEE Trans. Pattern Anal. Mach. Intell. 2013, 35, 1397–1409. [Google Scholar] [CrossRef]
- Lee, S.T. Digital image enhancement and noise filtering by use of local statistics. IEEE Trans. Pattern Anal. Mach. Intell. 1980, 2, 165–168. [Google Scholar] [CrossRef]
- Frost, V.S.; Stiles, J.A.; Shanmugan, K.S.; Holtzman, J.C. A model for radar images and its application to adaptive digital filtering of multiplicative noise. IEEE Trans. Pattern Anal. Mach. Intell. 1982, 4, 66–157. [Google Scholar] [CrossRef]
- Ramos-Llordén, G.; Vegas-Sánchez-Ferrero, G.; Martin-Fernández, M.; Alberola-López, C.; Aja-Fernández, S. Anisotropic diffusion filter with memory based on speckle statistics for ultrasound images. IEEE Trans. Image Process. 2015, 24, 345–358. [Google Scholar] [CrossRef]
- Zhu, L.; Fu, C.-W.; Brown, M.S.; Heng, P.-A. A non-local low-rank framework for ultrasound speckle reduction. In Proceedings of the 2017 IEEE Conference on Computer Vision and Pattern Recognition, Honolulu, HI, USA, 21–26 July 2017; pp. 5650–5658. [Google Scholar]
- Hyunho, C.; Jechang, J. Speckle noise reduction in ultrasound images using SRAD and guided filter. In Proceedings of the International Workshop on Advanced Image Technology, Chiang Mai, Thailand, 7–9 January 2018; pp. 1–4. [Google Scholar]
- Yu, Y.; Acton, S.T. Speckle reducing anisotropic diffusion. IEEE Trans. Image Process. 2002, 11, 1260–1270. [Google Scholar]
- Dataset of Standard 512X512 Grayscale Test Images. Available online: http://decsai.ugr.es/cvg/CG/base.htm (accessed on 30 December 2018).
- Dataset of Standard Test Images. Available online: https://www.sandia.gov/RADAR/imagery/#xBand2 (accessed on 20 September 2019).
- Pan, T.; Peng, D.; Yang, W.; Li, H.-C. A Filter for SAR Image Despeckling Using Pre-Trained Convolutional Neural Network Model. Remote Sens. 2019, 11, 2379. [Google Scholar] [CrossRef]
- Fang, j.; Hu, S.; Ma, X. A Boosting SAR Image Despeckling Method Based on Non-Local Weighted Group Low-Rank Representation. Sensors 2018, 18, 3448. [Google Scholar] [CrossRef]
- Singh, P.; Shree, R. A new SAR image despeckling using directional smoothing filter and method noise thresholding. Eng. Sci. Technol. Int. Journal 2018, 21, 589–610. [Google Scholar] [CrossRef]
© 2020 by the authors. Licensee MDPI, Basel, Switzerland. This article is an open access article distributed under the terms and conditions of the Creative Commons Attribution (CC BY) license (http://creativecommons.org/licenses/by/4.0/).