Abstract
Western Bahia, Brazil, is a classic example of a region where intense irrigation growth has led to acute water stress situations in a few small basins. The water stress problem has the potential to grow regionally. However, there are currently no systematic field measurements of water withdrawn from rivers or groundwater to supply irrigation systems. In this work, we merge remote sensing and river gauge data to assess both the amount of water used for irrigation in Western Bahia and also its consequences for regional water stress, identifying water conflict situations and assessing water security. Remote sensing products used include time series of the normalized difference vegetation index, evapotranspiration, and rainfall. Field data include time series of river discharge and calibration data for crop status and actual evapotranspiration. From calibrated remote sensing products, three-day water balances were calculated for each center pivot using computations of irrigation depth and water uptake for irrigation, both individually at the center-pivot scale and integrated regionally. From these regional integrations, a simple water-use diagnostic indicated that three sub-basins presented the most critical conditions for water conflicts. An in-depth analysis of these sub-basins shows that, despite the high water stress, water use for irrigation has been steadily increasing, pushing the water use to its limits. This work demonstrates that the use of remote sensing products together with field data is a powerful tool for diagnosing water conflict situations. The limitations of this work relate to the absence of field data to validate the water uptake estimated and to the lack of additional long-term and high-quality river flow stations to provide diagnostics for all small basins in the region.
1. Introduction
The irrigated area in Brazil has more than doubled from 3.1 Mha in 1996 to 6.9 Mha in 2015 [1]. This increase was mainly concentrated in a few regions that provided excellent conditions for agricultural growth, such as flat topography, availability of surface water and groundwater, and power infrastructure. One of these regions is the western part of the state of Bahia (Figure 1). Irrigation in this region increased by 150-fold from 1985 to 2016 [1], and a 90% increase was reported in just eight years, from 2010 to 2018 [2].
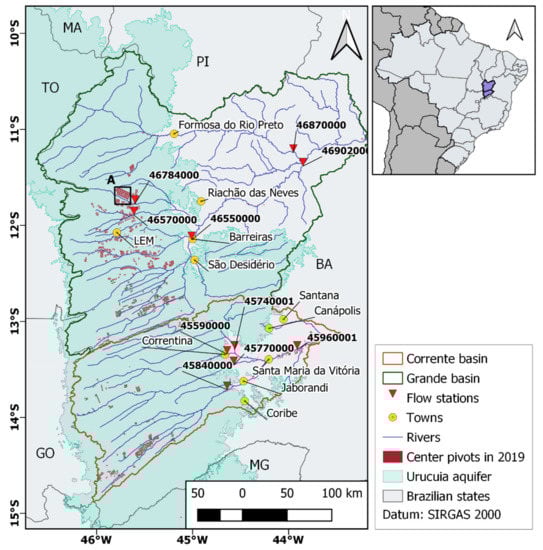
Figure 1.
Study area, main towns, and basins in Western Bahia. Red triangles and station code numbers mark the flow stations analyzed, and yellow circles indicate the region’s main towns. LEM is the town of Luis Eduardo Magalhães. The Urucuia aquifer is also a source of groundwater for irrigation. MA, TO, PI, GO, and MG refer to the Brazilian states adjacent to Bahia (BA).
Along with the intense growth of the irrigated area, analyses of hydroclimatic time series for the period 1978–2015 indicated statistically significant reductions in rainfall [2], groundwater levels [3], and river discharge in some flow stations [2]. The combination of reduced availability and increased demand for water resources suggests that, if current trends are maintained, conflicts over water may become more frequent in the next years or decades. A monitoring system in which the availability and demand for water resources for irrigation are measured and monitored is a first step to provide water security to this region [2].
Although remote sensing has been widely used to map irrigated areas using several techniques [4,5,6], estimation of the amount of water used for irrigation by remote sensing is a much more complex task [7]. Over the years, many studies have investigated the use of optical sensors, including Landsat [8,9] and MODIS (Moderate Resolution Imaging Spectroradiometer) [10], to quantify water use for irrigation. Despite the different methodologies and limitations, the studies could capture overall irrigation patterns, affirming the potential use of remote sensing to calculate water consumption in irrigated agriculture.
There are currently no systematic field measurements of water withdrawn from rivers or groundwater in Western Bahia. We hypothesize that remote sensing data can fill this data void. Therefore, the main objective of this work is to provide estimates of water uptake for irrigation using remote sensing products. For the period 2001 to 2019, we map all center pivots in the region, determine their status as irrigated or nonirrigated, and estimate the monthly irrigation depth applied by a water balance equation using products for evapotranspiration (ET; from the MOD16A2 product of the MODIS Global Evapotranspiration Project) and precipitation (from the Tropical Rainfall Measuring Mission (TRMM) 3B42 product) as inputs. We also use field data for planting and harvest dates and actual evapotranspiration collected from 69 center pivots to calibrate the ET from the MOD16A2 product. Then, we determine the actual irrigated area and the water uptake for irrigation (Qi), which is aggregated for the drainage area of selected fluviometric stations.
We also merge remote sensing and river gauge data to assess not only the amount of water used for irrigation in Western Bahia but also its consequences for the water stress of the region, and we identify water conflict situations and assess water security in selected basins. The study focuses on ten representative sub-basins delimited from flow stations with high-quality data. Five of them are located in the Corrente basin, and five are located in the Grande basin (Figure 1), the two largest basins of the region. For these, we provide a water use diagnostic using simple environmental indicators, and for the three sub-basins that exhibited the most critical conditions, we present an in-depth analysis of the 2001–2019 data time series produced here.
2. Materials and Methods
2.1. Remote Sensing Data
To quantify the actual irrigated area, we used two normalized difference vegetation index (NDVI) data sets. First, imagery from Landsat 5, 7, and 8 was used to calculate the NDVI. The missing pixels (those affected by clouds or cloud shadows) were filled using the MODIS MOD13Q1 NDVI product Version 6. This data set is a 16-day composite and provides vegetation index values on a per-pixel basis with a spatial resolution of 250 m. A MODIS NDVI pixels are computed from atmospherically corrected bi-directional surface reflectance and represent the best pixel result of a 16-day composite. Then, both Landsat and MODIS data are filtered using the irrigated land mask.
The MODIS ET data set (MOD16A2 Version 6 Evapotranspiration/Latent Heat Flux product) was used to estimate actual evapotranspiration. The algorithm is based on the logic of the Penman–Monteith equation, and it includes inputs of daily meteorological reanalysis data along with other MODIS remotely sensed data products, such as dynamical vegetation optical properties, albedo, and land cover [11]. The MOD16A2 data set is an eight-day composite product; i.e., the pixel values for the evapotranspiration layer are the sum of all eight days within the composite period. The product is available at 500 m pixel resolution for the entire global vegetated land surface.
Daily precipitation products were used to calculate the water balance and to estimate water uptake for irrigation. We used the daily accumulated product generated from the research-quality three-hourly TRMM Multi-Satellite Precipitation Analysis (TMPA, product 3B42) [12]. The TRMM data set provides a calibration-based sequential scheme for combining precipitation estimates from multiple satellites and is available at a 27.75 km pixel resolution.
2.2. Field Actual Evapotranspiration Data
Field data of actual evapotranspiration (ETa) was used to calibrate the remote sensing ET product. The field data include daily evapotranspiration values of 69 center pivots during the years 2017 and 2018, in a total of 338 pivot-months of data (an average of 4.9 months per pivot). Crops cultivated included soybean (Glycine max), maize (Zea mays), common bean (Phaseolus vulgaris), and cotton (Gossypium hirsutum L.). ETa was calculated using the classic FAO 56 methodology [13], in which ETa = Ks KL Kc ETo, where reference evapotranspiration (ETo) is calculated using the standard Penman–Monteith approach [13], using daily data measured at automatic weather stations (temperature, relative humidity, wind speed, and solar radiation); the crop coefficient Kc is a function of the crop and its stage of development; Ks refers to the wetting frequency; and the landscape coefficient KL refers to the method of irrigation [14,15]. This methodology is part of the Valley Scheduling software (used by the Irriger Connect platform), which provides routine irrigation management services to the selected center pivots.
2.3. River Flow Data
River flow data was used to estimate the surface water resources available. The daily river flow data used were obtained from ANA, the Brazilian Water Agency. We selected five fluviometric stations for each study basin (Table 1) according to the characteristics of their area upstream (sub-basin). First, we selected stations with a large area upstream to provide a regional perspective for the basins of Corrente (station code 45960001) and Grande (46902000). Second, we selected stations that have a high percentage (>4%) of the area upstream used for irrigation (45840000, 46570000, and 46784000′). Finally, we selected stations that experienced a recent expansion in the irrigated area (45590000, 45740001, 45770000, 46550000, and 46870000). All station data series have at least 30 years of data except station 46784000′. Detailed information about the stations, their locations, and their drainage areas are shown in Table 1, Figure 1 and Figure 2, respectively.

Table 1.
Selected fluviometric stations used in this study. The prime (′) after the Rio Branco station (46784000′) indicates that the irrigated area upstream is located in an area larger than the actual drainage area. The percentage of irrigated area is given with respect to the drainage area upstream or, in the case of 46784000′ (+), with respect to the area of the region that is irrigated using water from the Rio Branco.
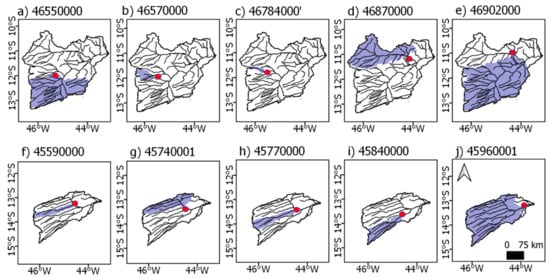
Figure 2.
Delimitation of study sub-basins. The Grande sub-basins, identified by fluviometric station code, are: (a) 46550000; (b) 46570000; (c) 46784000′; (d) 46870000; and (e) 46902000. The Corrente sub-basins are: (f) 45590000; (g) 45740001; (h) 45770000; (i) 45840000; and (j) 45960001. The red dots represent the locations of the fluviometric stations.
2.4. Computation of Irrigated Area
The starting point for computing irrigated areas in the region is the center pivot maps developed by [2]. This data set was produced using a four-step procedure that included (i) processing imagery from Landsat 5, 7, and 8 using the Google Earth Engine cloud to mosaic the images for the region and filter the pixels first for the dry period (April to September) and later for the NDVI median of the study region; (ii) merging the filtered map with other center pivot maps to produce an initial map for the region; (iii) removing duplicated features and topology errors; and (iv) validating positional accuracy through a trend and precision analysis to produce a final map without trends in center pivot sizes and locations with accuracy adequate to the scale of 1:150,000 that is compatible with the resolution of the Landsat images. More details on the methodology can be found in [2]. This data set, however, should be considered a data set of available infrastructure for irrigation, as it does not inform when there is a crop on the field that is actually being irrigated. The initial data set was produced for 1990–2018, but in this work, we updated the time series to 2019. Due to the need to cross-analyze the data against several MODIS products, we use data only from 2001 to 2019.
The identification of the actual growing seasons for each center pivot is fundamental for understanding the water demand. Thus, a simple classification of center pivots was performed based on the presence or absence of a growing crop.
NDVI has been shown to be a useful indicator of spatial-temporal changes in vegetation growth and distribution over time [16,17]. Due to its ease of application and good results, NDVI is perhaps the most widely used vegetation index in remote sensing studies [18]. We classified the center pivots into two classes (growing crop/no crop) using the NDVI. First, we calculated the NDVI using all Landsat data available for the two basins. Next, we made monthly composites with pixels that had the maximum value of NDVI and eliminated the missing data due to clouds or cloud shadows. We then filled the gaps in the Landsat NDVI composite with the same composite for MOD13 NDVI data. Figure 3a shows an example of the filled time series for one center pivot.
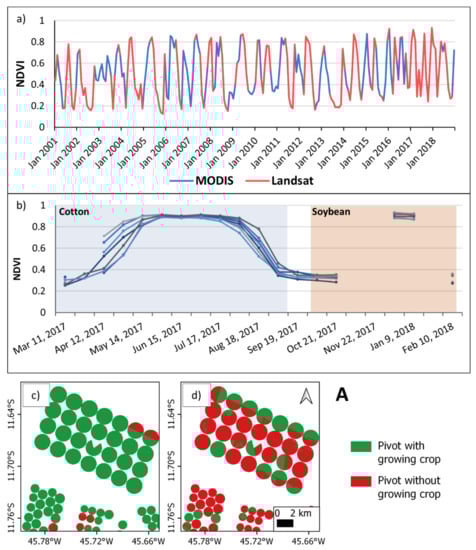
Figure 3.
Normalized difference vegetation index (NDVI) analyses and classification of center pivots: (a) an NDVI series produced from Landsat data filled with NDVI series from MODIS MOD13 data for a single sample pivot; (b) NDVI behavior in seven example center pivots in the Corrente basin, where shaded areas indicate periods when a crop was on the field, according to field work; (c) final classification of center pivots in May 2017 for the rectangle marked A in Figure 1; (d) final classification of center pivots in September 2017, also for rectangle A. Panels (c,d) show some pivots being fully irrigated, some being half-irrigated, and some not being irrigated.
To determine the NDVI threshold between a growing crop and no crop, we collected field data on the planting and harvest dates for 69 center pivots during the years 2017 and 2018. An example of (Landsat only) NDVI behavior in seven center pivots located in the Corrente basin is shown in Figure 3b. In this case, the seven pivots were each planted and harvested in the same week with the same crop. Between two crop rotations, NDVI values range from 0.25 to 0.35. Thus, we defined the NDVI value of 0.25 as the threshold between crops and no crops and applied this threshold for all monthly composites. Pixels with values higher than this limit were classified as pixels with a growing crop, and pixels with values lower than 0.25 as pixels without a growing crop. We identified two well-defined seasons, in one of which we expect to find higher demand for irrigation water and in the other, lower demand. The first season occurs between April and June (with a peak in May; Figure 3c) when most of the center pivots are in use. The second season, with the least crop cover, occurs between August and October (with a peak in September; Figure 3d) when most of the pivots do not have a growing crop. During the rainy season (November to March), irrigation is not expected to happen, except during long dry spells.
2.5. Computation of Actual Evapotranspiration, Irrigation Depth, and Water Uptake for Irrigation
To calculate ETa for all center pivots in the region, we corrected the evapotranspiration from MOD16 data using field evapotranspiration data. First, we aggregated all MODIS ET pixels inside a center pivot, calculating a pivot average based on the proportion of area covered by each MODIS 500 m pixel within each pivot. Second, we calculated a regression line between the field ETa and the aggregated MODIS ET (ETMODIS) for the 338 pairs of pivot-months of data available. We tried adjusting both data sets at different time scales: 8-day, 16-day, and monthly. Monthly aggregated data yielded the best adjustment (y = 0.9756x, R2 = 0.987, where y = log10 ETa and x = log10 ETMODIS; ETa and ETMODIS are in mm month−1). Then, we corrected all monthly ETMODIS estimates using this relationship, producing a monthly time series of ETa for each center pivot from January 2001 to December 2019.
The water application rate for each center pivot depends not only on ETa but also on the local precipitation and the efficiency of water application by the irrigation system (ε). Here we reproduce the methodology typically used by farmers in the field, closing the water balance of each center pivot in a three-day window and considering that irrigation occurs only when the amount of water lost by ET is greater than the input by precipitation. The corrected monthly ETa data was considered uniform throughout the month; daily ETa was obtained by the division of the monthly ETa value by the number of days in the month. The irrigation depth (D)—or water application rate—was calculated according to Equation (1):
where P(i) is the three-day TRMM precipitation on pivot i and ETa(i) is its three-day evapotranspiration. The center pivot system used in the region is considered a highly efficient irrigation system, with efficiency ranging from 80%–90% [14,19], so we adopted ε = 0.85. When P(i) > ETa(i), the crop ET demand was fully satisfied by the precipitation, and there was no irrigation in the center pivot in that period, so D(i) = 0. Next, we accumulated the computed three-day water application rate monthly.
The water uptake for irrigation of each center pivot Qi(i) is just the product of the water application rate D(i), in mm month−1 by the area of the center pivot (ha), with units adjusted to m3 s−1.
2.6. Integration of Results Per Sub-Basin
This study presents water resources analysis by sub-basin, where a sub-basin is the drainage area upstream of the fluviometric stations in Table 1 and Figure 2. Individual pivot results were aggregated according to their position in the drainage area of each fluviometric station. We started this analysis with the integration of all variables calculated: precipitation, water application rate, actual irrigated area, water uptake for irrigation, measured river discharge, and naturalized flow (explained below).
To give an overview of the precipitation regime for each basin, we aggregated the daily data and calculated the monthly mean. The average water application rate by sub-basin, in mm month−1, was calculated by weighting the individual pivot values of D(i) by pivot area. During this procedure, we also calculated the actual irrigated area by sub-basin, which was the sum of the pivot areas that had monthly D(i) greater than zero. The accumulated water application rate Qi is the sum of the individual Qi(i) across the drainage area of the fluviometric station.
In addition to the measured river discharge in each station (Q), we also calculated “naturalized flows” series for each river at each station. The naturalized flow (Q*) is the corresponding flow that would occur in a river section if there were no anthropic actions in the drainage area contributing to the section. The naturalized series are synthetic series created to reproduce the original flow of the river through the return of the water used for irrigation back to the river, i.e., Q* = Q + Qi. Qi is available only since 2001, so we could only calculate naturalized flows for this period.
2.7. Data Analysis
To assess the irrigation impact for each sub-basin, we analyze the occurrence of two possible critical water resource conditions related to the maximum water uptake for irrigation during 2001–2019 (Qimax) and the minimum river flow (Qmin). For the analysis of the first condition, the state of Bahia adopts the criterion of 80% of Q90 as the limit of surface water flow that can be granted for human use (State Decree 6296 of 21 March, 1997). Q90 is the flow expected to be present in the river at least 90% of the time. In this study, we use the value Q90*, calculated using Q*. Thus, in the scenario that Qimax exceeds 80% of Q90*, then irrigation would create a water use conflict situation, i.e., the water demand for irrigation would exceed the availability of water resources.
The other critical condition is related to the minimum discharge. If 80% of Q90* is the maximum allowable to be allocated, then 20% of Q90 is the minimum discharge needed to maintain the ecological functions of the river. Thus, a ratio Qmin/Q90* that is less than 20% characterizes a condition of water insecurity.
3. Results
3.1. Water Use Conflicts and Water Insecurity
This section presents an overview of the impact of water resources in all ten sub-basins. According to our results, the conditions in the Corrente sub-basins are the most comfortable with respect to water availability. None of these sub-basins shows detectable indications of water conflict or water insecurity (Table 2). All sub-basins show low Qimax/Q90* values (maximum value is 16.3%; critical limit is 80%). In addition, the similar values of Q90 and Q90* indicate small Qi amounts withdrawn from the rivers during the low-flow season. Although there is a large area with irrigation in the 45840000 sub-basin (4.1%, see Table 1), the low Qimax/Q90* ratio (16.3%) suggests a low demand for water resources by irrigation. Moreover, as irrigation expansion in the basin is recent, the operation of many recent center pivots did not affect most of the Q* series.
Table 2.
Results for maximum irrigation water update (Qimax), river flow expected to be present at least 90% of the time (Q90), the naturalized flow that would have been expected to be present at least 90% of the time (Q90*), Qimax/Q90*, minimum river flow (Qmin), and Qmin/Q90* for all sub-basins analyzed. Critical conditions are defined as: Qimax/Q90* > 80% and Qmin/Q90* < 20%.
For the Grande basin (Table 2), we identify water conflict situations in the two smallest sub-basins—46570000 (Rio de Janeiro) and 46784000′ (Rio Branco)—both with drainage areas less than 2600 km2 (see Table 1 for drainage areas). Both sub-basins present a very high concentration of irrigated areas: 4.8% in Rio de Janeiro and 18.7% in the Rio Branco (Table 1). Qimax reaches 80.7% of Q90* in the 46570000 sub-basin and 83.1% of Q90* in the 46784000′ sub-basin. The difference between Q90 and Q90* is also high in these two basins: 1.11 m3 s−1 (18.5%) in Rio de Janeiro and 2.10 m3 s−1 (29.2%) in Rio Branco. This difference indicates that there is persistent use of irrigation (high Qi values) during the low-flow season. Despite the water conflict situation, in both sub-basins, the minimum discharge ratios recorded were well above the 20% of Q90* minimum limit that would characterize water insecurity (36.9% in the Rio de Janeiro and 41.1% in the Rio Branco). The 46550000 sub-basin (Rio Grande at Barreiras) also deserves attention. Although it is not formally experiencing water conflict as defined above, the high Qimax/Q90* ratio (50.3%) is an alert regarding the irrigation expansion in the region. This sub-basin includes all of the Upper Rio Grande basin, including the Rio das Ondas, but does not include the Rio de Janeiro and Rio Branco. It is also important to note that the minimum flow at sub-basin 46550000 is 41.5% of Q90*, which is similar to 46570000 (36.9%) and 46784000′ (41.1%).
In summary, three sub-basins stand out as presenting reason for concern: 46550000, 46570000, and 46784000′. Therefore, we also conducted an in-depth investigation to analyze changes in irrigation and other relevant data throughout the period 2001–2019 in these sub-basins.
3.2. Integrated Results for Selected Critical Basins
Figure 4 shows the results for the 46550000 sub-basin, the Rio Grande at Barreiras. The monthly precipitation pattern observed is representative of the regional climate, with two well-defined seasons: rainy (October to April) and dry (May to September; Figure 4a). The monthly precipitation presents substantial variability, ranging from 0 to ~450 mm month−1. The same precipitation pattern is observed in the other critical basins.
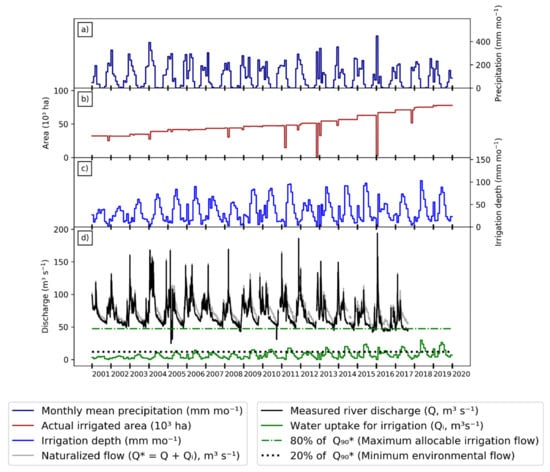
Figure 4.
Integrated results of flow station 46550000 in the Grande basin: (a) monthly average precipitation series from 2001 to 2019; (b) actual irrigated area per month from 2001 to 2019; (c) monthly irrigation depth from 2001 to 2019; (d) measured (Q) and naturalized (Q*) river discharge and irrigation uptake (Qi), where Q* = Q + Qi. The green and black dashed lines represent the minimum environmental flow and maximum allocable irrigation flow, respectively.
Figure 4b shows that the actual irrigated area increased from 32,000 ha in 2001 to 77,000 ha in 2019, following the increase in center pivots from 318 in 2001 to 766 in 2019. In addition, the stability of the irrigated area over the months indicates that the irrigation systems operate throughout the entire year, with interruptions only in a few high-rain months. On the other hand, the average irrigation depth presents substantial seasonal variation, ranging from <10 mm month−1 in the rainy season to ~100 mm month−1 in the dry season (Figure 4c).
Figure 4d presents the environmental impact of irrigation. The Rio Grande has a seasonal flow consistent with the rainfall pattern, with peaks in the rainy seasons and lows in the dry seasons. In this figure, a water insecurity condition would be characterized by the solid black lines being below the dotted black line (Qmin < 0.2∙Q90*). In comparison, the solid green line going above the dot-dashed green line (Qi > 0.8∙Q90) characterizes a water conflict situation. As we observed earlier, there is no water use conflict or insecurity situation in this sub-basin. The irrigation discharge did not exceed 80% of Q90* in any month of the period, but the Qi values have been steadily increasing and reached the maximum value for the series in June 2018 (Qi = 29.83 m3 s−1, 50.3% of Q90*).
Overall, the actual situation for 46550000 does not seem to be critical in comparison to the two basins discussed below. However, the growing irrigation trend requires attention for management agencies and farmers to avoid water conflicts in the future. Moreover, the large size of this sub-basin (24,500 km2) suggests that localized problems may be occurring in smaller sub-basins, as in the cases of Rio de Janeiro and Rio Branco.
The Rio de Janeiro sub-basin upstream of 46570000 is much more water-stressed (Figure 5; water insecurity and water conflict conditions are interpreted as in Figure 4). This sub-basin has had very high irrigation since the 1990s [2]. There are currently 12,100 ha of irrigation systems installed in this sub-basin, and nearly all are in use every month (Figure 5b). In 2005, Qi reached 4.33 m3 s−1, 60.8% of Q90*, and yet from 2005 to 2019, the number of center pivots increased by 18.6%, and the actual irrigated area increased from 10,287 to 12,011 ha (Figure 5b). This expansion pushed water use past the threshold of a conflict situation, with Qi setting new records repeatedly (4.63 m3 s−1 in 2010, 5.19 m3 s−1 in 2015) and finally reaching 5.73 m3 s−1 (80.7% of Q90*) in May 2018 (Figure 5d; Table 2). Qi also remained high during the dry season throughout the period, showing that the irrigation activity has been near the limit since 2005.
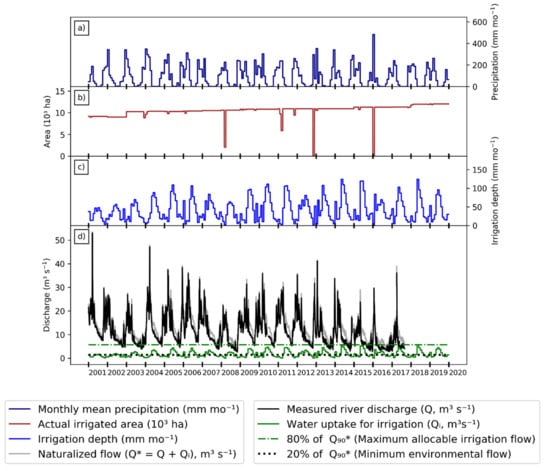
Figure 5.
Integrated results of flow station 46570000 in the Grande basin: (a) monthly average precipitation series from 2001 to 2019; (b) actual irrigated area per month from 2001 to 2019; (c) monthly irrigation depth from 2001 to 2019; (d) measured (Q) and naturalized (Q*) river discharge and irrigation uptake (Qi), where Q* = Q + Qi. The green and black dashed lines represent the minimum environmental flow and maximum allocable irrigation flow, respectively.
Nevertheless, the imminence of water use conflicts in the Rio de Janeiro sub-basin since 2005 might have discouraged the installation of new center pivots in the following years, explaining the relatively small growth rate of irrigation systems when compared to the Rio Branco or even the larger Rio Grande. Despite these critical Qi values, Q is never less than the minimum environmental flow (20% of Q90*) at any moment in the period. This apparent discrepancy may be explained by the fact that some of the irrigation pumps groundwater, not surface water. Although we are not able to infer from remote sensing data the source of the water pumped for irrigation, a quick analysis of water use grants issued from 2015 to 2020 indicates that grants for surface water use represent 94% of the total grants in this region.
It is no coincidence that the condition of sub-basin 46570000 is more critical than that of sub-basin 46550000. The larger drainage area upstream of the 46550000 station aggregates many tributaries, which obscures the potentially acute situations of smaller sub-basins. Small upstream drainage areas with a high density of irrigation systems are thus serious candidates for water conflicts.
This is clearly observed in sub-basin 46784000′, the smallest among all the analyzed basins, with an actual drainage area of only 685 km2 (68,500 ha), which presents the most alarming scenario. The sub-basin is so small that a different type of analysis was necessary. By analyzing not only the irrigated area inside the drainage area but also the farm limits, we realized that a reasonable amount of irrigated area that depends on the waters of the Rio Branco is actually located outside its drainage area (Figure 6). For this reason, we redefined the contour of the region that is irrigated using water from the Rio Branco to provide a more realistic picture of what happens in the sub-basin. The region delimited by this new contour is hereafter referred to as 46784000’ and has a total area of 1041.3 km2, of which 195.3 km2 (19,530 ha; 18.7%) are irrigated. This is the highest density of irrigation systems for basins with water flow measurements in Western Bahia.
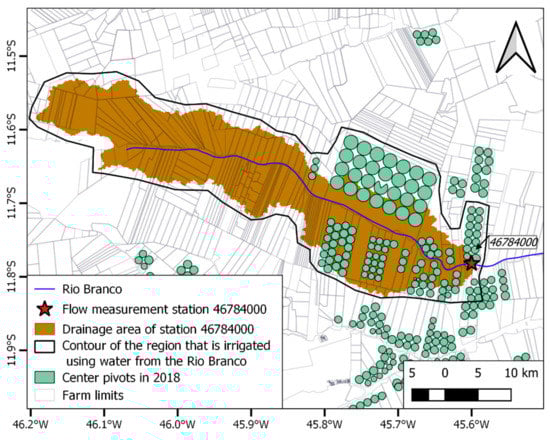
Figure 6.
Detail of the drainage area upstream of flow station 46784000 on the Rio Branco. The figure shows the locations of the center pivots in 2018 and the location of the flow station. The contour of Table 46784000. was drawn based on an analysis of the respective farm limits and the presence of irrigated areas.
Figure 7 shows the results for basin 46784000′ (water insecurity and water conflict conditions are interpreted as in Figure 4 and Figure 5). While the behavior of seasonal precipitation and irrigation depth are similar to that of the two previously discussed sub-basins (Figure 7a,c), the actual irrigated area increased by 375%, from ~4100 ha in 2001 to ~19,500 ha in 2019 (Figure 7b), reaching 18.7% of the area of 46784000´, but even more astonishingly, 28.5% of the actual drainage area of 46784000. To be sure, it is the runoff of drainage basin 46784000 that supplies water to meet the demand for all the irrigated area in 46784000´.
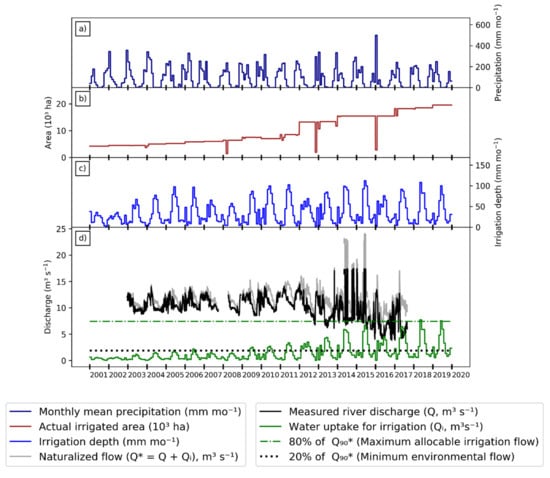
Figure 7.
Integrated results of flow station 46784000′ in the Grande basin: (a) monthly average precipitation series from 2001 to 2019; (b) actual irrigated area per month from 2001 to 2019; (c) monthly irrigation depth from 2001 to 2019; (d) measured (Q) and naturalized (Q*) river discharge and irrigation uptake (Qi), where Q* = Q + Qi. The green and black dashed lines represent the minimum environmental flow and maximum allocable irrigation flow, respectively.
The increase of irrigated area is the main factor responsible for the change in Qi over time (Figure 7d). After 2012, the peaks of Qi increase quickly during the dry season, to the point that Qi exceeds 80% of Q90* in both May 2018 and June 2019. This rapid evolution also substantially affects the river flow (Figure 7d). The increase of Qi occurring between 2012 and 2019 coincides with a rapid decline in the measured river flow. Similarly to the Rio de Janeiro, grants for surface water use represent 93% of the total grants in this region. Moreover, our attempt to naturalize the river flow has limitations for applications in such a small basin with high water use. Despite these limitations, there is no doubt that irrigation has been causing a significant impact in this sub-basin. Finally, similarly to the Rio de Janeiro, despite apparent overuse of surface water resources, minimum discharges are still much higher than the minimum environmental flow.
4. Discussion
This work is a first attempt to diagnose and monitor water used by irrigation and the resulting water stress in a region with intense irrigation growth—Western Bahia in Brazil. While actual Qi measurements at pumping sites are not widely available, remote sensing provides the necessary data for an initial analysis. Here, we combined remote sensing data with discharge measurements to investigate the most concerning scenarios among the sub-basins, successfully providing an initial diagnostic tool for water use conflict and water insecurity situations. The results for the Corrente sub-basins show that there are no water conflicts or water insecurity situations in this basin. Two reasons may explain this comparatively comfortable scenario. First, compared with the Grande basin, the expansion of the irrigated area in the Corrente basin is more recent, according to the center pivot maps produced by [2]. Because of the notorious example of the water stress of its northern neighbor, the expansion of irrigation in the Corrente is happening under more careful governance. An example of this governance is the request by the Rio Corrente Basin Committee on 11 December 2015 to temporarily suspend the concession of water use permits in the basin until further criteria for water permits are defined [20]. This request was presented to the environmental agency of the state of Bahia (INEMA—Instituto do Meio Ambiente e Recursos Hídricos), despite the fact that the water use for irrigation represents no more than 16.3% of the Q90* in the basin (Table 2). Second, the large number of center pivots already installed and the low Qimax/Q90* ratio both indicate that the farmers are managing planting dates to avoid using significant amounts of water during the low-season flows.
A different situation is found in the Grande sub-basins, which contains the three most critical cases analyzed. As detected in [2] and confirmed here, the irrigators of sub-basin 4657000 (Rio de Janeiro) have been working under water stress since the beginning of the millennium. However, we have only identified water use conflict situations in recent years. Water stress has also been a problem during this period in sub-basin 46784000 (Rio Branco), where we have identified water conflict situations since 2018. Although we do not see the same happening in the larger 46550000 sub-basin, the recent expansion of irrigated area and of the water amount used for irrigation indicates a tendency in the Grande basin.
In addition to the water resources diagnostic, our study also provides a first attempt to construct a data set for irrigation monitoring in Western Bahia. Here, we used three-day water balances to monitor the monthly amount used by irrigation. An analysis of the entire time series (Figure 4, Figure 5 and Figure 7) indicates consistent performance by our estimation method. The interview data collected by [2], which estimates a maximum irrigation depth ranging from 100 to 150 mm month−1, is quite similar to our results. In addition, the months of high (April to June) and low (November to March) irrigation depth (Figure 4cFigure 5c and Figure 7c) match with the intervals between planting and harvest date practiced in the region [21] and the irrigated area identified by our NDVI classification. Indeed, the MOD16A2 ET product has a strong correlation with vegetation greenness, as its algorithm depends on remote sensing data for leaf area index and fraction of absorbed photosynthetically active radiation [22].
Although our data set does not have adequate temporal or spatial resolution for use in field irrigation management, it is useful for basin-scale analysis. An analysis of Figure 7 indicates that water use conflicts may arise quite soon in 46784000′ as the regional precipitation and river flow decrease [2]. It is important to note that the length of the river flow time series available for Rio Branco at Savana (2003–2017) is too short to account for a representative evaluation of the effects of the natural climate variability. However, there is no doubt that irrigation has been causing a significant impact in this small sub-basin.
The situation in sub-basin 46784000′ also portends similar potential problems in other sub-basins without discharge measurements. It is very likely that other small rivers in Western Bahia are currently facing a similar water stress scenario or will be soon. The need for dense monitoring of the water resources in this region is well known, and there is a somewhat extensive network of federal, state, and even private river flow gauges that have been set up in the last decade or so, with a few installed as late as 2019. However, as with the 46784000 gauge, their time series are still too short for a representative hydroclimatic characterization of the sub-basins.
Our results support the conclusions by [2] that there is an urgent need for hydroclimatic monitoring in Western Bahia. The setup of a “situation room”, in which field measurements and remote sensing products like the one described here are collected and analyzed in near-real-time, would be a fundamental step toward better management of water resources in Western Bahia, in particular in the small basins.
In 2019, INEMA took a significant step toward the creation of a monitoring system with the publication of ordinance 19,452/2019, with norms for water measurement and reporting for monitoring purposes in the state. Although this ordinance has not yet produced practical results in terms of data flow, in the future, this in situ data set will complement the monitoring by remote sensing in several ways: first, the field data may be used for further calibration and validation of the remote sensing products; second, our remote sensing product may provide a baseline for spatial consistency of the regionally consolidated in situ data; third, the remote sensing data provide a long-term time series that will be complemented by the field data; and finally, our remote sensing product may help to fill in gaps due to field measurement failures.
Another issue is the relatively high error in ETa estimates at short time scales. In this work, we could reduce the bias of the remote sensing estimates by calibrating them against monthly ET field data, but two restrictions limited the performance of the adjusted model. The first is the coarse resolution of the MOD16 product (500 × 500 m, or 25 ha) compared to the typical size of a center pivot (100–150 ha), and the second, the lack of direct measurements of water application rates. Our estimates can be improved in the future using remote sensing ET products based on higher-resolution data, such as from the Visible Infrared Imaging Radiometer Suite sensor, and the in situ pumping data described above.
5. Conclusions
In this study, we use remote sensing products to assess the amount of water used for irrigation in Western Bahia, Brazil. The results demonstrate that the use of remote sensing products is a powerful tool to characterize the irrigation scenario in the region and its potential to identify critical water stress situations in small sub-basins. The amount of water used by irrigation combined with river gauge data can diagnose water use and water stress situations in areas with intense irrigation growth. The product developed here is a first contribution to provide stakeholders (government agencies, agribusiness, and organized civil society) with the necessary data to manage the water resources of the region.
Three sub-basins presented the most critical conditions for water conflicts: The Rio Grande upstream of the Barreiras station (46550000), the Rio de Janeiro upstream of the Ponte Serafim station (46570000), and the Rio Branco upstream of the Savana station (46784000). An in-depth analysis of these sub-basins shows that, despite the high water stress, water use for irrigation has been steadily increasing, pushing the water use to its limits, particularly in Rio de Janeiro and Rio Branco.
Despite these promising initial results, we believe they can be improved in the near future. The emergence of new remote sensing evapotranspiration products at higher resolution, new sensors, and availability of new ground data will soon provide significant improvements to the monitoring of the water resources in this region.
Author Contributions
Conceptualization, project administration, and funding acquisition, M.H.C. and E.C.M.; investigation: I.B., E.C.M., and M.C.; formal analysis: A.B.S.; writing—original draft preparation, A.B.S. and M.H.C.; writing—review and editing, A.B.S., M.H.C., E.C.M., I.B., and M.C. All authors have read and agreed to the published version of the manuscript.
Funding
This research was funded by CNPq, grant 441210/2017-1, and by PRODEAGRO, grant 045/2019.
Acknowledgments
We would like to thank the Irriger Connect platform for providing the field evapotranspiration data.
Conflicts of Interest
The authors declare no conflict of interest. The funders had no role in the design of the study; in the collection, analyses, or interpretation of data; in the writing of the manuscript; or in the decision to publish the results.
References
- ANA, Agência Nacional de Águas. Atlas de Irrigação: Uso da Água na Agricultura. 2017. Available online: http://arquivos.ana.gov.br/imprensa/publicacoes/AtlasIrrigacao-UsodaAguanaAgriculturaIrrigada.pdf (accessed on 6 July 2020).
- Pousa, R.; Costa, M.H.; Pimenta, F.M.; Fontes, V.C.; Castro, M. Climate change and intense irrigation growth in Western Bahia, Brazil: The urgent need for hydroclimatic monitoring. Water 2019, 11, 933. [Google Scholar] [CrossRef]
- Marques, E.A.G.; Silva Junior, G.C.; Eger, G.Z.S.; Ilambwetsi, A.M.; Pousa, R.; Generoso, T.N.; Oliveira, J.; Júnior, J.N. Analysis of groundwater and river stage fluctuations and their relationship with water use and climate variation effects on Alto Grande watershed, Northeastern Brazil. J. South. Am. Earth Sci. 2020, 103, 102723. [Google Scholar] [CrossRef]
- Bazzi, H.; Baghdadi, N.; Ienco, D.; El Hajj, M.; Zribi, M.; Belhouchette, H.; Escorihuela, M.J.; Demarez, V. Mapping irrigated areas using Sentinel-1 time series in Catalonia, Spain. Remote Sens. 2019, 11, 1836. [Google Scholar] [CrossRef]
- Pun, M.; Mutiibwa, D.; Li, R. Land use classification: A surface energy balance and vegetation index application to map and monitor irrigated lands. Remote Sens. 2017, 9, 1256. [Google Scholar] [CrossRef]
- Saraiva, M.; Protas, É.; Salgado, M.; Souza Júnior, C. Automatic mapping of center pivot irrigation systems from satellite images using deep learning. Remote Sens. 2020, 12, 558. [Google Scholar] [CrossRef]
- Jalilvand, E.; Tajrishy, M.; Hashemi, S.A.G.Z.; Brocca, L. Quantification of irrigation water using remote sensing of soil moisture in a semi-arid region. Remote Sens. Environ. 2019, 231, 111226. [Google Scholar] [CrossRef]
- Folhes, M.T.; Rennó, C.D.; Soares, J.V. Remote sensing for irrigation water management in the semi-arid Northeast of Brazil. Agric. Water Manag. 2009, 96, 1398–1408. [Google Scholar] [CrossRef]
- Peña-Arancibia, J.L.; McVicar, T.R.; Paydar, Z.; Li, L.; Guerschman, J.P.; Donohue, R.J.; Dutta, D.; Podger, G.M.; Van Dijk, A.I.J.M.; Chiew, F.H.S. Dynamic identification of summer cropping irrigated areas in a large basin experiencing extreme climatic variability. Remote Sens. Environ. 2014, 154, 139–152. [Google Scholar] [CrossRef]
- Peña-Arancibia, J.L.; Mainuddin, M.; Kirby, J.M.; Chiew, F.H.S.; McVicar, T.R.; Vaze, J. Assessing irrigated agriculture’s surface water and groundwater consumption by combining satellite remote sensing and hydrologic modelling. Sci. Total Environ. 2016, 542, 372–382. [Google Scholar] [CrossRef] [PubMed]
- Mu, Q.; Zhao, M.; Running, S.W. MODIS Global Terrestrial Evapotranspiration (ET) Product (MOD16A2/A3). Algorithm Theoretical Basis Document Collection 5. Available online: https://modis-land.gsfc.nasa.gov/pdf/MOD16ATBD.pdf (accessed on 20 April 2020).
- Goddard Earth Sciences Data and Information Services Center. Available online: https://disc.gsfc.nasa.gov/datasets/TRMM_3B42_Daily_7/summary (accessed on 4 April 2020).
- Allen, R.G.; Pereira, L.S.; Raes, D.; Smith, M. Crop Evapotranspiration—Guidelines for Computing Crop Water Requirements; FAO Irrigation and Drainage Paper No. 56; FAO: Rome, Italy, 1998; ISBN 9251042195. [Google Scholar]
- Bernardo, S.; Mantovani, E.C.; Da Silva, D.D.; Soares, A.A. Manual de Irrigação, 9th ed.; Editora UFV: Viçosa, Brazil, 2019; ISBN 9788572696104. [Google Scholar]
- Mantovani, E.C.; Bernardo, S.; Palaretti, L.F. Irrigação: Princípios e Métodos, 3rd ed.; Editora UFV: Viçosa, Brazil, 2009; ISBN 9788572693738. [Google Scholar]
- Pereira, O.J.R.; Ferreira, L.G.; Pinto, F.; Baumgarten, L. Assessing Pasture Degradation in the Brazilian Cerrado Based on the Analysis of MODIS NDVI Time-Series. Remote Sens. 2018, 10, 1761. [Google Scholar] [CrossRef]
- Barbosa, H.A.; Huete, A.R.; Baethgen, W.E. A 20-year study of NDVI variability over the Northeast Region of Brazil. J. Arid. Environ. 2006, 67, 288–307. [Google Scholar] [CrossRef]
- Karthikeyan, L.; Chawla, I.; Mishra, A.K. A review of remote sensing applications in agriculture for food security: Crop growth and yield, irrigation, and crop losses. J. Hydrol. 2020, 586, 124905. [Google Scholar] [CrossRef]
- Coelho, E.F.; Coelho Filho, M.A.; Oliveira, S.L. Agricultura irrigada: Eficiência de irrigação e de uso de água. Bahia Agríc. 2005, 7, 57–60. [Google Scholar]
- Deliberação CBHRC. 2015. Available online: https://www.conjur.com.br/dl/deliberacao-comite-bacia-corrente.pdf (accessed on 17 April 2019).
- Conab, Companhia Nacional de Abastecimento. Calendário de Plantio e Colheita de Grãos no Brasil. 2019. Available online: https://www.conab.gov.br/institucional/publicacoes/outras-publicacoes/item/7694-calendario-agricola-plantio-e-colheita (accessed on 12 August 2020).
- Biggs, T.W.; Marshall, M.; Messina, A. Mapping daily and seasonal evapotranspiration from irrigated crops using global climate grids and satellite imagery: Automation and methods comparison. Water Resour. Res. 2016, 52, 7311–7326. [Google Scholar] [CrossRef]


Publisher’s Note: MDPI stays neutral with regard to jurisdictional claims in published maps and institutional affiliations. |
© 2020 by the authors. Licensee MDPI, Basel, Switzerland. This article is an open access article distributed under the terms and conditions of the Creative Commons Attribution (CC BY) license (http://creativecommons.org/licenses/by/4.0/).