Abstract
LiDAR-based mobile mapping systems (MMS) are rapidly gaining popularity for a multitude of applications due to their ability to provide complete and accurate 3D point clouds for any and every scene of interest. However, an accurate calibration technique for such systems is needed in order to unleash their full potential. In this paper, we propose a fully automated profile-based strategy for the calibration of LiDAR-based MMS. The proposed technique is validated by comparing its accuracy against the expected point positioning accuracy for the point cloud based on the used sensors’ specifications. The proposed strategy was seen to reduce the misalignment between different tracks from approximately 2 to 3 m before calibration down to less than 2 cm after calibration for airborne as well as terrestrial mobile LiDAR mapping systems. In other words, the proposed calibration strategy can converge to correct estimates of mounting parameters, even in cases where the initial estimates are significantly different from the true values. Furthermore, the results from the proposed strategy are also verified by comparing them to those from an existing manually-assisted feature-based calibration strategy. The major contribution of the proposed strategy is its ability to conduct the calibration of airborne and wheel-based mobile systems without any requirement for specially designed targets or features in the surrounding environment. The above claims are validated using experimental results conducted for three different MMS – two airborne and one terrestrial – with one or more LiDAR unit.
1. Introduction
Laser scanning has gained widespread popularity over recent years owing to the continuous improvement in the performance, size, and cost of available sensors. Recent advancements in direct georeferencing technology using the Global Navigation Satellite System/Inertial Navigation System (GNSS/INS) have further boosted the ability to collect accurately georeferenced data when combined with laser units onboard mobile systems. Mobile mapping systems (MMS) equipped with one or more laser scanners are heavily relied on for a multitude of applications, including urban modeling [1,2,3], transportation corridor mapping [4,5,6], precision agriculture [7,8,9,10], infrastructure monitoring [11,12], shoreline monitoring [13,14,15], archaeological mapping [15,16,17], and digital documentation of cultural heritage sites [18,19,20]. Each application determines the necessary architectural requirements for the MMS depending on the accessibility of the survey site, desired level of accuracy and details, and so on. The design of an MMS entails decisions in terms of the platform (airborne or terrestrial), onboard GNSS/INS unit, number and type of mounted LiDAR units, and any other types of sensor (RGB, thermal, or hyperspectral cameras). The full positioning potential of an MMS is not only determined by the accuracy of the individual sensors but also by the ability to accurately calibrate the entire system. Mobile system calibration consists of two components—the intrinsic calibration of onboard sensors, as well as the extrinsic calibration of the mounting parameters relating the different sensors to the GNSS/IMU (Inertial Measurement Unit) position and orientation system. Here, mounting parameters refer to the translational and rotational offsets (in other words, lever-arm and boresight angles) between the onboard sensors and GNSS/IMU position and orientation system. Habib et al. [21] studied the impact of airborne LiDAR system calibration on the relative and absolute accuracy of the derived point clouds, both qualitatively and quantitatively. Over the past few years, a great deal of research has been conducted in the area of mobile LiDAR system calibration. Kilian et al. [22] used manually matched control points and tie points in a Digital Elevation Model (DEM) to perform an adjustment to minimize the discrepancy among strips caused by uncorrected systematic errors in the GNSS/INS trajectory. Their calibration strategy aimed to estimate these errors using a linear time-drift model, wherein they determined six parameters denoting the translational and rotational offsets along with six additional parameters representing the time-dependent drift of the offset parameters. Maas [23] estimated only the boresight angles by conducting a least-squares matching of points in one strip and a corresponding Triangulated Irregular Network (TIN) mesh in another strip. Underwood et al. [24] estimated the extrinsic parameters relating a SICK LMS-291 to a Novatel Synchronized Position, Attitude and Navigation (SPAN) system by minimizing the discrepancy between sensed data and a known feature/surface (i.e., a vertical pole and relatively flat ground). Muhammad and Lacroix [25] performed calibration of a rotating multi-beam LiDAR with the objective to align the scan data as close as possible to a ground truth surface. He et al. [26] used pairwise multi-type 3D geometric features (i.e., points, lines, and planes) to derive the extrinsic parameters between 2D LiDAR and GNSS/IMU. First, the point cloud is segmented into different features and their quality is evaluated to compute weights to be used in the minimization of the normal distance between conjugate features. However, when the initial parameters are considerably inaccurate, the segments and derived weights may not be reliable. Pandey et al. [27] proposed an automatic extrinsic calibration of a LiDAR and optical camera system by maximizing the mutual information between the sensor-measured surface intensities. Alismail et al. [28] proposed an automatic calibration method for a LiDAR–camera system using a planar calibration object with a black circular region whose center is marked. The LiDAR–camera system was moved to capture scans/images of the target from different positions and then, they used a point-to-plane Iterative Closest Point (ICP) approach with nonlinear optimization by Levenberg–Marquardt (LM) algorithm to estimate the LiDAR–camera extrinsic parameters. Pusztai and Hajder [29] proposed a calibration technique for a static LiDAR-camera system using cardboard boxes of known sizes with sides perpendicular to each other. Their approach relied on detecting planar box façades in the LiDAR point cloud and deriving the intersection lines between the planes, which can then be used to derive the parameters relating the LiDAR and camera units. Li et al. [30] proposed an automatic boresight self-calibration strategy for mobile mapping systems based on point-to-point correspondences in overlapping strips matched by an ICP algorithm. However, they calibrated the system under the assumption that the lever-arm was accurately measured and did not need to be calibrated. Moreover, since they used ICP to match different strips, their approach could only deal with point clouds that are coarsely registered as the ICP would fail in cases where the initial estimates of boresight angles cause significant misalignments. Hong et al. [31] estimated the mounting parameters for a mobile LiDAR mapping system using corresponding planar features extracted from 3D point clouds scanned by the mobile system and a terrestrial laser scanner. Ravi et al. [32] proposed a manually-assisted feature-based calibration technique, which estimated the mounting parameters for a terrestrial mobile mapping system by minimizing the discrepancies between conjugate planar/linear features in overlapping point clouds derived from different drive-runs. Ravi et al. [33] conducted a detailed bias impact analysis for airborne mobile mapping systems and proposed an optimal target and flight line configuration along with a manually assisted feature-based calibration strategy for UAV-based mobile mapping systems.
The aforementioned work dealt with LiDAR system calibration while requiring specially designed targets and/or geometric features in the surrounding environment. Moreover, to the best of the authors’ knowledge, there is no existing work that has proposed a fully automated calibration strategy that includes an automated feature/target extraction followed by an automated estimation of mounting parameters. The existing techniques for fully automated calibration focus mainly on fine-tuning the mounting parameters while starting from initial estimates that are very close to true values. However, such approaches fail to accomplish an accurate system calibration when the initial estimates are significantly different from the true values. In this paper, we propose a fully automated targetless calibration technique to estimate the mounting parameters relating to the onboard LiDAR units to the GNSS/IMU unit for a mobile mapping system. The proposed approach starts with an automated profile selection strategy, followed by a profile matching technique based on height map correlation, and concludes with a point-pairing scheme and optimization function for system calibration. One should note that all the above calibration stages are fully automated with no manual intervention in any of these steps. The remainder of the paper is structured as follows: Section 2 describes the system architecture for the three different mobile LiDAR mapping systems (MLMS)—two airborne and one terrestrial—used in this study; Section 3 discusses the proposed methodology for profile-based calibration, where we start by introducing the mathematical model for point positioning from MLMS, followed by the proposed techniques for profile selection, profile matching, and subsequent system calibration. Section 4 presents the experimental results for validating the feasibility and accuracy of the proposed calibration technique by applying it to the three different MLMS consisting of one or more LiDAR units. The accuracy of the proposed calibration strategy is validated by conducting qualitative and quantitative analysis of the resultant improvement in the alignment of point clouds scanned by different sensors along different drive-runs/flight lines. The results from the proposed technique are also verified by comparing it to a previously proven manually assisted feature-based calibration strategy for MLMS proposed by Ravi et al. [32,33]. Finally, Section 5 summarizes the findings of this research and states possible future improvements and enhancements to this study.
2. System Description and Calibration Test Field
As mentioned earlier, this research proposes a fully automated approach for calibrating airborne and terrestrial MLMS consisting of spinning multi-beam laser scanners. In this study, we worked with three such mobile mapping systems—two airborne and one terrestrial—equipped with one or more spinning multi-beam LiDAR units along with a GNSS/INS unit for direct georeferencing. The following subsections describe the system architecture and calibration test fields for each of these systems in detail.
2.1. Airborne MLMS
The two UAV-based LiDAR systems used in this study are shown in Figure 1 and are denoted henceforth as Airborne MLMS 1 and 2, respectively. Each system has one LiDAR unit integrated with a GNSS/INS unit for direct georeferencing. The airborne MLMS 1 is equipped with a Velodyne VLP32C LiDAR unit, which consists of 32 radially oriented laser rangefinders, whereas the airborne MLMS 2 has a Velodyne VLP16 Puck Lite LiDAR unit, which has 16 radially oriented laser beams. The manufacturer specifications for each of these LiDAR units are listed in Table 1 [34,35]. Each of the systems consists of an APX-15 UAV V3 GNSS/INS unit, which has a post-processing positional accuracy of 2 to 5 cm, 0.025° accuracy for the roll/pitch angles, and 0.08° accuracy for the heading [36]. In order to generate a point cloud from these airborne systems, the maximum reconstruction range was set to 70 m and the FOV for reconstruction across the flying direction was ±70°. Based on the aforementioned individual sensor accuracies and reconstruction parameters, we could estimate the resultant accuracy of point positioning for such a system using the LiDAR Error Propagation Calculator developed by Habib et al. [37]. For a flying height of 50 m, the point positioning accuracy was found to be around 5 to 6 cm in the horizontal and vertical directions at nadir. At the edge of the swath, the horizontal accuracy would be about 8 to 9 cm and the vertical accuracy would be 5 to 6 cm.
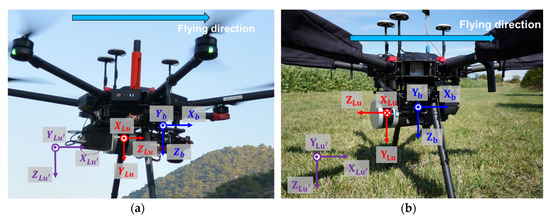
Figure 1.
UAV-based mobile LiDAR mapping systems used in this study: (a) Airborne mobile LiDAR mapping system (MLMS) 1; (b) Airborne MLMS 2.

Table 1.
Sensor specifications for LiDAR units onboard airborne MLMS: Velodyne VLP32C and VLP16 Puck Lite.
Apart from the system components for the two airborne MLMS, another difference lies in the relative orientation in which the LiDAR unit is mounted with respect to the GNSS/IMU body frame for the two systems. The nominal boresight angles relating the LiDAR unit and GNSS/IMU body frame in airborne MLMS 1 are 90°, 90°, and 0° for the roll, pitch, and heading angles, respectively, and those for airborne MLMS 2 are 90°, −90°, and 0°, respectively. One should note that these nominal values indicate that both systems will have a gimbal lock during boresight calibration due to a secondary rotation of ±90°. As suggested by Ravi et al. [33], such a gimbal lock problem can be mitigated by introducing a virtual laser unit coordinate frame approximately aligned with the IMU body frame and thereafter estimating the boresight angles relating the virtual frame and IMU body frame during calibration. The discussed coordinate systems (original and virtual laser unit coordinate frames and IMU body frame) are shown in Figure 1.
A 3D point cloud of the calibration test field used for airborne MLMS in this study is shown in Figure 2a (colored by height), along with the flight lines configuration (also colored by height with increasing height from black to white). The test field consisted of 16 highly reflective sign board targets laid on the ground along with 5 hut-shaped targets. The east side of the test field has a building, which is about 12 m high with a gable roof, while the west side is covered by vegetation. Figure 2b also shows zoomed-in images of a few of the reflective and hut-shaped targets deployed in the field. These targets are not required for the proposed profile-based calibration study. However, they are deployed in the field in order to be used to conduct the manually-assisted feature-based calibration strategy proposed by Ravi et al. [33], the results from which were to validate the accuracy of fully automated profile-based calibration strategy. One should note that the test field was similar for both UAV systems, with minor variations in the distance between the deployed targets. As shown in Figure 2c, the flight configuration for both systems consisted of 18 tracks at three different flying heights and different lateral separation. There were six tracks flown at 15 m height, another six tracks at 25 m, and six more at 45 m height. Each set of six tracks at a given flying height was comprised of three laterally separated pairs of flight lines in opposite directions.
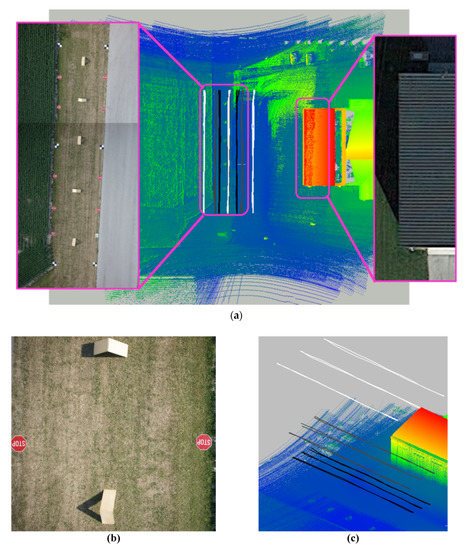
Figure 2.
Calibration test field and flight line configuration for airborne MLMS: (a) 3D point cloud and flight lines colored by height; (b) Close-up RGB image of reflective and hut-shaped targets; (c) Perspective view of flight line configuration colored by height.
2.2. Terrestrial MLMS
The terrestrial mobile mapping system used in this research (shown in Figure 3) consisted of four LiDAR units (three Velodyne HDL32E and one Velodyne VLP-16 Puck Hi-Res) along with an Applanix POSLV 220 GNSS/INS unit for direct georeferencing. The individual sensor specifications for the onboard LiDAR units are listed in Table 2 [38,39]. Following GNSS/INS post-processing, the POSLV 220 can attain an accuracy of less than 2 cm in position, and an accuracy of 0.02° and 0.025° in the roll/pitch and heading, respectively [40]. Based on the manufacturer’s specifications for sensor accuracies, we were able to derive the expected accuracy for the computed mapping frame coordinates using the LiDAR Error Propagation calculator developed by Habib et al. [37]. The calculator suggested an expected accuracy of about 2–4 cm at a range of 30 m.
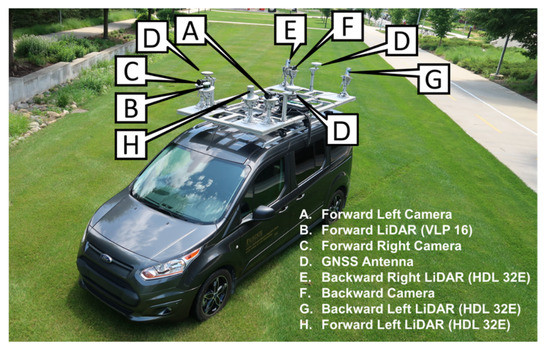
Figure 3.
Terrestrial MLMS used in this study.
Table 2.
Sensor specifications for LiDAR units onboard the terrestrial MLMS: Velodyne HDL32E and VLP16 Puck Hi-Res.
A 3D point cloud view and an aerial satellite view (Google Maps) of the calibration test field used for the terrestrial MLMS in this study is shown in Figure 4a,b, respectively. The test field was a residential area with multiple houses lined up on both sides of the street. The drive-run configuration is overlaid on Figure 4a in white showing the four tracks—two opposite drive-runs oriented in the N–S direction and two more with the E–W orientation.
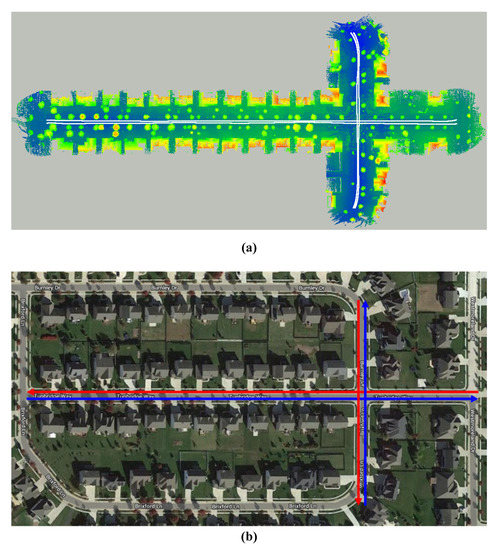
Figure 4.
Calibration test field and drive-run configuration for the terrestrial MLMS: (a) 3D point cloud (colored by height); (b) Satellite view with overlaid drive-runs.
3. Methodology
As mentioned earlier, this study proposes a calibration technique that can accurately estimate the mounting parameters, i.e., the lever-arm and boresight angles, relating the onboard LiDAR units to the GNSS/IMU position and orientation system. Inaccurate estimates of mounting parameters will result in a discrepancy between point clouds for the same area captured from different sensors along different drive-runs/flight lines. The conceptual basis of calibrating an MLMS is to minimize the above-mentioned discrepancy between point clouds. One should note that, hereafter in this paper, the point cloud captured by a single LiDAR unit in a given drive-run/flight line is regarded as an individual track. So, given the number of onboard sensors and number of drive-runs/flight lines , there will be a total of tracks, which will be used in the system calibration strategy.
There are two major components associated with the development of any calibration strategy: (1) definition of an optimal set of calibration primitives and drive-run/flight line configuration, and (2) development of a point-pairing strategy along with an optimization function for calibration. Ravi et al. [32,33] conducted a theoretical bias impact analysis for terrestrial and airborne MLMS to suggest an optimal track and calibration primitive configuration. Their study recommended to include calibration primitives that provide variability in three-dimensional coordinates of constituent points with respect to the tracks capturing these primitives to ensure sufficient control for an accurate calibration. In this study, we propose an automated targetless calibration procedure using thinly sliced profiles oriented along and across the flight/driving direction as the calibration primitives. A flowchart of the proposed methodology is shown in Figure 5.
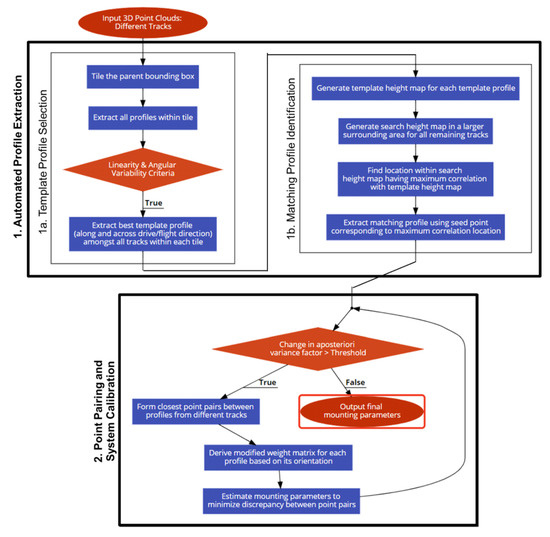
Figure 5.
Flowchart of the proposed profile-based calibration strategy.
Here, the first challenge waas to develop a strategy to extract an optimal set of profiles that would ensure sufficient control along the X, Y, and Z directions for an accurate estimation of the mounting parameters. In keeping with the findings of the aforementioned work, we developed an automated two-step profile extraction strategy, shown in Block 1 of the flowchart in Figure 5.
- Template Profile Selection: We inspected all the tracks to identify and extract template profiles, i.e., the ones that were comprised of multiple linear segments with sufficient angular variability of the fitted lines.
- Matching Profile Identification: Next, the selected template profiles were used to automatically identify their corresponding matches in the remaining tracks (drive-runs/flight lines and sensors) using a height map correlation-based strategy.
Finally, a point-pairing scheme was proposed for the extracted template and matched profiles from different tracks and an optimization function was developed to estimate the system calibration parameters—i.e., lever-arm and boresight angles for all the LiDAR units onboard the mobile system—that minimized the discrepancy between the generated point pairs, as shown in Block 2 of the flowchart. In this section, we discuss the profile-based calibration strategy in detail, starting with the introduction of the mathematical model for point positioning in systems equipped with spinning multi-beam LiDAR units. Then, we describe the automated profile extraction strategy consisting of template profile selection and profile matching, followed by the point pairing scheme and optimization function that constitute the profile-based calibration strategy for a generic MLMS equipped with several spinning multi-beam LiDAR units.
3.1. Mathematical Model for LiDAR Point Positioning
A given point, I, acquired from an MLMS can be reconstructed in the mapping coordinate system using Equation (1), which is graphically illustrated in Figure 6. The reconstruction is done by applying a coordinate transformation based on the relationship between the laser unit frame, IMU body frame, and the mapping frame. For the laser unit frame, the origin is defined at the laser beams firing point and the z-axis is along the axis of rotation of the laser unit. For a spinning multi-beam LiDAR unit, each laser beam is fired at a fixed vertical angle, ; the horizontal angle, , is determined based on the rotation of the unit; and the range, , is defined by the distance between the firing point and its footprint. So, the coordinates of the 3D point, I, captured by the laser beam relative to the laser unit coordinate system, , is defined by Equation (2). The laser unit frame is related to the IMU body frame by a rigidly defined lever arm, , and boresight matrix, . The GNSS/INS integration provides the time dependent position, , and rotation, , relating the IMU body frame and mapping coordinate systems.
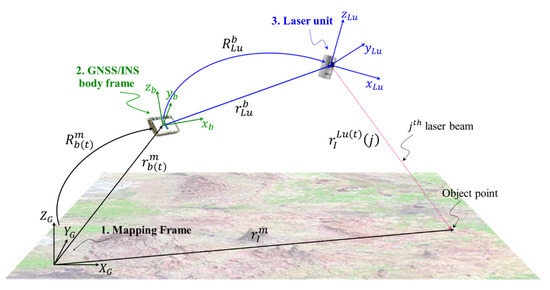
Figure 6.
Illustration of point positioning for a LiDAR system.
3.2. Automated Profile Extraction
In this section, we present an automated approach to extract an optimal set of thinly sliced profiles from the different tracks to be used for calibration. The conceptual basis for profile-based calibration is to use the thinly sliced profiles extracted from different tracks and treat them as two dimensional entities to minimize the discrepancy between them in the vertical and along profile directions. In other words, each profile will contribute to discrepancy minimization in two directions. Having stated the overview of the contribution of a profile towards calibration, we proceed to state the desired characteristics of a profile that would ensure its contribution towards establishing sufficient control in three-dimensional space for an accurate calibration.
- Since a profile contributes towards discrepancy minimization in the vertical and profile-length directions, it should have a unique definition along these directions. This implies that profiles which are mainly constituted of points with planar neighborhoods should not be used for calibration. Rather, profiles with a majority of linear neighborhoods would facilitate an accurate point pairing for discrepancy minimization in the two aforementioned directions.
- In order to ensure discrepancy removal in the vertical and profile-length directions, a profile should not be monotonous, i.e., there should be variability within the points constituting the profile. This criterion is ensured by selecting profiles that are comprised of multiple linear segments with sufficient angular variability of the fitted line segments.
The above two conditions constitute the basis for the development of an automated algorithm to identify and extract template profiles from one of the tracks covering the calibration test field that would be used for calibration. In the following subsections, we first develop an algorithm for automated template profile selection and extraction, followed by proposing a strategy for automated profile matching within the remaining tracks for calibration.
3.2.1. Template Profile Selection
As discussed earlier, template profiles are selected by analyzing the angular variability of individual line segments constituting the profile. The selection of template profiles from the given point clouds captured from different tracks is conducted heuristically. In other words, the entire point cloud is parsed to analyze the characteristics of candidate profiles and decide whether each profile qualifies as a template for calibration. One should note that each of the steps involved in the proposed template profile selection algorithm is illustrated using a sample 3D point cloud illustrated in Figure 7.
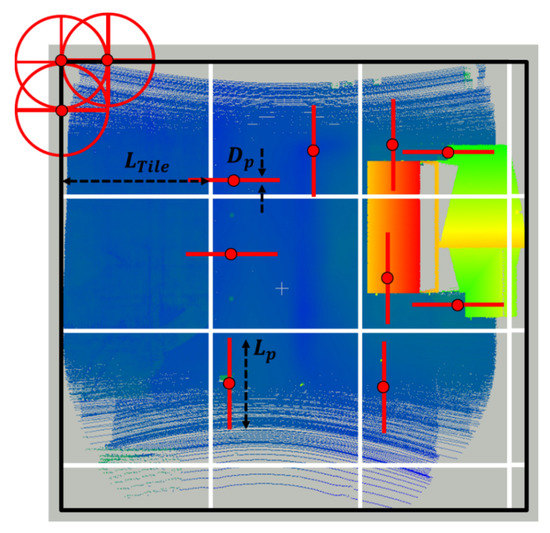
Figure 7.
Illustration of template profile selection for MLMS calibration.
In order to select template profiles for calibration, we first determine the bounding box that contains the union of the point clouds captured from all the tracks, denoted henceforth as the parent bounding box, shown as the black rectangle encompassing the 3D point cloud in Figure 7. The parent bounding box is tiled using pre-defined dimensions , as shown in Figure 7 as white grid lines. The desired length and depth of profiles is also specified by the user and these parameters are used as the basis for extracting the profiles that will be assessed for their validity to be used as a template profile. Once the point clouds are tiled collectively, each tile corresponding to each track is processed separately to extract the best candidate template profiles along as well as across flight/driving direction. The best profile in each direction is designated to be the one with the highest angular variability of the fitted line segments within the profile. Within each tile, a seed point for profile extraction is chosen at one of the corners of the tile to extract two profiles with the designated profile width—one along the flight/driving direction and another across the flight/driving direction—extending on either sides of the seed point to result in the desired profile length. One should note that the extracted profile points are allowed to extend beyond the tile boundaries when the seed points are located at the edges. This is done to ensure that the algorithm does not miss the extraction of a qualifying template profile that is located at the edge between two adjacent tiles. This profile extraction step is repeated by shifting the seed points throughout the tile bounds in the X and Y directions with a step size of half the designated profile length, as shown in Figure 7 by the red circles inside the top left tile. Once all the profiles within the tile are extracted, each profile is treated as a two-dimensional entity, so all the points within the profile are transformed to obtain the corresponding two-dimensional coordinates which are aligned along the vertical and profile-length directions. So, the variability of the points along the profile depth (which should be small enough to treat the profile as a 2D entity) is completely eliminated. Next, the transformed 2D profile points undergo the first screening criterion (as stated in Section 3.2), which targets the removal of any profile that is predominantly planar, such as profiles extracted along a building wall face, since point pairings along such profiles cannot be used to minimize discrepancies in the vertical and profile-length directions. Each 2D point within the profile is labeled as linear or planar by conducting a Principal Component Analysis (PCA) [41] of its neighborhood (with a user-defined search radius determined based on the local point spacing [42]) and any profile with a majority of planar points is immediately rejected. A sample of profiles—one accepted and one rejected—using this linearity criterion is shown in Figure 8, where the blue points denote planar neighborhoods and red points denote linear neighborhoods. The retained profiles undergo further processing wherein the identified linear neighborhood points within the profile are used to conduct a 2D segmentation to cluster the points into different line segments. One should note that the line segments are tested on their lengths and the number of points to ensure that too short or sparsely populated line segments are not considered for further assessment of angular variability. One such profile is shown in Figure 9, where the black points denote the points classified as a part of planar neighborhoods (thus, not used for 2D segmentation), white points denote the points that were classified as belonging to linear neighborhoods but not included as part of any of the segmented lines due to either the sparse nature or short length of resultant line segments from such points. The rest of the points are colored according to the individual line segments they belong to. The angles subtended by the fitted line segments and the axis denoting the direction along the profile length are also computed. For the profile displayed in Figure 9, the line segments have angles of 3.08°, 89.03°, and 0.32° for blue, green, and red colored clusters, respectively. Finally, these recorded angles of each qualifying line segment within a profile are used to derive the angular variability within the profile. All the profiles oriented along the flight/driving direction within a tile are sorted based on the angular variability and the one with the highest angular variability that also exceeds a user-defined variability threshold is selected and stored as the template profile within that tile. The same is repeated to select the best profile across the flight/driving direction within the tile. One should note that within each tile, the point cloud from each of the tracks/sensors is analyzed individually and the best profile within the tile is extracted by comparing the angular variability of the profiles coming from all the tracks covering this tile. The same approach is repeated for each tile within the parent bounding box. So, we will have a maximum of two qualifying template profiles from each tile, as shown in Figure 7 as red lines within each tile with a central solid circle denoting the corresponding seed point. One should note that there might be tiles with no template profiles due to none of the candidate profiles within the tile satisfying the criteria for template profile selection. Given the heuristic approach that exhaustively searches through the entire point cloud, the resultant set of template profiles is bound to have the best possible distribution of profile orientation along and across the flight/driving direction for a given test field, as required for an accurate system calibration.
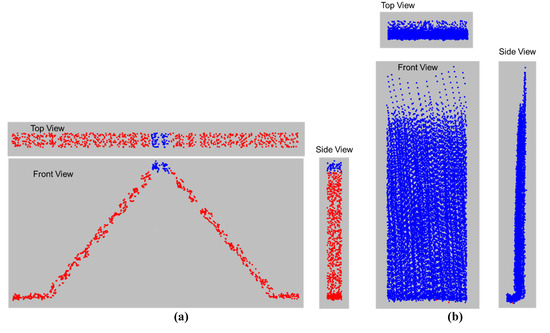
Figure 8.
Illustration of sample profiles with labeled linear (red) and non-linear (blue) points: (a) Retained profile after linearity criterion; (b) Rejected profile after linearity criterion.
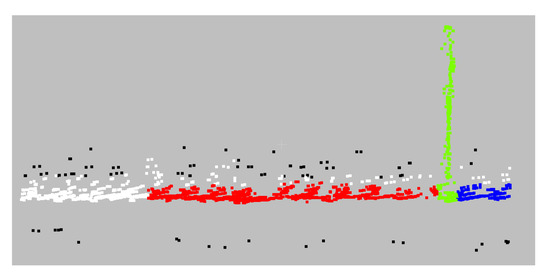
Figure 9.
Sample profile with classified non-linear points (black), linear unsegmented points (white), and three individual line segments (blue, green, and red).
3.2.2. Matching Profile Identification
Once the template profiles are extracted with each template coming from a specific track (denoted henceforth as the reference track), the next step is to identify the corresponding matching profiles in the remaining (non-reference) tracks. In this research, we propose an automated profile matching technique based on height map correlation. Using the seed point for each extracted template profile as the center, a template height map is generated for points belonging to a square window around the seed point with dimensions equal to the extracted profile length . The generated height map is gridded into smaller cells whose dimensions are determined based on the local point spacing of the point cloud. Each cell within the template height map is assigned the 95th percentile height of all points inside the cell. Next, a larger search window with the tile dimensions used for template profile selection is created around the seed point and the points from the non-reference tracks covering this window are isolated to generate a gridded search height map. Now, a moving window of size is used to find the location within the search height map that has the highest correlation (more than 90%) with the previously established template height map. A highly correlated 95th percentile height map indicates the similarity of the two neighborhoods being compared. So, the central point for this highest correlation location is designated as the seed point for the matching profile within the non-reference track and is used to extract the matching profile with the same profile length and depth as the template profile. This procedure is applied to each non-reference track and for each extracted template profile to find and extract the matching profiles for calibration. A sample template profile (colored by its individual line segments) is shown in Figure 10a and the same profile along with its corresponding matches in 17 other tracks having discrepancies ranging up to 2 m are illustrated in Figure 10b, where a unique color (blue to red) is assigned to each non-reference track and the points belonging to the reference track are colored in black.
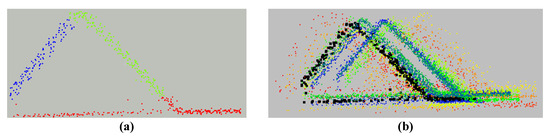
Figure 10.
Sample template and matched profiles: (a) template profile colored by individual fitted lines; (b) same template profile (in black) and its matched profiles in 17 non-reference tracks (colored from blue to red).
3.3. Point Pairing Scheme and Optimization Function for Calibration
Once the template and matching profiles are extracted, the next step is to proceed with the calibration and establish a suitable point pairing scheme along with an appropriate objective function for the estimation of mounting parameters for all the LiDAR units onboard the mobile system. In order to conduct a profile-based calibration, the objective is to minimize the discrepancy between the mapping frame coordinates for all the point pairs formed between different tracks for each extracted profile. Each pairing between conjugate points will result in a random misclosure vector , as given in Equation (3). The point pairs for each profile are formed by firstly sorting all the tracks for this profile in a decreasing order in terms of the number of points. Starting from the track with the second most number of points, each point within this track is used to find its closest counterpart in the first track, which is also closer than a pre-defined distance threshold. A similar procedure is adopted for all the tracks to pair them with the closest point found in the preceding tracks, starting with the reference one. Once the point pairs are formed for all the extracted profiles, the last step is to estimate the mounting parameters by minimizing the discrepancy between the point pair coordinates. However, one should note that the profile matching strategy proposed in Section 3.2.2 would ensure the profile uniqueness only along the profile length but not along its depth. For instance, for the hut-shaped target (approximately 0.60 m wide) shown in Figure 11a, the selected template profile is shown in red and the corresponding matched profile is shown in blue in Figure 11b,c. As evident from such illustration, the profile uniqueness is guaranteed in the vertical and profile-length directions, whereas the uniqueness cannot be ensured along the profile depth since the hut will have very similar variation for all the profiles extracted anywhere within the 0.60 m wide area of the hut-shaped target. So, in this case, non-conjugate point pairs will be formed, which will result in an additional non-random component in the misclosure vector, given in Equation (4). One should note that this non-random component is aligned in the profile-depth direction. So, as mentioned earlier, the objective function for calibration would aim to minimize the discrepancy between profile point pairs only in the vertical and corresponding profile-length directions. Mathematically, this could be achieved by defining a modified weight matrix , which would nullify the non-random component of the misclosure vector, , as given in Equation (5) [43]. From the automated profile extraction strategy, the orientation of each profile is known, denoted henceforth by , which is the angle between the profile length direction and the X-axis of the mapping frame coordinate system. Then, the rotation matrix given in Equation (6) will relate the mapping frame coordinate system to the profile coordinate system . Here, the -axis is oriented along the profile length, -axis is oriented along the profile depth, and -axis is in the vertical direction, as shown in Figure 11b,c. The weight matrix, (which depends on the point cloud accuracy), in the mapping coordinate system is transformed to a weight matrix, , in the profile coordinate system according to the law of error propagation (Equation (7)). Next, the weight matrix, , is modified by assigning zero weights to the elements corresponding to the direction along the profile depth (Equation (8)) and the modified weight matrix, , is transformed back into the mapping frame to obtain using Equation (9). Finally, the obtained modified weight matrix is applied to the condition in Equation (4) to only retain the discrepancy between non-conjugate point pairs in the vertical and profile-length directions. The mounting parameters are estimated with the objective to minimize the resultant discrepancies between the non-conjugate point pairs. After each iteration of mounting parameters estimation, the point pairing is conducted again by identifying the closest points using the newly reconstructed point coordinates from the revised estimates of mounting parameters. The next section demonstrates the results of the proposed profile-based calibration strategy for several mobile mapping systems—both airborne and terrestrial—equipped with one or more LiDAR units.
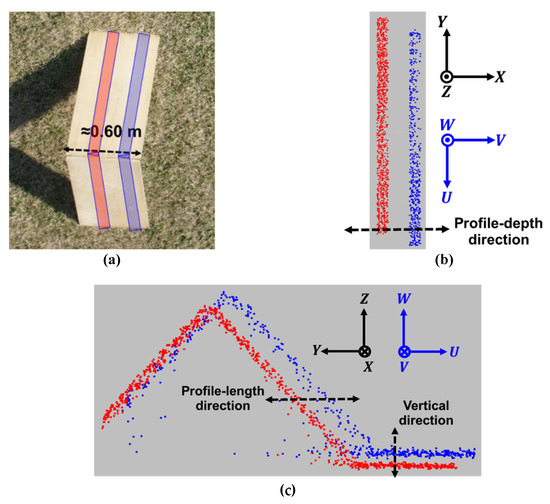
Figure 11.
Sample template and matched profiles along a hut-shaped target: (a) RGB image of hut-shaped target; (b) Top view of template (red) and matched (blue) profiles; (c) Front view of template (red) and matched (blue) profiles.
4. Experimental Results and Discussion
In this section, we present the calibration results for two different UAV-based LiDAR systems (equipped with one LiDAR unit each) and one terrestrial mobile LiDAR system (equipped with four LiDAR units). For each of the systems, we evaluated the performance of the two components of the proposed profile-based calibration – (1) automated profile selection and matching results, and (2) resultant mounting parameter estimates after calibration. The automated profile selection algorithm was validated by checking the fitted line segments and their angular variation within each of the selected profiles. Furthermore, the profile matching strategy was verified by a qualitative inspection of the matched profiles as well as the report for all the tracks where each template profile is matched. The parameters used for automated template profile selection and profile matching for the three MLMS are listed in Table 3. Owing to the similarity of the calibration test fields and flight configuration for both airborne MLMS, the same values are assigned for the different parameters used. The tile dimensions for airborne MLMS were set to 7 m since the average spacing between the different huts ranged between 6 m to 9 m; thus, a tile dimension of 7 m ensured that no two huts lie within the same tile. However, in the case of terrestrial MLMS where the test site covered a large area with a vast collection of similar-looking entities (in this case, houses lined up on either side of the road), the tile size was increased to 20 m to avoid redundant profiles for calibration. The profile length was set to 2 m for both airborne MLMS, which was chosen based on the calibration test field such that there would be sufficient angular variability within the total length of the extracted profile. In the case of terrestrial MLMS, the profile length was increased to 10 m, which would result in profiles spanning the road surface to building roof. The profile depth should be a small value in order to ensure that the resultant extracted profile is thin enough to be treated as a two-dimensional entity for calibration. Another criterion for choosing profile depth is to ensure a unique definition of the profile in the vertical and profile-length directions and minimum variability in the profile-depth direction. In this research, a profile depth of 0.10 m was chosen for airborne and terrestrial MLMS. The chosen value for profile depth applied to all the MLMS, even though the VLP16 has a higher local point spacing than VLP32C/HDL32E. This is due to the fact that the local point spacing was less than 0.10 m for all the sensors, thus ensuring that there were sufficient points within the extracted profile to define it uniquely in the vertical and profile-length directions. Moreover, the terrain of the calibration test fields ensured that there was negligible variability within 0.10 m along the profile-depth direction. One should note that the calibration results are not sensitive to the profile depth or profile length thresholds and these can be approximated based on the characteristics of the calibration test field and local point spacing. Finally, any profile with an angular variance greater than 45° was extracted as a template. For profile matching, the template and search height map cell size was set to 0.20 m based on the local point spacing and the height map correlation threshold was set to 90%, i.e., any profile was deemed as a match to the corresponding template profile if the correlation between template and search height maps was more than 90%.
Table 3.
Parameters and thresholds used for automated profile extraction.
The extracted template and matched profiles were used for calibrating the different MLMS using the proposed profile-based calibration strategy, whose results are validated using the following criteria:
- Square root of aposteriori variance factor after calibration, which was used as a representative of the discrepancy between the established point pairs.
- Standard deviation of the estimated parameters, which was expected to indicate the respective confidence intervals.
- Qualitative assessment based on the alignment between profiles from different tracks (drive-runs/flight lines and sensors) before and after calibration, which would also be reflected by the aposteriori variance factor.
A previous study by Ravi et al. [32,33] proposed a manually assisted feature-based calibration strategy for MLMS and proved its ability to attain the best possible accuracy in keeping with the manufacturer’s specifications for the onboard sensors. Therefore, in addition to conducting a profile-based calibration, all the systems were also calibrated using the existing manually assisted feature-based calibration technique. Several planar features, such as highly reflective sign boards, hut facades, building facades, roof patches, and ground patches, were manually extracted within each of the calibration test fields in order to conduct the feature-based calibration. A comparative analysis of the two calibration approaches wasconducted based on the following criteria:
- Similarity of and standard deviation of the estimated parameters from the two approaches.
- Similarity of estimated mounting parameters from the two calibration strategies by assessing their impact on the reconstructed profiles while considering the expected point positioning accuracy. This similarity was qualitatively and quantitatively evaluated as follows:
- Qualitative evaluation: visual assessment of the alignment between the reconstructed profile points using parameters from the two calibration strategies.
- Quantitative evaluation: difference in 3D mapping frame coordinates (using Equation (1)) of points computed based on the different calibration parameters.
In the following subsections, we provide detailed results for the extracted template profiles, profile matching, and qualitative and quantitative evaluation of calibration results for the three MLMS.
4.1. Airborne MLMS 1
The automated template profile selection resulted in a total of 23 template profiles being extracted in the calibration test field for the airborne MLMS 1 and these are shown in Figure 12, where each template profile is colored by its individual fitted line segments. The resultant angular variation of the fitted line segments within the template profiles are listed in Table 4. Proceeding further, the template profiles were matched to find corresponding matching profiles in the remaining tracks, which were used for point pairing and subsequent system calibration. The overall layout of all the automatically extracted template and matched profiles in the calibration test field is shown in Figure 13. The figure displays the profile IDs along with the track in which the corresponding template profile was selected. The matched profiles (including the template) for the 23 extracted profiles are shown individually in Figure 14, where each profile is colored according to the track in which it was captured. One should note that the observed discrepancy between different tracks using the manually measured initial approximations of the mounting parameters ranged up to 2 m in the horizontal directions and up to 0.50 m in the vertical direction. Table 5 shows a list of all tracks in which each profile was extracted, where the track corresponding to template profile is highlighted in yellow. The automatically extracted template and matched profiles are used to perform a system calibration using the proposed point pairing scheme to minimize the discrepancy between the profiles captured from different flight lines. The manually measured initial approximations, profile-based calibration results, and feature-based calibration results for the mounting parameters are listed in Table 6 along with the standard deviations for each of the parameters as obtained from profile-based and feature-based calibrations.
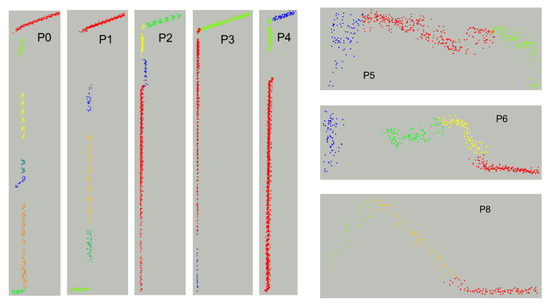
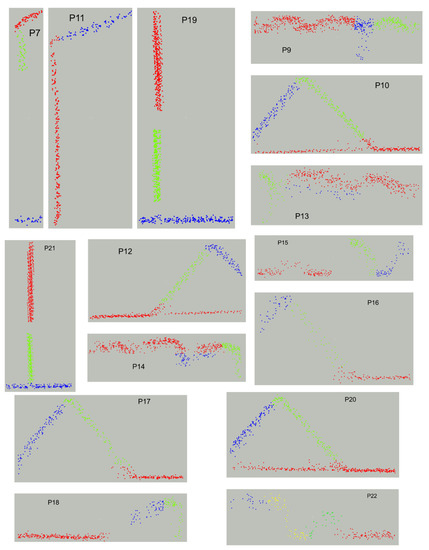
Figure 12.
Airborne MLMS 1: template profiles colored by individual line segments.
Table 4.
Airborne MLMS 1: angular variation of fitted line segments within selected template profiles.
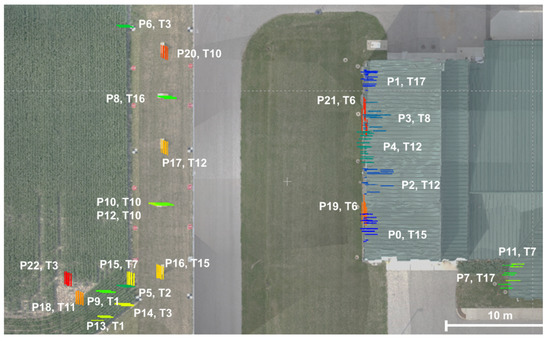
Figure 13.
Airborne MLMS 1: extracted template and matched profiles with profile IDs and reference track number.
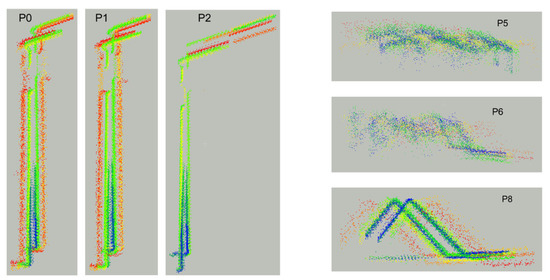
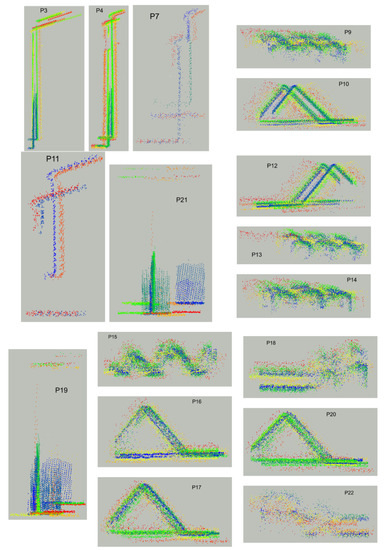
Figure 14.
Airborne MLMS 1: automatically extracted template and matched profiles, where each profile is colored by the track in which it was captured (discrepancy ≈ 2 m).
Table 5.
Airborne MLMS 1: List of tracks (flight lines or sensors) in which each profile was extracted. The track corresponding to template profile is highlighted in yellow
Table 6.
Parameters and thresholds used for automated profile extraction.
The calibration results were evaluated qualitatively and quantitatively based on the previously mentioned criteria. Figure 15 shows the reconstructed profiles before and after profile-based calibration, where each of the profiles are colored by the track in which they were captured. It can be seen that the alignment between different profiles exhibits significant improvement after calibration for all the profiles, which is also reflected by the value of 1.77 cm listed in Table 6. The ability of the proposed profile-based calibration technique to reduce the misalignment from about 2 m to less than 2 cm proves its feasibility for cases where the initial approximations of the mounting parameters are significantly different from the true values. The value for manually-assisted feature-based calibration is 2.20 cm and the standard deviations of the estimated parameters from the two calibration approaches are similar, which indicates that the two approaches perform at par in terms of the resultant alignment after calibration as well as the confidence interval of the estimated parameters. The profiles are reconstructed using the mounting parameters from the two different calibration approaches and are shown in Figure 16, where the points in blue and red are reconstructed using profile-based and feature-based calibration results, respectively. Figure 16 indicates that the mapping frame coordinates derived from the two sets of mounting parameters are similar for all the profiles. Table 7 shows the resultant mean, standard deviation, and root mean squared error values for the difference between mapping frame coordinates (X, Y, and Z) derived using the estimated mounting parameters from both calibration strategies. The differences in mapping frame coordinates can be observed to lie in the range of 1 to 5 cm, which is less than the expected point positioning accuracy of ±8–9 cm based on the individual accuracies of the involved sensors and reconstruction parameters (such as range and horizontal FOV of reconstruction). Since the accuracy of feature-based calibration strategy is already proven in prior work, the difference of 1 to 5 cm in the mapping frame coordinates derived using profile-based and feature-based calibration strategies validates the accuracy of the proposed calibration procedure.
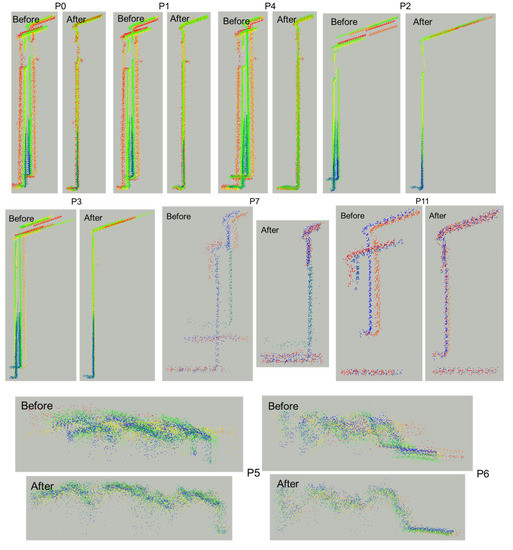
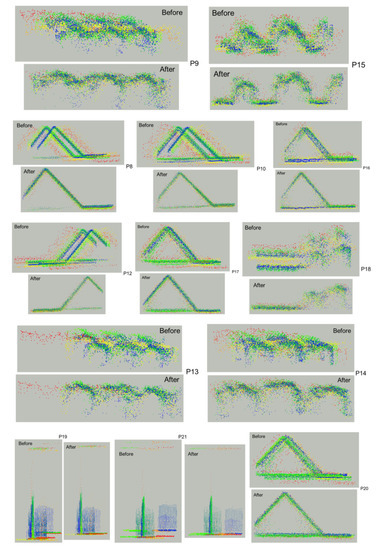
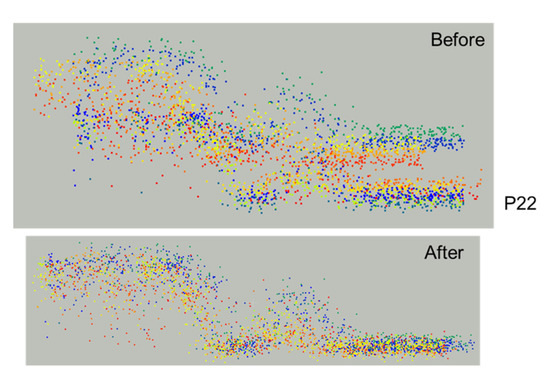
Figure 15.
Airborne MLMS 1: alignment between the profiles (colored by tracks) before and after profile-based calibration .
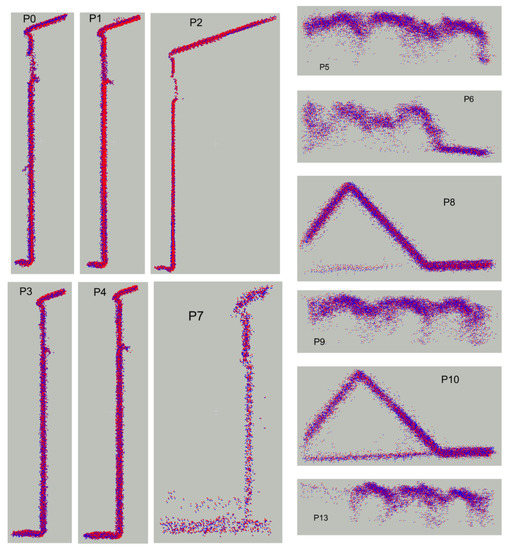
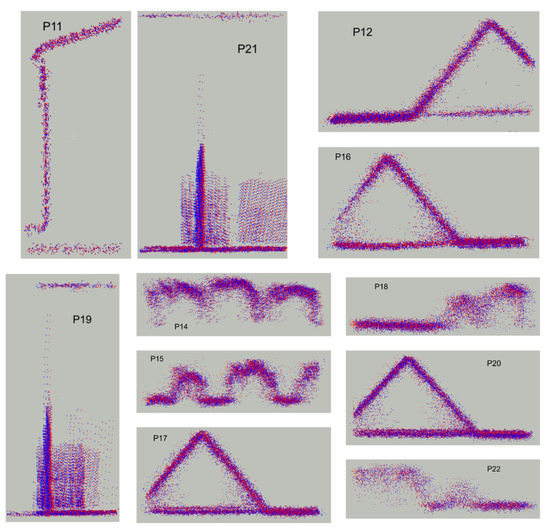
Figure 16.
Airborne MLMS 1: profiles reconstructed from profile-based (blue) and feature-based (red) calibration results.
Table 7.
Airborne MLMS 1: comparison between mapping frame coordinates of profile points derived using profile-based and feature-based calibration parameters (No. of points = 203,163).
4.2. Airborne MLMS 2
There were a total of 19 template profiles extracted in the calibration test field for the airborne MLMS 2. Since the test field was similar to the one used for airborne MLMS 1, only four out of the nineteen profiles were used for qualitative assessment of the results from each step within profile-based calibration. The chosen subset of profiles includes one along the wall of a building, two profiles over hut-shaped targets (one oriented along and another across the flying direction), and the last profile along a pole in the test area. These four profiles are shown individually in Figure 17, where each template profile is colored by its fitted line segments. One should note that the point cloud from airborne MLMS 2 (VLP16 Puck Lite) has a lower point density compared to that from airborne MLMS 1 (VLP32C), but as stated earlier, the chosen profile depth of 0.10 m is sufficient to extract points that define the profile uniquely in the vertical and profile-length directions. The resultant angular variation of the fitted line segments within each profile is listed in Table 8. Next, the template profiles were matched to find corresponding profiles in the remaining tracks. The overall layout of all the automatically extracted template and matched profiles in the calibration test field is shown in Figure 18 along with the profile ID and reference track ID for each profile. The matched profiles (including the template) for the subset of extracted profiles are shown individually in Figure 19, where each profile is colored by the track in which it was captured. The misalignment between the different tracks due to initial approximations of the mounting parameters ranges up to 3 m in the horizontal directions and about 0.50 m in the vertical direction. Table 9 shows all the tracks where each profile has been extracted, with the track corresponding to the template profile highlighted in yellow. The automatically extracted template and matched profiles were used to perform a system calibration. The manually measured initial approximations, profile-based calibration results, and feature-based calibration results for the mounting parameters are listed in Table 10, along with their respective standard deviations.
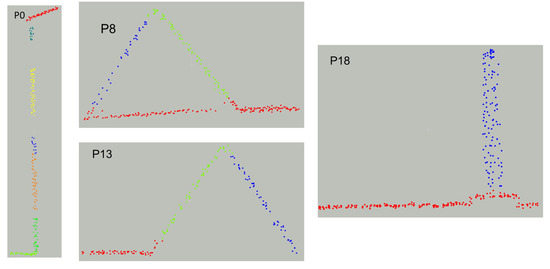
Figure 17.
Airborne MLMS 2: sample template profiles colored by individual line segments.
Table 8.
Airborne MLMS 2: angular variation of fitted line segments within selected template profiles.
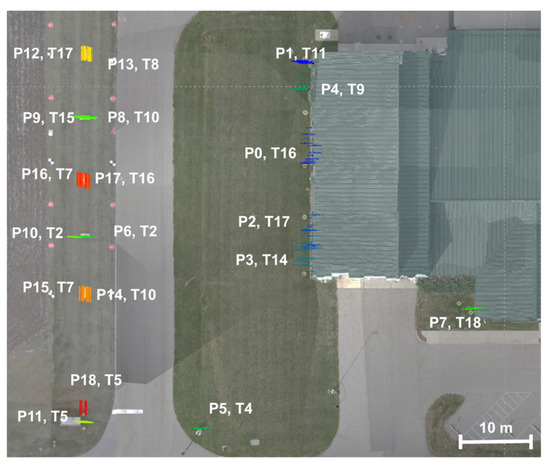
Figure 18.
Airborne MLMS 2: extracted template and matched profiles with profile IDs and reference track number.
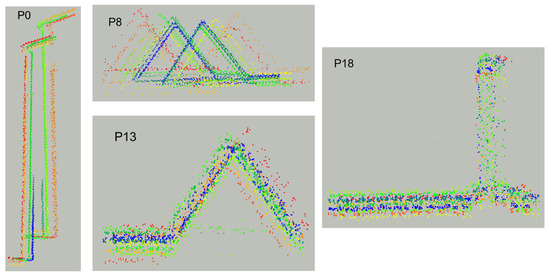
Figure 19.
Airborne MLMS 2: automatically extracted template and matched sample profiles, where each profile is colored by the track in which it was captured (discrepancy between tracks ≈ 3 m).
Table 9.
Airborne MLMS 2: list of tracks (flight lines or sensors) in which each profile has been extracted. The track corresponding to the template profile highlighted in yellow.
Table 10.
Airborne MLMS 2: manually measured initial approximations, profile-based calibration results, feature-based calibration results, and standard deviation of estimates for the mounting parameters for all the sensors.
The resultant sample profiles before and after calibration are depicted in Figure 20, indicating a significant improvement in the alignment between different tracks for each of the profiles. The quality of alignment is also reflected by the value of 1.98 cm listed in Table 10. In other words, the proposed calibration strategy reduces the misalignment from approximately 3 m to less than 2 cm. The value of 2.33 cm for feature-based calibration and the similarity in standard deviations of the estimated parameters from the two calibration approaches indicate the compliance of the results from the two approaches in terms of the alignment after calibration as well as the confidence interval of estimated parameters. Figure 21 shows the qualitative comparison for each of the sample profiles reconstructed using the mounting parameters from the two different calibration strategies (blue denotes the reconstruction after profile-based calibration and red denotes the same for feature-based calibration). Table 11 lists the mean, standard deviation and RMSE of differences between the mapping frame coordinates of all the profile points as reconstructed using the estimated mounting parameters from the two calibration strategies. Again, the differences are observed to lie in the range of 0.5 to 3 cm, which is less than the expected point positioning accuracy of ±8-9 cm based on the individual accuracies of the involved sensors and reconstruction parameters. This again validates the accuracy of the profile-based calibration based on its comparison with the previously established feature-based calibration strategy.
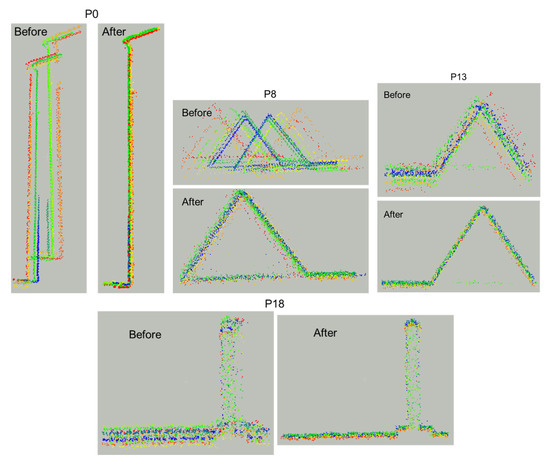
Figure 20.
Airborne MLMS 2: Alignment between the sample profiles (colored by tracks) before and after profile-based calibration .
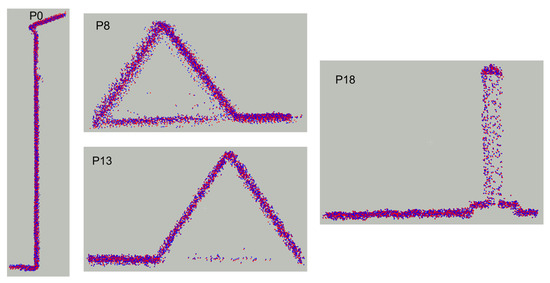
Figure 21.
Airborne MLMS 2: sample profiles reconstructed from profile-based (blue) and feature-based (red) calibration results.
Table 11.
Airborne MLMS 2: comparison between mapping frame coordinates of profile points derived using profile-based and feature-based calibration parameters (No. of points = 166,604).
4.3. Terrestrial MLMS
There were a total of 11 template profiles extracted in the calibration test field for this system, as shown individually in Figure 22, where each template profile is colored by its fitted line segments. The resultant angular variation of the fitted line segments within each profile is listed in Table 12. Next, the template profiles were matched to find corresponding profiles in the remaining tracks. One should note that there were four LiDAR units mounted on the terrestrial MLMS, each capturing point clouds from four drive-runs, so there was a total of sixteen tracks used for calibration. The overall layout of all the extracted template and matched profiles is shown in Figure 23. The matched profiles (including the template) for a sample of extracted profiles are shown in Figure 24, where each profile is colored by the track in which it was captured. The initial misalignment between different tracks before calibration is observed to be about 1 m in the horizontal and vertical directions. Table 13 depicts all the tracks in which each profile was identified and extracted with the track corresponding to template profile highlighted in yellow. The extracted template and matched profiles were used to perform a system calibration and the manually measured initial approximations, profile-based calibration results, and feature-based calibration results for the mounting parameters are listed in Table 14 along with the respective standard deviations.
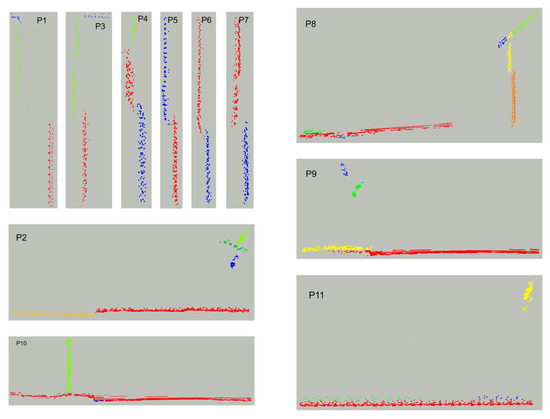
Figure 22.
Terrestrial MLMS: Template profiles colored by individual line segments.
Table 12.
Terrestrial MLMS: Angular variation of fitted line segments within selected template profiles.
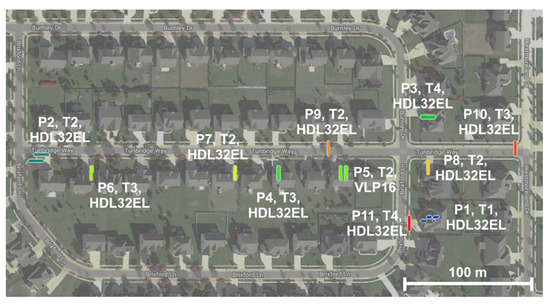
Figure 23.
Terrestrial MLMS: Extracted template and matched profiles with profile IDs and reference track number.
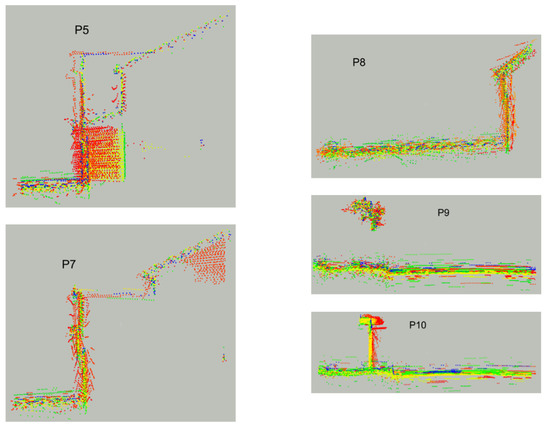
Figure 24.
Terrestrial MLMS: Automatically extracted template and matched sample profiles, where each profile is colored by the track in which it was captured (discrepancy ≈ 1 m).
Table 13.
Terrestrial MLMS: List of tracks (drive-runs or sensors) in which each profile has been extracted. All the tracks in which each profile was identified and extracted with the track corresponding to template profile highlighted in yellow.
Table 14.
Terrestrial MLMS: Manually measured initial approximations, profile-based calibration results, feature-based calibration results, and standard deviation of estimates for the mounting parameters for all the sensors.
The resultant profiles before and after calibration are depicted in Figure 25, which indicates a significant improvement in the alignment between different tracks for each of the profiles, also reflected by the value of 1.72 cm. In other words, the profile-based calibration succeeds in reducing the misalignment from 1 m to less than 2 cm. Again, the similarity in the standard deviations of the estimated parameters from the two calibration strategies along with the value of 1.57 cm for feature-based calibration indicate that the two approaches attain similar resultant alignment and confidence intervals for the estimated parameters after calibration. The qualitative comparison between the mounting parameters estimated from profile-based and feature-based calibration strategies are shown for some sample profiles in Figure 26, wherein the points in blue are reconstructed using the parameters from profile-based calibration and those in red are the same points reconstructed using the mounting parameters derived from feature-based calibration. Table 15 lists the mean, standard deviation and RMSE of differences between the mapping frame coordinates of all the profile points as reconstructed from the mounting parameters derived using the two different calibration strategies. Here, the differences between the mapping coordinates derived from the two sets of mounting parameters is observed to be less than 2 cm, thus in coherence with the expected point positioning accuracy of 2–4 cm based on the manufacturer’s specifications for the sensor accuracies. As observed earlier for the airborne mobile mapping systems, it can be seen that the results from profile-based calibration for terrestrial systems with multiple LiDAR units are also consistent with the corresponding feature-based calibration results.
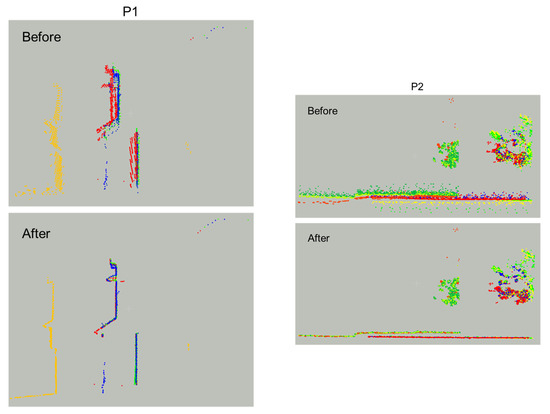
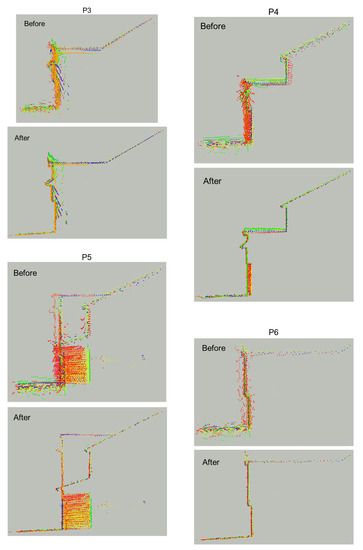
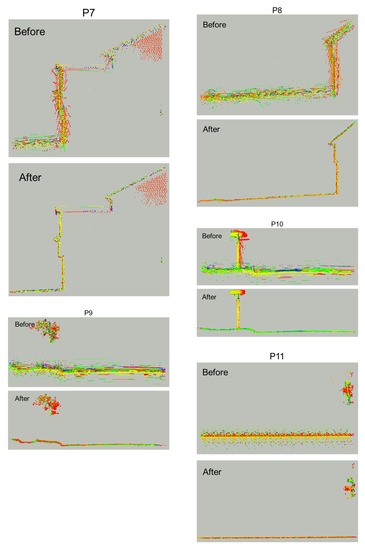
Figure 25.
Terrestrial MLMS: Alignment between the profiles (colored by tracks) before and after profile-based calibration .
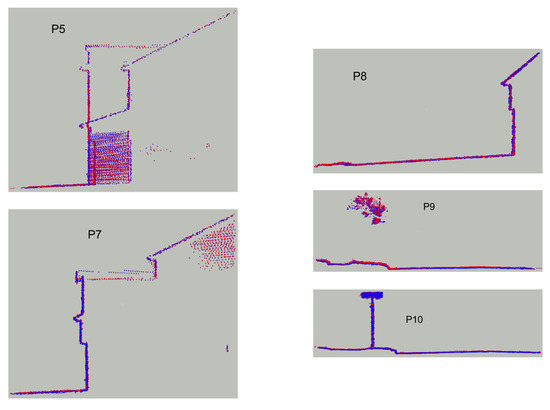
Figure 26.
Terrestrial MLMS: Sample profiles reconstructed from profile-based (blue) and feature-based (red) calibration results.
Table 15.
Terrestrial MLMS: Comparison between mapping frame coordinates of profile points derived using profile-based and feature-based calibration parameters (No. of points = 131,591).
5. Conclusions and Recommendations for Future Research
In this paper, we presented a novel approach for a fully automated system calibration procedure that does not rely on specially designed targets or a manual feature extraction procedure. Instead, we propose a profile-based calibration technique wherein thin profiles are automatically selected and extracted from the point clouds based on a two-dimensional linear segmentation within the profile and the resultant angular variability of the fitted lines. Moreover, the selected template profiles are used to find their corresponding profiles in the remaining tracks using a height map correlation-based matching strategy. The extracted template and matched profiles are then used for performing the LiDAR system calibration by pairing points within the profile coming from different drive-runs/flight lines and/or sensors and minimizing the discrepancy between the point pair coordinates in the vertical and profile-length directions. Finally, the proposed fully automated calibration technique was experimentally validated using two different airborne systems with a single LiDAR unit and a terrestrial system with four LiDAR units.
The proposed strategy was seen to reduce the misalignment between different tracks from approximately 2 to 3 m before calibration down to less than 2 cm after calibration for airborne as well as terrestrial MLMS. These results emphasize the achievable relative accuracy of the proposed strategy capability along with its ability to derive accurate estimates of mounting parameters even on starting from significantly different initial approximations. Furthermore, the accuracy of the obtained results was also verified by comparing them with results from a previously proven manually assisted feature-based calibration strategy. The quantitative difference between the two approaches derived on the basis of the comparison of mapping frame coordinates was found to be in the range of 1 to 5 cm for airborne MLMS and 0.5 to 3 cm for terrestrial MLMS. Both of these values indicate that the two calibration approaches have a similar performance within the range of expected point positioning accuracy derived based on the sensor specifications. Therefore, the fully automated targetless profile-based calibration strategy proposed in this paper is proven in terms of its feasibility and achieved accuracy for airborne as well as terrestrial mobile mapping systems equipped with one or more 3D LiDAR units.
Future research in this area will focus on evaluating the applicability of the proposed profile-based calibration technique for systems equipped with 2D LiDAR units. Moreover, the proposed approach will be extended to suggest a similar fully automated calibration technique for the simultaneous calibration of cameras and LiDAR units onboard a mobile mapping system.
Author Contributions
Conceptualization, formal analysis, investigation, methodology, and validation, R.R. and A.H.; software, R.R.; writing—original draft preparation, R.R.; writing—review and editing, A.H.; supervision, A.H. All authors have read and agreed to the published version of the manuscript.
Funding
The work was partially supported by the Civil Engineering Center for Applications of UAS for a Sustainable Environment (CE-CAUSE) at Purdue University. The research was supported in part by the Joint Transportation Research Program – administered by the Indiana Department of Transportation and Purdue University – and the Advanced Research Projects Agency-Energy (ARPA-E), U.S. Department of Energy, under Award Number DE-AR0000593. The contents of this paper reflect the views of the authors, who are responsible for the facts and the accuracy of the data presented herein, and do not necessarily reflect the official views or policies of the sponsoring organizations.
Conflicts of Interest
The authors declare no conflict of interest.
References
- Wang, Y.; Cheng, L.; Chen, Y.; Wu, Y.; Li, M. Building Point Detection from Vehicle-Borne LiDAR Data Based on Voxel Group and Horizontal Hollow Analysis. Remote Sens. 2016, 8, 419. [Google Scholar] [CrossRef]
- Lin, Y.; Hyyppa, J.; Jaakkola, A. Mini-UAV-Borne LIDAR for Fine-Scale Mapping. IEEE Geosci. Remote Sens. 2011, 8, 426–430. [Google Scholar] [CrossRef]
- Kwak, E.; Habib, A. Automatic representation and reconstruction of DBM from LiDAR data using Recursive Minimum Bounding Rectangle. ISPRS J. Photogramm. 2014, 93, 171–191. [Google Scholar] [CrossRef]
- Holgado-Barco, A.; Gonzalez-Aguilera, D.; Arias-Sanchez, P.; Martinez-Sanchez, J. An automated approach to vertical road characterisation using mobile LiDAR systems: Longitudinal profiles and cross-sections. ISPRS J. Photogramm. 2014, 96, 28–37. [Google Scholar] [CrossRef]
- Kang, Y.; Roh, C.; Suh, S.; Song, B. A Lidar-Based Decision-Making Method for Road Boundary Detection Using Multiple Kalman Filters. IEEE Trans. Ind. Electron. 2012, 59, 4360–4368. [Google Scholar] [CrossRef]
- Ravi, R.; Cheng, Y.T.; Lin, Y.C.; Lin, Y.J.; Hasheminasab, S.M.; Zhou, T.; Flatt, J.E.; Habib, A. Lane Width Estimation in Work Zones Using LiDAR-Based Mobile Mapping Systems. IEEE Trans. Intell. Transp. Syst. 2019. [Google Scholar] [CrossRef]
- Fisher, R.J.; Sawa, B.; Prieto, B. A novel technique using LiDAR to identify native-dominated and tame-dominated grasslands in Canada. Remote Sens. Environ. 2018, 218, 201–206. [Google Scholar] [CrossRef]
- Tsoulias, N.; Paraforos, D.S.; Fountas, S.; Zude-Sasse, M. Calculating the water deficit spatially using LiDAR laser scanner in an apple orchard. In Proceedings of the European 12th Conference of Precision Agriculture, Montpellier, France, 8–11 July 2019; pp. 8–11. [Google Scholar]
- Ravi, R.; Hasheminasab, S.M.; Zhou, T.; Masjedi, A.; Quijano, K.; Flatt, J.E.; Crawford, M.; Habib, A. UAV-based multi-sensor multi-platform integration for high throughput phenotyping. In Proceedings of the Autonomous Air and Ground Sensing Systems for Agricultural Optimization and Phenotyping IV, Baltimore, MD, USA, 14 May 2019. [Google Scholar] [CrossRef]
- Ravi, R.; Lin, Y.J.; Shamseldin, T.; Elbahnasawy, M.; Masjedi, A.; Crawford, M.; Habib, A. Wheel-Based Lidar Data for Plant Height and Canopy Cover Evaluation to Aid Biomass Prediction. In Proceedings of the 2018 IEEE International Geoscience and Remote Sensing Symposium, Valencia, Spain, 23–27 July 2018; pp. 3242–3245. [Google Scholar]
- Soilán, M.; Sánchez-Rodríguez, A.; del Río-Barral, P.; Perez-Collazo, C.; Arias, P.; Riveiro, B. Review of Laser Scanning Technologies and Their Applications for Road and Railway Infrastructure Monitoring. Infrastructures 2019, 4, 58. [Google Scholar]
- Thorpe, M.J.; Kreitinger, A.; Seger, E.; Greenfield, N.; Wilson, C.; Trey, P.; Kreitinger, S.; Gordon, S.; Cchmitt, R.; Roos, P. Gas mapping LiDAR for large-area leak detection and emissions monitoring applications. In Proceedings of the 2017 Conference on Lasers and Electro-Optics (CLEO), San Jose, CA, USA, 14–19 May 2017. [Google Scholar] [CrossRef]
- Vaaja, M.; Hyyppä, J.; Kukko, A.; Kaartinen, H.; Hyyppä, H.; Alho, P. Mapping Topography Changes and Elevation Accuracies Using a Mobile Laser Scanner. Remote Sens. 2011, 3, 587–600. [Google Scholar] [CrossRef]
- Flener, C.; Vaaja, M.; Jaakkola, A.; Krooks, A.; Kaartinen, H.; Kukko, A.; Kasvi, E.; Hyyppä, H.; Hyyppä, J.; Alho, P. Seamless Mapping of River Channels at High Resolution Using Mobile LiDAR and UAV-Photography. Remote Sens. 2013, 5, 6382–6407. [Google Scholar] [CrossRef]
- Lin, Y.-C.; Cheng, Y.-T.; Zhou, T.; Ravi, R.; Hasheminasab, S.M.; Flatt, J.E.; Troy, C.; Habib, A. Evaluation of UAV LiDAR for Mapping Coastal Environments. Remote Sens. 2019, 11, 2893. [Google Scholar] [CrossRef]
- Chase, A.S.Z.; Chase, D.Z.; Chase, A.F. LiDAR for Archaeological Research and the Study of Historical Landscapes. In Sensing the Past. Geotechnologies and the Environment; Masini, N., Soldovieri, F., Eds.; Springer: Berlin, Germany, 2017; pp. 89–100. [Google Scholar]
- Inomata, T.; Pinzón, F.; Ranchos, J.L.; Haraguchi, T.; Nasu, H.; Fernandez-Diaz, J.C.; Aoyama, K.; Yonenobu, H. Archaeological application of airborne LiDAR with object-based vegetation classification and visualization techniques at the lowland Maya site of Ceibal, Guatemala. Remote Sens. 2017, 9, 563. [Google Scholar] [CrossRef]
- Yastikli, N. Documentation of cultural heritage using digital photogrammetry and laser scanning. J. Cult. Herit. 2007, 8, 423–427. [Google Scholar] [CrossRef]
- Balsa-Barreiro, J.; Fritsch, D. Generation of visually aesthetic and detailed 3D models of historical cities by using laser scanning and digital photogrammetry. Digit. Appl. Archaeol. Cult. Herit. 2018, 8, 57–64. [Google Scholar] [CrossRef]
- Jo, Y.H.; Hong, S. Three-Dimensional Digital Documentation of Cultural Heritage Site Based on the Convergence of Terrestrial Laser Scanning and Unmanned Aerial Vehicle Photogrammetry. ISPRS Int. J. Geo-Inf. 2019, 8, 53. [Google Scholar] [CrossRef]
- Habib, A.F.; Kersting, A.P.; Shaker, A.; Yan, W.Y. Geometric calibration and radiometric correction of LiDAR data and their impact on the quality of derived products. Sensors 2011, 11, 9069–9097. [Google Scholar] [CrossRef]
- Kilian, J.; Haala, N.; Englich, M. Capture and Evaluation of Airborne Laser Scanner Data. In Proceedings of the International Archives of the Photogrammetry, Remote Sensing and Spatial Information Sciences, Vienna, Austria, 12–18 July 1996; pp. 383–388. [Google Scholar]
- Maas, H. Least-squares matching with airborne laser scanning data in a TIN structure. Int. Arch. Photogramm. Remote Sens. 2000, 33, 548–555. [Google Scholar]
- Underwood, J.; Hill, A.; Scheding, S. Calibration of range sensor pose on mobile platforms. In Proceedings of the 2007 IEEE/RSJ International Conference on Intelligent Robots and Systems, San Diego, CA, USA, 29 October–2 November 2007; pp. 3866–3871. [Google Scholar]
- Muhammad, N.; Lacroix, S. Calibration of a rotating multi-beam lidar. In Proceedings of the 2010 IEEE/RSJ International Conference on Intelligent Robots and Systems, Taipei, Taiwan, 18–22 October 2010; pp. 5648–5653. [Google Scholar]
- He, M.; Zhao, H.; Davoine, F.; Cui, J.; Zha, H. Pairwise LIDAR calibration using multi-type 3D geometric features in natural scene. In Proceedings of the 2013 IEEE/RSJ International Conference on Intelligent Robots and Systems, Tokyo, Japan, 3–7 November 2013; pp. 1828–1835. [Google Scholar]
- Pandey, G.; McBride, J.R.; Savarese, S.; Eustice, R.M. Automatic targetless extrinsic calibration of a 3d lidar and camera by maximizing mutual information. In Proceedings of the Twenty-Sixth AAAI Conference on Artificial Intelligence, Toronto, ON, Canada, 22–26 July 2012. [Google Scholar]
- Alismail, H.; Baker, L.D.; Browning, B. Automatic calibration of a range sensor and camera system. In Proceedings of the 2012 Second International Conference on 3D Imaging, Modeling, Processing, Visualization & Transmission, Zurich, Switzerland, 13–15 October 2012; pp. 286–292. [Google Scholar]
- Pusztai, Z.; Hajder, L. Accurate calibration of LiDAR-camera systems using ordinary boxes. In Proceedings of the IEEE International Conference on Computer Vision, Venice, Italy, 22–29 October 2017; pp. 394–402. [Google Scholar]
- Li, Z.; Tan, J.; Liu, H. Rigorous Boresight Self-Calibration of Mobile and UAV LiDAR Scanning Systems by Strip Adjustment. Remote Sens. 2019, 11, 442. [Google Scholar] [CrossRef]
- Hong, S.; Park, I.; Lee, J.; Lim, K.; Choi, Y.; Sohn, H. Utilization of a Terrestrial Laser Scanner for the Calibration of Mobile Mapping Systems. Sensors 2017, 17, 474. [Google Scholar] [CrossRef]
- Ravi, R.; Lin, Y.J.; Elbahnasawy, M.; Shamseldin, T.; Habib, A. Bias impact analysis and calibration of terrestrial mobile lidar system with several spinning multibeam laser scanners. IEEE Trans. Geosci. Remote Sens. 2018, 56, 5261–5275. [Google Scholar] [CrossRef]
- Ravi, R.; Shamseldin, T.; Elbahnasawy, M.; Lin, Y.; Habib, A. Bias Impact Analysis and Calibration of UAV-Based Mobile LiDAR System with Spinning Multi-Beam Laser Scanner. Appl. Sci. 2018, 8, 297. [Google Scholar] [CrossRef]
- Velodyne. UltraPuck Data Sheet. Available online: https://velodynelidar.com/vlp-32c.html (accessed on 14 December 2019).
- Velodyne. Puck Lite Data Sheet. Available online: https://velodynelidar.com/vlp-16-lite.html (accessed on 14 December 2019).
- Applanix. APX-15 Data Sheet. Available online: https://www.applanix.com/products/dg-uavs.htm (accessed on 14 December 2019).
- Habib, A.; Lay, J.; Wong, C. Specifications for the quality assurance and quality control of LiDAR systems. Submitted to the Base Mapping and Geomatic Services of British Columbia. 2006. Available online: https://engineering.purdue.edu/CE/Academics/Groups/Geomatics/DPRG/files/LIDARErrorPropagation.zip (accessed on 1 December 2019).
- Velodyne. HDL32E Data Sheet. Available online: https://velodynelidar.com/hdl-32e.html (accessed on 14 December 2019).
- Velodyne. Puck Hi-Res Data Sheet. Available online: https://velodynelidar.com/vlp-16-hi-res.html (accessed on 14 December 2019).
- Applanix. POSLV 220 Data Sheet. Available online: https://www.applanix.com/products/poslv.htm (accessed on 14 December 2019).
- Wold, S.; Esbensen, K.; Geladi, P. Principal component analysis. Chemom. Intell. Lab. Syst. 1987, 2, 37–52. [Google Scholar] [CrossRef]
- Habib, A.; Lin, Y.J. Multi-class simultaneous adaptive segmentation and quality control of point cloud data. Remote Sens. 2016, 8, 104. [Google Scholar] [CrossRef]
- Renaudin, E.; Habib, A.; Kersting, A.P. Featured-Based Registration of Terrestrial Laser Scans with Minimum Overlap Using Photogrammetric Data. Etri J. 2011, 33, 517–527. [Google Scholar] [CrossRef]


© 2020 by the authors. Licensee MDPI, Basel, Switzerland. This article is an open access article distributed under the terms and conditions of the Creative Commons Attribution (CC BY) license (http://creativecommons.org/licenses/by/4.0/).