Abstract
Under different water vapor and dynamic conditions, and the influence of topographies and atmospheric environments, stratiform precipitation over South China and the Tibetan Plateau can produce different features. In this study, stratiform precipitation vertical characteristics, bright-band (BB) microstructures, and the vertical variations of the raindrop size distribution (DSD) over a low-altitude site (Longmen site, 86 m) in South China and a high-altitude site (Nagqu site, 4507 m) on the Tibetan Plateau were comprehensively investigated and compared using measurements from a Ka-band millimeter-wave cloud radar (CR), a K-band microrain radar (MRR), and a Parsivel disdrometer (disdrometer). A reliable BB identification scheme was proposed on the basis of CR variables and used for stratiform precipitation sample selection and further statistics and analysis. Results indicate that melting layers over the Longmen are much higher and slightly thicker than those over the Nagqu due to significant differences in atmospheric conditions. For stratiform precipitation, vertical air motions and radar variables over the two sites show different variation trends from cloud top to the ground. Vertical air motions are very weak in the stratiform precipitation over the Longmen, whereas updrafts are more active over the Nagqu. Above the melting layer, radar equivalent reflectivity factor (mean Doppler velocity ) gradually increases (decreases) as height decreases over the two sites, but the aggregation rate for ice particles over the Longmen can be faster. In the melting layer, () at the BB bottom/center over the Longmen is larger (smaller) than those over the Nagqu for the reason that melted raindrops in the melting layers over the Longmen are larger than those over the Nagqu. Below the melting layer, profiles of radar variables and DSDs show completely different behaviors over the two sites, which reflects that the collision, coalescence, evaporation, and breakup processes of raindrops are different between the two sites. Over the Longmen, collision and coalescence dominate the precipitation properties; in particular, from 2.0–2.8 km, the breakup process competes with collision–coalescence processes but later is overpowered. In contrast, due to the lower BB heights over the Nagqu, collision and coalescence dominate raindrop properties. Comparisons of raindrop spectra suggest that the concentration of small (medium-to-large) raindrops over the Nagqu is much higher (slightly lower) than that over the Longmen. Therefore, the mass-weighted mean diameter (the generalized intercept parameter ) over the Nagqu is smaller (larger) than that over the Longmen.
1. Introduction
Stratiform precipitation is one of the most common rain types on the Earth and plays an important role in the atmospheric water cycle, radiation budget, and climate change [1,2,3,4,5]. Numerous field experiments and numerical simulations in many regions have demonstrated that systematic observations and research on the macro- and microstructures and the physical properties of stratiform precipitation are a vital foundation for the development of weather modifications and numerical weather models [6,7,8]. As the stratiform precipitation stretch over the zero-degree layer, a distinct signature of sharply increased radar reflectivity called bright-band (BB) can be induced by the ice hydrometeor melting process. The reflectivity maximum is partly due to the different dielectric constant of ice and water and is also affected by the change of hydrometeors’ falling velocity, density, etc. [9]. In this case, the BB can significantly affect the radar quantitative precipitation estimation (QPE), resulting in uncertainties on the retrieval of rain rate near the surface using radar-measured reflectivity above BB [10,11]. Therefore, investigation and study of BB characteristics and relevant stratiform precipitation physical properties are of great importance.
Compared with conventional scanning weather radars, vertically pointing short-wave radars have advantages in the observation of stratiform precipitation vertical structures because of their higher spatiotemporal resolution and sensitivity. For instance, Kumar et al. [12] used gradients in profiles of radar reflectivity and Doppler velocity from a Ka-band Doppler radar to identify the BB, noting that radar reflectivity significantly increases with decreasing height above the BB, whereas vertical variations of it below the BB depend on rain rate. Jha et al. [13] and Devisetty et al. [14] suggested that an appropriate threshold value of −22 dB for the radar linear depolarization ratio, measured using a Ka-band zenith radar, can be associated with the top and bottom heights of the BB. Foth et al. [15] proposed two microrain radar (MRR)-based methods to select stratiform precipitation. Compared to the approach based on a probability density function (PDF) in combination with a confidence function, the results of an artificial neural network are more reasonable. Sumesh et al. [16] explored BB event characteristics at two locations with different altitudes on the windward slope of the Western Ghats using a K-band MRR, finding that, compared with those in low-altitude regions, BBs in the high-altitude regions are higher and thicker because topographic uplift favors the rimming of supercooled waters.
For stratiform precipitation in different climatological regions, raindrops formed after melting can also be affected by different physical processes, such as collision, coalescence, evaporation, and breakup, and exhibit diverse microphysical characteristics because of the differences in falling paths and environmental conditions [17,18]. Rosenfeld and Ulbricht [17] summarized the effects of various physical processes on raindrop size distribution (DSD) in clouds and precipitation. These individual processes were combined into conceptual models based on different microphysical and dynamical rain-forming processes that can build different kinds of DSDs. Therefore, DSD and its vertical variations are also relevant topics of stratiform precipitation. For example, Zhou et al. [19] found that the coalescence process can be slightly stronger than the breakup process during Central China’s Meiyu season (summer monsoon rains). Ramadhan et al. [20] studied the DSD characteristics of stratiform precipitation using a microrain radar in western Sumatra and concluded that the DSD shows a strong diurnal variation; the raindrop number concentration can be higher in the afternoon (1200–1800 LST) than at other times. Moreover, they found that coefficients of the “radar reflectivity–rain rate” relationship can decrease with altitude. Seela et al. [21] compared DSD variabilities between two islands (Palau and Taiwan) in the western Pacific in the summer, finding that small raindrops with diameters of <1.2 mm in stratiform precipitation are more concentrated in Palau than in Taiwan. Studies have also examined the discrepancies in DSDs at different elevations in the same region. For instance, Li et al. [22] collected DSDs at different altitudes over China’s Huangshan Mountain and discovered that stratiform precipitation raindrops are the largest on the mountainside, followed by at the mountain base, with the smallest at the mountain summit. The terrain features also affect precipitation through modulating the cloud microscopical processes. Zwiebel et al. [18] studied the precipitation structure along a complex terrain in southeastern France and the results indicated that DSD over the transition and plain areas is dominated by coalescence and evaporation; over the mountainous areas, the seeder–feeder mechanism of low-level clouds enhances the coalescence.
South China and the Tibetan Plateau are two different climatological regions of China with both frequent occurrences of clouds and precipitation events. South China lies at low latitudes and borders the South China Sea, with a tropical–subtropical monsoon climate. Water vapor in this region is sufficient, leading to a long rainy season between April and September. In contrast, the Tibetan Plateau is located in southwestern China and is the highest and largest plateau in the world, with a dry plateau–mountain climate. Generally, precipitation over South China and the Tibetan Plateau can possess different structures and properties due to the comprehensive impact of different terrains, environmental conditions, and other factors. To date, only a few studies have reported on stratiform precipitation in these two regions. Huo et al. [23] and Tang et al. [24] found that stratiform precipitation rain rates over South China are concentrated below 5 mm·h−1, consisting primarily of small raindrops. Based on ground disdrometer measurements, DSD characteristics over South China and the Tibetan Plateau also have been investigated by some scholars. Zhang et al. [25] and Feng et al. [26] concluded that the formation of stratiform precipitation in South China is caused by the melting of small, compact graupels and rimed ice particles instead of snowflakes. Chen et al. [27] noted that the DSDs of stratiform precipitation on the mid-Tibetan Plateau are different during the day and at night, and Wang et al. [28] suggested that the stratiform precipitation has narrower DSDs on the eastern slope of the Tibetan Plateau than on the nonplateau area. Wu and Liu [29] compared stratiform precipitation DSDs between the Tibetan Plateau and South China and proposed that the number concentration of raindrops over the mid-Tibetan Plateau has a more significant decrease with the increased diameter than over South China. Overall, these previous studies have focused on stratiform precipitation or relevant DSD features in specific regions or used ground measurements. However, stratiform precipitation vertical structures over South China and the Tibetan Plateau and their differences remain unclear.
The Chinese Academy of Meteorological Sciences conducted field campaigns at the Nagqu site (represents a high-altitude site) on the Tibetan Plateau from July to August in 2014 and 2015 and the Longmen site (represents a low-altitude site) in South China from June to August in 2016 and from June to July in 2017. As shown in Figure 1, the Nagqu has an altitude of 4507 m (above sea level, ASL) and is located at 31.48°N, 92.07°E, whereas the Longmen possesses a much lower altitude of only 86 m ASL and is located at 23.78°N, 114.25°E. During the observation period, a Ka-band millimeter-wave cloud radar (CR), an MRR, and a ground disdrometer were deployed together for the observation of clouds and precipitation. To further understand the macro- and microcharacteristics and differences of stratiform precipitation over the two sites as well as to promote the development of radar QPE and numerical simulations, in the present study, a BB identification scheme was proposed for automatic sample selection and data matching; then, stratiform precipitation vertical structures, BB properties, and DSD variations were studied and compared in detail. The remainder of the manuscript is organized as follows: Section 2 introduces the instruments used, measurements taken, and data processing methodologies as well as the proposed BB identification scheme; Section 3 details the results; in Section 4, the findings are further compared with other studies and discussed; the conclusions are presented in Section 5.
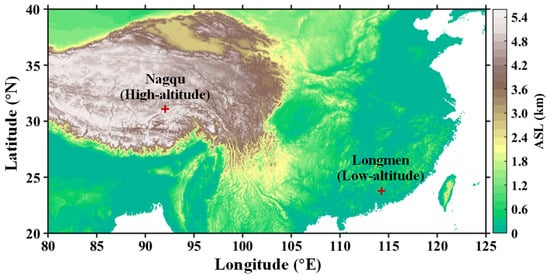
Figure 1.
Location and terrain of the Longmen (represent a low-altitude site) (86 m above sea level, 23.78°N, 114.25°E) in South China and the Nagqu (represent a high-altitude site) (4507 m above sea level, 31.48°N, 92.07°E) on the Tibetan Plateau.
2. Instruments, Measurements, and Methods
2.1. Instruments and Measurements
The CR is a vertically pointing solid-state Doppler radar that operates at a frequency of 33.44 GHz, corresponding to a wavelength of 8.5 mm. It profiles the aloft clouds and precipitation at a height range from 0.12 to 15.3 km every ~9 s, and can simultaneously obtain the radar Doppler spectrum (DSP), equivalent reflectivity factor (, dBZ), mean Doppler velocity (, m·s−1), spectrum width (, m·s−1), and linear depolarization ratio (LDR, dB) with a spatial resolution of 30 m. Liu et al. [30,31,32] assessed and verified that the CR measurements are reliable and capable of accurately capturing different types of nonprecipitating cloud and light precipitation.
The MRR is also a zenith radar but is designed using frequency-modulated continuous wave technology and operating at 24.23 GHz with a wavelength of 1.24 cm. It is manufactured by Meteorologische Messtechnik GmbH (METEK), Germany, and has been widely used for precipitation and DSD studies [33,34,35,36,37,38]. The temporal resolution of the MRR is set to 60 s. Considering the significant difference in the 0 °C isotherm height in the atmosphere between the two sites as a result of their different altitudes (the melting level over Nagqu site is relatively low, mostly near 1 km, whereas that over Longmen site is much higher, approximately 4 to 5 km), the maximum detectable heights of the MRR were set to 3.1 and 6.2 km with vertical resolutions of 100 and 200 m at the Nagqu and Longmen sites, respectively. The MRR measurements include attenuation-corrected DSP, , , the raindrop equivalent volume diameter (, mm), and the number concentration per unit volume per millimeter (, m−3·mm−1), where i is the spectral bin number.
The ground disdrometer used is a second-generation Parsivel disdrometer (disdrometer), which has also been used in many previous studies [39,40,41,42,43,44]. The disdrometer is an optical-based disdrometer that transmits a 54-cm2 (18-cm long, 3-cm wide) horizontal laser beam, and can simultaneously measure the diameter and falling velocity of passing raindrops according to the attenuation and duration of received signals. The raw raindrop counts were reserved and subdivided into 32 non-equidistant diameter classes, ranging from 0.062 to 24.5 mm, and 32 non-equidistant velocity classes, ranging from 0.05 to 20.8 m·s−1. The sampling interval of the disdrometer is 60 s. For convenience, abbreviations of three instruments and physical quantities are used in this paper, of which the detailed information can be found in Appendix A (Table A1).
2.2. Data Processing and Quality Control
Signal attenuation of CR is mainly affected by rain rate and hydrometeors distribution in rain measurements. Signal will be seriously attenuated at a high rain rate. Besides, excessive raindrop size can cause millimeter-wave Mie scattering, and the returned signal can be weakened [45,46,47]. Therefore, to alleviate the attenuation of the radar’s DSP and , an iterative correction procedure was implemented [48,49], as shown in Equations (1)–(4),
where i and n are the range gate number and spectral bin number, respectively; (dB·km−1) and are the correction coefficient and two-way transmissivity, respectively; and denote the radar-measured and corrected equivalent reflectivity factor, respectively; and represent the radar-measured and corrected Doppler spectra, respectively; and is the radar gate length. Coefficients and were set to 0.00334 and 0.73, respectively [50].
MRR’s high transmission frequency increases sensitivity in detecting small droplets; however, it also attenuates severely under heavy rain. The rain attenuation correction was applied for the path-integrated rain attenuation less than ten according to a recursive algorithm developed by Kunz [51]. Therefore, the attenuation can be basically ignored for the precipitation of small to medium rain rates. In addition, Peter et al. [34] found a surprisingly good agreement between radar reflectivities of an MRR and a C-band weather radar.
A disdrometer can produce some unrealistic data due to its inherent limitations [40,52]. Therefore, the following data quality control technologies were adopted. First, the data in the first two diameter classes were eliminated because of their low signal-to-noise ratio, and any raindrops with a diameter > 8 mm were discarded because of their natural breakup in the atmosphere [52]. Second, any DSDs with a total raindrop number less than 10 or a rain rate smaller than 0.002 mm·h−1 were treated as nonrainy samples and removed [27]. Third, any raindrops possessing an abnormal diameter (falling velocity) were removed by comparing the measured result with the theoretical relationship proposed by Atlas et al. [53]. If the measured diameter (falling velocity) of raindrops was 60% of the theoretical value, the raindrops were regarded as problematic data and abandoned. On the basis of the aforementioned processing, DSD was further calculated as
where i and j are the raindrop diameter and velocity class orders, respectively; (m−3·mm−1) and represent the raindrop number concentration and the raindrop count, respectively; (mm) refers to the diameter interval; is the raindrop falling velocity; (m2) is the effective sampling area; and (60 s) denotes the sampling time. The rain rate (R, mm·h−1), mass-weighted mean diameter (, mm), and generalized intercept parameter (, m−3·mm−1) were calculated using Equations (6)–(8).
2.3. Stratiform Precipitation Sample Identification and Data Matching
2.3.1. Stratiform Precipitation Sample Identification
Many studies have reported that the BB signature can be detected more easily in stratiform precipitation, as observed using centimeter- or millimeter-wavelength radars [54,55,56,57]. Therefore, in the present study, a BB identification scheme was implemented to distinguish stratiform precipitation samples from the entire radar dataset. Considering that the CR has a much higher spatiotemporal resolution than the MRR and the LDR—a polarized variable that can make the recognition of BB more robust—the scheme was designed on the basis of the CR measurements. A brief flowchart is set out in Figure 2, which illustrates the scheme’s five steps.
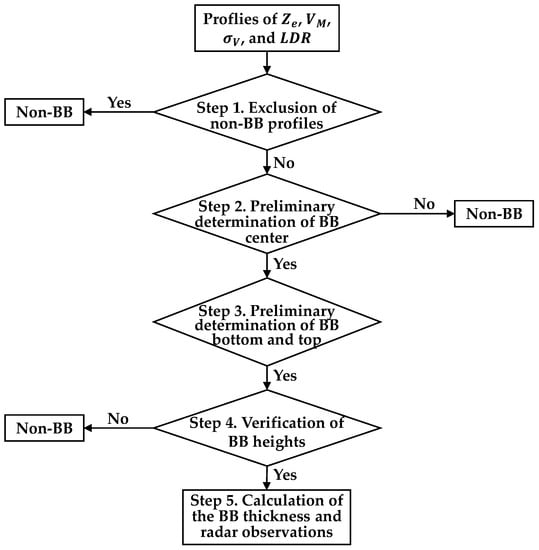
Figure 2.
A flowchart for the proposed BB identification scheme.
Step 1. Exclusion of non-BB profiles. According to BB observational features, both the radar’s and can significantly increase when hydrometeors pass through the melting layer with phase changes from ice to liquid [58,59]. Therefore, if all range gates possessed < −10 dBZ or > −1.0 m·s−1, a radar profile was treated as a non-BB sample and discarded [59,60].
Step 2. Preliminary determination of the BB center. A range interval of 750 m (25 consecutive range gates) was set with a threshold representing a possible maximum BB thickness observed using the CR [61,62]. For each reserved profile after Step 1, search maximums for radar reflectivities (ZCs) and relevant heights (HZCs) within each range interval from bottom to top. Each HZC was then set as the center to find two minimum reflectivities (ZU, ZL) and corresponding heights (HZU, HZL) within the upper and lower parts of each range interval, respectively. When the criterion of (ZC − ZU) × (ZC − ZL) > 18 dBZ was met, the HZC was considered to be a potential BB center height. If multiple HZCs satisfied the criterion at the same time, only the one with the largest ZC was selected. Using the same approach, it was also possible to obtain a BB center height (HLdrC) from the radar LDR profile but with the constraints of LdrC > LdrU, LdrC > LdrL, and (LdrC − LdrU) × (LdrC − LdrL) > 20 dB [63]. Finally, if the HZC and HLdrC met the consistency test, an average for HZC and HLdrC was produced as the final BB height (HCfinal). The consistency test was proposed by Brandes et al. [64] and reflected the consistency between the variations of reflectivity and polarization parameter. If , it means that the two parameters simultaneously detected the properties change of particles in the melting layer. The d (km) was calculated using Equation (9).
Step 3. Preliminary determination of the BB bottom and top. According to vertical variations in , , and LDR near the melting layer, four thresholds were set: = 3 dBZ, = 0.6 m·s−1, = 0.4 m·s−1, and LDR = 3 dB [59]. For each profile with an identified BB center, gradients for the radar observations were established upward and downward from the BB center; when at least three radar variables consecutively increased (decreased) or exceeded the thresholds within 150 m, their corresponding heights HZT/HZB, HVT/HVB, HSwT/HSwB, and HLdrT/HLdrB were calculated (where “H” is the height; “T” and “B” denote the top and bottom, respectively; and “V” and “Sw” are and , respectively). Comparing these top (bottom) heights, if their differences were within 200 m [63], their average was determined as the final BB top (bottom) height HTfinal (HBfinal).
Step 4. Verification of BB heights. Further comparing the difference between HCfinal and HTfinal/HBfinal, if HTfinal − HCfinal < 750 m and HBfinal − HCfinal < 750 m, the identification results were perceived to be robust.
Step 5. Calculation of the BB thickness and radar variables. Following the aforementioned steps, the BB thickness and the radar’s , , , and LDR at the heights of the BB center, top, and bottom were calculated and reserved for further statistical analysis.
To exhibit the BB identification effect of the proposed scheme, Figure 3 presents two stratiform precipitation cases observed at the Longmen (left panels) and the Nagqu (right panels), respectively. Specifically, Figure 3a1,a2 give the CR’s s; Figure 3b1,b2 show the CR’s LDRs; Figure 3c1,c2 show the MRR’s s; Figure 3d1,d2 present the disdrometer-observed rain rate. The identified BB center, top, and bottom are represented by black solid lines and superimposed on each radar image.
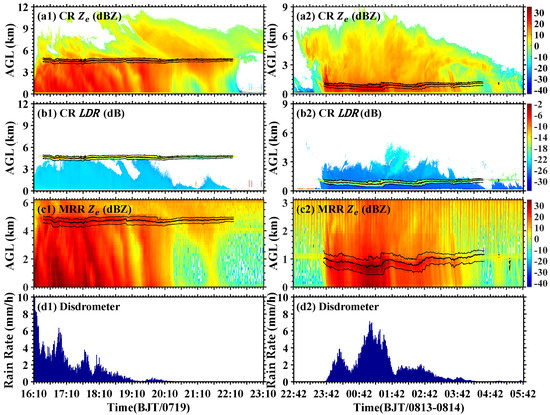
Figure 3.
BB identification effects for the two stratiform precipitation cases observed over the Longmen site on 19 July 2017 (left panels) and over the Nagqu site on 13 and 14 August 2015 (right panels), respectively. (a1,a2) show the CR’s equivalent reflectivity factor (dBZ); (b1,b2) show the CR’s linear depolarization ratio LDR (dB); (c1,c2) show the MRR’s ; (d1,d2) show the disdrometer-observed rain rate (mm·h−1). The heights identified as the center, top, and bottom of the BB are depicted with black solid lines and superimposed on each radar image.
It can be seen that both BBs of the two cases are well identified under the circumstance of moderate rainfall on the ground, with rain rates ranging from 0.1 to ~7 mm·h−1. BB heights over the Longmen and Nagqu sites are located at approximately 4.5 and 1 km, respectively. BB signatures in terms of the rapid increase in along the melting layers are observed using two radars. Moreover, for the CR, the LDR was more sensitive to the particle melting process and can be a better BB indicator than . Comparisons of images from the two radars also illustrate that the CR can measure the entire perspective and identify fine stratiform precipitation structures owing to its higher spatial resolution and sensitivity, whereas the was attenuated by rainfall to some extent. In contrast, the MRR has much shorter detectable height ranges and rougher spatial resolution, but its signal attenuation was insignificant. Overall, the identified heights for the bottom, center, and top of the BB based on the CR measurements were consistent with the melting layer structure reflected by the MRR.
2.3.2. Data Matching
After BB identification using the CR, all distinguished stratiform precipitation samples were further verified using disdrometer-measured rain rate. Stratiform precipitation samples corresponding to ground rain rates being smaller than 5 mm·h−1 were regarded as the reliable results and reserved because the CR is inappropriate for detecting medium-to-heavy precipitation. Then, samples with ground rain rates smaller than 0.02 mm·h−1 were discarded as noise caused by nonprecipitation echo. After checking the continuity of samples in the time series, isolated or intermittent samples with a duration of less than 10 min were discarded to avoid some spurious and erratic results [13]. Finally, all corresponding minute data of the MRR and disdrometer were selected and combined with the CR results to form the final matched stratiform precipitation datasets. Statistics show that 41 and 47 rain events over the Longmen and Nagqu sites were collected in total. The matched stratiform precipitation datasets for the three instruments as well as the corresponding ground mean rain rate and accumulated rain amounts from the observation periods over the two sites are listed in Table 1.

Table 1.
The matched stratiform precipitation datasets for the three instruments and the corresponding ground mean rain rate and accumulated rain amounts.
3. Results
Under different water vapor and dynamic conditions and the influence of altitudes and atmospheric environments, the stratiform precipitation over South China and the Tibetan Plateau can produce different features. Therefore, on the basis of the matched datasets, stratiform precipitation vertical characteristics, BB microstructures, and DSD vertical variations over the Longmen and Nagqu sites were analyzed and compared in detail.
3.1. Stratiform Precipitation Vertical Characteristics and BB Microstructures
Figure 4 presents the averaged profiles of radar variables, including the CR’s , , , LDR, and DSP and the MRR’s and , for the entire set of stratiform precipitation samples over the two sites. Note that, herein, for the , a positive velocity represents upward motion of the targets (away to radar antenna), and negative velocity means downward motion of targets (toward from radar antenna). However, for the DSP, the signs are opposite. As seen from Figure 4a1–a4,b1–b4, the profiles of radar variables observed over the two sites exhibit different stratiform precipitation vertical structures. Specifically, melting layers with obvious BB signatures over the Longmen and Nagqu sites are located at height ranges of approximately 4.4–5.1 km and 0.8–1.3 km, respectively. For cloud precipitation above the melting layers, s (s) over the two sites increase (decrease) as height decreases because of ice particle aggregation. To further quantitatively denote the changes of and for cloud ice hydrometeors, average curves of and above the BB were further fitted by a linear equation, as printed on Figure 4a1,a2,b1,b2. Fitting results suggest that the profile over the Longmen site has a larger slope than that over the Nagqu, implying a faster aggregation rate of ice particles. Interestingly, at the BB top, on average, the Longmen possesses a larger . but a similar compared to counterparts of the Nagqu. This phenomenon can be perceived as the ice hydrometeor over the Longmen is larger; however, its density can be lower. As ice particles fall into melting layers, s/LDRs first increase and then decrease and s (s) decrease (increase) as height decreases over the two sites. In addition, the increments (decrements) in s/s/LDRs (s) over the Longmen are larger than those over the Nagqu, implying that the stratiform precipitation of the former forms larger raindrops at the bottom of the melting layer than that of the latter. After melting, raindrops over the Longmen have a much longer falling path before touching the ground than those over the Nagqu, with the former’s s/s (s) gradually increasing (decreasing) again as height decreases, while the latter’s s have no apparent changes, and its s (s) continue to decrease (increase) as height decrease. Nevertheless, the median profiles can better show the variations of measurements at BB heights, and the averaged profile is easily affected by the extreme values. In addition, radar observations are inevitably affected by clutter near the ground; for the profiles below BB in the Nagqu site, the accuracy may need to be further confirmed.
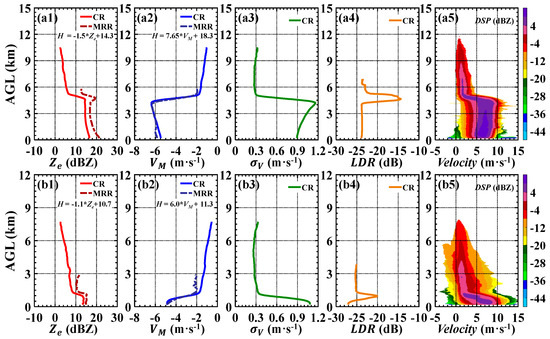
Figure 4.
Averaged profiles of radar variables for the stratiform precipitation over the Longmen and Nagqu sites, respectively. (a1–a5) show the radar equivalent reflectivity factor (, dBZ), mean Doppler velocity (, m·s−1), spectrum width (, m·s−1), linear depolarization ratio (LDR, dB), and Doppler spectra (DSP) observed over the Longmen. (b1–b5) show the same but observed over the Nagqu. The functions in (a1,a2,b1,b2) represent the fitting results of / profiles above the BB.
Figure 4a5,b5 illustrate that the averaged CR spectra over the two sites clearly indicate the melting process with sharp shifts in Doppler signals. Liu et al. [65] pointed out that the influence of turbulence on DSP is negligible in the case of weak precipitation. Therefore, the negative velocities of the DSP can approximately represent the updrafts. The hydrometeor signals over the Longmen possess positive velocities, suggesting that the vertical air motions are very weak in cloud precipitation. In contrast, there exist partial hydrometeor signals over the Nagqu that possess negative velocities, revealing that the updrafts are more active. Comparing the two radars’ profiles, it can be seen that the CR’s s are attenuated by 2.5–7.0 and 2–4.5 dB over the Longmen and Nagqu, respectively. Furthermore, attenuations above the BB are more significant than those below the BB because the signal emitted by radar is more attenuated by rain rate, temperature, liquid water path, etc. as the distance increases.
Figure 5 shows the probability density functions (PDFs) of the heights of the BB center, top, and bottom as well as the BB entire, upper-half, and lower-half thicknesses for stratiform precipitation over the two sites. Corresponding statistical parameters involving 5th–95th percentiles, averages (AVs), standard deviations (STDs), and skewnesses (SKs) for these BB heights and thicknesses are listed in Table 2. Comparisons indicate that the BB heights over the Longmen are 3 to 4 km higher than those over the Nagqu. Most of the BB bottom/center/top heights (5th–95th) over the two sites are concentrated within 4.17–4.98/4.47–5.19/4.71–5.43 and 0.42–1.08/0.51–1.26/0.75–1.47 km, with AVs of 4.56/4.81/5.05 and 0.74/0.94/1.16 km, respectively. The STDs of the BB heights are similar over the two sites within 0.22–0.25 km. The BB heights are positively skewed over the Longmen, but negatively skewed over the Nagqu. With regard to BB thicknesses, the entire thicknesses of the BB over the Longmen are slightly larger than those over the Nagqu, most of these over the two sites are within 0.33–0.69 km and 0.27–0.63 km, with AVs of 0.51 and 0.44 km, respectively. Previous studies perceived that the BB thickness can be affected by the melting rate and the fall velocity of particles [16,58]. As shown in Figure 4, at the BB top, the ice particles over the Nagqu are smaller than those over the Longmen; thus, the melting process at the former site also can be faster and the BB is thinner. The BB entire thicknesses in these two regions are consistent with the results observed by other scholars, whose studies show that the entire thickness is generally not more than 0.75 km when measured using the CR [59,61]. Moreover, the lower- and upper-half thicknesses over the Longmen possess similar statistical parameters except in terms of SKs, demonstrating that the BB is near-symmetrical. However, the upper-half thicknesses are slightly larger than those of the lower-half thicknesses over the Nagqu. The BB thicknesses possess near-zero STDs over the two sites, suggesting they are near-stable.
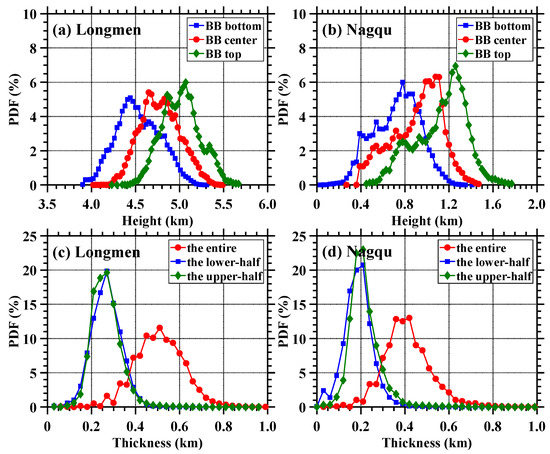
Figure 5.
Probability density functions (PDFs) of the heights of the BB bottom, center, and top as well as the BB entire, upper-half, and lower-half thicknesses over (a,c) the Longmen and (b,d) Nagqu sites.
Table 2.
Statistical parameters of the three BB heights and three BB thicknesses corresponding to Figure 5.
To further ascertain discrepancies in radar variables at different BB positions over the two sites, Figure 6 shows PDFs of radar , , , and LDR measured at the BB bottom, center, and top. Corresponding statistics of medians (MDs), AVs, STDs, and SKs and discrepancies between the center and the top (the BB upper part, ) and between the center and the bottom (the BB lower part , ) of these radar variables are also calculated and summarized in Table 3.
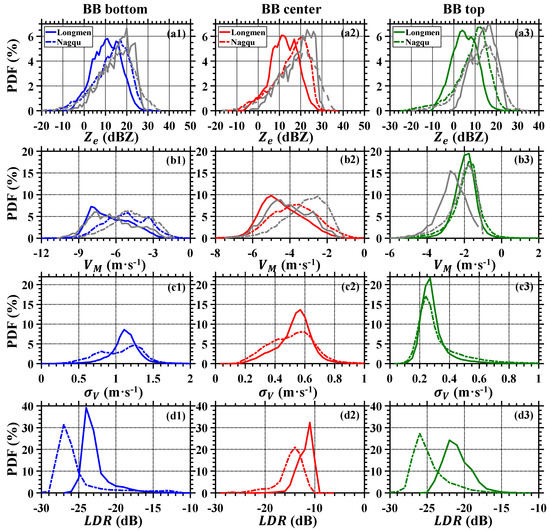
Figure 6.
Probability density functions (PDFs) of the radar variables measured at the heights of the BB bottom, center, and top over the Longmen and Nagqu sites: (a–d) show the CR’s equivalent reflectivity factor (, dBZ), mean Doppler velocity (, m·s−1), spectral width (, m·s−1), and linear depolarization ratio (LDR, dB), respectively. The gray lines in (a1–a3) and (b1–b3) indicate the MRR measurements.
Table 3.
Statistical parameters of radar variables observed in the three BB positions corresponding to Figure 6.
It can be seen that as ice particles pass through the top, center, and bottom of the BB, radar variables change significantly as a result of the melting process. However, variable values at each BB position and deviations in the same part of the BB over the two sites are different. On average, s (s) at the BB bottom/center/top over the Longmen are 1.2/0.8/2.1 dB (1.6/1.0/0.5 m·s−1) larger (smaller) than those over the Nagqu, indicating that the ice hydrometeors that formed above the BB and corresponding melted raindrops below the BB over the former site are larger than those over the latter site. LDRs at the three BB positions over the Longmen are also 2.6/3.0/3.8 dB larger than those over the Nagqu, which may be due to the lower condensation height and some supercooled droplets contained in the melting layer over the Longmen [66]. Furthermore, s at the bottom and center of BB over the Longmen are slightly larger than those over the Nagqu, whereas at the top of the BB, they are somewhat smaller. Comparing the s/s of CR and MRR, it is found that their PDFs shapes are similar.
As listed in Table 3, the s and s of the radar variables over both sites exhibit as , , , and , suggesting that is more sensitive to the melted ice hydrometeors attached with water film. The changes of the dielectric constant and the collision and coalescence of hydrometeors are the reasons for the significant increase of in the BB upper-half. Comparisons also illustrate that both and ( and ) over the Longmen are smaller (larger) than those over the Nagqu.
3.2. Vertical Variations of Stratiform Precipitation Raindrop Spectra
Owing to significant differences in melting layer heights between the low- and high-altitude sites in the summer, falling raindrops can undergo diverse physical processes and possess different microphysical properties. Therefore, herein, stratiform precipitation DSDs observed using the MRR over the two sites were further compared. Figure 7 and Figure 8 show average DSDs versus heights and contoured frequency by altitude diagrams (CFADs) of the and the logarithm of () below melting layers for all stratiform precipitation samples, respectively.
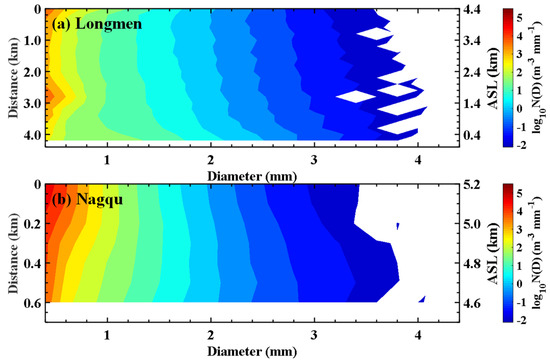
Figure 7.
Vertical distribution of average raindrop size distributions (DSDs) for stratiform precipitation samples over (a) the Longmen and (b) Nagqu sites. Distance (km) represents the distance from BB.
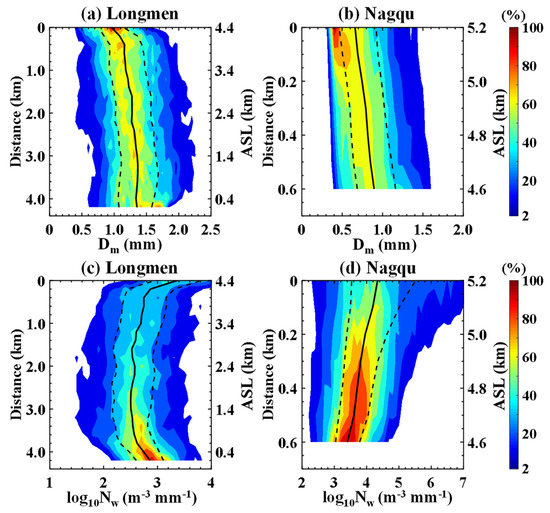
Figure 8.
Distribution contoured frequency by altitude diagrams (CFADs) of the mass-weighted mean diameter (mm) and the logarithm of the generalized intercept parameter (m−3·mm−1) for stratiform precipitation samples over (a,c) the Longmen and (b,d) Nagqu sites. Contours represent the frequency of occurrence relative to the maximum absolute frequency in the data sample represented in the CFADs. The solid lines represent the 50th percentiles and the dashed lines represent the 25th and 75th percentiles. Distance (km) represents the distance from BB.
As can be seen, DSDs show clear but different vertical variations over the two sites. Over the Longmen, from the bottom of the BB up to 2.0 km, the concentration of small raindrops (D < 0.5 mm) gradually decreases, whereas the concentration of medium-to-large raindrops (D > 1.6 mm) increases as height decreases, suggesting that collision and coalescence processes dominate at this height range. From 2.0 to 2.8 km, the concentration of raindrops (D < 4 mm) increases, especially for small raindrops (D < 0.6 mm). From the averaged DSDs, the concentration of large raindrops (D > 4 mm) decreases (averaged DSDs from 2.0 km to 2.8 km are not shown). It indicates that the breakup process of the large raindrops and the collision–coalescence processes of medium raindrops coexist. From 2.8 to 3.4 km, the concentration of small raindrops (D < 1.0 mm) decreases, whereas the concentration of larger raindrops (D > 1.0 mm) increases, suggesting that collision and coalescence processes dominate at this height range. Below 3.4 km, the concentration of small raindrops (D < 0.6 mm) decreases, whereas the concentration of medium-to-large raindrops (D > 1.0 mm) quickly increases, suggesting that collision and coalescence processes dominate at this height range. These results are consistent with previous studies [19,37,67], which concluded that significant growth in the collision and coalescence processes occurs only when small raindrops (D < 0.6 mm) are collected by large raindrops. As for CFADs of and over the Longmen, Figure 8a,c show the increased and decreased when raindrops fall from the bottom of the BB. In particular, from 2.0 to 2.8 km, () slightly increases (decrease), which represents the collision and coalescence processes overwhelming the breakup process. Near the ground, increases suddenly from ~2.5 at 3.4 km to ~2.8 at ground level, which is associated with the suddenly increased concentration of medium raindrops.
In contrast, over the Nagqu, the vertical variations of DSDs are not as significant as over the Longmen. From the bottom of the BB to the ground, the concentration of small raindrops (D < 1.0 mm) sharply decreases, the concentration of medium raindrops (1.0 < D < 2.0 mm) remains near constant, and the concentration of large raindrops (D > 2.0 mm) increases. Especially, the larger the diameter, the greater the increase in concentration. It indicates that raindrops collision and coalescence processes are dominant. Figure 8b,d show that the tends to decrease gradually, whereas the increases from approximately 0.5–0.7 mm at BB bottom to 0.6–0.8 mm at 0.3 km. Moreover, all diameter bins have a decreasing trend near the ground, and the increment (decrement) of ( slightly increases, which is possibly attributable to the lower humidity and stronger evaporation at a low level over the Tibetan Plateau [29,68].
DSDs over the two sites clearly show that the concentration of raindrops with D < 1.4 mm over the Nagqu is much higher than that over the Longmen, with concentrations over the two sites ranging from 101 to 104.5 m−3·mm−1 and from 101 to 103 m−3·mm−1, respectively. This finding is similar to the conclusion of Sumesh et al. [16] that small drops have a significant concentration in the high-altitude regions. On the contrary, amounts of medium-to-large raindrops (D > 2 mm) over the Longmen are greater than those over the Nagqu. Moreover, the over the Longmen is larger than that over the Nagqu, as found in the previous study [29]. However, the shows the opposite behavior, with the over the Longmen being much smaller than that over the Nagqu.
4. Discussion
In this section, we compare the DSD results of MRR with disdrometer. Besides, our results on microphysical characteristics of stratiform precipitation are compared with those obtained in other areas in China.
4.1. Comparison of MRR with Disdrometer
To examine the reliability of the MRR data, Figure 9 sets out the average DSDs measured using the MRR and disdrometer. Note that according to the actual spatial resolutions of the MRR deployed at the two sites, the lowest four range gates (800, 600, 400, and 200 m over the Longmen and 400, 300, 200, and 100 m over the Nagqu) were selected for comparison.
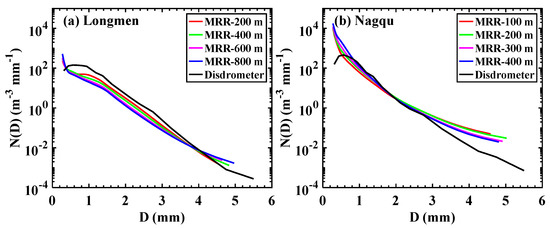
Figure 9.
Averaged raindrop size distributions (DSDs) at different heights for stratiform precipitation samples from the MRR and disdrometer over (a) the Longmen and (b) Nagqu sites.
Compared with those of the disdrometer, the MRR’s concentrations of small raindrops (D ≤ 0.4 mm over the Longmen and D ≤ 0.5 mm over the Nagqu) are much higher, which can be attributed to the inherent limitation of the disdrometer in underestimating small raindrops [40,69]. For raindrops within 0.4–4 mm over the Longmen and raindrops within 0.5–2.5 mm over the Nagqu, the radar results are consistent with the disdrometer results, but concentrations are underestimated to some extent. Conversely, for raindrops larger than 4 mm over the Longmen and raindrops larger than 2.5 mm over the Nagqu, radar can slightly overestimate concentrations. These discrepancies between the MRR and disdrometer have also been reported by Konwar et al., Jash et al., and Wen et al. [9,13,70]. The mismatch between observations of two instruments is because of the laser inhomogeneity problem of disdrometer, different measuring principles of disdrometer and MRR, different sampling volumes and heights, and the presence of updraft–downdraft or turbulence in the atmosphere.
4.2. Comparison of Stratiform Precipitation Microphysical Characteristics
Figure 10 shows scatterplots of - pairs at different heights observed from the MRR and disdrometer. The average values of and are marked on each subgraph, as well as the two previous results for summer precipitation in other regions of China. The cyan pluses and green crosses represent the results from the Meiyu season over East China reported by Wen et al. [70] and from the monsoon frontal rainfalls over Central China obtained by Zhou et al. [19], respectively.
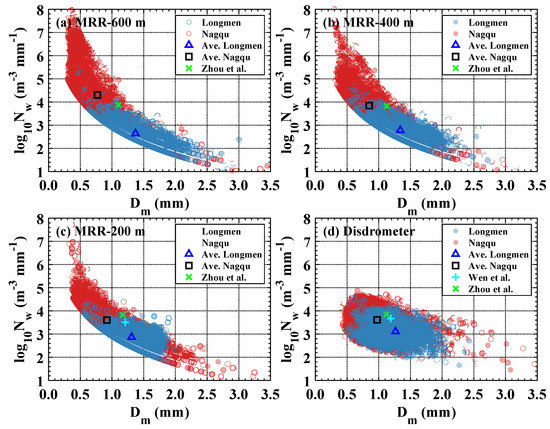
Figure 10.
Scatterplots of the mass-weighted mean diameter (mm) versus the logarithm of the generalized intercept parameter (m−3·mm−1) for stratiform precipitation samples at different heights (from MRR retrievals at heights of (a) 600 m, (b) 400 m, (c) 200 m, and the surface (d) disdrometer over the low-altitude site (Longmen, blue circles) and high-altitude site (Nagqu, red circles). The blue triangles and black squares represent the averaged - pairs over the two sites, respectively. The cyan pluses and green crosses represent the averaged - pairs from the Meiyu season over East China reported by Wen et al. (2017) [70] and from the monsoon frontal rainfalls over Central China obtained by Zhou et al. (2019) [19], respectively.
Comparisons clearly show that the Longmen generally has larger s but smaller s than the Nagqu at each height, and s over the low- and high-altitude sites mainly distribute within 1.2–1.4 and 0.7–1.0 mm, corresponding to s within 2.6–3.2 and 3.8–4.6 m−3·mm−1, respectively. In the study of Zhou et al. [19], at 600 and 400 m, the average - pairs for Central China are located between those over our two sites, with smaller s than the Longmen and larger than the Nagqu; s are larger than those over the Longmen but smaller than those over the Nagqu. At 200 m and at ground level, s are larger than those over the Longmen and Nagqu sites. For results obtained by Wen et al. [70], the . for East China is slightly smaller than that of the Nagqu and larger than that of the Longmen at 200 m. On the ground, s are larger than that over our two sites. As a result of the high liquid water content in the atmosphere over South China, the collision and coalescence processes make s larger than those over the other aforementioned regions and, correspondingly, s can be smaller. Although summer precipitation in the three regions is influenced by the East Asian monsoon, the statistical results of SP are also different. Altitude, water vapor, atmospheric conditions, etc. may be the main factors that explain the difference, although diverse measuring instruments and quality control methods also play a part. However, the Tibetan Plateau is very different from the other three regions. Due to the short falling path of raindrops, collision and coalescence processes are insufficient, leading to a relatively higher concentration of small raindrops reaching the ground compared with the low altitude.
Microphysical processes of stratiform precipitation below the melting layer over three regions (North China, Central China, and East China) in China are compared with those over South China and the Tibetan Plateau. Over North China, both large and small raindrops have high concentrations at the bottom of BB. With decreasing height, the coalescence process of small raindrops and the breakup of large raindrops reach a balance [8]. The microphysical processes over Central China are different. Below BB, the collision and coalescence processes slightly overpower the breakup process, resulting in slightly decreasing with decreasing height [19]. Over East China, and liquid water content stay quasi-constant below BB. first decreases and then increases, while is the opposite. It indicates that large raindrops formed by the melting of ice particles above the zero-degree layer breakup into small raindrops. As height decreases, raindrop properties are attributed to the overpowered collision and coalescence processes over the breakup process [71]. The vertical structures over South China have some similarities with those over Central China over East China. When raindrops fall, collision and coalescence processes dominate, but there is competition between breakup and collision–coalescence processes from 2.0–2.8 km. Over the Tibetan Plateau, the collision and coalescence processes dominate raindrop properties.
Overall, the microphysical characteristics of stratiform precipitation are affected by many factors, such as weather systems, water vapor conditions, topography, etc. The collision, coalescence, and evaporation processes govern the DSDs’ vertical and temporal evolutions, which make precipitation properties quite diverse.
5. Conclusions
Using measurements from a CR, an MRR, and a disdrometer, stratiform precipitation samples were selected using a reliable BB identification scheme. After data matching, stratiform precipitation vertical characteristics, BB microstructures, and DSD vertical variations over a low-altitude site (Longmen) in South China and a high-altitude site (Nagqu) on the Tibetan Plateau were comprehensively investigated and compared. The main conclusions of this study can be summarized as follows.
The Longmen site is located at low altitude, which leads to a much higher BB than that over the Nagqu. Due to the obvious distinctions in the atmospheric environment over the two sites, radar variables and vertical air motions in stratiform precipitation show diverse variation trends from cloud top to the ground. Above the melting layer, s (s) gradually increase (decrease) as height decreases over the two sites, but the aggregation rate for ice particles can be faster over the Longmen site. At the BB top, larger ice particles with smaller densities have been formed over the Longmen because of similar but larger . In the melting layer, s (s) at the bottom/center of the BB over the Longmen are larger (smaller) than those over the Nagqu due to the larger ice hydrometeors melted into larger raindrops. Therefore, over the Longmen, hydrometeors melt and fall more slowly in the melting layer, forming a thicker BB thickness. Moreover, the radar variables’ deviations in the same part of the BB over the two sites are also different. The s and s of the radar variables over both sites exhibit as > , < , < , and < , suggesting that Ze is more sensitive to the melting ice hydrometeors attached with water film. Below the bottom of the BB, radar variables have completely different behaviors. s/s (s) gradually increase (decrease) over the Longmen as height decreases, whereas over the Nagqu, there are no apparent change in s, and its s (s) continue to decrease (increase) as height decreases, which reflects that the collision, coalescence, evaporation, and breakup processes of raindrops are different between two sites. In addition, vertical air motions are very weak in the stratiform precipitation over the Longmen, whereas updrafts are more active over the Nagqu.
Falling raindrops possess diverse microphysical properties over two different altitude sites. Over the Longmen, stratiform precipitation is dominated by raindrop collision and coalescence processes; in particular, from 2.0–2.8 km, the breakup process competes with collision–coalescence processes but later is overpowered. In contrast, over the Nagqu, the dominant processes are collision and coalescence processes. Comparisons of raindrop spectra suggest that the concentration of small raindrops over the Nagqu is much higher than that over the Longmen, whereas there is a greater concentration of medium-to-large raindrops over the former than over the latter. Therefore, () over the Nagqu is smaller (larger) than that over the Longmen.
The MRR-measured results are consistent with the disdrometer results for medium raindrops over the two sites, but concentrations are underestimated to some extent. However, for large raindrops, radar can slightly overestimate concentrations. The discrepancies between the two instruments may be caused by differences in measuring principles, sampling heights, equipment limitations, and the natural variations of raindrops. The averaged - pairs over the Longmen and Nagqu sites are compared with two previous results for summer precipitation over Central and East China, which also exhibit diverse behaviors. For the Longmen, effective collision and coalescence processes lead to s larger than those over the other aforementioned regions—correspondingly, s can be smaller. For the Nagqu, because of the short falling path of raindrops, collision and coalescence processes are insufficient, leading to a relatively high concentration of small raindrops falling to the ground. Thus, it may be concluded that the altitude, water vapor, and atmospheric conditions are the main explanations for the difference between two sites with different altitudes.
Author Contributions
Conceptualization, J.Z. and Z.Z.; methodology, J.H. and Y.C.; software, J.H.; validation, J.H. and J.L.; formal analysis, J.H.; investigation, J.Z.; resources, M.Z.; data curation, M.Z.; writing—original draft preparation, J.H.; writing—review and editing, J.Z. and Y.C.; visualization, J.H.; supervision, Z.Z.; project administration, J.Z.; funding acquisition, J.Z. and Y.C. All authors have read and agreed to the published version of the manuscript.
Funding
This research was funded by the National Key Research and Development Program of China (Grant No. 2018YFC1505702), the National Natural Science Foundation of China (Grant Nos. 41905084, 41705008), and the Scientific Research Foundation of Chengdu University of Information Technology (Grant No. KYTZ201728).
Acknowledgments
The authors would like to thank the Chinese Academy of Meteorological Sciences for providing the radar data. Thanks also go to the reviewers for thorough comments that really helped to improve the manuscript.
Conflicts of Interest
The authors declare no conflict of interest.
Appendix A
Table A1.
Abbreviations used in this paper.
Table A1.
Abbreviations used in this paper.
| No. | Abb. | Meaning | No. | Abb. | Meaning |
|---|---|---|---|---|---|
| 1 | BB | bright-band | 9 | spectrum width | |
| 2 | DSD | raindrop size distribution | 10 | LDR | linear depolarization ratio |
| 3 | CR | Ka-band millimeter-wave cloud radar | 11 | mass-weighted mean diameter | |
| 4 | MRR | K-band microrain radar | 12 | generalized intercept parameter | |
| 5 | disdrometer | Parsivel disdrometer | 13 | AVs | averages |
| 6 | DSP | Doppler spectra | 14 | MDs | medians |
| 7 | radar equivalent reflectivity factor | 15 | STDs | standard deviations | |
| 8 | mean Doppler velocity | 16 | SKs | skewnesses |
References
- Houze, R.A. Stratiform precipitation in regions of convection: A meteorological paradox? Bull. Am. Meteorol. Soc. 1997, 78, 2179–2196. [Google Scholar] [CrossRef]
- Schumacher, C.; Houze, R.A. Stratiform rain in the tropics as seen by the TRMM precipitation radar. J. Clim. 2003, 16, 1739–1756. [Google Scholar] [CrossRef]
- Gettelman, A.; Liu, X.; Barahona, D.; Lohmann, U.; Chen, C. Climate impacts of ice nucleation. J. Geophys. Res. Atmos. 2012, 117, D20201. [Google Scholar] [CrossRef]
- Ruiz-Leo, A.M.; Hernández, E.; Queralt, S.; Maqueda, G. Convective and stratiform precipitation trends in the Spanish Mediterranean coast. Atmos. Res. 2013, 119, 46–55. [Google Scholar] [CrossRef]
- Hou, T.; Lei, H.; Hu, Z.; Yang, J.; Li, X. Simulations of microphysics and precipitation in a stratiform cloud case over Northern China: Comparison of two microphysics schemes. Adv. Atmos. Sci. 2020, 37, 117–129. [Google Scholar] [CrossRef]
- Hobbs, P.V.; Matejka, T.J.; Herzegh, P.H.; Locatelli, J.D.; Houze, R.A. The mesoscale and microscale structure and organization of clouds and precipitation in midlatitude cyclones. I: A case study of a cold front. J. Atmos. Sci. 1980, 37, 568–596. [Google Scholar] [CrossRef]
- Choi, H.; Bindschadler, R. Cloud detection in Landsat imagery of ice sheets using shadow matching technique and automatic normalized difference snow index threshold value decision. Remote Sens. Environ. 2004, 91, 237–242. [Google Scholar] [CrossRef]
- Ruan, Z.; Ming, H.; Ma, J.; Ge, R.; Bian, L. Analysis of the microphysical properties of a stratiform rain event using an L-band profiler radar. J. Meteorol. Res. 2014, 28, 268–280. [Google Scholar] [CrossRef]
- Konwar, M.; Maheskumar, R.S.; Das, S.K.; Morwal, S.B. Nature of light rain during presence and absence of bright band. J. Earth Syst. Sci. 2012, 121, 947–961. [Google Scholar] [CrossRef]
- Smith, C.J. The reduction of errors caused by bright bands in quantitative rainfall measurements made using radar. J. Atmos. Ocean. Technol. 1986, 3, 129–141. [Google Scholar] [CrossRef][Green Version]
- Bellon, A.; Lee, G.W.; Zawadzki, I. Error statistics of VPR corrections in stratiform precipitation. J. Appl. Meteorol. 2005, 44, 998–1015. [Google Scholar] [CrossRef]
- Kumar, S.; Castillo-Velarde, C.D.; Valdivia Prado, J.M.; Flores Rojas, J.L.; Callañaupa Gutierrez, S.M.; Moya Alvarez, A.S.; Martine-Castro, D.; Silva, Y. Rainfall characteristics in the Mantaro Basin over tropical Andes from a vertically pointed profile rain radar and in-situ field campaign. Atmosphere 2020, 11, 248. [Google Scholar] [CrossRef]
- Jash, D.; Resmi, E.; Unnikrishnan, C.K.; Sumesh, R.K.; Sreekanth, T.S.; Sukumar, N.; Ramachandran, K. Variation in rain drop size distribution and rain integral parameters during southwest monsoon over a tropical station: An inter-comparison of disdrometer and Micro Rain Radar. Atmos. Res. 2019, 217, 24–36. [Google Scholar] [CrossRef]
- Devisetty, H.K.; Jha, A.K.; Das, S.K.; Deshpande, S.M.; Krishna, U.V.M.; Kalekar, P.M.; Pandithurai, G. A case study on bright band transition from very light to heavy rain using simultaneous observations of collocated X- and Ka-band radars. J. Earth Syst. Sci. 2019, 128, 136. [Google Scholar] [CrossRef]
- Foth, A.; Zimmer, J.; Lauermann, F.; Kalesse-Los, H. Evaluation of micro rain radar-based precipitation classification algorithms to discriminate between stratiform and convective precipitation. Atmos. Meas. Tech. 2021, 14, 4565–4574. [Google Scholar] [CrossRef]
- Sumesh, R.K.; Resmi, E.A.; Unnikrishnan, C.K.; Jash, D.; Sreekanth, T.S.; Resmi, M.C.M.; Rajeevan, K.; Nita, S.; Ramachandran, K.K. Microphysical aspects of tropical rainfall during bright band events at mid and high-altitude regions over southern Western Ghats, India. Atmos. Res. 2019, 227, 178–197. [Google Scholar] [CrossRef]
- Rosenfeld, D.; Ulbrich, C.W. Cloud Microphysical Properties, Processes, and Rainfall Estimation Opportunities. Meteorol. Monogr. 2003, 30, 237–258. [Google Scholar] [CrossRef]
- Zwiebel, J.; Van Baelen, J.; Anquetin, S.; Pointin, Y.; Boudevillain, B. Impacts of orography and rain intensity on rainfall structure. The case of the HyMeX IOP7a event. Q. J. R. Meteorol. Soc. 2016, 142, 310–319. [Google Scholar] [CrossRef]
- Zhou, L.; Dong, X.; Fu, Z.; Wang, B.; Leng, L.; Xi, B.; Cui, C. Vertical distributions of raindrops and Z-R relationships using microrain radar and 2-D-video distrometer measurements during the Integrative Monsoon Frontal Rainfall Experiment (IMFRE). J. Geophys. Res. Atmos. 2019, 125. [Google Scholar] [CrossRef]
- Ramadhan, R.; Marzuki; Vonnisa, M.; Harmadi; Hashiguchi, H.; Shimomai, T. Diurnal variation in the vertical profile of the raindrop size distribution for stratiform rain as inferred from micro rain radar observations in Sumatra. Adv. Atmos. Sci. 2020, 37, 832–846. [Google Scholar] [CrossRef]
- Seela, B.K.; Janapati, J.; Lin, P.-L.; Wang, P.K.; Lee, M.-T. Raindrop size distribution characteristics of summer and winter season rainfall over north Taiwan. J. Geophys. Res. Atmos. 2018, 123, 11,602–11,624. [Google Scholar] [CrossRef]
- Li, H.; Yin, Y.; Shan, Y.; Jin, Q. Statistical characteristics of raindrop size distribution for stratiform and convective precipitation at different altitudes in Mt. Huangshan. Chin. J. Atmos. Sci. 2018, 42, 268–280. (In Chinese) [Google Scholar] [CrossRef]
- Huo, Z.Y.; Ruan, Z.; Wei, M.; Ge, R.S.; Li, F.; Ruan, Y. Statistical characteristics of raindrop size distribution in South China summer based on the vertical structure derived from VPR-CFMCW. Atmos. Res. 2019, 222, 47–61. [Google Scholar] [CrossRef]
- Tang, Q.; Xiao, H.; Guo, C.; Feng, L. Characteristics of the raindrop size distributions and their retrieved polarimetric radar parameters in northern and southern China. Atmos. Res. 2014, 135–136, 59–75. [Google Scholar] [CrossRef]
- Zhang, A.; Hu, J.; Chen, S.; Hu, D.; Liang, Z.; Huang, C.; Xiao, L.; Min, C.; Li, H. Statistical characteristics of raindrop size distribution in the monsoon season observed in southern China. Remote Sens. 2019, 11, 432. [Google Scholar] [CrossRef]
- Feng, L.; Hu, S.; Liu, X.; Xiao, H.; Pan, X.; Xia, F.; Ou, G.; Zhang, C. Precipitation microphysical characteristics of Typhoon Mangkhut in southern China using 2D video disdrometers. Atmosphere 2020, 11, 975. [Google Scholar] [CrossRef]
- Chen, B.; Hu, Z.; Liu, L.; Zhang, G. Raindrop size distribution measurements at 4500 m on the Tibetan Plateau during TIPEX-III. J. Geophys. Res. Atmos. 2017, 122, 11092–11106. [Google Scholar] [CrossRef]
- Wang, Y.; Zheng, J.; Cheng, Z.; Wang, B. Characteristics of raindrop size distribution on the eastern slope of the Tibetan Plateau in summer. Atmosphere 2020, 11, 562. [Google Scholar] [CrossRef]
- Wu, Y.; Liu, L. Statistical characteristics of raindrop size distribution in the Tibetan Plateau and southern China. Adv. Atmos. Sci. 2017, 34, 727–736. [Google Scholar] [CrossRef]
- Liu, L.P.; Zheng, J.F.; Ruan, Z.; Cui, Z.H.; Hu, Z.Q.; Wu, S.H.; Dai, G.Y.; Wu, Y.H. Comprehensive radar observations of clouds and precipitation over the Tibetan Plateau and preliminary analysis of cloud properties. J. Meteorol. Res. 2015, 29, 546–561. [Google Scholar] [CrossRef]
- Liu, L.P.; Ruan, Z.; Zheng, J.F.; Gao, W.H. Comparing and merging observation data from Ka-band cloud radar, C-band frequency-modulated continuous wave radar and ceilometer systems. Remote Sens. 2017, 9, 1282. [Google Scholar] [CrossRef]
- Liu, L.; Zheng, J.; Wu, J. A Ka-band solid-state transmitter cloud radar and data merging algorithm for its measurements. Adv. Atmos. Sci. 2017, 34, 545–558. [Google Scholar] [CrossRef]
- Peters, G.; Fischer, B.; Andersson, T. Rain observations with a vertically looking Micro Rain Radar (MRR). Boreal Environ. Res. 2002, 7, 353–362. [Google Scholar]
- Peters, G.; Fischer, B.; Munster, H.; Clemens, M.; Wagner, A. Profiles of raindrop size distributions as retrieved by microrain radars. J. Appl. Meteorol. 2005, 44, 1930–1949. [Google Scholar] [CrossRef]
- Adirosi, E.; Baldini, L.; Roberto, N.; Gatlin, P.; Tokay, A. Improvement of vertical profiles of raindrop size distribution from micro rain radar using 2D video disdrometer measurements. Atmos. Res. 2016, 169, 404–415. [Google Scholar] [CrossRef]
- Wen, L.; Zhao, K.; Zhang, G.; Xue, M.; Zhou, B.; Liu, S.; Chen, X. Statistical characteristics of raindrop size distributions observed in East China during the Asian summer monsoon season using 2-D video disdrometer and Micro Rain Radar data. J. Geophys. Res. Atmos. 2016, 121, 2265–2282. [Google Scholar] [CrossRef]
- Wang, H.; Lei, H.C.; Yang, J.F. Microphysical processes of a stratiform precipitation event over eastern China: Analysis using micro rain radar data. Adv. Atmos. Sci. 2017, 34, 1472–1482. [Google Scholar] [CrossRef]
- Wen, L.; Zhao, K.; Wang, M.Y.; Zhang, G.F. Seasonal variations of observed raindrop size distribution in East China. Adv. Atmos. Sci. 2019, 36, 346–362. [Google Scholar] [CrossRef]
- Jaffrain, J.; Berne, A. Experimental quantification of the sampling uncertainty associated with measurements from PARSIVEL disdrometers. J. Hydrometeor. 2011, 12, 352–370. [Google Scholar] [CrossRef]
- Tokay, A.; Petersen, W.A.; Gatlin, P.; Wingo, M. Comparison of raindrop size distribution measurements by collocated disdrometers. J. Atmos. Ocean. Technol. 2013, 30, 1672–1690. [Google Scholar] [CrossRef]
- Raupach, T.H.; Berne, A. Correction of raindrop size distributions measured by Parsivel disdrometers, using a two-dimensional video disdrometer as a reference. Atmos. Meas. Tech. 2015, 8, 343–365. [Google Scholar] [CrossRef]
- Chen, B.J.; Wang, J.; Gong, D.L. Raindrop size distribution in a midlatitude continental squall line measured by Thies optical disdrometers over east China. J. Appl. Meteorol. Climatol. 2016, 55, 621–634. [Google Scholar] [CrossRef]
- Das, S.K.; Konwar, M.; Chakravarty, K.; Deshpande, S.M. Raindrop size distribution of different cloud types over the Western Ghats using simultaneous measurements from Micro-Rain Radar and disdrometer. Atmos. Res. 2017, 186, 72–82. [Google Scholar] [CrossRef]
- Janapati, J.; Seela, B.K.; Lin, P.L.; Lee, M.T.; Joseph, E. Microphysical features of typhoon and non-typhoon rainfall observed in Taiwan, an island in the northwestern Pacific. Hydrol. Earth Syst. Sci. 2021, 25, 4025–4040. [Google Scholar] [CrossRef]
- Huang, X.Y.; Fan, Y.W.; Li, F.; Xiao, H.; Zhang, X. The attenuation correction for a 35 GHz ground-based cloud radar. J. Infrared Millim. Waves 2013, 32, 325–330. (In Chinese) [Google Scholar] [CrossRef]
- Kollias, P.; Albrecht, B.A.; Marks, F.D., Jr. Cloud radar observations of vertical drafts and microphysics in convective rain. J. Geophys. Res. Atmos. 2003, 108. [Google Scholar] [CrossRef]
- Kollias, P.; Clothiaux, E.E.; Miller, M.A.; Albrecht, B.A.; Stephens, G.L.; Ackerman, T.P. Millimeter-Wavelength Radars: New Frontier in Atmospheric Cloud and Precipitation Research. Bull. Am. Meteorol. Soc. 2007, 88, 1608–1624. [Google Scholar] [CrossRef]
- Zheng, J.; Zhang, P.; Liu, L.; Liu, Y.; Che, Y. A study of vertical structures and microphysical characteristics of different convective cloud-precipitation types using Ka-band millimeter wave radar measurements. Remote Sens. 2019, 11, 1810. [Google Scholar] [CrossRef]
- Liu, L.; Ding, H.; Dong, X.; Cao, J.; Su, T. Applications of QC and merged doppler spectral density data from Ka-band cloud radar to microphysics retrieval and comparison with airplane in situ observation. Remote Sens. 2019, 11, 1595. [Google Scholar] [CrossRef]
- Matrosov, S.Y. Attenuation-based estimates of rainfall rates aloft with vertically pointing Ka-band radars. J. Atmos. Ocean. Technol. 2005, 22, 43–54. [Google Scholar] [CrossRef]
- Kunz, M. Niederschlagsmessungen Mit Einem Vertikal Ausgerichteten K-Band FM-CW-Dopplerradar. Ph.D. Thesis, Institut für Meteorologie und Klimaforschung, Universität Karlsruhe, Karlsruhe, Germany, 1998; p. 95. [Google Scholar]
- Battaglia, A.; Rustemeier, E.; Tokay, A.; Blahak, U.; Simmer, C. PARSIVEL snow observations: A critical assessment. J. Atmos. Ocean. Technol. 2010, 27, 333–344. [Google Scholar] [CrossRef]
- Atlas, D.; Srivastava, R.C.; Sekhon, R.S. Doppler radar characteristics of precipitation at vertical incidence. Rev. Geophys. 1973, 11, 1–35. [Google Scholar] [CrossRef]
- Jha, A.K.; Kalapureddy, M.C.R.; Devisetty, H.K.; Deshpande, S.M.; Pandithurai, G. A case study on large-scale dynamical influence on bright band using cloud radar during the Indian summer monsoon. Meteorol. Atmos. Phys. 2019, 131, 505–515. [Google Scholar] [CrossRef]
- Trömel, S.; Ryzhkov, A.V.; Hickman, B.; Mühlbauer, K.; Simmer, C. Polarimetric radar variables in the layers of melting and dendritic growth at X band—Implications for a nowcasting strategy in stratiform rain. J. Appl. Meteorol. Climatol. 2019, 58, 2497–2522. [Google Scholar] [CrossRef]
- Allabakash, S.; Lim, S.; Jang, B.-J. Melting layer detection and characterization based on range height indicator–quasi vertical profiles. Remote Sens. 2019, 11, 2848. [Google Scholar] [CrossRef]
- Li, H.; Moisseev, D. Two layers of melting ice particles within a single radar bright band: Interpretation and implications. Geophys. Res. Lett. 2020, 47, e2020GL087499. [Google Scholar] [CrossRef]
- Fabry, F.; Zawadzki, I. Long-term radar observations of the melting layer of precipitation and their interpretation. J. Atmos. Sci. 1995, 52, 838–851. [Google Scholar] [CrossRef]
- Liu, L.; Zhou, M. Characteristics of bright band and automatic detection algorithm with vertical pointed Ka band cloud radar. Plateau Meteorol. 2016, 35, 734–744. (In Chinese) [Google Scholar] [CrossRef]
- Wang, H.; Guo, X. Comparative analyses of vertical structure of deep convective clouds retrieved from satellites and ground-based radars at Naqu over the Tibetan Plateau. J. Meteorol. Res. 2019, 33, 446–462. [Google Scholar] [CrossRef]
- Wang, D.; Liu, L.; Zhong, L.; Wei, Y.; Wang, X. Analysis of the characters of melting layer of cloud radar data and its identification. Meteorol. Mon. 2012, 38, 712–721. (In Chinese) [Google Scholar] [CrossRef]
- Sun, X.; Liu, X.; He, H.; Cheng, Z. Automatic identification technology of melting layer in millimeter wave cloud radar data. Meteorol. Mon. 2011, 37, 720–726. (In Chinese) [Google Scholar] [CrossRef]
- Xie, L.; Wang, D.; Huang, N.; Xie, X.; Liu, F.; Ou, J. Identification of atmosphere 0 °C isotherm through cloud radar data. J. Arid Meteorol. 2016, 34, 472–480. (In Chinese) [Google Scholar] [CrossRef]
- Brandes, E.A.; Ikeda, K. Freezing-level estimation with polarimetric radar. J. Appl. Meteorol. 2004, 43, 1541–1553. [Google Scholar] [CrossRef]
- Liu, L.P.; Xie, L.; Cui, Z.H. Examination and Application of Doppler Spectral Density Data in Drop Size Distribution Retrieval in Weak Precipitation by Cloud Radar. Chin. J. Atmos. Sci. 2014, 38, 223–236. (In Chinese) [Google Scholar] [CrossRef]
- Smyth, T.J.; Illingworth, A.J. Radar estimates of rainfall rates at the ground in bright band and non-bright band events. Q. J. R. Meteorol. Soc. 1998, 124, 2417–2434. [Google Scholar] [CrossRef]
- Low, T.B.; List, R. Collision, Coalescence and Breakup of Raindrops. Part I: Experimentally Established Coalescence Efficiencies and Fragment Size Distributions in Breakup. J. Atmos. Sci. 1982, 39, 1591–1606. [Google Scholar] [CrossRef]
- Niu, S.; An, X.; San, J. Observational research on physical feature of summer rain dropsize distribution under synoptic systems in Ningxia. Plateau Meteorol. 2002, 21, 37–44. (In Chinese) [Google Scholar] [CrossRef]
- Thurai, M.; Gatlin, P.; Bringi, V.N.; Petersen, W.; Kennedy, P.; Notaroš, B.; Carey, L. Toward completing the raindrop size spectrum: Case studies involving 2D-video disdrometer, droplet spectrometer, and polarimetric radar measurements. J. Appl. Meteor. Clim. 2017, 56, 877–896. [Google Scholar] [CrossRef]
- Wen, L.; Zhao, K.; Zhang, G.; Liu, S.; Chen, G. Impacts of instrument limitations on estimated raindrop size distribution, radar parameters, and model microphysics during mei-yu season in east China. J. Atmos. Ocean. Technol. 2017, 34, 1021–1037. [Google Scholar] [CrossRef]
- Wen, L.; Zhao, K.; Yang, Z.; Chen, H.; Huang, H.; Chen, G.; Yang, Z. Microphysics of Stratiform and Convective Precipitation During Meiyu Season in Eastern China. J. Geophys. Res. Atmos. 2020, 125, e2020JD032677. [Google Scholar] [CrossRef]


Publisher’s Note: MDPI stays neutral with regard to jurisdictional claims in published maps and institutional affiliations. |
© 2021 by the authors. Licensee MDPI, Basel, Switzerland. This article is an open access article distributed under the terms and conditions of the Creative Commons Attribution (CC BY) license (https://creativecommons.org/licenses/by/4.0/).