Abstract
Aircraft emit harmful substances, such as carbon dioxide (CO2), water vapour (H2O), nitrogen oxides (NOx), sulphur oxides (SOx), particulates, and other trace compounds. These emissions degrade air quality and can deteriorate human health and negatively impact climate change. Airports are the nucleus of the ground and low-altitude emissions from aircraft during approach, landing, take-off, and taxi. During the global lockdown due to the COVID-19 pandemic, tight restrictions of the movement were imposed, leading to temporary closures of airports globally. In this study, we look at the variability of emissions at two major airports in South Africa, namely the OR Tambo international airport (FAOR) and the Cape Town international airport (FACT). Trend analysis of aircraft movements, i.e., departures and arrivals, showed a sharp decline at the two airports coinciding with the lockdowns to prevent the spread of the COVID-19. Consequently, a decrease in NO2 emissions by 70.45% (12.6 × 10⁻⁵ mol/m2) and 64.58% (11.6 × 10⁻⁵ mol/m2) at FAOR and FACT were observed, respectively. A noticeable SO2 emission decline was also observed, particularly over FAOR during the lockdown period in South Africa. Overall, this study observed that the global lockdown regulations had a positive impact on the air quality, causing a brief decline in emissions from commercial aviation at the South African major airports.
Keywords:
atmospheric pollution; emissions; aviation; COVID-19; airports; Sentinel-5P; OMI; lockdown 1. Introduction
Globally, the imposed national lockdowns as a preventative measure of COVID-19 pandemic infections and deaths have inarguably resulted in major devastations to economies and livelihoods around the world, where the fragile developing economies were deeply impacted. These measures halted operations of major industries, such as mining, logistics, manufacturing and textile, and the tourism industry. Naturally, the aviation sector, as the heart of local, regional, and international tourism, was proportionally affected since various countries restricted leisure-related arrivals and departures in efforts to contain the virus. However, the lockdown measures showed a positive effect on the atmospheric environment, with several studies reporting reductions in anthropogenic emissions across the world, in China [1,2,3,4,5], Europe [6,7,8], and Brazil [9,10]. In Africa, Kganyago and Shikwambana [11] show a reduction in wildfire emissions, i.e., black carbon (BC), carbon monoxide (CO), and smoke and polluted dust aerosol optical depth (AOD), between the COVID-free year, i.e., 2019, and COVID-19 year, i.e., 2020, using the Sentinel-5P TROPOspheric Monitoring Instrument (TROPOMI), Cloud-Aerosol Lidar and Infrared Pathfinder Satellite Observation (CALIPSO), Moderate Resolution Imaging Spectroradiometer (MODIS), and Modern-Era Retrospective analysis for Research and Applications–Version 2 (MERRA-2) data. Using similar satellite and reanalysis datasets, Shikwambana, Kganyago, and Mhangara [12] found a significant decline in anthropogenic atmospheric pollutants, i.e., CO, sulphur dioxide (SO2), and sulphate (SO4), during a stricter lockdown level (i.e., Level-5) and a sharp increase in response to the ease of lockdown regulations in South Africa. However, the changes in aviation-related emissions in response to lockdown regulations has not been attempted yet.
In addition to the abovementioned studies, the capability of remote sensing satellites for remotely and rapidly acquiring atmospheric emissions data has been demonstrated previously with CALIPSO [13], MODIS [14], and MERRA-2 data [15], to name a few. However, most studies are conducted at global to regional scales, while local scales are limited. This was, in part, due to the lack of high-resolution data and well-maintained ground stations, especially in Africa. Fortunately, the advent of Sentinel-5P providing various atmospheric pollutants and trace gases at a relatively high resolution, i.e., 3 km, provides prospects of localising atmospheric pollution studies to account for various sources of emissions, e.g., biomass burning (wild and domestic fires) [16], industrial emissions [17], and road and air traffic emissions [18]. This is critical for monitoring the compliance and effectiveness of emission regulations and decision-making at a local level. For the aviation sector, particularly airport managing agencies, it is essential to characterise the emission footprint accurately and reliably at each airport for reporting and applying appropriate emission taxes.
Aircraft jet engines produce and emit carbon dioxide (CO2), water vapour (H2O), nitrogen oxides (NOx), carbon monoxide (CO), sulphur oxides (SOx), unburned or partially combusted hydrocarbons (VOCs), particulates, and other trace compounds [19,20]. Emissions are composed of about 70% CO2 and less than 30% water vapour [20]. CO2 and water vapour are greenhouse gases (GHG) and have a warming effect that impacts climate change. Based on whether aircraft emissions occur near the Earth’s surface or at higher altitudes, they are deemed local air quality contaminants (i.e., from ground to low altitude) or greenhouse gas (GHG) emissions (i.e., at high altitudes), respectively [21]. According to the Federal Aviation Administration [20], a significant amount of aircraft emissions, nearly 90%, occur at higher altitudes. Concerning VOCs and CO, the split is around 30% of emissions at ground-level and 70% of emissions at higher altitudes. Alarmingly, aircraft emissions have an adverse impact on human health. Bendtsen, et al. [22] showed that the size of particles and emission levels depend on the type of the aircraft, engine conditions, fuel type, and operation modes. Moreover, the study showed that residential areas near airports or close to places of running aircraft engines are associated with increased exposure and with increased risk of disease, increased hospital admissions, and self-reported lung symptoms.
This study aimed to assess the changes in aviation-related emissions with the changing lockdown regulations (https://www.gov.za/covid-19/about/about-alert-system accessed on 1 Ootober 2021). Specifically, the changes in NO2 and SO2 in response to lockdown levels were assessed. Moreover, the trend and abrupt change-point analyses were performed on arriving and departing aircraft to determine the direction and date of abrupt changes and their association with implemented lockdown regulations. The study was conducted in the two busiest airports in South Africa, i.e., O.R. Tambo International airport (ICAO: FAOR) and Cape Town International airport (ICAO: FACT).
2. Materials and Methods
2.1. Description of Airports
This study was conducted at two airports, i.e., O.R. Tambo International Airport (FAOR) and Cape Town International Airport (FACT), located in Johannesburg and Cape Town in South Africa, respectively. The former is located at 26°08′00″S and 28°15′00″E, while the latter, 33°58′10″S and 18°35′50″E. These two are the busiest airports in South Africa, responsible for bringing thousands of international and regional tourists, as well as enabling local travel and tourism [23]. As a result, the South African tourism industry grew by 6.6% (i.e., above-average global growth) between 2013 and 2014, contributing directly to the gross domestic product (GDP) by ZAR 103.6 billion in 2013. Before the COVID-19 pandemic, the World Travel and Tourism Council (WTTC) estimated an increase in contribution to GDP by the tourism sector from 9.2% in 2010 to 9.6% by 2020 [23].
2.2. Data
2.2.1. Sentinel-5P
Sentinel-5P measures and provides information about atmospheric trace gases, aerosols, and cloud distribution, which affects air quality and climate. The satellite carries a TROPOspheric Monitoring Instrument (TROPOMI) sensor. TROPOMI is a hyperspectral imaging spectrometer that measures the Earth’s radiance at the ultraviolet-visible (UV–VIS, 267–499 nm), near-infrared (NIR, 661–786 nm), and shortwave infrared (SWIR, 2300–2389 nm) wavelength ranges over ground pixels as small as 7.0 × 3.5 km. It has a swath width of 2600 km, which enables it to cover the globe almost daily. TROPOMI can measure a multitude of trace gases, such as nitrogen oxide (NO2), ozone (O3), formaldehyde (CH2O), sulphur dioxide (SO2), methane (CH4), carbon monoxide (CO), and aerosols. More details on Sentinel-5P can be found in Theys, et al. [24], Tilstra, et al. [25] and Verhoelst, et al. [26]. In this study, the NO2 product is used.
2.2.2. OMI
The Ozone Monitoring Instrument (OMI) flies onboard the NASA Earth Observing System (EOS)-Aura satellite. OMI was developed from a partnership between NASA and the Dutch and Finnish meteorological institutes for daily, global contiguous mapping of ozone and other trace gases important for air quality and climate. OMI does this by measuring sunlight backscattered from the Earth over a wide range of Ultraviolet (UV) and visible (Vis) wavelengths to derive abundances of ozone and other trace gases (such as SO2 and NO2). More details are described by Levelt, et al. [27]. In this study, the level-3 daily total column density SO2 in the Planetary Boundary Layer (PBL) data was used. The summary of the emissions data used in this study is shown in Table 1.

Table 1.
Summary of the emissions data used in this study.
2.2.3. Aircraft Statistics
The aircraft statistics were obtained from Airports Company South Africa (ACSA). This data contains the monthly aggregated number of arriving and departing aircraft per financial year. For simplicity, the financial year (April–March) was converted to the calendar year (January–December) by regrouping the data accordingly. The data for further analysis were grouped according to local (i.e., flights departing from, and arriving to, South African airports), regional (i.e., flights from and to other African Countries), and international (i.e., flights from and to other countries outside of Africa). The summary statistics of all the data are presented in Table 2.
Table 2.
Summary statistics of aircraft and passenger movements in OR Tambo International Airport and Cape Town International Airport.
2.3. Statistical Analysis
2.3.1. Ordinary Least Squares (OLS) Trend Analysis
Ordinary least squares (OLS) trend analysis estimates the magnitude and direction of the trend of a response variable against an independent variable (i.e., time). This statistical model is described in Equation (1).
where is the response variable for the month , and ; therefore, represents the month where the initial month is considered as month 1, , , , denotes the intercept, the slope, independent variable (i.e., date), and the random errors, respectively.
The slope and intercept are estimated from Equation (2), while the 95% confidence interval for the slope is given by Equation (3). The trend exists if 0 is not within the confidence interval [28].
SE is the standard error of the slope.
2.3.2. Pettitt’s Test
Pettitt’s test [29,30] is a rank-based non-parametric statistical test for detecting a single change-point in the mean of a continuous time-series data. It is well suited for a two-tailed test, i.e., when no hypothesis is made regarding the location of the change point, and for testing an unknown change-point. This is achieved by considering a sequence of random variables, i.e., , with a common distribution function that have a change-point at . However, have an identical distribution as , where . The statistic is the maximum of the absolute value of the time series (Equation (4)).
where, indicates the location of the significant change-point in the time series at where has its maximum (Equation (5)).
for the downward shift and for an upward shift. The approximate probability for a two-tailed test is given in Equation (6).
In this study, Pettitt’s test was used to detect an abrupt change in arriving and departing flights from FAOR and FACT airports. We tested the null hypothesis (H0): There is no significant change-point in the time series (2018–2021) of arriving and departing flights at a 95% confidence level (α = 0.05), against the alternative hypothesis (H1): There is a significant change-point in the time series (2018–2021) of arriving and departing flights at a 95% confidence level (α = 0.05). The analysis was performed using the R-Statistics package “trend” [31].
3. Results
3.1. Aircraft Movement and Airport Imagery
3.1.1. Trends in Aircraft Movements
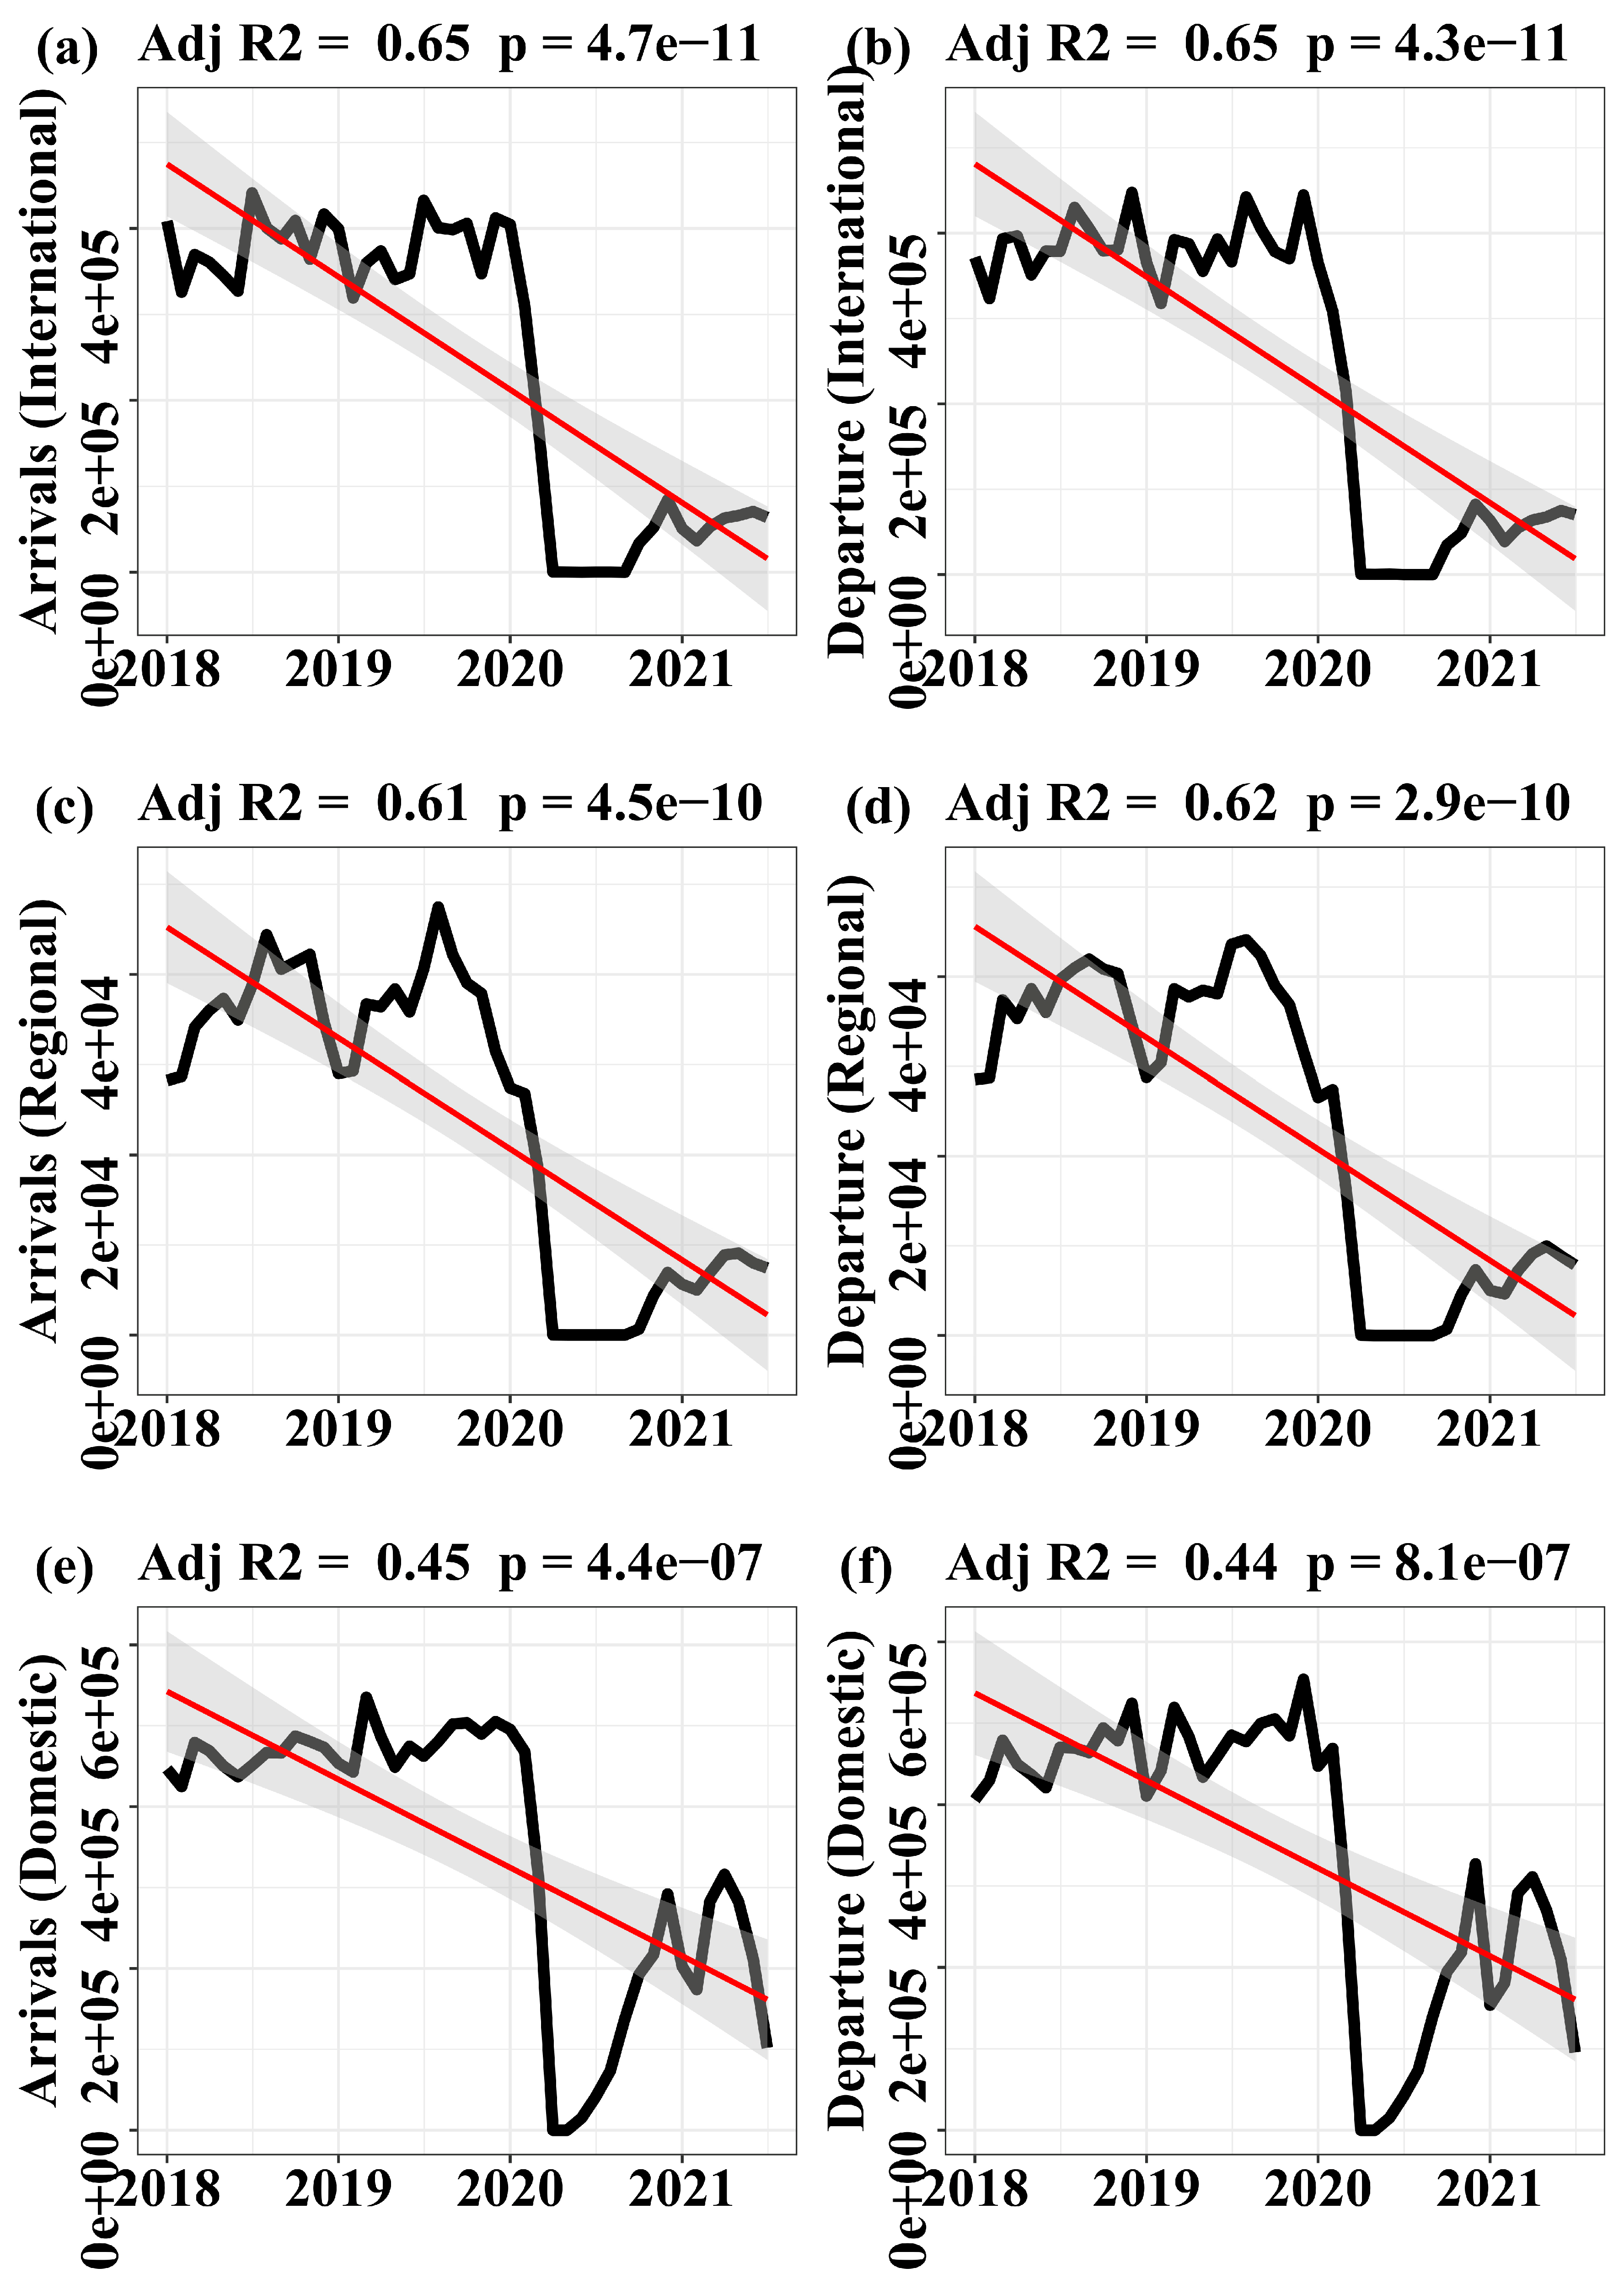
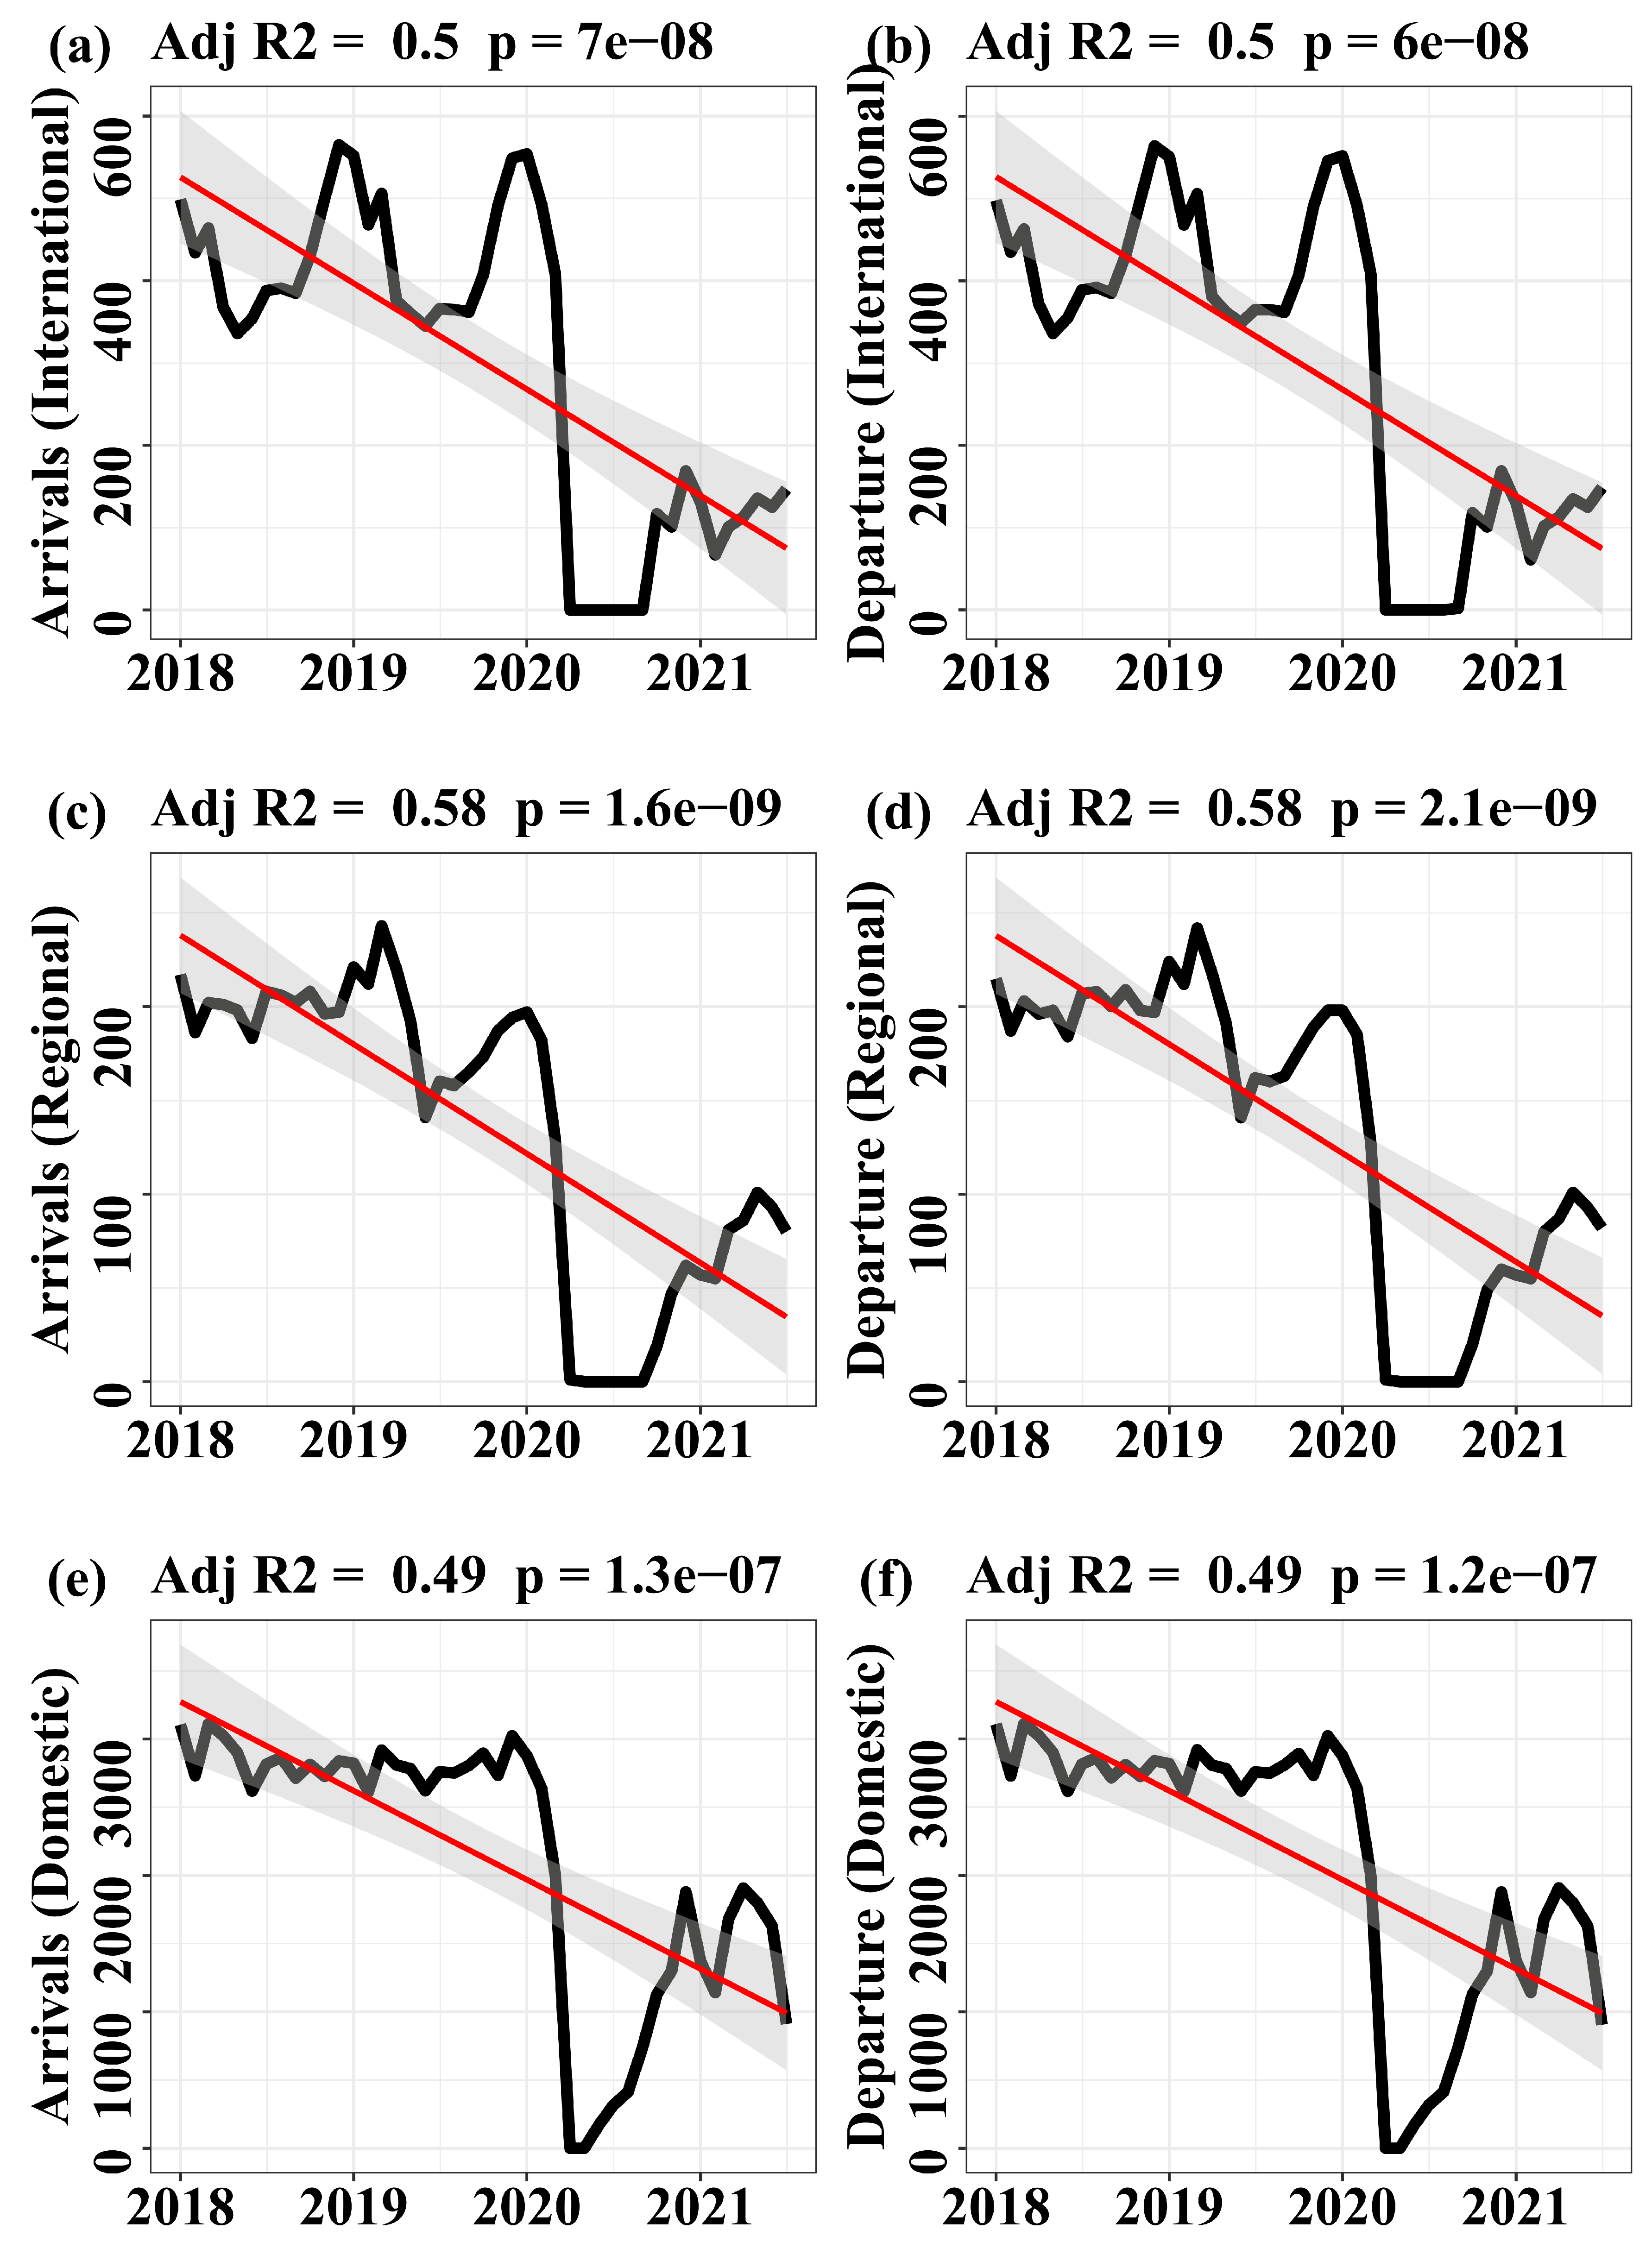
We analysed the trends in aircraft movements, i.e., departures and arrivals, at the two airports under study, i.e., FAOR and FACT. The results are presented in Figure 1 and Figure 2. As shown, all the local, regional, and international arriving and departing flights at both airports reduced significantly (p < 0.001) at the beginning of 2020 and remained low afterwards. At FAOR, the regional aircraft’s movements declined prior to 2020. Consistently, the results of Pettitt’s test (Table 3) indicate an abrupt change in the number of arriving and departing regional flights in December 2019 (p = 4.375 × 10⁻⁷). This decline in aircraft movements around January can also be seen in the previous years, i.e., 2018–2019 (Figure 1). In contrast, FACT shows an almost simultaneous reduction in all aircraft movements around January 2020. However, Pettitt’s test results (see Table 3) show that this observation is true for domestic aircrafts only (p = 9.703 × 10⁻⁷), while an abrupt change-point was detected in February 2020 (p = 1.106 × 10⁻⁶) and March 2020 (p = 2.107 × 10⁻⁶) for regional and international aircrafts, respectively. A small annual decline around January is expected due to seasonal changes in domestic aircraft’s movement following a festive season (i.e., December). This small decline is evident in the preceding years to 2020, and it is followed by an increase to peak levels in the following months (see Figure 1 and Figure 2). At FAOR, the significant change-point occurred in January 2020 (p = 6.533 × 10⁻⁷) and later, in February 2020 (p = 1.106 × 10⁻⁶), for international and domestic flights, respectively. These abrupt changes in the arriving and departing flights in 2020 were followed by a continued sharp decline to ectopic levels, i.e., zero at both airports. The international and regional flights remained at these levels for months, while domestic aircrafts recovered slowly towards December 2020, where they declined sharply again. The domestic flights started to show a slight recovery around March 2021, only to decline sharply afterwards, i.e., in April/May 2021. On the other hand, international and regional aircraft show some recovery (i.e., increase) around August 2020, only to reduce sharply again around December in the same year. Unfortunately, other significant change-points, i.e., after the initial abrupt change-point, could not be detected by Pettitt’s test since it is a single change-point detection method. Future studies should consider multi-change-point detection methods to determine other significant changes in the time series. The case study results show the trends in aircraft movements in the different lockdown levels imposed at the start of 2020 internationally and in March 2020 in South Africa and other African countries.
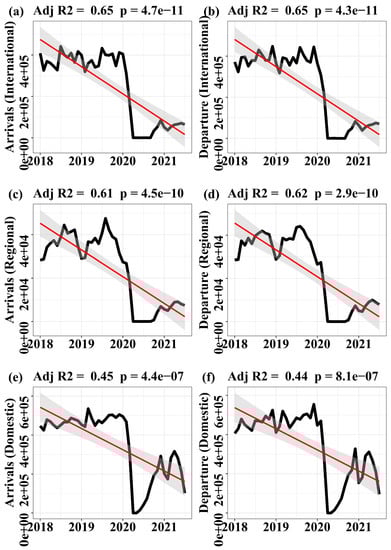
Figure 1.
The linear trend analysis of international, regional, and domestic aircraft movements from 2018 to 2021 at OR Tambo International Airport (FAOR). (a,b) show trends in international arrivals and departures, respectively, (c,d) show trends in regional arrivals and departures, respectively, while (e,f) show trends in domestic arrivals and departures, respectively.
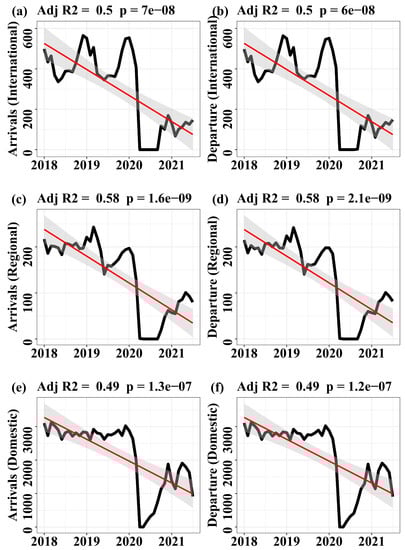
Figure 2.
The linear trend analysis of international, regional, and domestic aircraft movements from 2018 to 2021 at Cape Town International Airport (FACT). (a,b) show trends in international arrivals and departures, respectively, (c,d) show trends in regional arrivals and departures, respectively, while (e,f) show trends in domestic arrivals and departures, respectively.
Table 3.
Pettitt’s test for single change-point detection from arriving and departing flights at OR Tambo International Airport (FAOR) and Cape Town International Airport (FACT), respectively.
3.1.2. Satellite Images of OR Tambo and Cape Town International Airports
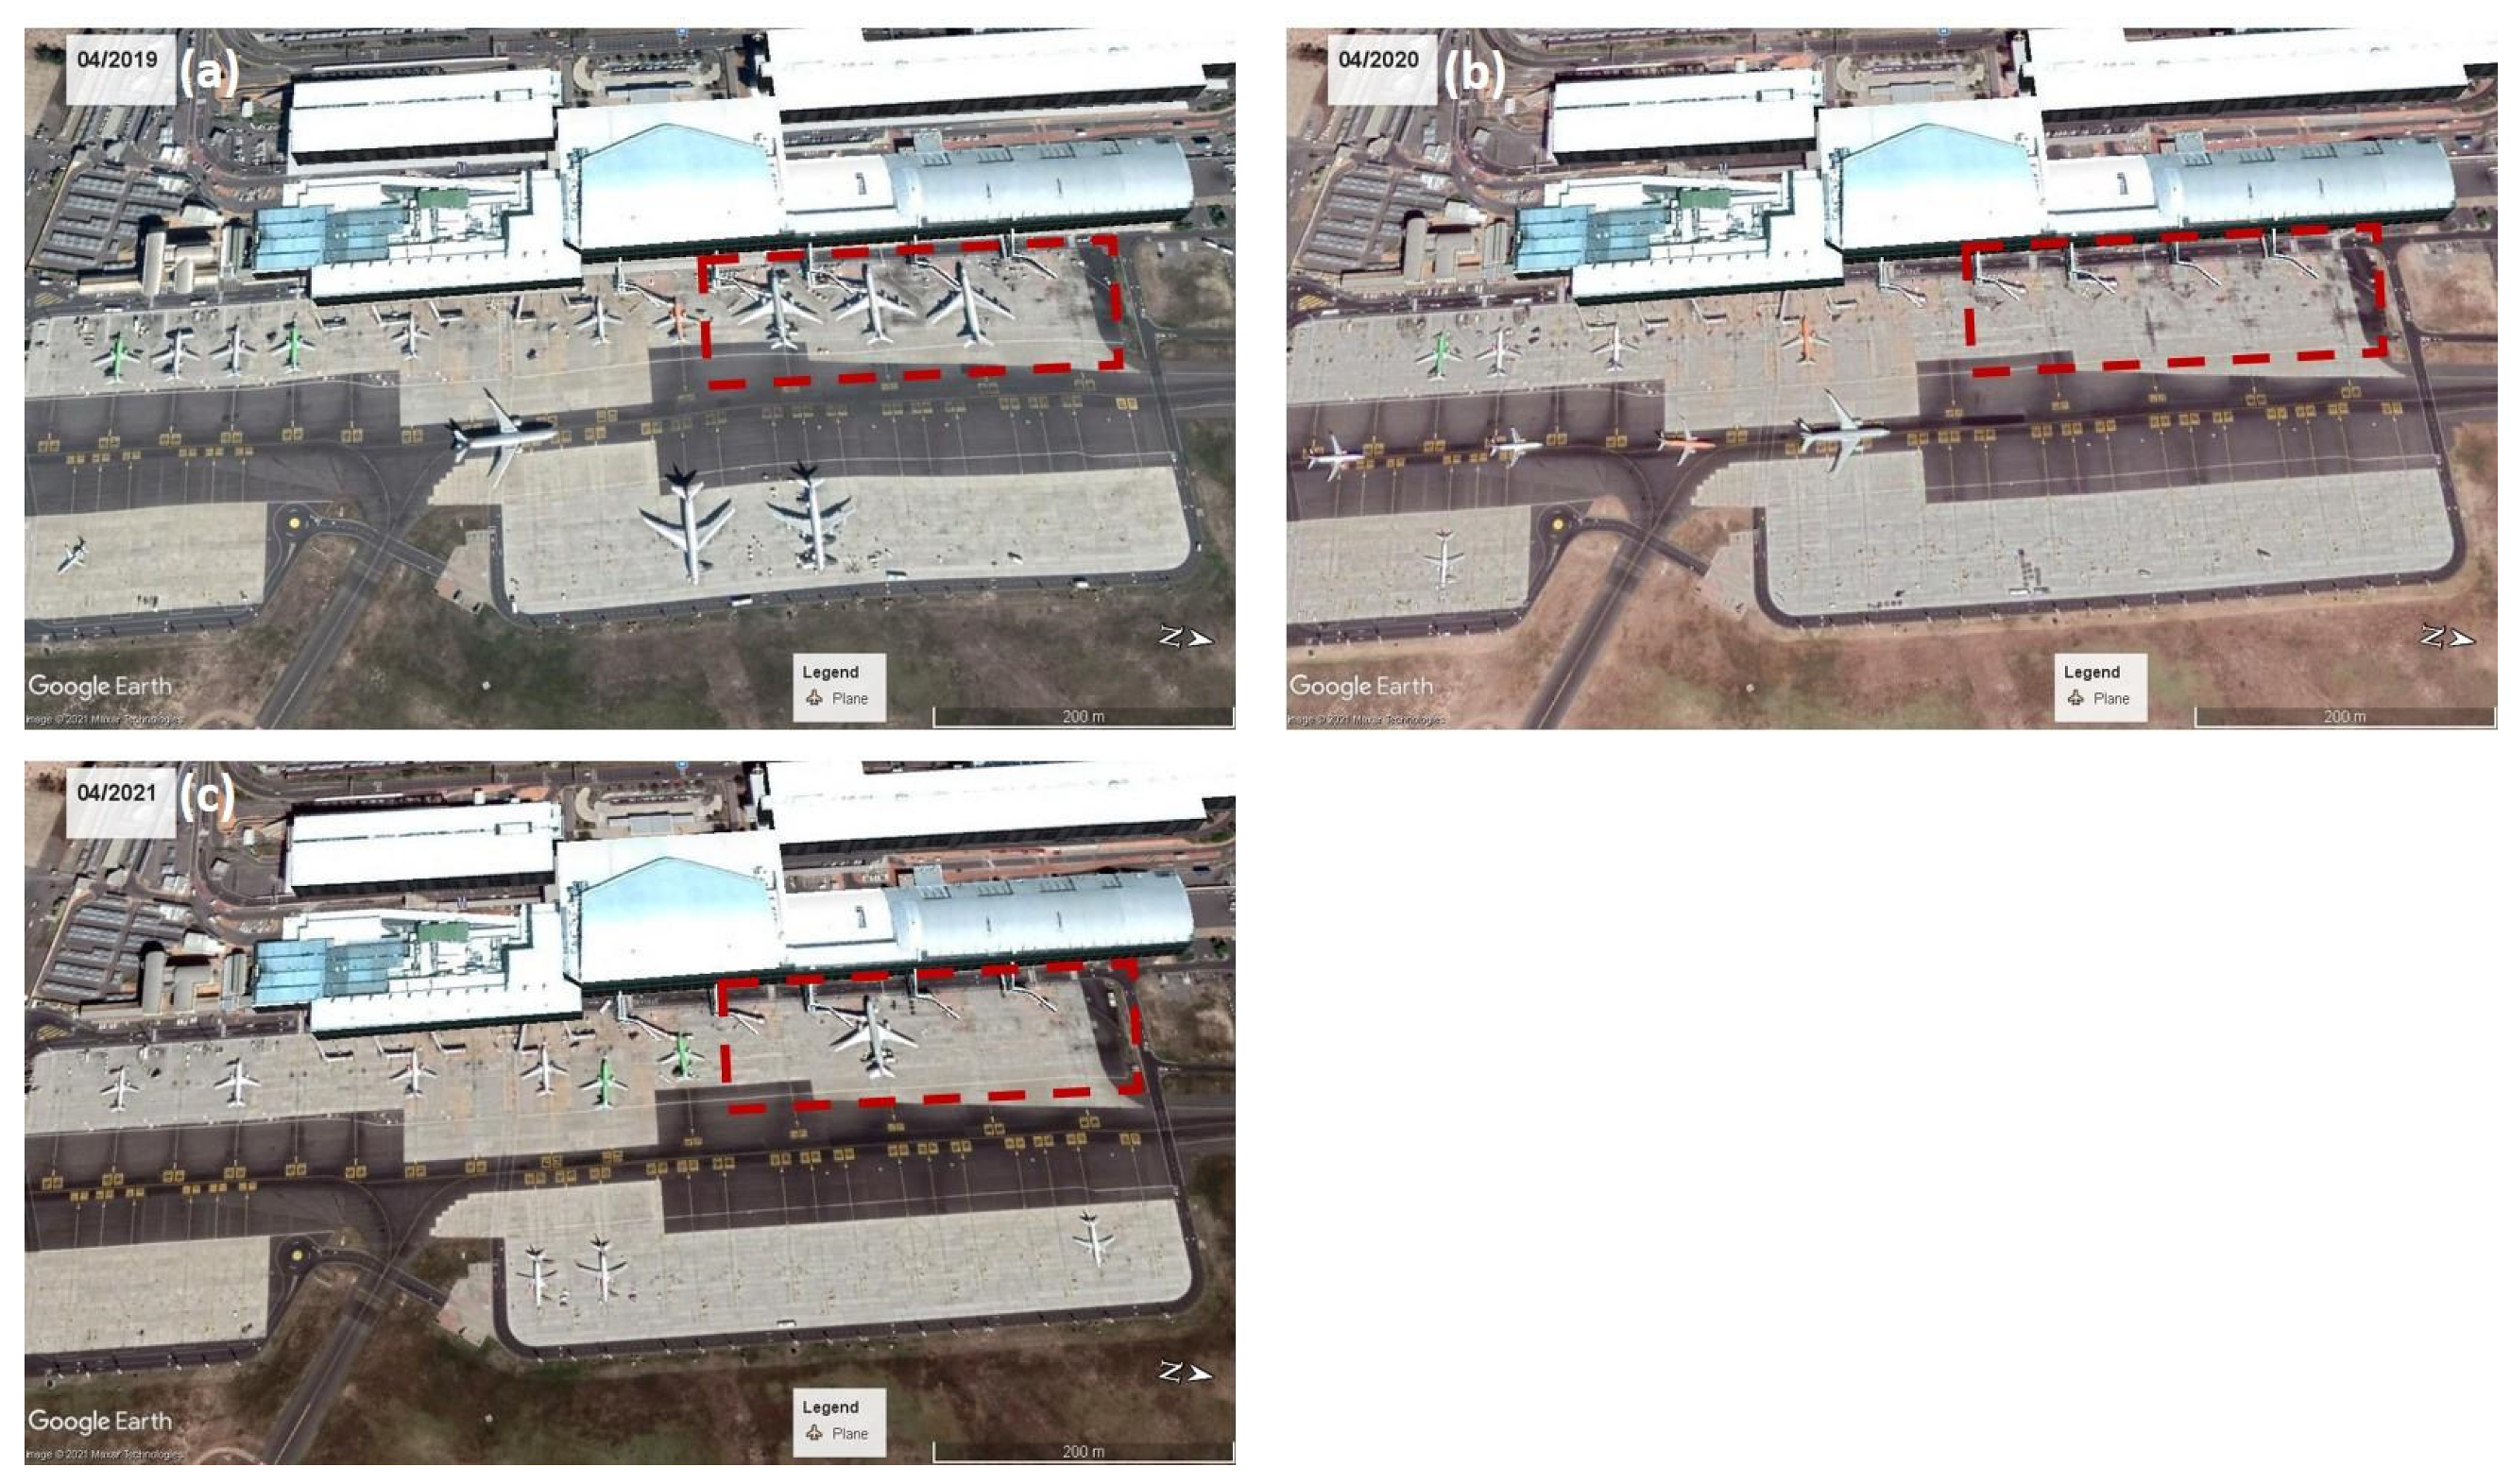
The Google Earth™ program was used to acquire images over the OR Tambo and Cape Town international airports. Images of April 2019, April 2020, and April 2021 over these airports were of interest. Figure 3 shows a view of the OR Tambo international airport with the aircraft parking bays. In April 2019 (see Figure 3a), several aircraft were observed parked at the bays, probably loading or off-loading passengers. Figure 3a shows a busy airport with potentially lots of activity. In contrast, Figure 3b shows relatively fewer aircraft at the bays, which implies very little to no activities. April 2020 was a period when the Level-5 lockdown restrictions were instituted in South Africa, which included the prohibition of flights. Therefore, local and international flights were grounded for the April period. In April 2021 (see Figure 3c), both local and international flights were in operation, but there was still only a few aircraft in operation compared to April 2019. The international, regional, and local demand for air travel had declined (see Figure 1a) due to the global lockdown regulations, resulting in only a few operational aircraft.
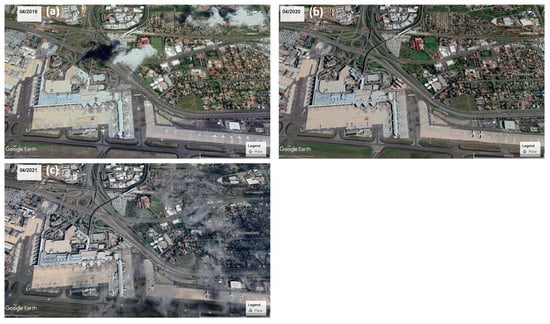
Figure 3.
Google Earth image of OR Tambo International Airport (FAOR) (a) before the Level-5 lockdown, (b) during the lockdown Level-5, and (c) after the Level-5 lockdown.
Figure 4 shows a view of the Cape Town International Airport with the aircraft parking bays. In April 2019 (see Figure 4a), the parking bay had both local and international (dashed red block) aircraft parked. However, in April 2020 (see Figure 4b), the international parking bay showed no aircraft, possibly due to the Level-5 lockdown restrictions that prohibited air travel. Moreover, local flights were also grounded. This agrees with the linear trend results presented in Figure 2. In April 2021 (see Figure 4c), both international and local flights were allowed to operate; however, the demand for air travel, which had decreased, as well as the uncertainty due to the new COVID-19 variants detected in South Africa and around the world, resulted in fewer operations of aircraft.
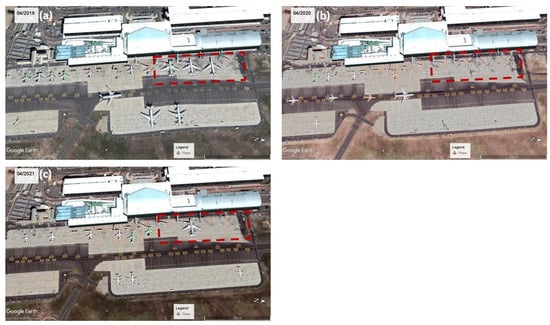
Figure 4.
Google Earth image of Cape Town International Airport (FACT) (a) before the Level-5 lockdown, (b) during the lockdown Level-5, and (c) after the Level-5 lockdown.
3.2. NO2 Emissions
The results in Figure 5 show the spatial distribution of NO2 tropospheric column density for April 2019, 2020, and 2021 over FAOR and FACT. In 2019 (see Figure 5a), a NO2 hotspot is observed over the airport (white box). The main sources of NO2 are from the exhausts system of aircraft and the vehicles (such as buses and cars) that operate within the airport. Large amounts of NO2 and NO are emitted when a large amount of fuel is consumed during take-off when engines run at nearly maximum load [32]. The highest NO2 column density, i.e., ~17.9 × 10⁻⁵ mol/m2, is observed at FAOR. This can be attributed to increased aircraft activity at the airport, as it is one of the busiest airports in Africa. Several other ground vehicles operate at the airport and contribute towards the NO2 column density. However, in 2020 (see Figure 5b), there was a remarkable drop (~70.45%) in the NO2 density, i.e., to ~2.77 × 10⁻⁵ mol/m2, over FAOR. A global shutdown that restricted movement, including aircraft, was responsible for the drop in NO2. The aircraft and the ground vehicles at the airport were not operating at full capacity, thus resulting in lower emissions of NO2. In 2021, there have not been any restrictions in the movement of aircraft, thus leading to an increased NO2 column density (see Figure 5c). Although the number of flights in 2021 is not as many as those in 2019 (see Table 1), the contrast between 2020 and 2021 in the NO2 load over FAOR is enhanced due to low to no activity in 2020, when strict lockdown measures were instituted.
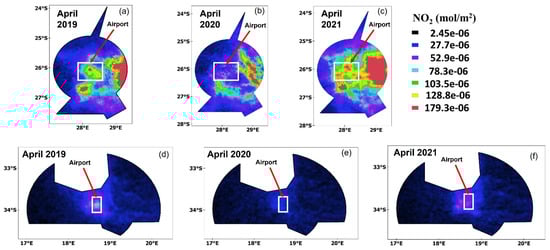
Figure 5.
NO2 tropospheric column and distribution for April (a) before the Level-5 lockdown over OR Tambo International Airport (FAOR), (b) during the lockdown Level-5 over FAOR, and (c) after the Level-5 lockdown over FAOR; (d) before the Level-5 lockdown over Cape Town International Airport (FACT), (e) during the lockdown Level-5 over FACT, and (f) after the Level-5 lockdown over FACT.
In 2019, when aircraft were operating “normally” without restrictions, a moderate (~7.83 × 10⁻⁵ mol/m2) NO2 column density was observed over FACT (see Figure 5d). Comparatively, FACT is smaller (in terms of area); thus, fewer aircraft are operating compared to FAOR (see Table 2). Therefore, the NO2 column density values from aircraft should be different. In 2020 (see Figure 5e), i.e., a period consistent with national lockdown restrictions, FACT also experienced a decrease in NO2 column density by ~64.58%. An increase, relative to 2019, of ~47.64% in NO2 column density is observed in 2021 (see Figure 5f) in response to the lifting of the lockdown restrictions in several countries, which allowed air travel. However, the airport and flights were not operating at full capacity as the number of flights leaving and entering the airport were not many as compared to 2019. The fewer flights also meant fewer aircraft activity at the airport, thus lesser emissions of NO2.
3.3. SO2 Emissions
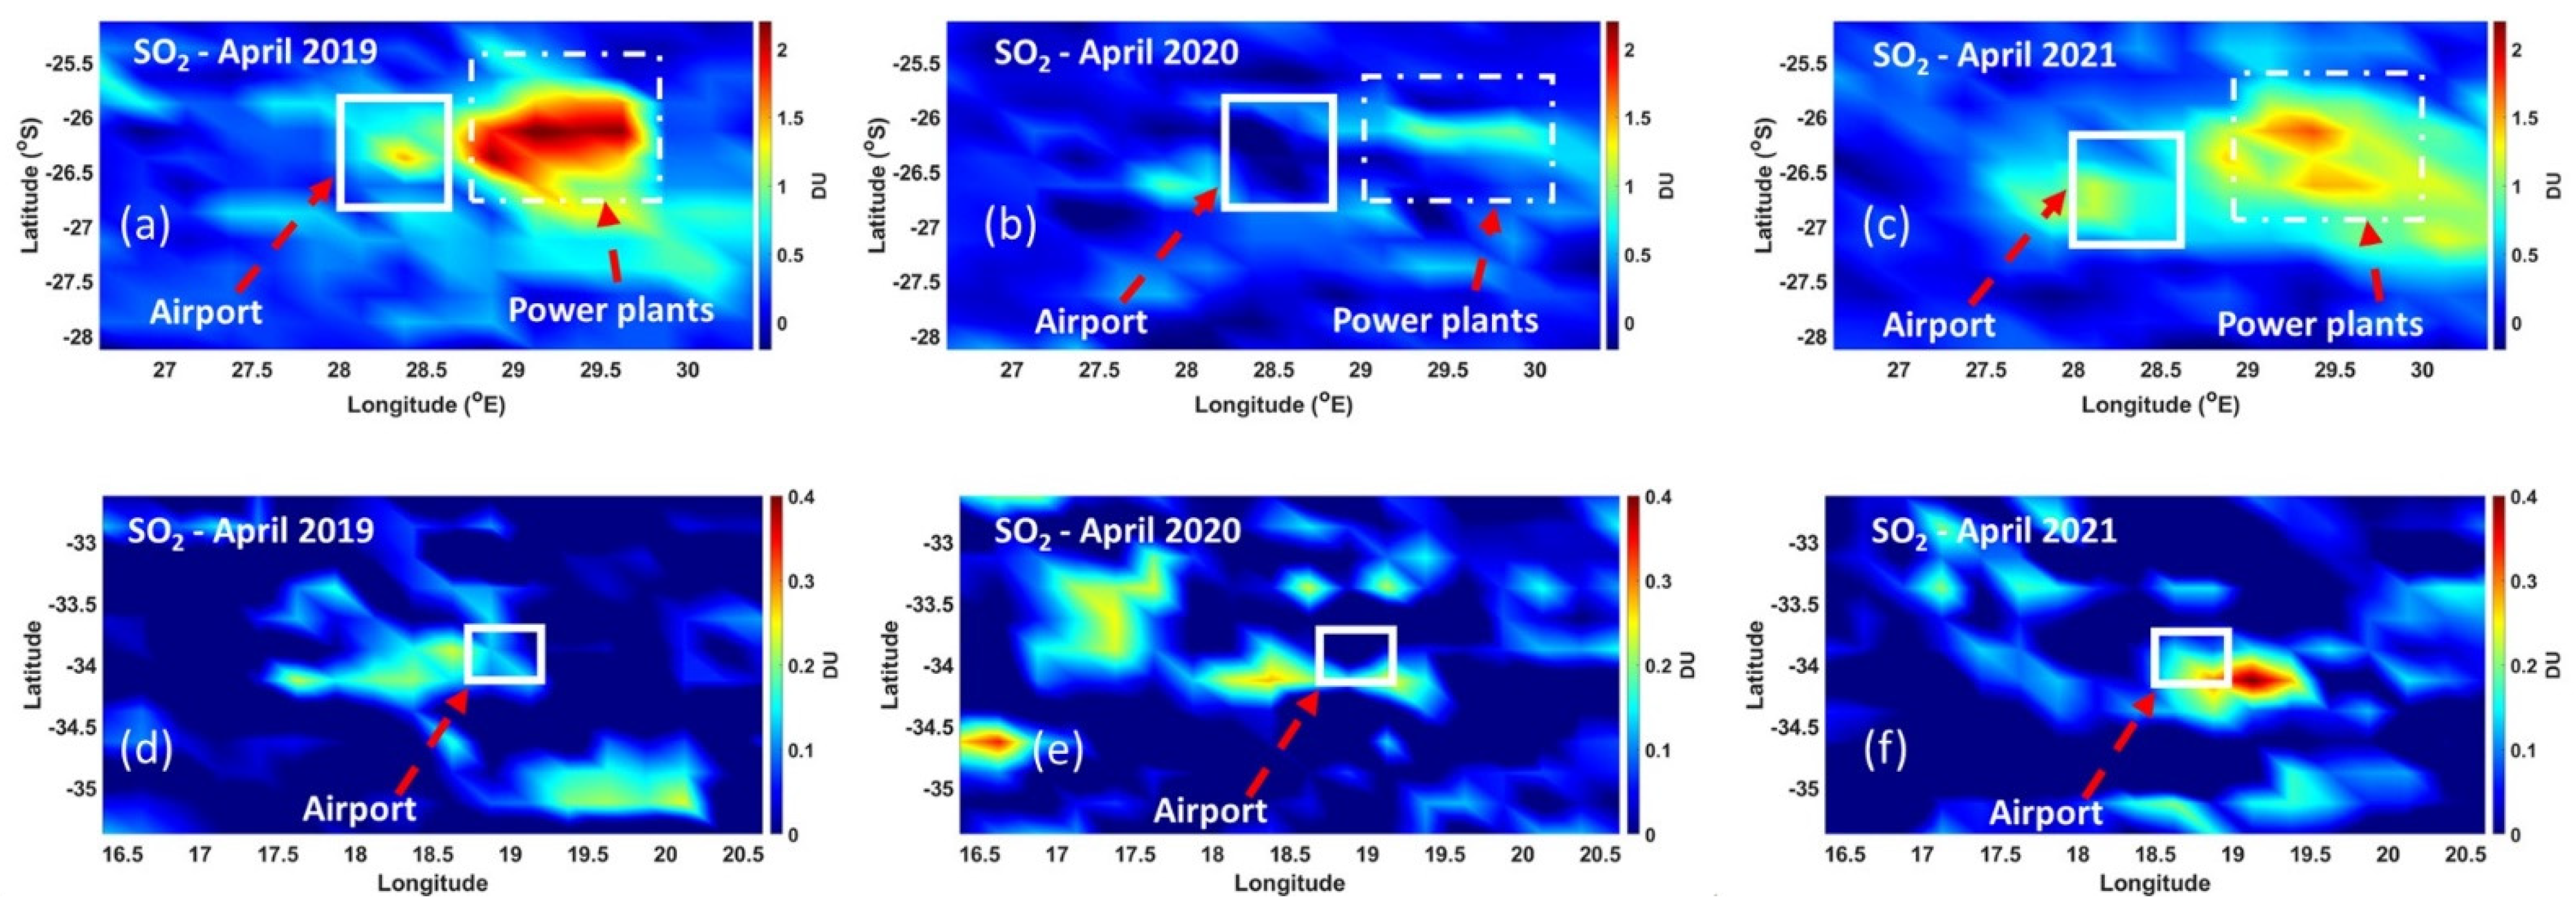
Figure 6 shows the spatial distribution of SO2 tropospheric column density for April 2019, 2020m and 2021 over FAOR and FACT. In 2019 (see Figure 6a), two SO2 hotspots were observed. The large SO2 hotspot (dashed line white box) is from the coal-fired power plants, producing most of South Africa’s electricity, which are scattered in the Mpumalanga province over 100 km away from the airport. The small hotspot (solid line white box) corresponds to the SO2 emissions from the airport. The SO2 emissions are mostly from the aircraft’s engine exhausts. Forster, et al. [33] and Lee, et al. [34] showed that SO2 gas is one of the pollutants emitted from a turbofan engine during combustion. Both hotspots show high values (i.e., 1.5–2 DU) of SO2 column densities. For the power station, the hotspot corresponds to the daily demand for electricity and operations, which results in high outputs of SO2 gas, among other pollutants. For FAOR, this also relates to the increased activity at the airport, with many aircraft leaving and entering the airport, thus emitting high amounts of SO2. On the contrary (see Figure 6b), a reduction in the SO2 column density of ~50% and ~100% over the power plants and the airport were observed in 2020, respectively. This observation is astonishing and implies that the FAOR airport is the major contributor of SO2. The observed drastic decrease in SO2 implies a temporary air quality improvement. The reduction of SO2 over the power plants is due to the lockdown restrictions and is explained in detail by Shikwambana, et al. [35]. Similarly, the observed drop in the SO2 column density over FAOR was due to the global lockdowns, which restricted movements, thus limiting tourism for various professional and leisure activities. An increase in the SO2 column density was observed in 2021, see Figure 6c. The power plants had an increase in the SO2 column density of ~50%, while the airport emissions increased by ~62.5%. The increase in the airport’s emissions was due to the less prohibitive lockdown restrictions, which supported the operations of aircraft. However, only a few aircraft were operational in 2021, thus resulting in lesser emissions of SO2.
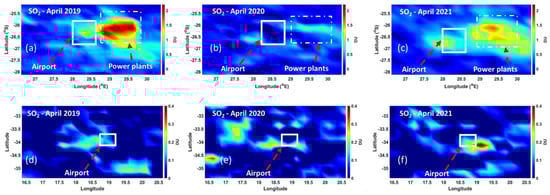
Figure 6.
SO2 tropospheric column and distribution for the month of April (a) before the Level-5 lockdown over OR Tambo International Airport (FAOR), (b) during the lockdown Level-5 over FAOR, and (c) after the Level-5 lockdown over FAOR; (d) before the Level-5 lockdown over Cape Town International Airport (FACT), (e) during the lockdown Level-5 over FACT, and (f) after the Level-5 lockdown over FACT.
Figure 6d–f generally shows that FACT has a lower SO2 column density compared to FAOR, attributed to its relatively small size and reciprocal fewer aircraft leaving and entering its airspace. Consequently, fewer SO2 emissions were observed, which imply a lesser atmospheric SO2 burden. Nonetheless, Figure 6d shows n SO2 column density of 0.3 DU, which reflects the normal operations of the airport. In 2020 (see Figure 6e), a reduction (~0.1 DU) was observed, attributing to the grounding of aircraft during the global lockdowns. An increase in the SO2 column density (~0.3 DU) was observed in 2021 (see Figure 6f) when the global travel restrictions were relaxed. This resulted in the operations of aircraft, which resulted in SO2 emissions.
4. Discussion
Emissions from airports, related to the aviation sector, are difficult to decouple; therefore, estimates using satellite measurements can be used. This is, in part, because the ground and low-altitude aviation-related emissions are quite small relative to the resolution of the data, and they are often embedded into the urban landscapes, where a myriad of emission sources, such as urban traffic, domestic biomass burning, and industries, exist. Fortunately, the advent of Sentinel-5p TROPOMI provides prospects for characterising emissions at a much finer scale than previously possible, i.e., 3 km. Moreover, COVID-19 lockdowns, imposed by different countries to combat the spread of COVID-19 and prevent deaths, have provided an experimental scenario (or testbed) that is far from normal, thus allowing prospects for decoupling sources of emissions, particularly aviation-related emissions. This study aimed to assess the changes in aviation-related emissions, i.e., NO2 and SO2, in response to lockdown regulations using Sentinel-5P, TROPOMI, and the Ozone Monitoring Instrument (OMI). Moreover, the linear trends and abrupt change-point analyses were performed on arriving and departing aircraft, to determine the direction and date of abrupt changes and their association with implemented lockdown regulations in the two busiest airports in South Africa, i.e., O.R. Tambo International airport (ICAO: FAOR) and Cape Town International airport (ICAO: FACT).
The results showed how the COVID-19 pandemic brought air transport to almost a complete halt, with obvious implications for the tourism and hospitality industries. Flights were suspended indefinitely to reduce the amount of movement, which was seen as a potential threat to spread the virus. However, the reduction in air transport indirectly led to a reduction in emissions from aircraft and the vehicles operating at the airports. We observed a decline in the amount of NO2 and SO2 emissions during the Level-5 strict lockdown regulations instigated on the 26th of March 2020 in South Africa. This finding is consistent with the linear trend analysis results, which showed that the local, regional, and international flights at both airports reduced significantly (p < 0.001) to ectopic levels (i.e., zero) at the beginning of 2020 and remained low afterwards. However, Pettitt’s test for a single change-point showed that the decline in the number of aircraft movements began even before March 2020, thus indicating not only international sentiment, particularly travel uncertainty, but also the effect of international lockdown restrictions that were affected before national lockdown in South Africa.
Therefore, international travel restrictions from Europe, China, and the USA affected both the number of arriving and departing aircraft to international airports. Naturally, such a decline in international and regional aircraft will also affect local aircraft movement due to limited connecting flights to other areas within the country; hence, the observed decline before the national lockdown was instigated. In 2020, relative to 2019, our results showed that the aviation-related (NO2 and SO2) emissions (hotspots) diminished in response to the instigated lockdown regulations. Consequently, this led to the improvement of air quality of the surrounding areas of the studied airports, notwithstanding the regrettable and devastating impact on an already weak economy and rising poverty levels. These key findings are crucial as they show the role that airports play in the status of the local air quality, thus associated health implications for the nearest populations. The emissions from aircraft at these airports may also influence the local climatic conditions. Although these results cannot be generalised to other airports globally, this case study elucidates the implications of lockdowns on emissions and related implications on local climate and health.
Furthermore, this study revealed the contribution of South African busy airports to air pollution, which is seldom reported by the relevant authorities. Coal-fired power stations and large processing industries have been the main targets when it comes to the monitoring of emissions. However, air transport, especially in urban cities, contribute significantly to the local emissions. The five-week strict lockdown was the perfect, unplanned experiment that allowed the decoupling of the other significant sources of emissions from the common urban, industrial, and traffic sources, as most activities were restricted. These results show that airports play an important role in the local air pollution contribution, as observed in previous studies [33, 34]. As shown by the results, the contrast in NO2 and SO2 emissions at FAOR and FACT airports between 2019 (i.e., representing a period of the norm) and 2020 (i.e., representing abrupt disruptions due to COVID-19 pandemic) was considerable, i.e., in the magnitudes of 50% to 100%. Therefore, appropriate steps need to be taken by relevant policy and decision-makers to monitor emissions around airports. With South Africa trying to grow its economy, it is anticipated that the number of flights arriving and leaving FAOR, FACT, and other major airports in the country might increase, thus increasing the amount of atmospheric emissions in the future.
After the strict Level-5 lockdown in South Africa, i.e., in 2021, fewer aircraft were arriving and leaving the airports as compared to 2018 and 2019, when COVID-19 was not present. This shows that most countries are still very cautious and only allow a limited number of aircraft to operate and carefully choose the destination countries, depending on newly detected COVID-19 variants and case numbers. However, locally, most domestic aircraft were operating in 2021, thus contributing to the rise in observed emissions over the airport and the surroundings. Therefore, in future studies, it would be interesting to expand the analysis to other airports around the world to discern the impact of COVID-19 on economic and tourism activities.
5. Conclusions
Although the strict lockdown restrictions were meant to reduce movement and lower the chances of COVID-19 transmission, the restriction indirectly also played a positive role in improving air quality. This study, which is on the emissions of pollutants over two major airports in South Africa, illustrates how the inactivity of airports resulted in the temporary reduction of the release of harmful constituents to the atmosphere. Aircraft and airport vehicles (buses and cars) at the FAOR and FACT were grounded for five weeks during the Level-5 lockdown instituted in South Africa, which resulted in a decrease in NO2 emissions by 70.45% and 64.58% over FAOR and FACT, respectively. The dynamics in emissions correspond to the aircraft movement trends, where significant change-points were detected between December 2019 to March 2020 for domestic, regional, and international flights, respectively, in response to both international and national lockdown restrictions. Consequently, significantly declining trends were observed (p < 0.001) at different airports. Overall, this study observed that the lockdown regulations had a positive impact on the air quality, causing a brief decline in emissions from aviation at the South African major airports. Based on the results in this study, we recommend monitoring and reporting of aviation-related emissions, as they were shown to be significant and potentially threaten surrounding populations and influence local climate. The study can be extended to other airports and expanded further to include the impact of these emissions on the local climate and human health.
Author Contributions
Conceptualisation, L.S. and M.K.; methodology, L.S. and M.K.; formal analysis, L.S. and M.K.; investigation, L.S. and M.K.; data curation, L.S. and M.K.; writing—original draft preparation, L.S. and M.K.; writing—review and editing, L.S. and M.K. All authors have read and agreed to the published version of the manuscript.
Funding
This research received no external funding. The APC was funded by the South African National Space Agency (SANSA).
Data Availability Statement
SO2 data was obtained from this link https://giovanni.gsfc.nasa.gov/giovanni/ (last accessed on 08 July 2021). NO2 data was accessed and processed through the Google Earth Engine platform; https://code.earthengine.google.com (last accessed on 20 July 2021).
Acknowledgments
We appreciate publicly available datasets on aircraft statistics provided by the Airport Company South Africa and the RSA Airspaces data provided by Air Traffic Navigation Services (ATNS, original source: South African Integrated Aeronautical Information Publication, IAIP). We also acknowledge the GES-DISC Interactive Online Visualization and Analysis Infrastructure (Giovanni) for providing the MERRA-2, OMI, and AIRS data. The authors gratefully acknowledge ESA for the Sentinel-5P/TROPOMI products. Lastly, we are grateful for the comments from the reviewers.
Conflicts of Interest
The authors declare no conflict of interest.
References
- Hasnain, A.; Hashmi, M.Z.; Bhatti, U.A.; Nadeem, B.; Wei, G.; Zha, Y.; Sheng, Y. Assessment of Air Pollution before, during and after the COVID-19 Pandemic Lockdown in Nanjing, China. Atmosphere 2021, 12, 743. [Google Scholar] [CrossRef]
- He, G.; Pan, Y.; Tanaka, T. The short-term impacts of COVID-19 lockdown on urban air pollution in China. Nat. Sustain. 2020, 3, 1005–1011. [Google Scholar] [CrossRef]
- Miyazaki, K.; Bowman, K.; Sekiya, T.; Jiang, Z.; Chen, X.; Eskes, H.; Ru, M.; Zhang, Y.; Shindell, D. Air quality response in China linked to the 2019 novel coronavirus (COVID-19) lockdown. Geophys. Res. Lett. 2020, 47, e2020GL089252. [Google Scholar] [CrossRef]
- Zhang, K.; de Leeuw, G.; Yang, Z.; Chen, X.; Jiao, J. The impacts of the COVID-19 lockdown on air quality in the guanzhong basin, China. Remote Sens. 2020, 12, 3042. [Google Scholar] [CrossRef]
- Zheng, B.; Geng, G.; Ciais, P.; Davis, S.J.; Martin, R.V.; Meng, J.; Wu, N.; Chevallier, F.; Broquet, G.; Boersma, F. Satellite-based estimates of decline and rebound in China’s CO2 emissions during COVID-19 pandemic. Sci. Adv. 2020, 6, eabd4998. [Google Scholar] [CrossRef]
- Menut, L.; Bessagnet, B.; Siour, G.; Mailler, S.; Pennel, R.; Cholakian, A. Impact of lockdown measures to combat Covid-19 on air quality over western Europe. Sci. Total Environ. 2020, 741, 140426. [Google Scholar] [CrossRef] [PubMed]
- Evangeliou, N.; Platt, S.M.; Eckhardt, S.; Lund Myhre, C.; Laj, P.; Alados-Arboledas, L.; Backman, J.; Brem, B.T.; Fiebig, M.; Flentje, H. Changes in black carbon emissions over Europe due to COVID-19 lockdowns. Atmos. Chem. Phys. 2021, 21, 2675–2692. [Google Scholar] [CrossRef]
- Skirienė, A.F.; Stasiškienė, Ž. COVID-19 and air pollution: Measuring pandemic impact to air quality in five European countries. Atmosphere 2021, 12, 290. [Google Scholar] [CrossRef]
- Brandao, R.; Foroutan, H. Air Quality in Southeast Brazil during COVID-19 Lockdown: A Combined Satellite and Ground-Based Data Analysis. Atmosphere 2021, 12, 583. [Google Scholar] [CrossRef]
- Nakada, L.Y.K.; Urban, R.C. COVID-19 pandemic: Impacts on the air quality during the partial lockdown in São Paulo state, Brazil. Sci. Total Environ. 2020, 730, 139087. [Google Scholar] [CrossRef] [PubMed]
- Kganyago, M.; Shikwambana, L. Did COVID-19 Lockdown Restrictions have an Impact on Biomass Burning Emissions in Sub-Saharan Africa? Aerosol Air Qual. Res. 2021, 21, 200470. [Google Scholar] [CrossRef]
- Shikwambana, L.; Kganyago, M.; Mhangara, P. Temporal Analysis of Changes in Anthropogenic Emissions and Urban Heat Islands during COVID-19 Restrictions in Gauteng Province, South Africa. Aerosol Air Qual. Res. 2021, 21, 200437. [Google Scholar] [CrossRef]
- Adams, A.M.; Prospero, J.M.; Zhang, C. CALIPSO-derived three-dimensional structure of aerosol over the Atlantic Basin and adjacent continents. J. Clim. 2012, 25, 6862–6879. [Google Scholar] [CrossRef]
- Vadrevu, K.; Lasko, K. Intercomparison of MODIS AQUA and VIIRS I-Band fires and emissions in an agricultural landscape—Implications for air pollution research. Remote Sens. 2018, 10, 978. [Google Scholar] [CrossRef] [PubMed] [Green Version]
- He, L.; Lin, A.; Chen, X.; Zhou, H.; Zhou, Z.; He, P. Assessment of MERRA-2 surface PM2.5 over the Yangtze River Basin: Ground-based verification, spatiotemporal distribution and meteorological dependence. Remote Sens. 2019, 11, 460. [Google Scholar] [CrossRef] [Green Version]
- van der Velde, I.R.; van der Werf, G.R.; Houweling, S.; Eskes, H.J.; Veefkind, J.P.; Borsdorff, T.; Aben, I. Biomass burning combustion efficiency observed from space using measurements of CO and NO2 by the TROPOspheric Monitoring Instrument (TROPOMI). Atmos. Chem. Phys. 2021, 21, 597–616. [Google Scholar] [CrossRef]
- Zheng, Z.; Yang, Z.; Wu, Z.; Marinello, F. Spatial Variation of NO2 and Its Impact Factors in China: An Application of Sentinel-5P Products. Remote Sens. 2019, 11, 1939. [Google Scholar] [CrossRef] [Green Version]
- Lorente, A.; Boersma, K.F.; Eskes, H.J.; Veefkind, J.P.; van Geffen, J.H.G.M.; de Zeeuw, M.B.; Denier van der Gon, H.A.C.; Beirle, S.; Krol, M.C. Quantification of nitrogen oxides emissions from build-up of pollution over Paris with TROPOMI. Sci. Rep. 2019, 9, 20033. [Google Scholar] [CrossRef]
- Lighty, J.S.; Veranth, J.M.; Sarofim, A.F. Combustion aerosols: Factors governing their size and composition and implications to human health. J. Air Waste Manag. Assoc. 2000, 50, 1565–1618. [Google Scholar] [CrossRef]
- FAA. Aviation & Emissions: A Primer; Federal Aviation Administration Office of Environment and Energy, 2005. Available online: https://www.faa.gov/regulations_policies/policy_guidance/envir_policy/media/aeprimer.pdf (accessed on 15 October 2021).
- Thanikasalam, K.; Rahmat, M.; Fahmi, A.M.; Zulkifli, A.; Shawal, N.N.; Ilanchelvi, K.; Ananth, M.; Elayarasan, R. Emissions of piston engine aircraft using aviation gasoline (avgas) and motor gasoline (mogas) as fuel—A review. Proc. IOP Conf. Ser. Mater. Sci. Eng. 2018, 370, 012012. [Google Scholar] [CrossRef]
- Bendtsen, K.M.; Bengtsen, E.; Saber, A.T.; Vogel, U. A review of health effects associated with exposure to jet engine emissions in and around airports. Environ. Health 2021, 20, 10. [Google Scholar] [CrossRef]
- Mhlanga, O. Customer experiences and return patronage in restaurants at OR Tambo International Airport in Johannesburg, South Africa. Afr. J. Hosp. Tour. Leis. 2018, 18, 1–11. [Google Scholar]
- Theys, N.; Hedelt, P.; De Smedt, I.; Lerot, C.; Yu, H.; Vlietinck, J.; Pedergnana, M.; Arellano, S.; Galle, B.; Fernandez, D. Global monitoring of volcanic SO2 degassing with unprecedented resolution from TROPOMI onboard Sentinel-5 Precursor. Sci. Rep. 2019, 9, 2643. [Google Scholar] [CrossRef]
- Tilstra, L.G.; de Graaf, M.; Wang, P.; Stammes, P. In-orbit Earth reflectance validation of TROPOMI on board the Sentinel-5 Precursor satellite. Atmos. Meas. Tech. 2020, 13, 4479–4497. [Google Scholar] [CrossRef]
- Verhoelst, T.; Compernolle, S.; Pinardi, G.; Lambert, J.-C.; Eskes, H.J.; Eichmann, K.-U.; Fjæraa, A.M.; Granville, J.; Niemeijer, S.; Cede, A. Ground-based validation of the Copernicus Sentinel-5p TROPOMI NO2 measurements with the NDACC ZSL-DOAS, MAX-DOAS and Pandonia global networks. Atmos. Meas. Tech. 2021, 14, 481–510. [Google Scholar] [CrossRef]
- Levelt, P.F.; Van Den Oord, G.H.; Dobber, M.R.; Malkki, A.; Visser, H.; De Vries, J.; Stammes, P.; Lundell, J.O.; Saari, H. The ozone monitoring instrument. IEEE Trans. Geosci. Remote Sens. 2006, 44, 1093–1101. [Google Scholar] [CrossRef]
- Hess, A.; Iyer, H.; Malm, W. Linear trend analysis: A comparison of methods. Atmos. Environ. 2001, 35, 5211–5222. [Google Scholar] [CrossRef]
- Pettitt, A.N. A non-parametric approach to the change-point problem. J. R. Stat. Soc. Ser. C (Appl. Stat.) 1979, 28, 126–135. [Google Scholar] [CrossRef]
- Verstraeten, G.; Poesen, J.; Demarée, G.; Salles, C. Long-term (105 years) variability in rain erosivity as derived from 10-min rainfall depth data for Ukkel (Brussels, Belgium): Implications for assessing soil erosion rates. J. Geophys. Res. Atmos. 2006, 111. [Google Scholar] [CrossRef]
- Pohlert, T. Trend: Non-Parametric Trend Tests and Change-Point Detection, R package version 1.1.4; 2020. Available online: https://cran.r-project.org/web/packages/trend/vignettes/trend.pdf (accessed on 15 October 2021).
- Masiol, M.; Harrison, R.M. Aircraft engine exhaust emissions and other airport-related contributions to ambient air pollution: A review. Atmos. Environ. 2014, 95, 409–455. [Google Scholar] [CrossRef] [PubMed] [Green Version]
- Prather, M.; Sausen, R.; Grossman, A.S.; Haywood, J.M.; Rind, D.; Subbaraya, B.H. Potential Climate Change from Aviation. In Aviation and the Global Atmosphere: A Special Report of the Intergovernmental Panel on Climate Change 185; Cambridge University Press: Cambridge, UK, 1999. [Google Scholar]
- Lee, D.S.; Fahey, D.W.; Forster, P.M.; Newton, P.J.; Wit, R.C.; Lim, L.L.; Owen, B.; Sausen, R. Aviation and global climate change in the 21st century. Atmos. Environ. 2009, 43, 3520–3537. [Google Scholar] [CrossRef] [Green Version]
- Shikwambana, L.; Ncipha, X.; Sangeetha, S.K.; Sivakumar, V.; Mhangara, P. Qualitative Study on the Observations of Emissions, Transport and the Influence of Climatic Factors from Sugarcane Burning: A South African Perspective. Int. J. Environ. Res. Public Health 2021, 18, 7672. [Google Scholar] [CrossRef]


Publisher’s Note: MDPI stays neutral with regard to jurisdictional claims in published maps and institutional affiliations. |
© 2021 by the authors. Licensee MDPI, Basel, Switzerland. This article is an open access article distributed under the terms and conditions of the Creative Commons Attribution (CC BY) license (https://creativecommons.org/licenses/by/4.0/).