
Integrated High-Definition Visualization of Digital Archives for Borobudur Temple

 ,
,
Abstract
:
1. Introduction
2. Related Work
2.1. Digitization of Extant Cultural Heritage
2.2. Reconstruction of Destroyed/Inaccessible Cultural Heritage
2.3. Transparent Visualization
3. Methods
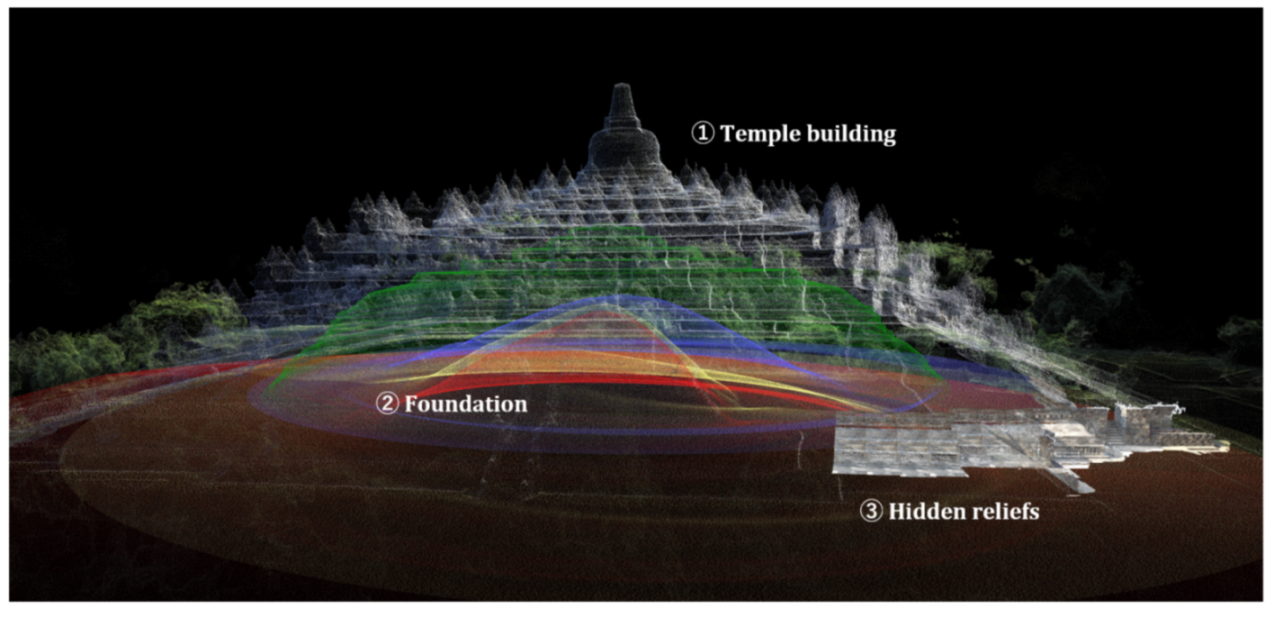
3.1. Overview
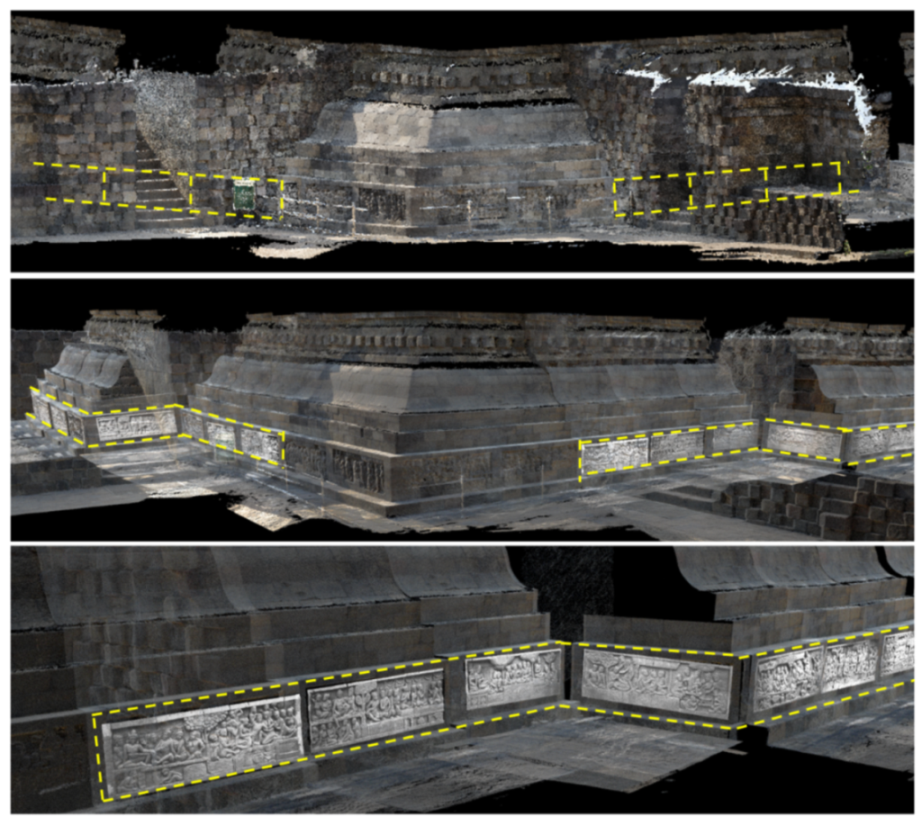
3.2. Digitizing the Extant Temple Building from Photogrammetric Data
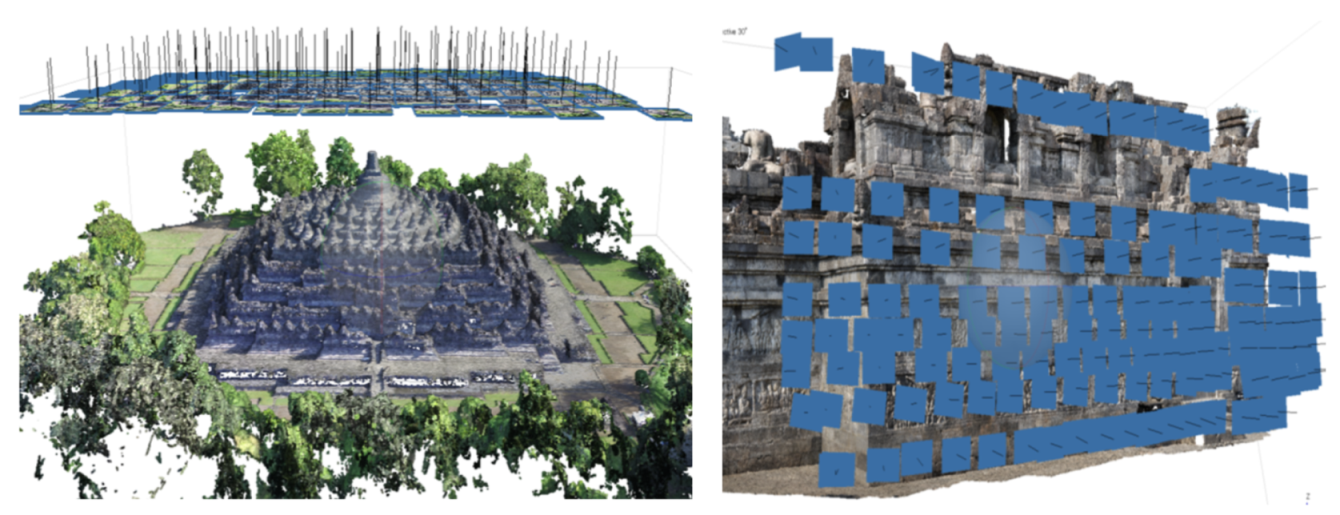
- Remote scanning: Remote scanning of the temple is performed with a UAV in the sky over the temple building. Sixty shots with a resolution of 4000 × 3000 pixels were taken by the UAV carrying a digital camera (DJI FC300S). The vertical distance from the camera to the highest point of the temple is about 20 m and the overlap of each photo is about 60%.
- Close-range scanning: The close-range scanning is performed on the narrow corridor of the temple. To capture the high place of the temple wall of each platform, a monopod is used to support the camera. The photos with a resolution of 6000 × 4000 pixels are captured by a digital camera (RICOH GR III). The distance from the camera to the temple building is about 2 m and the overlap of each photo is about 60%.
3.3. Digitizing the Inaccessible Foundation from CAD Drawings
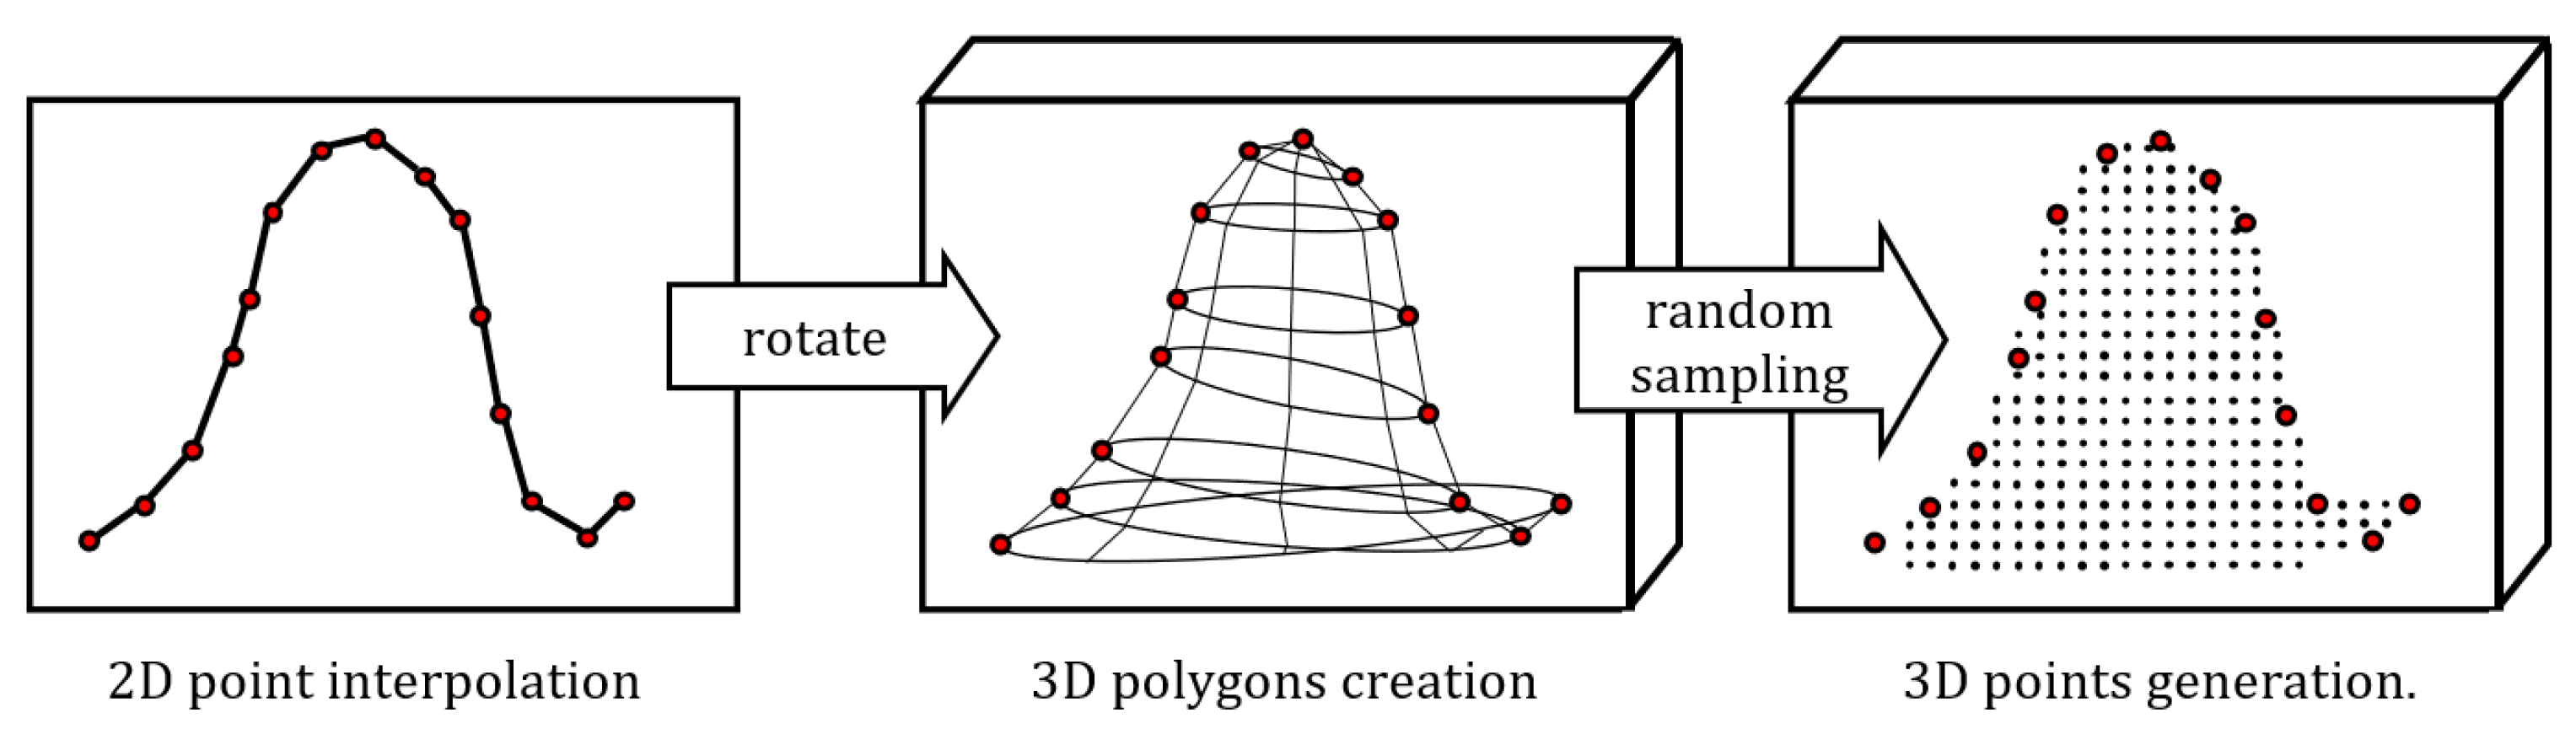
- STEP 1: The first step of the proposed method is point generation and interpolation from the CAD drawing. The CAD drawing presents the shape of the vertical cross-section as vertex points with 2D coordinates. The point with the largest value on the y-axis is defined as a reference point that splits the points into two groups, that is, the left side and the right side. Then, we use cubic Hermite interpolation on the points to make the two sides have equal points. In our work, the number of interpolated points is 1000 per side. Figure 7 shows the point interpolation results of layer A.
- STEP 2: The second step is to rotate the results in Step 1 and create 3D polygons which present the shape of each layer. First, the points from the left side and right side are matched one by one. As Figure 8 shows, for point from the left side, there is a corresponding point on the right side. Then we rotate each point to its corresponding point and select sampling points from the transition zone. By connecting all the sampling points, the 3D polygon mesh which presents the shape of the foundation can be created.
- STEP 3: The final step is to generate 3D points from the 3D polygon data of Step 2. Generating points directly from 3D polygon data will lead to a huge calculation cost, thus it is necessary to split the 3D polygon into an amount of 2D triangles. For a polygon with n vertex points, by connecting each vertex point to any two other points, sub-triangles are created. Then sampling points can be randomly generated from each triangle based on the coordinates of its three vertex points. The number of the points generated from each triangle is fixed to make the output points have a uniform distribution.
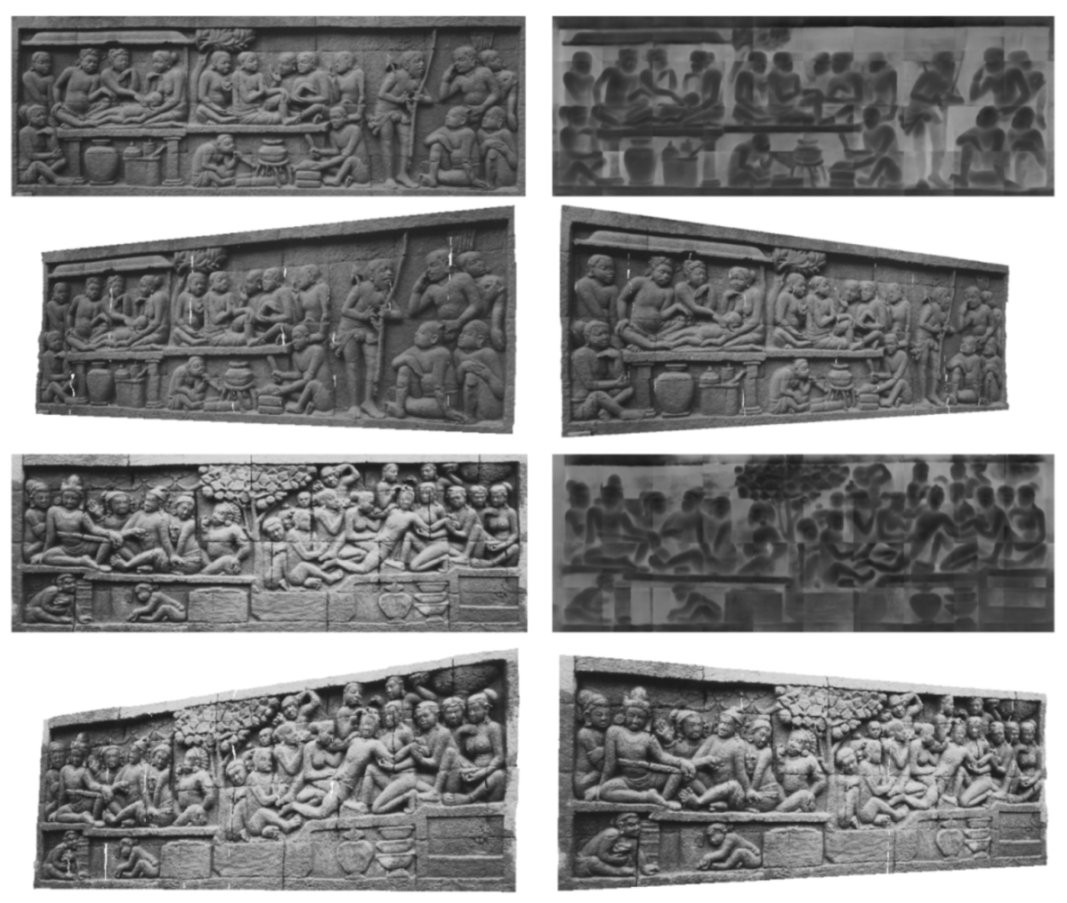
3.4. Digitizing the Hidden Reliefs from Single Monocular Photo
3.5. Transparent Visualization
- Step 1: Create multiple subgroups of points by randomly dividing the original point dataset. Each subgroup should have the same point density and be statistically independent. Below, the number of subgroups is denoted as L, which is usually set to a few hundred.
- Step 2: For each point subgroup in Step 1, execute the standard point-based rendering by projecting its constituent 3D points onto the image plane, which creates an intermediate image. In the projection process, the point occlusion is considered per pixel. A total of L intermediate images are obtained.
- Step 3: Create an average image of the L intermediate images created in Step 2. This average image becomes the final transparent image, in which the measurement noise is automatically eliminated per pixel based on the statistical effect [17].
4. Experimental Results
4.1. Digitization Results
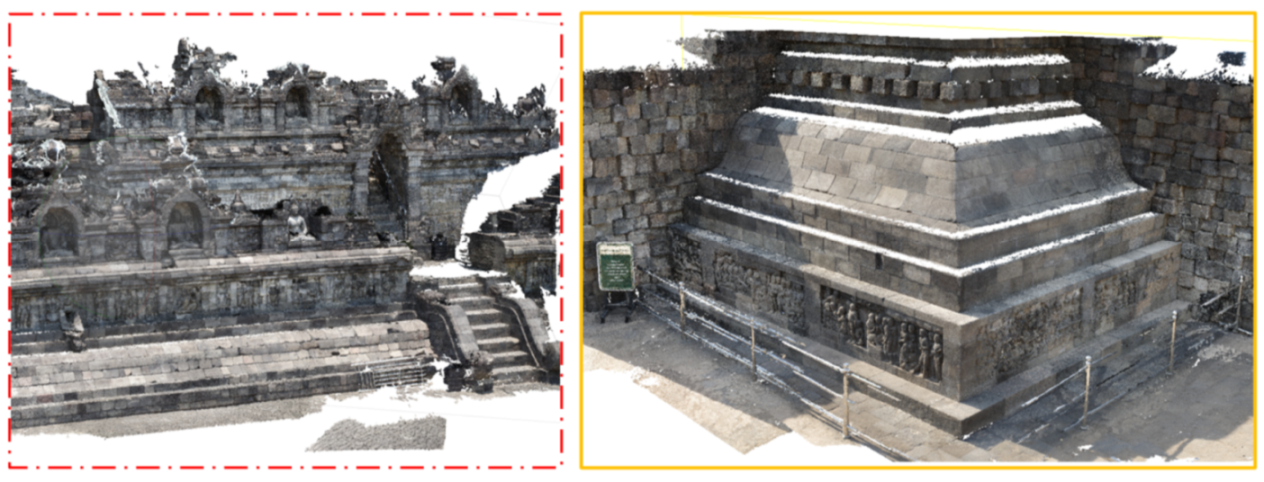
4.1.1. Extant Temple Building
4.1.2. Inaccessible Foundation
4.1.3. The Hidden Reliefs
4.2. Integrated Visualization
4.3. Implementation Details
5. Conclusions and Discussion
Author Contributions
Funding
Institutional Review Board Statement
Informed Consent Statement
Data Availability Statement
Acknowledgments
Conflicts of Interest
References
- Bachi, V.; Fresa, A.; Pierotti, C.; Prandoni, C. The Digitization Age: Mass Culture Is Quality Culture. Challenges for Cultural Heritage and Society; Springer: Berlin/Heidelberg, Germany, 2014; pp. 786–801. [Google Scholar] [CrossRef]
- Pavlidis, G.; Koutsoudis, A.; Arnaoutoglou, F.; Tsioukas, V.; Chamzas, C. Methods for 3D digitization of Cultural Heritage. J. Cult. Herit. 2007, 8, 93–98. [Google Scholar] [CrossRef] [Green Version]
- Bitelli, G.; Balletti, C.; Brumana, R.; Barazzetti, L.; D’Urso, M.G.; Rinaudo, F.; Tucci, G. The gamher research project for metric documentation of cultural heritage: Current developments. ISPRS Ann. Photogramm. Remote Sens. Spat. Inf. Sci. 2019, 42, 239–246. [Google Scholar] [CrossRef] [Green Version]
- Adane, A.; Chekole, A.; Gedamu, G. Cultural Heritage Digitization: Challenges and Opportunities. Int. J. Comput. Appl. 2019, 178, 1–5. [Google Scholar] [CrossRef]
- Long, J.; Shelhamer, E.; Darrell, T. Research Challenges for Digital Archives of 3D Cultural Heritage Models. J. Comput. Cult. Herit. 2010, 2, 1–17. [Google Scholar]
- Yastikli, N. Documentation of cultural heritage using digital photogrammetry and laser scanning. J. Cult. Herit. 2007, 8, 423–427. [Google Scholar] [CrossRef]
- Nuttens, T.; De Maeyer, P.; De Wulf, A.; Goossens, R.; Stal, C. Terrestrial Laser Scanning and Digital Photogrammetry for Cultural Heritage: An Accuracy Assessment. In Proceedings of the 4th International Workshop on 3D Geo-Information, Marrakesh, Morocco, 18–22 May 2011; pp. 18–22. [Google Scholar]
- Dhonju, H.K.; Xiao, W.; Sarhosis, V.; Mills, J.P.; Wilkinson, S.; Wang, Z.; Thapa, L.; Panday, U.S. Feasibility study of low-cost image-based heritage documentation in Nepal. ISPRS Arch. 2017, 42, 237–242. [Google Scholar] [CrossRef] [Green Version]
- Remondino, F. Heritage Recording and 3D Modeling with Photogrammetry and 3D Scanning. Remote Sens. 2011, 3, 1104–1138. [Google Scholar] [CrossRef] [Green Version]
- Lerma, J.L.; Cabrelles, M.; Navarro, S.; Fabado, S. From Digital Photography to Photogrammetry for Cultural Heritage Documentation and Dissemination. Disegnarecon 2013, 6, 1–8. [Google Scholar] [CrossRef]
- Girelli, V.A.; Tini, M.A.; D’Apuzzo, M.G.; Bitelli, G. 3D digitisation in cultural heritage knowledge and preservation: The case of the neptune statue in bologna and its archetype. ISPRS Arch. 2020, 43, 1403–1408. [Google Scholar] [CrossRef]
- Alidoost, F.; Arefi, H. Comparison of uas-based photogrammetry software for 3D point cloud generation: A survey over A historical site. ISPRS Ann. Photogramm. Remote Sens. Spat. Inf. Sci. 2017, 4, 55–61. [Google Scholar] [CrossRef] [Green Version]
- Kersten, T.P.; Lindstaedt, M. Automatic 3D Object Reconstruction from Multiple Images for Architectural, Cultural Heritage and Archaeological Applications Using Open-Source Software and Web Services Automatische 3D-Objektrekonstruktion aus digitalen Bilddaten für Anwendungen in Archit. Photogramm. Fernerkund. Geoinf. 2013, 2012, 727–740. [Google Scholar] [CrossRef]
- Kyriakaki, G.; Doulamis, A.; Doulamis, N.; Ioannides, M.; Makantasis, K.; Protopapadakis, E.; Hadjiprocopis, A.; Wenzel, K.; Fritsch, D.; Klein, M.; et al. 4D Reconstruction of Tangible Cultural Heritage Objects from Web-Retrieved Images. Int. J. Herit. 2014, 3, 431–451. [Google Scholar] [CrossRef]
- Grün, A.; Remondino, F.; Zhang, L.I. Photogrammetric reconstruction of the great buddha of Bamiyan, Afghanistan. Photogramm. Rec. 2004, 19, 177–199. [Google Scholar] [CrossRef]
- Tanaka, S.; Hasegawa, K.; Okamoto, N.; Umegaki, R.; Wang, S.; Uemura, M.; Okamoto, A.; Koyamada, K. See-through Imaging of Laser-scanned 3D Cultural Heritage Objects based on Stochastic Rendering of Large-scale Point Clouds. ISPRS Ann. Photogramm. Remote Sens. Spat. Inf. Sci. 2016, III-5, 73–80. [Google Scholar] [CrossRef] [Green Version]
- Uchida, T.; Hasegawa, K.; Li, L.; Adachi, M.; Yamaguchi, H.; Thufail, F.I.; Riyanto, S.; Okamoto, A.; Tanaka, S. Noise-robust transparent visualization of large-scale point clouds acquired by laser scanning. ISPRS J. Photogramm. Remote Sens. 2020, 161, 124–134. [Google Scholar] [CrossRef]
- Tokyo National Museum. Borobudur dan Seni Purbakala Indonesia; Tokyo National Museum: Tokyo, Japan, 1980. [Google Scholar]
- Balai Konservasi Borobudur. Pada Relief Pada Relief Karmawibhangga. Balai Konservasi Borobudur. 2012. Available online: http://borobudurpedia.id/book/adegan-dan-ajaran-hukum-karma-pada-relief-karmawibangga/ (accessed on 5 December 2021).
- Miksic, J.; Tranchini Marcello, T.A. Borobudur: Golden Tales of the Buddhas; Tuttle Publishing: Clarendon, VT, USA, 2012. [Google Scholar]
- Pan, J.; Li, L.; Yamaguchi, H.; Hasegawa, K.; Thufail, F.I.; Bramantara, K.; Tanaka, S. 3D Transparent Visualization of Relief-Type Cultural Heritage Assets Based on Depth Reconstruction of Old Monocular Photos; Springer: Singapore, 2019; Volume 1, pp. 187–198. [Google Scholar] [CrossRef]
- Pan, J.; Li, L.; Yamaguchi, H.; Hasegawa, K.; Thufail, F.I.; Brahmantara, K.; Tanaka, S. Fused 3D Transparent Visualization for Large-Scale Cultural Heritage Using Deep Learning-Based Monocular Reconstruction. ISPRS Ann. Photogramm. Remote Sens. Spat. Inf. Sci. 2020, 5, 989–996. [Google Scholar] [CrossRef]
- Tallon, A. Divining Proportions in the Information Age. Archit. Hist. 2014, 2, 15. [Google Scholar] [CrossRef] [Green Version]
- Aicardi, I.; Chiabrando, F.; Maria Lingua, A.; Noardo, F. Recent trends in cultural heritage 3D survey: The photogrammetric computer vision approach. J. Cult. Herit. 2018, 32, 257–266. [Google Scholar] [CrossRef]
- Alshawabkeh, Y.; El-Khalili, M.; Almasri, E.; Bala’awi, F.; Al-Massarweh, A. Heritage documentation using laser scanner and photogrammetry. The case study of Qasr Al-Abidit, Jordan. Digit. Appl. Archaeol. Cult. Herit. 2020, 16. [Google Scholar] [CrossRef]
- Themistocleous, K. Model reconstruction for 3d vizualization of cultural heritage sites using open data from social media: The case study of Soli, Cyprus. J. Archaeol. Sci. 2017, 14, 774–781. [Google Scholar] [CrossRef]
- Condorelli, F.; Rinaudo, F. Cultural heritage reconstruction from historical photographs and videos. ISPRS Arch. 2018, 42, 259–265. [Google Scholar] [CrossRef] [Green Version]
- Brůha, L.; Laštovička, J.; Palatý, T.; Štefanová, E.; Štych, P. Reconstruction of lost cultural heritage sites and landscapes: Context of ancient objects in time and space. ISPRS Int. J. Geo Inf. 2020, 9, 604. [Google Scholar] [CrossRef]
- Li, L.; Choi, W.; Hachimura, K.; Yano, K.; Nishiura, T.; Tanaka, H.T. [Paper] Virtual Yamahoko Parade Experience System with Vibration Simulation. ITE Trans. Media Technol. Appl. 2014, 2, 248–255. [Google Scholar] [CrossRef] [Green Version]
- Külür, S.; Şahin, H. 3D Cultural heritage documentation using data from different sources. Int. Arch. Photogramm. Remote Sens. Spat. Inf. Sci. 2008, XXXVII, 353–356. [Google Scholar]
- Hermoza, R.; Sipiran, I. 3D reconstruction of incomplete archaeological objects using a generative adversarial network. ACM Int. Conf. Proceeding Ser. 2018, 2018, 5–11. [Google Scholar]
- Belhi, A.; Al-Ali, A.K.; Bouras, A.; Foufou, S.; Yu, X.; Zhang, H. Investigating low-delay deep learning-based cultural image reconstruction. J. Real-Time Image Process. 2020, 17, 1911–1926. [Google Scholar] [CrossRef]
- Gross, M.; Pfister, H. Point-Based Graphics (The Morgan Kaufmann Series in Computer Graphics); Morgan Kaufmann Publishers: Burlington, MA, USA, 2007; p. 552. [Google Scholar]
- Kersten, T.P.; Keller, F.; Saenger, J.; Schiewe, J. Automated Generation of an Historic 4D City Model of Hamburg and Its Visualisation with the GE Engine; Springer: Berlin/Heidelberg, Germany, 2012; pp. 55–65. [Google Scholar] [CrossRef]
- Dylla, K.; Frischer, B.; Mueller, P.; Ulmer, A.; Haegler, S. Rome Reborn 2.0: A Case Study of Virtual City Reconstruction Using Procedural Modeling Techniques. Comput. Graph. World 2008, 16, 62–66. [Google Scholar]
- Zwicker, M.; Pfister, H.; Van Baar, J.; Gross, M. EWA splatting. IEEE Trans. Vis. Comput. Graph. 2002, 8, 223–238. [Google Scholar] [CrossRef]
- Seemann, P.; Palma, G.; Dellepiane, M.; Cignoni, P.; Goesele, M. Soft Transparency for Point Cloud Rendering. EGSR 2018. [Google Scholar] [CrossRef]
- Zhang, Y.; Pajarola, R. Deferred blending: Image composition for single-pass point rendering. Comput. Graph. 2007, 31, 175–189. [Google Scholar] [CrossRef]
- Lee, J.H.; Han, M.K.; Ko, D.W.; Suh, I.H. From big to small: Multi-scale local planar guidance for monocular depth estimation. arXiv 2019, arXiv:1907.10326. [Google Scholar]
- Huang, G.; Liu, Z.; Van Der Maaten, L.; Weinberger, K.Q. Densely connected convolutional networks. In Proceedings of the 30th IEEE Conference on Computer Vision and Pattern Recognition, CVPR 2017, Honolulu, HI, USA, 21–26 July 2017; pp. 2261–2269. [Google Scholar]
- Yang, M.; Yu, K.; Zhang, C.; Li, Z.; Yang, K. DenseASPP for Semantic Segmentation in Street Scenes. In Proceedings of the IEEE Conference on Computer Vision and Pattern Recognition, Salt Lake City, UT, USA, 18–23 June 2018. [Google Scholar] [CrossRef]
- Alhashim, I.; Wonka, P. High Quality Monocular Depth Estimation via Transfer Learning. arXiv 2018, arXiv:1812.11941. [Google Scholar]
- Paszke, A.; Gross, S.; Massa, F.; Lerer, A.; Bradbury, J.; Chanan, G.; Killeen, T.; Lin, Z.; Gimelshein, N.; Antiga, L.; et al. PyTorch: An imperative style, high-performance deep learning library. arXiv 2019, arXiv:1912.01703. [Google Scholar]
- Kingma, D.P.; Ba, J. Adam: A method for stochastic optimization. In Proceedings of the 3rd International Conference on Learning Representations, San Diego, CA, USA, 7–9 May 2015; pp. 1–15. [Google Scholar]


| Index | Color | Number of Points | Symmetry |
|---|---|---|---|
| D | green | 716,043 | Symmetry |
| A | blue | 661,552 | Asymmetry |
| B | yellow | 1,266,911 | Asymmetry |
| C | red | 1,823,015 | Asymmetry |
| Higher Is Better | Lower Is Better | ||||||
|---|---|---|---|---|---|---|---|
| RMSE | RMSE_log | abs_rel | sq_rel | ||||
| CNN [21] | 0.306376 | 0.597804 | 0.777289 | 10.28911 | 0.780762 | 3.067239 | 2.000889 |
| ResNet-50 [22] | 0.34431 | 0.607586 | 0.778217 | 10.17354 | 0.589355 | 3.029139 | 1.770056 |
| DenseDepth [42] | 0.377522 | 0.641598 | 0.790830 | 9.995814 | 0.633301 | 3.872130 | 2.193610 |
| Ours [39] | 0.440557 | 0.76995 | 0.920572 | 9.840669 | 0.455078 | 4.07383 | 2.127823 |
Publisher’s Note: MDPI stays neutral with regard to jurisdictional claims in published maps and institutional affiliations. |
© 2021 by the authors. Licensee MDPI, Basel, Switzerland. This article is an open access article distributed under the terms and conditions of the Creative Commons Attribution (CC BY) license (https://creativecommons.org/licenses/by/4.0/).
Share and Cite
Pan, J.; Li, L.; Yamaguchi, H.; Hasegawa, K.; Thufail, F.I.; Brahmantara; Tanaka, S. Integrated High-Definition Visualization of Digital Archives for Borobudur Temple. Remote Sens. 2021, 13, 5024. https://doi.org/10.3390/rs13245024
Pan J, Li L, Yamaguchi H, Hasegawa K, Thufail FI, Brahmantara, Tanaka S. Integrated High-Definition Visualization of Digital Archives for Borobudur Temple. Remote Sensing. 2021; 13(24):5024. https://doi.org/10.3390/rs13245024
Chicago/Turabian StylePan, Jiao, Liang Li, Hiroshi Yamaguchi, Kyoko Hasegawa, Fadjar I. Thufail, Brahmantara, and Satoshi Tanaka. 2021. "Integrated High-Definition Visualization of Digital Archives for Borobudur Temple" Remote Sensing 13, no. 24: 5024. https://doi.org/10.3390/rs13245024