Abstract
Urban agglomerations are currently facing regional thermal environment deterioration. However, the relationship between thermal environment changes in urban agglomerations in response to urban expansion and the underlying urban morphology-driven mechanisms is not clear. This study utilized data from the three largest urban agglomerations in China for 2000, 2010, and 2020 to explore the response of regional heat island changes to urban morphological variations induced by urban expansion through the quantification of urban landscape form, correlation analysis, and relative importance analysis. The results indicate that the distribution of heat source and built-up areas in urban agglomerations has clear spatial and temporal consistency. Moreover, a high regional heat island intensity (RHII) cluster was shown in a “strip-like” form in Beijing–Tianjin–Hebei and the Yangtze River Delta, while the Pearl River Delta, with the most rapid expansion and contiguity of heat source areas, showed a “ring-like” form. RHII was positively correlated with the area of urban clusters and the proportion of built-up areas. However, configuration metrics, such as patch aggregation, also positively affected RHII. Thus, different landscape structures with the same impervious surface area percentage resulted in different RHII values. The relative importance of urban form metrics varied in different urbanization stages; the impervious layer rate was dominant for low and high urban intensity levels, while the shape complexity of urban patches primarily mitigated the thermal environment at the medium urban development level. These results revealed the response relationship between the regional thermal environment and urban morphology, providing insights into how we can improve the regional thermal environment through targeted strategies for optimizing urban form patterns for areas at different urbanization stages.
1. Introduction
Rapid urbanization has resulted in improved economic benefits and living conditions for human beings. Man-made transformations and interference with nature due to this process have brought about a series of ecological and environmental problems [1,2,3]. The continuous urban area expands by swallowing the natural land cover. By 2030, the urban land area will increase to 1,200,000 square kilometers globally, almost three times that in 2000, with half of the expansion concentrated in Asia [4]. The rapid increase in impervious surface area has changed surface radiation and thermal and moisture characteristics, which has led to the emergence of urban thermal environment problems [5,6]. A typical manifestation of this environmental problem is the urban heat island effect, which reflects the phenomenon that the temperature in cities is significantly higher than that in the surrounding rural areas [7].
Persistently high temperatures can cause morbidity and mortality [8,9,10]. Moreover, the deteriorating thermal environment further increases the power demand for refrigeration and air conditioning, which leads to an increase in greenhouse gas emissions and forms a vicious cycle [11,12]. Therefore, the analysis of spatiotemporal characteristics and influencing factors of the urban thermal environment has become a research hotspot [13].
Urban agglomeration, an urban structure with close spatial organization and economic connections formed by individual cities, has become the main source of urbanization in China [14,15,16]. In recent years, scholars have studied and analyzed the regional thermal environment of urban agglomerations [17,18,19,20], which is commonly characterized as a regional heat island (RHI) [21]. Owing to the reduction in the distance between individual cities, urban expansion has significantly changed the regional thermal environment, and the mechanism is more complicated. However, compared to studies on single cities, little is known about the mechanism of RHI under the rapid expansion of urban agglomerations [22].
The urban heat island (UHI) effect studies are divided into two categories: surface UHI observed by satellite and near-surface UHI observed by measuring air temperature [23]. Considering that satellite sensors can accurately obtain land surface temperature data and detect the spatiotemporal changes of surface UHI on a large scale, it gradually became the main technical means to study the UHI effect [22]. Based on the data provided by land surface temperature products derived from various satellite inversions [20], scholars have analyzed the driving factors of the urban heat island (UHI) and concluded that the impervious layer is highly correlated with the urban heat island effect [24,25]. The variation in urban forms caused by rapid urban expansion has significantly changed the urban thermal environment. The relationship between the UHI effect and the overall structure of the city and some major elements and aspects, such as city size, development type (i.e., compact, dispersed, etc.), degree of clustering, and landscape connectivity, has been further explored at the macro level in terms of the pattern of urban expansion [13,26,27,28,29]. The results showed a positive correlation between the city size and heat island intensity [26]. The scientifically designed urban form plays a significant role in regulating the urban microclimate and reducing the capita negative environmental impact [30,31]. By analyzing the UHI effect in 5000 large cities in Europe, Zhou et al. (2017) found that a small and disperse urban structure aids in alleviating the UHI effect [32]. However, in 166 cities in China, land surface temperature was found to be negatively correlated with urban compactness and boundary complexity, and positively correlated with urban proximity [33]. The majority of existing conclusions are based on a single urban scale. However, with the continuous development of cities, the heat island boundaries within urban agglomerations are becoming increasingly blurred, and the thermal environment is not solely based on administrative boundaries. Therefore, it is necessary to analyze the response relationship between the overall morphological evolution of built-up areas and the thermal environment on the scale of urban clusters. The impact of landscape composition and configuration metrics on the urban thermal environment have been analyzed from the perspective of landscape patterns [34,35]. Most studies have focused on urban landscape elements such as built-up areas, which describe the shape, density, connectivity, and complexity of specific patch types on a smaller spatial scale to investigate their relationship with the thermal environment [36]. However, the patterns and driving factors of RHI remain poorly understood, particularly for different regions and intervals of urban intensity [37].
Over the past two decades, Beijing–Tianjin–Hebei (BTH), Yangtze River Delta (YRD), and Pearl River Delta (PRD), the most concentrated regions of urban expansion in China, have simultaneously faced serious thermal environmental problems [38]. This study used the above urban agglomerations as a case study to (1) investigate the temporal and spatial responses of urban expansion to the thermal environment in 2000, 2010, and 2020 for each urban agglomeration; (2) explore the potential driving mechanism of detailed urban form factors through an ordinary least squares (OLS) regression model and correlation analysis and (3) analyze the consistency between heat source evolution patterns and overall urban form indicators based on the above research conclusions. The years 2000, 2010, and 2020 were selected as the study nodes because the Chinese government often conducts urban construction and planning on a ten- or five-year cycle; thus, a ten-year time interval can effectively illustrate the relationship between urban expansion and the thermal environment response. Furthermore, the relative significance of forcing factors in different urban development stages was identified based on three typical urbanization intensities (low, medium, and high). Understanding the mechanisms of the urban form influence on RHI in different urban development stages will not only guide relevant urban planning but also provide a reference for ecological sustainability in other urban agglomerations worldwide.
2. Data and Methods
2.1. Study Areas
This study focused on the three most economically developed and densely populated urban agglomerations in China, Beijing–Tianjin–Hebei (BTH), Yangtze River Delta (YRD), and Pearl River Delta (PRD), which are typical urban agglomerations with thermal environment problems (Dan et al., 2022). The BTH region has a land area of approximately 218,000 km2 and is mainly located on the North China Plain (115°25″–119°19″E, 38°42″–41°03″N). The YRD and PRD, with land cover areas of approximately 211,700 km2 and 56,500 km2, are situated in the Yangtze (115°46″–123°25″E, 29°20″–32°34″N) and Pearl (112°97″–114°95″E, 21°62″–23°79″N) River Deltas, respectively. The locations of BTH, YRD, and PRD are shown in Figure 1. In 2020, the three urban agglomerations contributed 29.6% and 42.8% of China’s total population and gross domestic product, respectively (Table 1).
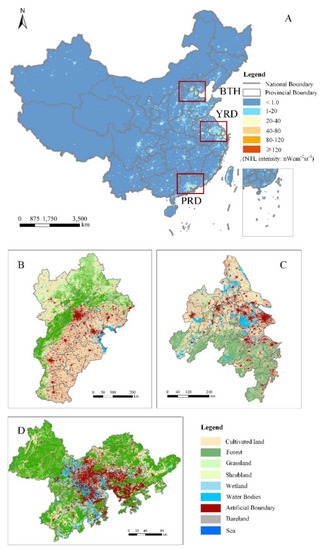
Figure 1.
Locations and land cover distribution of the three urban agglomerations ((B): Yangtze River Delta [YRD], (C): Beijing–Tianjin–Hebei [BTH], (D): Pearl River Delta [PRD]) in China and a nighttime light (NTL) image of China in 2020. (A): NTL image of China in 2020. (B–D): Locations of YRD, BTH, and PRD. Note: Considering that Zhoushan City is composed of many small islands and is adjacent to the sea, the connection between the regional thermal environment is weak; therefore, it was excluded from the study area of the YRD urban agglomeration.

Table 1.
Comparison of the socioeconomic statuses of the three most popular urban agglomerations in 2000 and 2020.
2.2. Data
In this study, 8-day land surface temperature (LST) products were obtained from moderate-resolution imaging spectroradiometer (MODIS) data, MYD11A2, with fine spatiotemporal resolution and data accuracy, which are the most widely used remote sensing data in the study of the thermal environment [39]. The LST data were retrieved using a generalized split-window algorithm [40] at 13:30 and 01:30 local solar time, which is in good agreement with ground satellite observations at an error of <1 K and root mean square <0.5 K in most cases [41]. Pixels contaminated by clouds were removed in advance on the Google Earth Engine (GEE) platform according to the LST quality control mark and LST quality control flags (“average LST error > 2 K”). June, July, and August daytime data from 2000, 2010, and 2020 were examined for BTH, YRD, and PRD, and then the average temperature was calculated as the representation of the diurnal summer LST for each year.
Land-use and land-cover data were derived from the 30 m resolution Global LC dataset (Globeland30) provided by the National Geomatics Center of China, 2000/2010/2020, which has the highest spatial resolution and accuracy compared to those of other global land cover raster data [42]. The GlobeLand30 data include a total of 10 first-level types, with codes 60 and 80 for water bodies and artificial surfaces, respectively (Jun et al., 2014).
Nighttime light (NTL) data were obtained from the extended time series (2000–2018) of annual NTL images produced by Chen et al. [43]. This dataset, which presented good accuracy and temporal consistency, was generated using a modified autoencoder model and a cross-sensor calibration model with two datasets: DMSP/OLS data (2000–2012) and composited monthly NPP/VIIRS data (2013–2018). The data, with a spatial resolution of 15 arcseconds (approximately 500 m near the equator) and using the unit of nW·cm−2·sr−1, include stable night light from urban areas and towns [43].
A digital elevation model (DEM) was collected from the SRTM 90 m Digital Elevation Database produced by NASA using the GEE platform. According to previous reports, the vertical error of the DEM is less than 16 m [44].
2.3. Methods
2.3.1. Measurement of Surface Urban Heat Island Intensity
For each urban agglomeration, urban and rural areas were extracted using the following method [45,46,47], where suburban areas were delineated on an urban basis. First, Based on Globeland30 in 2000, 2010, and 2020, an Impervious surface area (ISA) percentage (%) map for each urban agglomeration was generated using the 1 km × 1 km moving window method. Then, developed land with built-up land coverage >50% was aggregated by an aggregation distance of 2 km, isolated small patches with an area of less than 2 km2 were removed, and the remaining patches were considered as the core urban cluster. Then, equal-sized buffers based on urban clusters were produced. Furthermore, considering the influence of anthropogenic activities, the area of the buffer range NTL that was larger than the median value of the whole urban agglomeration was excluded; the remaining buffer was regarded as basic rural areas. In addition, to reduce the bias caused by topographic differences, water pixels and pixels with elevational difference larger than ±50 m to the mean elevation of the core urban cluster were removed when calculating the average LST of rural areas (Figure 2).
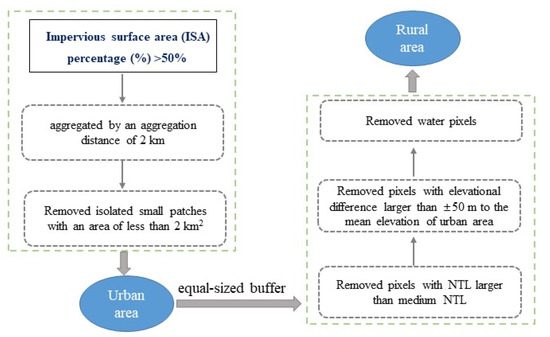
Figure 2.
A flowchart for dividing rural areas.
The formula to calculate the regional heat island intensity (RHII) was as follows:
RHII = LSTi − LSTrural
In the above equation, RHII and LSTi represent the RHII and LST of pixel i, respectively. LSTrural is the average temperature of the rural areas.
To appropriately reflect the spatiotemporal pattern of the RHII, the RHII values were further classified into five levels with 2 °C intervals based on a previous study [21] (Table 2). The sub-strong heat island (SSHI) and strong heat island (SHI) areas identify the hot spots in the region. Here, we regard these areas as heat sources.
Table 2.
Grade classification of regional heat island intensity.
2.3.2. Composition and Configuration Characteristics of Urban Form
In this study, to further understand urban form, the most frequently used metrics from the perspective of landscape were selected to analyze the configuration and composition of built-up areas; detailed descriptions of urban form indicators are shown in Table 3 [35,48,49,50]. For each urban agglomeration, the values of the metrics in each year were calculated at the class level using Fragstats v4.2 software (Oregon, USA) [51].
Table 3.
Detailed description of the metrics included in the analysis.
2.3.3. Analysis of the Relationship between the Urban Form and RHII
To further explore the impact of specific urban form indicators on RHI, this study focused on two aspects: the area of urban clusters and relevant landscape metrics of built-up areas. Considering the relatively large area span of urban patches, a log 10-transformed patch area of city clusters (log10Sc), in which Sc represents the number of urban pixels multiplied by the area per unit, was selected as an area metric to compress the scale of variables without changing the nature of data and correlations. First, the relationship between the RHII and log10Sc was analyzed by using an OLS regression model. Then, for each urban agglomeration, random points in representative central cities assigned values of RHII and urban form metrics were selected to calculate Pearson’s correlation coefficient. The core cities of BTH, YRD, and PRD were Beijing, Shanghai, and Guangzhou, respectively, which are the three largest and most developed cities in China.
In a previous study, it was demonstrated that urban development may have an important influence on RHII—namely, the relationship varies at different urban development levels [52]. Therefore, to further explore the contribution of the driving forces of the RHI under different urban intensity intervals in different urban agglomerations, we classified the 1 × 1 km grid into three typical urban intensity interval types (5–30%, 35–60%, and 65–100%), indicating low, medium, and high levels for each urban agglomeration. Then, to ensure that there was no collinearity of the independent variables, the variance inflation factor value was calculated using the covariance diagnosis function in the linearity module of SPSS. It is proved that there is no covariance problem when values are less than 10 [53]. After that, a relative importance analysis approach was used to quantify the relative contributions of potential drivers along the different urban development gradients with R software using the ‘‘relaimpo” package [54].
3. Results
3.1. Urban Form Patterns of Each Urban Agglomeration
From the dynamic evolution of the urban intensity pattern, the main expansion modes were filled with edge expansion, which means that new built-up area patches were located in the inner vacancy or outer edge areas of the existing urban areas (Figure 3). However, for BTH and YRD, large patches of continuous built-up areas emerged, mainly concentrated in some core cities, such as Beijing and Shanghai. The status of the main core urban areas was established, and the overall expansion of the urban agglomeration was driven mainly by several core cities. Specifically, the urban expansion of the BTH region was dominated by the continuous expansion of Beijing and Tianjin. Some satellite cities in the south, such as Shijiazhuang, have continued to expand, but are small-scale. There were more core urban districts in the YRD, and urban areas spread out similarly from their original extent in a filled expansion mode. In general, the distribution of urban built-up areas in the two urban agglomerations showed local concentration and overall dispersion. Compared with the BTH and YRD, the urbanization foundation of the PRD was poor in the early stage, and there was no prominent large core urban area. From 2000 to 2020, the built-up area extended along the existing built-up area and concentrated around the bay area.
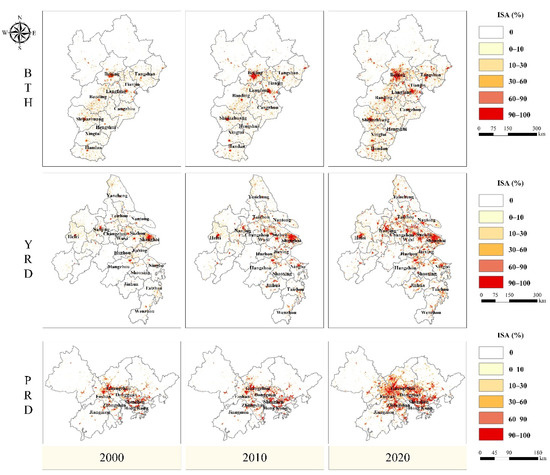
Figure 3.
ISA map of each urban agglomeration. BTH, Beijing–Tianjin–Hebei; PRD, Pearl River Delta; YRD, Yangtze River Delta.
The overall form of the built-up area in different stages of each urban agglomeration was further analyzed using a specific landscape pattern index (Table 4). For urban intensity, the difference in the urban area proportion among the three urban agglomerations was trivial. The values for each study area were approximately 8% and 9% in 2000 and 2010, respectively. However, in the 2020 phase, the urban intensity of the PRD reached 16%, surpassing that of BTH and YRD. In terms of the average patch size and shape complexity of built-up areas, there was an upward trend in both the mean patch area (AREA_MN) and landscape shape index (LSI) during the study period, indicating that the average size and shape complexity of built-up patches increased with the development of urban agglomeration. For AREA_MN, BTH and YRD showed little difference in the same period, while the size of the PRD was almost twice or more than that of the former. The LSI of BTH was the largest, followed by those of the YRD and PRD. From the cohesion of the built-up area, the original blank area between the urban patches gradually filled through the process of urban expansion, resulting in the growth of connectivity and aggregation landscapes. In the three different time stages, the AI values of PRD were the largest among three urban agglomerations, while those of BTH and YRD were about 70–90% of the former. To summarize, the results indicated that the pattern of built-up land use in the PRD was the most contiguous, with simpler shapes and the strongest aggregation among the three urban agglomerations.
Table 4.
Landscape metric values of built-up land use for each urban agglomeration.
3.2. Temporal and Spatial Patterns of RHI
The dynamics of the spatial distribution of different RHII levels are shown in Figure 4, and the results showed that the evolution pattern of RHII differed from that of urban agglomeration. The effect of urban expansion on the thermal environment was evident in 2010 and an overall configuration was established. After 2010, the distribution of RHII in BTH remained stable, mainly showing two concentrated heat sources: Tangshan–Tianjin–Langfang–Baoding, which is string-like and radiates from Beijing as the center, and Shijiazhuang–Xingtai–Handan, which is a strip-like form in the south. In contrast, the heat sources in the YRD and PRD continued to expand, and the former low RHII area was gradually occupied by the high RHII area, causing some previously fragmented high-temperature areas to merge gradually. For the YRD, there was an “SHI string cluster” centered around Shanghai with a series of surrounding cities, such as Hangzhou and Jiaxing, finally forming a “Z” shape. In the PRD, the cluster with a high RHII was mainly concentrated along the bay line, a circular contiguous area constituted by Zhongshan, Foshan, Guangzhou, Dongguan, Shenzhen, and Hong Kong, forming a large and continuous heat source.
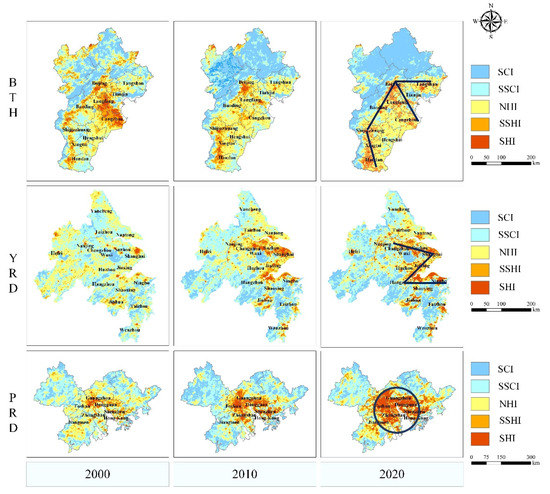
Figure 4.
Spatial distribution of different regional heat island intensity levels of each urban agglomeration. BTH, Beijing–Tianjin–Hebei; YRD, Yangtze River Delta; PRD, Pearl River Delta; SCI, strong cold island; SSCI, sub-strong cold island; NHI, no heat island; SSHI, sub-strong heat island; SHI, strong heat island.
Figure 5 shows that the variation of the heat source area in BTH was minimal, whereas the trend remained upward in the YRD and PRD. For BTH, the largest proportion of heat sources was 4.19% in 2000, which was largely affected by the extensive cropland in the southern region. The decrease in the heat source ratio in BTH in 2010 was mainly due to the decline of the SSHI area. Combined with the spatial distribution map of heat sources, the study found that Langfang and Cangzhou, which were perceived as the ecological barrier for the capital, experienced a significant cooling effect. This phenomenon was attributed to the massive reforestation in the two cities during the last decade. In 2010 and 2020, the total heat source area in the BTH region remained stable, floating at around 2%. Moreover, the area ratio of SHI even slightly decreased, which means the problem of the thermal environment was alleviated, as quantified by the area ratio of the high temperature zone. The expansion of areas with high temperature class characterizes a deterioration of the thermal environment. For the YRD and PRD, the total area of SSHI and SHI kept increasing, from 1.02% to 6.10% and 2.14% to 15.87%, respectively. In particular, the PRD showed the most significant thermal environment deterioration, especially with the rapid expansion of SHI, with the area proportion rising to 6.55% from 0.19%, almost 30 times that of the original phase.
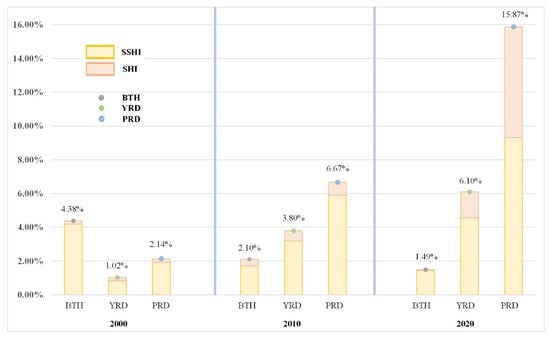
Figure 5.
Area ratio of strong heat island (SHI) and sub-strong heat island (SSHI) zones of three urban agglomerations. BTH, Beijing–Tianjin–Hebei; YRD, Yangtze River Delta; PRD, Pearl River Delta.
In addition, comparing the proportion of heat sources in urban agglomerations in the same period, it was found that the PRD had the highest value, except that BTH was the biggest in 2000. In 2010 and 2020, the area ratio of urban agglomerations ranked in descending order was PRD, YRD, and BTH, and the differences were increasingly obvious. Taking the 2020 data as an example, the total area of the SHI and SSHI zones in the PRD accounted for as much as 16%, and that in the BTH and YRD accounted for less than 10%. This indicates that the PRD has experienced the most serious heat source expansion problem and has become an urban agglomeration with the most serious thermal environment problem.
3.3. Relationship between the Built-Up Area and RHI
By comparing the spatiotemporal evolution of the overall form of the built-up area and the different grades of RHII, the results showed that with the continuous expansion of urban built-up areas, heat was accumulated and stored in the impervious layer, which further led to a negative spillover effect of the thermal environment problem; namely, the heat zone gradually spread to the suburbs surrounding the city. To explore the specific impact of urban form on the RHI, the mathematical and statistical relationships between relevant indicators and the RHI were further analyzed.
3.3.1. Relationship between the Built-Up Area and RHI
The relationships between RHII and cluster size in 2020 were examined using regression analysis, as shown in Figure 6.
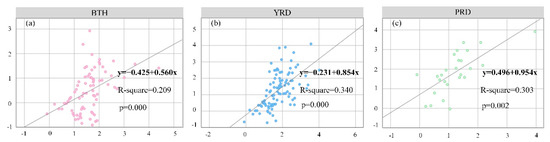
Figure 6.
Relationship between the relative heat island intensity (RHII) (°C) and log10Sc (built-up area (km2)). (a): BTH, Beijing–Tianjin–Hebei; (b): YRD, Yangtze River Delta; (c): PRD, Pearl River Delta.
In conclusion, there were significant positive relationships between the RHII and built-up areas (p < 0.01), with an associated positive slope for each urban agglomeration, which is consistent with the previous studies [35,55]. The strongest positive correlation between the RHII and cluster size was observed in the PRD, whereas the weakest correlation was observed in BTH. The urban central area form of urban agglomeration partly impacted the relationship; for BTH and YRD, “the string mode” with a larger latitude span weakened this relationship. On the one hand, the high building infrastructure density may allow more hear to be absorbed and stored, and on the other hand, the large built-up area also means a high intensity of human activities. In addition to receiving heat from the sun, the impervious layer was affected by massive anthropogenic heat emissions.
Pearson’s correlation coefficient analysis indicated that most form metrics of the form patches of 1 km × 1 km built-up areas were significantly related to RHII (p < 0.01) (Table 5). For all representative cities, the positive correlations of percent of landscape (PLAND), AREA_MN, and AI with RHII were the same as conclusions of previous studies [35,56,57]. There was no doubt that the RHII would increase with the proportion of built-up areas owing to the high heat storage characteristics. However, with the same urban intensity, the RHII also differed for different landscape structures. RHII increased with the average area of built-up patches. The stronger the degree of connectivity and aggregation, the stronger the RHII. This indicated that when planning an urban form, it is important to establish buffer zones composed by other land use types with cooling effects, such as green spaces and lakes to facilitate the circulation of heat.
Table 5.
Pearson correlation coefficients between the regional heat island intensity and spatial metrics.
For LSI, except for Beijing (p < 0.01), there was no significant relationship between RHII and the shape complexity of urban patches for other metropolises. However, the coefficients were uniformly negative, which indicated that the increase in urban patch shape complexity enhanced the energy flow between urban patches and the surrounding environment, which could also increase the LST in rural areas. In summary, attention should be paid to the configuration of urban land use, such as area size and aggregation of patches, to alleviate the issues of the thermal environment.
3.3.2. Relative Importance of Potential Urban Form Drivers on RHII
The contributions of potential drivers to annual RHII differed considerably between different urban development levels. The results of three typical urbanization gradients, low (L, 0–35%), middle (M, 35–65%), and high (H, 65–100%), in each city are shown in Figure 7.
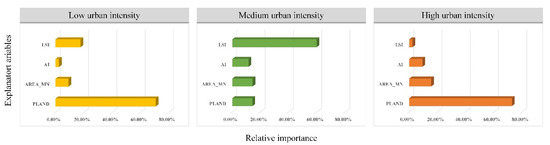
Figure 7.
Relative contribution of different drivers to regional heat island intensity variation (relative importance, %) at low, medium, and high urban intensity levels. LSI, landscape shape index; AI, aggregation index; AREA_MN, mean patch area; PLAND, percent of landscape.
For the low urbanization gradient, more than half (70.79%) of the variation was explained by the PLAND, while the remaining factors only accounted for approximately 30%. LSI was ranked as the most important factor, other than PLAND, accounting for 17.82% of the relative influence. However, the relative influences of AREA_MN and AI were less than 10%, at 9.13% and 2.47%, respectively.
With the change in urban intensity, the values of the relative importance of potential drivers varied. In contrast, for the medium urban intensity interval (35–65%), the shape complexity of urban patches, namely LSI, had an overwhelming impact, with a relative importance of approximately 60%. The significance of the urban area proportion decreased to 14.26%, which was similar to the relative influence of the mean urban patch area. Aggregation played a more negligible role in RHII, accounting for only 11.54% of the variation in RHII. For the high urban intensity level, the PLAND played a dominant role in influencing RHII, which explained approximately 72.78% of the variation. AREA_MN was the second-most influential factor, accounting for approximately 15%. The relative importance of LSI was the lowest among the three typical urbanization gradients, contributing approximately 2.28%.
The results indicate that a targeted analysis of different urban intensities was needed, as the mechanism of the thermal environment is a complex problem. In summary, in the early stages of urban development, the percentage of urban areas played a prominent role. The significance of shape complexity was emphasized at the medium urban intensity. With further urban expansion, the proportion of urban area was the most significant factor.
4. Discussion
4.1. Response Relationship between the Urban Agglomeration Expansion Mode and RHII
By analyzing the spatial and temporal distribution patterns of urban built-up areas and heat sources in the three urban agglomerations, a strong correlation was found between the two. Each urban agglomeration with a polycentric urban development mode was dominated by infilling expansion and edge expansion. However, the distribution and distance between the core cities were different. For BTH and YRD, the distance between each sub-city was large, which resulted in a point-to-point linear pattern in the high-temperature regions. However, with the small separation distance of the inner city in the PRD, the buffer zone between urban built-up areas was not enough to support continuous urban expansion, which led to the obvious contiguity of urban areas, further resulting in the aggregation of heat sources. The thermal environment was the most serious problem in the PRD, and scientific and effective mitigation measures are urgently needed.
In terms of spatial pattern, the RHI in the BTH region did not vary much from 2010 to 2020, and the high-temperature area and its shape remained stable, which was different from the temporal changes in the YRD and PRD. With the most compact and continuous urban agglomeration structure, the PRD, in particular, experienced rapid thermal environment deterioration. The comparison results showed that under the condition of the same urban area proportion of the entire region, the urban agglomeration with smaller AREA_MN and AI suffered a smaller degree of thermal problems. This conclusion is consistent with existing research on individual cities, which indicated that the impact rule of individual cities can also be extended to urban agglomerations [6,17,58]. For instance, in most cases, small, dispersed, and stretched cities are preferable for RHI alleviation, whereas an increase in urban spatial contiguity will increase the annual mean RHI [32,59,60].
This indicates that the planning of urban agglomeration is more complex than the situation of an individual city; the simple implementation of a polycentric planning policy does not mitigate the RHI effect, and attention should be paid to the overall configuration and layout [61]. From the perspective of urban expansion and planning, the government should control the development scale of the main core cities, for which the area is a heat island with considerable environmental pressure, such as Beijing in BTH, Shanghai in the YRD, and Guangzhou in the PRD, and accelerate the planning and construction of sub-cities and satellite cities to prevent the rapid contiguity of built-up areas [48]. For the specific urban expansion mode, it is necessary to improve the infilling type of urban expansion inside the city and the outlying type of urban expansion moving to other places [58]. In the interior of the urban area, a “green” and “blue” cooling buffer zone should be established to fragment the built-up area and thus prevent heat accumulation and non-circulation [62,63].
4.2. Driving Forces and Underlying Mechanisms of RHI
Many studies have demonstrated the significance of planning and optimizing the spatial allocation of landscapes to alleviate the effects of RHI [59,64,65]. In this study, the conclusions were similar to those of previous studies conducted in China [21,35,46,52] in urban areas with larger area clusters, higher proportions of impervious areas, and a tighter connectivity of patches: they suffer more serious urban heat problems. The influence of the urban form on thermal temperature is often explained by the urban energy balance, which includes the storage, exchange, and transformation of shortwave radiation [66]. Large contiguous patches of compact impermeable layers store a large amount of heat flux, which is not conducive to the exchange of latent heat flux and leads to heat storage. Therefore, despite the small difference in the overall built-up area proportion, the urban agglomeration with different impervious layer landscape configuration patterns is confronted with thermal environmental issues of varying degrees.
For BTH and YRD, the core cities were located at a certain distance from each other in a strip distribution pattern, showing “local concentration and global dispersion”. The main thermal environmental problems were concentrated in a few megacities, and the suburbs of each city acted as buffer zones to isolate the thermal environmental problems. The circular development pattern of the PRD urban agglomeration tended to blur the boundary between the core cities within each urban agglomeration, resulting in a continuous built-up area, which caused the gathering of high-temperature areas and the formation of the heat island overflow effect.
At the low (L, 0–35%) urban development level, the area expansion is the dominant factor in controlling urban thermal environment due to the severe land-use transformation. However, at the middle urban development level, the expansion rate of urban built-up areas in three urban agglomerations had decreased significantly, which led to the landscape configuration of the patches becoming prominent at this stage. A higher value of LSI indicates that there is a lower continuity of urban impervious patches and blue-green space (such as grassland and water bodies) distributed sporadically between these impervious patches, which can absorb the heat emitted from the built-up areas and cool the land surface. This also means that, in the middle level, a reasonable landscape configuration can offset the impact of urban built-up area expansion. In the high (H, 65–100%) urban development level, the proportion of built-up areas has reached a saturation state, and the limited green or blue areas can no longer balance the heat absorption and release, so the change of urban built-up area alone could bring a large disturbance to the thermal environment.
Considering that urban planning and construction are dynamic processes, it is necessary to consider and analyze the relative importance of each urban form indicator at different stages of development. When the proportion of impervious layers was small, the overall thermal environment was mainly influenced by the composition of land use. When the impervious layer developed to a certain percentage in the middle stage, the role of landscape configuration gradually emerged because a more complex patch shape could mitigate the heat island problem. However, at the high urban intensity stage, the influence of composition became the dominant factor, as the established fixed patches dominated the land-use type, and the influence of configuration was relatively insignificant.
4.3. Implications and Limitations
Our findings emphasize that urban form is closely related to the mitigation of RHI, regardless of the scale of the whole urban agglomeration or at the scale of 1 km × 1 km patches. For urban planners, understanding the mechanism between the landscape composition and configuration of built-up areas is especially instructive in improving the urban thermal environment by implementing effective and reasonable urban construction. However, owing to the absence of an urban development stage targeted at the scale of urban agglomeration, the suggestion was not specific to identifying the priority in improving landscape patterns to mitigate RHI. Thus, this study further explored the relationship and relative significance of each metric based on the responses of urban expansion and RHI.
For urban areas at a highly urbanized stage, such as global metropolises, optimizing the landscape configuration of the impervious layer was less important. Considering that it is not realistic to limit the expansion of impervious layers, the focus should be on the construction of land-use types with cooling effects (e.g., green space or water) [67,68]. For instance, constructing green roofs is an effective way to increase the fragmentation of impervious surface patches, without extensive replanning and transformation of built-up areas. In addition, moderate construction of green corridors, green belts, and artificial lakes is necessary. For urban areas in a medium urbanization stage, the configuration of the landscape was more important at this stage. In the case of new urban built-up areas, it is necessary to consider the shape of the built-up landscape, for example, by giving preference to more complex shapes when conditions permit.
As a unified whole with several cities, the thermal environment of an urban agglomeration is closely related to the construction of each internal city. This requires urban planners to coordinate the construction of each city while considering the big picture rather than limiting themselves to the administrative boundaries of individual cities. For example, for a city, the distance between a suburb and the city center may be greater than the distance from the suburb to the city center of the adjacent city. In this case, preventing large contiguous urban expansion has become a common problem for both cities.
However, there still exist some limitations in this study. Firstly, the planning recommendations derived from the conclusions still need to be subjected to wider validation, e.g., studies at different spatial scales and in different regions, in order to confirm the reliability of research results. Secondly, factors affecting the thermal environment of urban agglomerations include wind conditions [62], green space and water body [65], haze pollution [69], etc. In the future, specific studies on the thermal environment of urban agglomerations need to be conducted to unravel this complex mechanism using a more comprehensive factor analysis. Finally, research in this study was based on land surface temperature data, which means the conclusion was constrained to the surface UHI problem. Air temperature data should be further analyzed for near-surface UHI, as weather data are more closely related to human feelings.
5. Conclusions
The overall expansion of the urban agglomerations was driven by several core cities, and the three urban agglomerations maintained a relatively consistent expansion rate in the early stages. However, the PRD experienced significant rapid expansion from 2010 to 2020, and the proportion of built-up areas reached 16%. From the aspect of urban form, the overall configurations of BTH and YRD were similar in each period. The urban land configuration of the PRD presented a more compact mode, with the smallest mean area, simpler shapes, and strongest aggregation of urban patches among the three urban agglomerations.
The results showed that the evolution of the built-up landscape structure and RHI exhibited notable spatio-temporal coupling because the distribution of the heat source was highly consistent with the location of the built-up area. In the past two decades, BTH, YRD, and PRD have experienced a drastic variation in thermal characteristics, while the varying mode and extent have been generally stable since 2010. The deterioration of the thermal environment in the PRD was the most rapid and severe owing to the expansion of the heat source area. Specifically, the high RHII cluster showed in a “strip-like” form in BTH and YRD, which concentrated on a core urban area. The pattern of PRD was a “ring-like” form, with a large and continuous heat source located along the bay.
Urban form, involving both urban composition and configuration, played a significant role in the thermal environment. Specifically, RHII was positively correlated with the area of urban clusters, proportion of built-up areas, and aggregation of patches, which could partly explain the reason for the different thermal environment modes among the three urban agglomerations. It is worth noting that the relative importance of urban form metrics varied in different urbanization stages. For low and high urban intensity levels, PLAND was the dominant factor. In contrast, at the medium urban development level, the shape complexity of urban patches had the greatest contribution.
Author Contributions
Conceptualization, N.Z.; methodology, Y.L. and H.Y.; validation, Y.L.; formal analysis, N.Z.; investigation, N.Z.; resources, H.Y.; data curation, N.Z.; writing—original draft preparation, N.Z and Z.L.; writing—review and editing, N.Z.; supervision, H.Y., M.W. and S.L.; project administration, Y.L.; funding acquisition, Y.L. All authors have read and agreed to the published version of the manuscript.
Funding
This research was funded by the National Natural Science Foundation of China, grant number 41771182.
Data Availability Statement
The land-use and land-cover data can be obtained from Globaland 30: http://www.globallandcover.com/ (accessed on 5 June 2022). The MODIS data used in this paper can be obtained from Google Earth Engine: https://earthengine.google.com/ (accessed on 5 June 2022). The Nighttime light (NTL) data can be obtained from HARVARD Dataset: https://dataverse.harvard.edu/dataset.xhtml?persistentId=doi:10.7910/DVN/YGIVCD (accessed on 5 June 2022).
Conflicts of Interest
The authors declare no conflict of interest.
References
- Su, M.R.; Fath, B.D.; Yang, Z.F. Urban ecosystem health assessment: A review. Sci. Total Environ. 2010, 408, 2425–2434. [Google Scholar] [CrossRef] [PubMed]
- Manisalidis, I.; Stavropoulou, E.; Stavropoulos, A.; Bezirtzoglou, E. Environmental and health impacts of air pollution: A Review. Front. Public Health 2020, 8, 14. [Google Scholar] [CrossRef] [PubMed] [Green Version]
- Zhang, H.F.; Wang, S.X.; Hao, J.M.; Wang, X.M.; Wang, S.L.; Chai, F.H.; Li, M. Air pollution and control action in Beijing. J. Clean. Prod. 2016, 112, 1519–1527. [Google Scholar] [CrossRef]
- Seto, K.C.; Guneralp, B.; Hutyra, L.R. Global forecasts of urban expansion to 2030 and direct impacts on biodiversity and carbon pools. Proc. Natl. Acad. Sci. USA 2012, 109, 16083–16088. [Google Scholar] [CrossRef] [PubMed] [Green Version]
- Lin, L.; Gao, T.; Luo, M.; Ge, E.; Yang, Y.; Liu, Z.; Zhao, Y.; Ning, G. Contribution of urbanization to the changes in extreme climate events in urban agglomerations across China. Sci. Total Environ. 2020, 744, 140264. [Google Scholar] [CrossRef]
- Sun, Y.; Hu, T.; Zhang, X.B.; Li, C.; Lu, C.H.; Ren, G.Y.; Jiang, Z.H. Contribution of global warming and urbanization to changes in temperature extremes in eastern China. Geophys. Res. Lett. 2019, 46, 11426–11434. [Google Scholar] [CrossRef] [Green Version]
- Mohajerani, A.; Bakaric, J.; Jeffrey-Bailey, T. The urban heat island effect, its causes, and mitigation, with reference to the thermal properties of asphalt concrete. J. Environ. Manag. 2017, 197, 522–538. [Google Scholar] [CrossRef]
- Kumar, P.; Sharma, A. Study on importance, procedure, and scope of outdoor thermal comfort—A review. Sustain. Cities Soc. 2020, 61, 102297. [Google Scholar] [CrossRef]
- Mora, C.; Dousset, B.; Caldwell, I.R.; Powell, F.E.; Geronimo, R.C.; Bielecki, C.R.; Counsell, C.W.; Dietrich, B.S.; Johnston, E.T.; Louis, L.V.; et al. Global risk of deadly heat. Nat. Clim. Change 2017, 7, 501. [Google Scholar] [CrossRef]
- Yang, Q.; Huang, X.; Tang, Q. The footprint of urban heat island effect in 302 Chinese cities: Temporal trends and associated factors. Sci. Total Environ. 2019, 655, 652–662. [Google Scholar] [CrossRef]
- Lowe, S.A. An energy and mortality impact assessment of the urban heat island in the US. Environ. Impact Assess. Rev. 2016, 56, 139–144. [Google Scholar] [CrossRef]
- Lu, Y.P.; Yue, W.Z.; Liu, Y.; Huang, Y.P. Investigating the spatiotemporal non-stationary relationships between urban spatial form and land surface temperature: A case study of Wuhan, China. Sustain. Cities Soc. 2021, 72, 103070. [Google Scholar] [CrossRef]
- Manoli, G.; Fatichi, S.; Schlapfer, M.; Yu, K.L.; Crowther, T.W.; Meili, N.; Burlando, P.; Katul, G.G.; Bou-Zeid, E. Magnitude of urban heat islands largely explained by climate and population. Nature 2019, 573, 55–60. [Google Scholar] [CrossRef] [PubMed]
- Fang, C.L.; Yu, D.L. Urban agglomeration: An evolving concept of an emerging phenomenon. Landsc. Urban Plan. 2017, 162, 126–136. [Google Scholar] [CrossRef]
- Gu, Q.W.; Wang, H.Q.; Zheng, Y.N.; Zhu, J.W.; Li, X.K. Ecological footprint analysis for urban agglomeration sustainability in the middle stream of the Yangtze River. Ecol. Model. 2015, 318, 86–99. [Google Scholar] [CrossRef]
- Li, W.F.; Han, C.M.; Li, W.J.; Zhou, W.Q.; Han, L.J. Multi-scale effects of urban agglomeration on thermal environment: A case of the Yangtze River Delta Megaregion, China. Sci. Total Environ. 2020, 713, 136556. [Google Scholar] [CrossRef] [PubMed]
- Du, H.Y.; Wang, D.D.; Wang, Y.Y.; Zhao, X.L.; Qin, F.; Jiang, H.; Cai, Y.L. Influences of land cover types, meteorological conditions, anthropogenic heat and urban area on surface urban heat island in the Yangtze River Delta Urban Agglomeration. Sci. Total Environ. 2016, 571, 461–470. [Google Scholar] [CrossRef]
- Han, B.; Luo, Z.X.; Liu, Y.; Zhang, T.Y.; Yang, L. Using local climate zones to investigate Spatio-temporal evolution of thermal environment at the urban regional level: A case study in Xi’an, China. Sustain. Cities Soc. 2022, 76, 103495. [Google Scholar] [CrossRef]
- Yan, L.; Jia, W.X.; Zhao, S.Q. The cooling effect of urban green spaces in metacities: A case study of Beijing, China’s capital. Remote Sens. 2021, 13, 4601. [Google Scholar] [CrossRef]
- Zhou, D.C.; Xiao, J.F.; Bonafoni, S.; Berger, C.; Deilami, K.; Zhou, Y.Y.; Frolking, S.; Yao, R.; Qiao, Z.; Sobrino, J.A. Satellite remote sensing of surface urban heat islands: Progress, challenges, and perspectives. Remote Sens. 2019, 11, 48. [Google Scholar] [CrossRef] [Green Version]
- Yu, Z.W.; Yao, Y.W.; Yang, G.Y.; Wang, X.R.; Vejre, H. Spatiotemporal patterns and characteristics of remotely sensed region heat islands during the rapid urbanization (1995–2015) of Southern China. Sci. Total Environ. 2019, 674, 242–254. [Google Scholar] [CrossRef] [PubMed]
- Zhou, D.C.; Bonafoni, S.; Zhang, L.X.; Wang, R.H. Remote sensing of the urban heat island effect in a highly populated urban agglomeration area in East China. Sci. Total Environ. 2018, 628–629, 415–429. [Google Scholar] [CrossRef] [PubMed]
- Cui, Y.Y.; de Foy, B. Seasonal variations of the urban heat island at the surface and the near-surface and reductions due to urban vegetation in Mexico City. J. Appl. Meteorol. Clim. 2012, 51, 855–868. [Google Scholar] [CrossRef]
- Fitria, R.; Kim, D.; Baik, J.; Choi, M. Impact of biophysical mechanisms on urban heat island associated with climate variation and urban morphology. Sci. Rep. 2019, 9, 19503. [Google Scholar] [CrossRef] [PubMed]
- Wang, Q.; Wang, X.N.; Zhou, Y.; Liu, D.Y.; Wang, H.T. The dominant factors and influence of urban characteristics on land surface temperature using random forest algorithm. Sustain. Cities Soc. 2022, 79, 103722. [Google Scholar] [CrossRef]
- Estoque, R.C.; Murayama, Y.; Myint, S.W. Effects of landscape composition and pattern on land surface temperature: An urban heat island study in the megacities of Southeast Asia. Sci. Total Environ. 2017, 577, 349–359. [Google Scholar] [CrossRef]
- Fang, C.L.; Li, G.D.; Wang, S.J. Changing and differentiated urban landscape in China: Spatiotemporal patterns and driving forces. Environ. Sci. Technol. Lett. 2016, 50, 2217–2227. [Google Scholar] [CrossRef]
- Takebayashi, H.; Senoo, M. Analysis of the relationship between urban size and heat island intensity using WRF model. Urban Clim. 2018, 24, 287–298. [Google Scholar] [CrossRef]
- Yu, Z.W.; Zhang, J.G.; Yang, G.Y. How to build a heat network to alleviate surface heat island effect? Sustain. Cities Soc. 2021, 74, 103135. [Google Scholar] [CrossRef]
- Du, Y.; Mak, C.M. Improving pedestrian level low wind velocity environment in high-density cities: A general framework and case study. Sustain. Cities Soc. 2018, 42, 314–324. [Google Scholar] [CrossRef]
- Yang, L.Q.; Yu, K.Y.; Ai, J.W.; Liu, Y.F.; Lin, L.L.; Lin, L.C.; Liu, J. The influence of green space patterns on land surface temperature in different seasons: A case study of Fuzhou city, China. Remote Sens. 2021, 13, 5114. [Google Scholar] [CrossRef]
- Zhou, B.; Rybski, D.; Kropp, J.P. The role of city size and urban form in the surface urban heat island. Sci. Rep. 2017, 7, 4791. [Google Scholar] [CrossRef]
- Su, H.Y.; Han, G.F.; Li, L.; Qin, H.Q. The impact of macro-scale urban form on land surface temperature: An empirical study based on climate zone, urban size and industrial structure in China. Sustain. Cities Soc. 2021, 74, 103217. [Google Scholar] [CrossRef]
- Peng, J.; Xie, P.; Liu, Y.X.; Ma, J. Urban thermal environment dynamics and associated landscape pattern factors: A case study in the Beijing metropolitan region. Remote Sens. Environ. 2016, 173, 145–155. [Google Scholar] [CrossRef]
- Ye, H.P.; Li, Z.H.; Zhang, N.H.; Leng, X.J.; Meng, D.; Zheng, J.; Li, Y. Variations in the effects of landscape patterns on the urban thermal environment during rapid urbanization (1990–2020) in megacities. Remote Sens. 2021, 13, 3415. [Google Scholar] [CrossRef]
- Chen, Y.; Yang, J.; Yang, R.X.; Xiao, X.M.; Xia, J.H. Contribution of urban functional zones to the spatial distribution of urban thermal environment. Build. Environ. 2022, 216, 109000. [Google Scholar] [CrossRef]
- Wu, Q.; Li, Z.Y.; Yang, C.B.; Li, H.Q.; Gong, L.W.; Guo, F.X. On the scale effect of relationship identification between land surface temperature and 3D landscape pattern: The application of random forest. Remote Sens. 2022, 14, 279. [Google Scholar] [CrossRef]
- Liu, Y.; Li, H.; Gao, P.; Zhong, C. Monitoring the detailed dynamics of regional thermal environment in a developing urban agglomeration. Sensors 2020, 20, 1197. [Google Scholar] [CrossRef] [Green Version]
- Shen, Z.C.; Xu, X.L.; Xu, S.W.; Sun, D.W. A comparative study of land development patterns and regional thermal environments (RTEs) in typical urban agglomerations of China and America: A case study of Beijing-Tianjin-Hebei (BTH) and Boswash. Sci. Total Environ. 2022, 803, 149735. [Google Scholar] [CrossRef]
- Wan, Z.M.; Dozier, J. A generalized split-window algorithm for retrieving land-surface temperature from space. IEEE Trans. Geosci. Remote Sens. 1996, 34, 892–905. [Google Scholar]
- Wan, Z.M. New refinements and validation of the MODIS Land-Surface Temperature/Emissivity products. Remote Sens. Environ 2008, 112, 59–74. [Google Scholar] [CrossRef]
- Yang, Y.; Xiao, P.; Feng, X.; Li, H. Accuracy assessment of seven global land cover datasets over China. ISPRS J. Photogramm. Remote Sens. 2017, 125, 156–173. [Google Scholar] [CrossRef]
- Chen, Z.Q.; Yu, B.L.; Yang, C.S.; Zhou, Y.Y.; Yao, S.J.; Qian, X.J.; Wang, C.X.; Wu, B.; Wu, J.P. An extended time series (2000–2018) of global NPP-VIIRS-like nighttime light data from a cross-sensor calibration. Earth Syst. Sci. Data 2021, 13, 889–906. [Google Scholar] [CrossRef]
- Jarvis, A.; Reuter, H.I.; Nelson, A.; Guevara, E. Hole-Filled SRTM for the Globe Version 4, Available from the CGIAR-CSI SRTM 90 m Database. 2008. Available online: http://srtm.csi.cgiar.org (accessed on 1 June 2022).
- Li, K.N.; Chen, Y.H.; Gao, S.J. Uncertainty of city-based urban heat island intensity across 1112 global cities: Background reference and cloud coverage. Remote Sens. Environ. 2022, 271, 112898. [Google Scholar] [CrossRef]
- Liang, Z.; Wu, S.; Wang, Y.; Wei, F.; Huang, J.; Shen, J.; Li, S. The relationship between urban form and heat island intensity along the urban development gradients. Sci. Total Environ. 2020, 708, 135011. [Google Scholar] [CrossRef]
- Ren, T.; Zhou, W.; Wang, J. Beyond intensity of urban heat island effect: A continental scale analysis on land surface temperature in major Chinese cities. Sci. Total Environ. 2021, 791, 148334. [Google Scholar] [CrossRef]
- Liu, W.X.; Meng, Q.Y.; Allam, M.; Zhang, L.L.; Hu, D.; Menenti, M. Driving factors of land surface temperature in urban agglomerations: A case study in the Pearl River Delta, China. Remote Sens 2021, 13, 2858. [Google Scholar] [CrossRef]
- Sharifi, A. Resilient urban forms: A macro-scale analysis. Cities 2019, 85, 1–14. [Google Scholar] [CrossRef]
- Yang, Q.; Huang, X.; Li, J. Assessing the relationship between surface urban heat islands and landscape patterns across climatic zones in China. Sci. Rep. 2017, 7, 9337. [Google Scholar] [CrossRef]
- McGarigal, K. FRAGSTATS v4: Spatial Pattern Analysis Program for Categorical and Continuous Maps. Computer Software Program Produced by the Authors at the University of Massachusetts, Amherst. 2012. Available online: http://www.umass.edu/landeco/research/fragstats/fragstats.html (accessed on 1 July 2021).
- Jia, W.; Zhao, S. Trends and drivers of land surface temperature along the urban-rural gradients in the largest urban agglomeration of China. Sci. Total Environ. 2020, 711, 134579. [Google Scholar] [CrossRef]
- Celik, S.; Sengul, T.; Sogut, B.; Inci, H.; Sengul, A.Y.; Kayaokay, A.; Ayasan, T. Analysis of variables affecting carcass weight of white turkeys by regression analysis based on factor analysis scores and ridge regression. Braz. J. Poult. Sci. 2018, 20, 273–279. [Google Scholar] [CrossRef]
- Gromping, U. Relative importance for linear regression in R: The packagerelaimpo. J. Stat. Softw. 2006, 17, 1–27. [Google Scholar] [CrossRef] [Green Version]
- Morabito, M.; Crisci, A.; Guerri, G.; Messeri, A.; Congedo, L.; Munafo, M. Surface urban heat islands in Italian metropolitan cities: Tree cover and impervious surface influences. Sci. Total Environ. 2021, 751, 142334. [Google Scholar] [CrossRef] [PubMed]
- Liu, H.M.; Huang, B.; Zhan, Q.M.; Gao, S.H.; Li, R.R.; Fan, Z.Y. The influence of urban form on surface urban heat island and its planning implications: Evidence from 1288 urban clusters in China. Sustain. Cities Soc. 2021, 71, 102987. [Google Scholar] [CrossRef]
- Xu, L.L.; Cui, S.H.; Tang, J.X.; Nguyen, M.; Liu, J.H.; Zhao, Y.C. Assessing the adaptive capacity of urban form to climate stress: A case study on an urban heat island. Environ. Res. Lett. 2019, 14, 044013. [Google Scholar] [CrossRef]
- Li, X.; Zhou, Y.; Asrar, G.R.; Imhoff, M.; Li, X. The surface urban heat island response to urban expansion: A panel analysis for the conterminous United States. Sci. Total Environ. 2017, 605, 426–435. [Google Scholar] [CrossRef]
- Debbage, N.; Shepherd, J.M. The urban heat island effect and city contiguity. Comput. Environ. Urban Syst. 2015, 54, 181–194. [Google Scholar] [CrossRef]
- Yang, L.; Niyogi, D.; Tewari, M.; Aliaga, D.; Chen, F.; Tian, F.Q.; Ni, G.H. Contrasting impacts of urban forms on the future thermal environment: Example of Beijing metropolitan area. Environ. Res. Lett. 2016, 11, 034018. [Google Scholar] [CrossRef] [Green Version]
- Yue, W.Z.; Liu, X.; Zhou, Y.Y.; Liu, Y. Impacts of urban configuration on urban heat island: An empirical study in China mega-cities. Sci. Total Environ. 2019, 671, 1036–1046. [Google Scholar] [CrossRef]
- Peng, J.; Jia, J.L.; Liu, Y.X.; Li, H.L.; Wu, J.S. Seasonal contrast of the dominant factors for spatial distribution of land surface temperature in urban areas. Remote Sens. Environ. 2018, 215, 255–267. [Google Scholar] [CrossRef]
- Yue, W.; Qiu, S.; Xu, H.; Xu, L.; Zhang, L. Polycentric urban development and urban thermal environment: A case of Hangzhou, China. Landsc. Urban Plan. 2019, 189, 58–70. [Google Scholar] [CrossRef]
- Kuang, W.H.; Liu, Y.; Dou, Y.Y.; Chi, W.F.; Chen, G.S.; Gao, C.F.; Yang, T.R.; Liu, J.Y.; Zhang, R.H. What are hot and what are not in an urban landscape: Quantifying and explaining the land surface temperature pattern in Beijing, China. Landsc. Ecol. 2015, 30, 357–373. [Google Scholar] [CrossRef]
- Yang, G.Y.; Yu, Z.W.; Jorgensen, G.; Vejre, H. How can urban blue-green space be planned for climate adaption in high-latitude cities? A seasonal perspective. Sustain. Cities Soc. 2020, 53, 101932. [Google Scholar] [CrossRef]
- Berardi, U.; Graham, J. Investigation of the impacts of microclimate on PV energy efficiency and outdoor thermal comfort. Sustain. Cities Soc. 2020, 62, 102402. [Google Scholar] [CrossRef]
- Syafii, N.I.; Ichinose, M.; Kumakura, E.; Jusuf, S.K.; Chigusa, K.; Wong, N.H. Thermal environment assessment around bodies of water in urban canyons: A scale model study. Sustain. Cities Soc. 2017, 34, 79–89. [Google Scholar] [CrossRef]
- Tan, X.Y.; Sun, X.; Huang, C.D.; Yuan, Y.; Hou, D.L. Comparison of cooling effect between green space and water body. Sustain. Cities Soc. 2021, 67, 102711. [Google Scholar] [CrossRef]
- Cao, C.; Lee, X.; Liu, S.D. Urban heat islands in China enhanced by haze pollution. Nat. Commun. 2016, 7, 12509. [Google Scholar] [CrossRef]
Publisher’s Note: MDPI stays neutral with regard to jurisdictional claims in published maps and institutional affiliations. |
© 2022 by the authors. Licensee MDPI, Basel, Switzerland. This article is an open access article distributed under the terms and conditions of the Creative Commons Attribution (CC BY) license (https://creativecommons.org/licenses/by/4.0/).