Article

Spatiotemporal Dynamics of Land Surface Albedo and Its Influencing Factors in the Qilian Mountains, Northeastern Tibetan Plateau

1
Faculty of Geomatics, Lanzhou Jiaotong University, Lanzhou 730070, China
2
National-Local Joint Engineering Research Center of Technologies and Applications for National Geographic State Monitoring, Lanzhou 730070, China
3
Gansu Provincial Engineering Laboratory for National Geographic State Monitoring, Lanzhou 730070, China
4
Key Laboratory of Western China’s Environmental Systems (Ministry of Education), College of Earth and Environmental Sciences, Lanzhou University, Lanzhou 730000, China
*
Author to whom correspondence should be addressed.
Remote Sens. 2022, 14(8), 1922; https://doi.org/10.3390/rs14081922
Submission received: 31 March 2022 / Revised: 6 April 2022 / Accepted: 11 April 2022 / Published: 15 April 2022

Abstract

:
Land surface albedo directly determines the distribution of radiant energy between the surface and the atmosphere, and it is a key parameter affecting the energy balance on the land surface. However, the spatiotemporal dynamics of land surface albedo and associated influencing factors in the Qilian Mountains (QM) have been rarely reported. By using the long-time series data products of MODIS shortwave albedo, normalized difference vegetation index (NDVI), and snow cover with a spatial resolution of 0.05° from 2001 to 2020, this paper analyzes the temporal and spatial variations of land surface albedo in the QM over the past 20 years and its influencing factors. The analysis results show that the multi-year average surface albedo in the QM has obvious differences in spatial distribution: it increases with the altitude, and it is high in the west (at the west of 98° E) and low in the east. Meanwhile, the surface albedo has different distribution characteristics in different seasons: the spatial distribution of surface albedo is similar in spring and autumn; the areas with a high surface albedo in summer are significantly fewer than those in other seasons. Besides, in the past 20 years, the annual average surface albedo has shown a weak growth trend in the QM, with a change rate of 5 × 10⁻³/10a, and the minimum and maximum values were reached in 2001 and 2019, respectively. In addition, the annual variation of the surface albedo in the QM showed a “U” shape, with the largest variation in January and the smallest variation in August. The annual variation of surface albedo is significantly positively correlated with snow cover (r = 0.96) and significantly negatively correlated with NDVI (r = −0.91). Moreover, the interannual variation of the surface albedo in the QM is closely related to land surface cover and is greatly affected by snow cover. Spatially, the annual variation of surface albedo in most areas of the QM is dominated by the change of snow cover, and the increase of surface albedo in the middle area is consistent with the increase of snow cover, while the decrease of albedo in the edge area is related to the improvement of vegetation cover. The results of this study provide a scientific basis for studying the climate and environmental changes caused by changes in the surface of the QM and making ecological environment restoration strategies.

1. Introduction

Since the Industrial Revolution, global warming has become increasingly serious, and multiple indicators of the Earth’s climate system such as the atmosphere, ocean, land, and cryosphere have shown the impact of human activities (IPCC). The surface albedo is the ratio of the reflected solar radiation on the surface to the incident solar radiation, which regulates the radiation energy balance between the ground and the atmosphere [1,2]. It is a key parameter that affects the surface energy budget and the interaction between the ground and the atmosphere [3,4]. Therefore, surface albedo plays an extremely important role in the climate system, and it is influenced by solar elevation angle, topography, vegetation changes, ice/snow cover changes, soil moisture, soil properties, and human activities [5,6]. Meanwhile, the change of surface albedo will also react to the surface radiation balance and affect other climate variables, thus forming a complex loop feedback mechanism [7,8]. In particular, the feedback effect of surface albedo changes will further amplify its impact on climate, even though subtle changes are fed back into the climate system, thereby affecting local, regional, and even global climate change [9]. Generally, the improvement of vegetation coverage and the melting of ice/snow will lead to a decrease in the surface albedo, and the corresponding sensible heat flux and latent heat flux will also increase; the surface absorbs more solar radiation and increases the surface temperature, thus promoting the growth of vegetation and the melting of ice and snow [10,11]. Conversely, the increase of surface albedo will weaken atmospheric convergence, reduce cloud, precipitation, and soil moisture, thus exacerbating drought in arid regions [12]. From 1700 to 2005, the global albedo increased by about 0.00106 because of land cover change, leading to a radiative cooling at the top of the atmosphere of −0.15 Wm−2 [13].
The strong reflection characteristic of snow has a remarkable impact on the surface albedo. The snow location (above or below the canopy), extent, and state (i.e., snow age, depth, water content and purity, etc.) can greatly change the spectral characteristics to modulate the surface albedo [8,14,15]. Changes in snow cover significantly affect the surface albedo, and there is a positive correlation between the two [5,6,16]. In addition, studies in the complex terrain area of the Tibetan Plateau (TP) found that the surface albedo under the coexistence of snow cover and vegetation is more sensitive to the response of snow cover [6]. Bond et al. (2013) found that incomplete combustion of fossil fuels and biofuels can reduce snow albedo, thereby accelerating Arctic snow melting [17,18]. Due to climate warming, the reduction of surface albedo caused by snow retreat and snow albedo feedback is considered to be an important reason for the amplification of Arctic climate warming [19,20]. Therefore, a deep understanding of the positive feedback of snow albedo becomes crucial.
Vegetation change is another important factor affecting surface albedo. Large parts of the Earth are experiencing a greening trend because of the changes in carbon dioxide fertilization, nitrogen deposition, climate change, and land cover [21]. Numerous studies have found a negative correlation between surface albedo and vegetation cover [5,6,16,22]. Under increased vegetation, surface albedo decreases, and net surface radiation increases, thereby heating the atmosphere and providing positive feedback for climate warming [11]. In the TP, the increase of vegetation cover has a negative effect on the surface albedo, and the surface albedo is more sensitive to the change of NDVI in the vegetation coverage area than in the coexistence area of snow cover and vegetation [6]. In high latitudes, climate warming increases the vegetation area, causing a significant reduction in surface albedo [5], but the radiative forcing warming effect caused by the decrease in surface albedo can compensate for the cooling effect of the carbon sink [23]. In temperate and boreal zones of the Northern Hemisphere the albedo effect is stronger and deforestation induces a cooling, which is related to the difference in albedo between trees and grasslands being amplified by the presence of snow; in tropical regions, deforestation has a significant effect on local warming effects by increasing surface albedo and reducing evaporation [24,25,26].
The QM are the ecological barrier of the TP and the throat of the Silk Road Economic Belt [27]. In the past 50 years, the temperature in the QM has increased significantly, with a rate of about 0.5 °C decade−1, and the precipitation has also increased significantly, with a rate of about 6.95 mm decade−1 [28,29]. The climate of the whole region shows a warming and wetting trend, which promotes the climbing of the tree line and enhances the stability of the grassland [30]. On the whole, vegetation in the QM is greening. However, solid reservoirs (glaciers and permafrost) are in the process of aggravating degradation, and glaciers in mountainous areas below 4000 m have completely disappeared. Compared with the 1960s, the area of glaciers in the QM has decreased by 20.5% ± 6.04%, and the loss rate between 2007 and 2015 is as high as 5.82%/10a [29]. In addition, with the intensification of human activities, the areas of industrial and mining, housing, transportation, and other land uses have increased [27]. Furthermore, the extensive development of mineral resources, overgrazing of local grasslands, irregular operation of tourism facilities, and overloaded groundwater use has seriously damaged the ecological environment of the QM and posed serious challenges to the sustainable development of the society and economy [31].
Affected by various driving factors, surface albedo exhibits obvious temporal variability and spatial heterogeneity. To obtain credible and accurate albedo data, satellite remote sensing is indispensable. Compared with measured and simulated data, satellite remote sensing has a wider coverage, and fewer natural limitations and uncertainties. Thus, it has become an efficient method to acquire continuous albedo [32]. There is good consistency between the satellite-retrieved annual mean and field measurements, when the surface albedo varies seasonally, forest-covered areas are better matched than non-forested areas [33]. In satellite datasets, all latitude assessments show good agreement in summer, while albedo assessments have significant uncertainty in winter, especially at high latitudes [34]. The MODIS V006 albedo product has an improved temporal resolution and accuracy, and the daily MODIS V006 product can reproduce the dynamics of albedo well [32,35,36]. In recent years, some scholars have studied the albedo of glaciers in the QM. It was found that the dust on the surface of the glacier significantly reduced the albedo [18], and there was a significant negative correlation between the diurnal variation of glacial albedo and air temperature [37]. Another study found a significant positive correlation between glacier area change and annual mean albedo [38]. However, the spatiotemporal variation characteristics of surface albedo and its influencing factors in the QM are less studied. Therefore, this paper uses the MODIS MCD43C3 V006 product provided by NASA (National Aeronautics and Space Administration, NASA, Washington, DC, USA), combined with NDVI and snow cover data, to analyze the spatiotemporal distribution of surface albedo and its influencing factors in the QM. The results of the study will help to understand the feedback mechanism of surface albedo and reveal the relation between climate change and human activities, thus providing an important basis for ecological barrier construction and sustainable development in the QM.

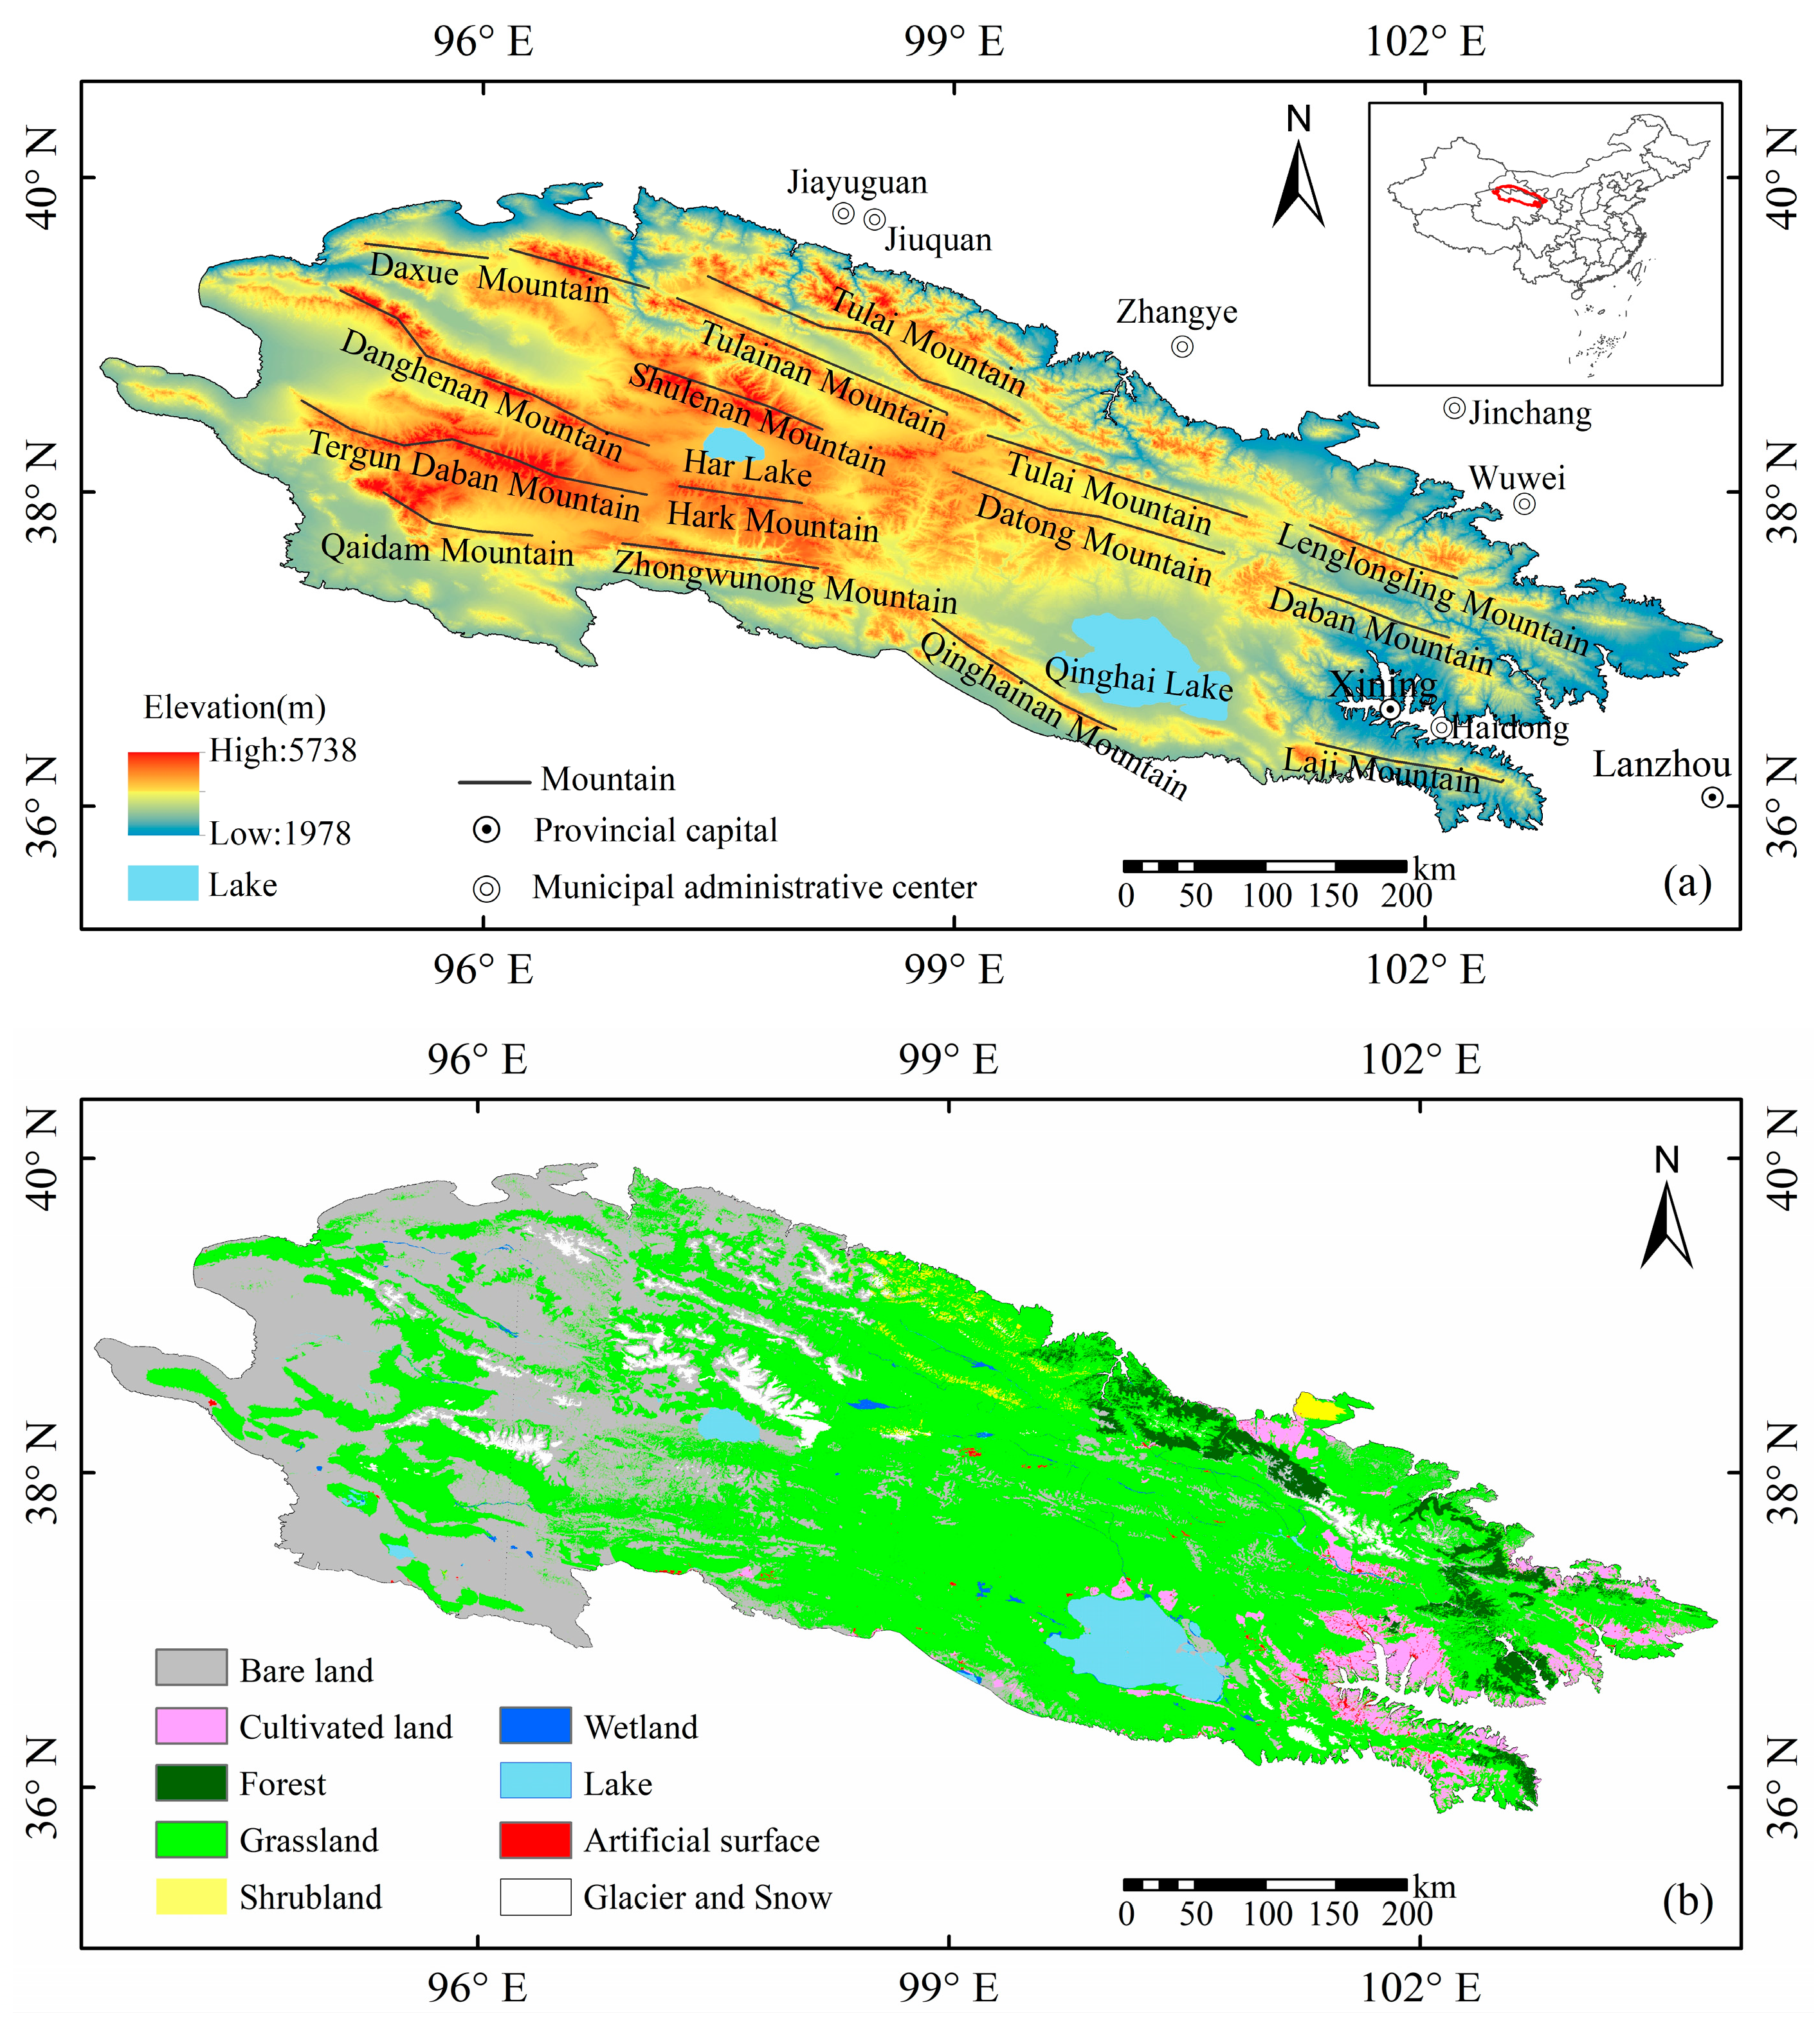
2. Overview of the Study Area

The QM are located on the border between the northeastern Qinghai Province and the western Gansu Province in China, and it is also located at the intersection of three major plateaus, i.e., Qinghai-Tibet, Mengxin, and Loess. It consists of a number of parallel mountains and wide valleys from northwest to southeast (Figure 1a). Because of the high altitude of the overall mountain range, the peaks over 4000 m are covered with snow all year round. Meanwhile, there are 3306 modern glaciers [39], which are the source of the Shiyang River, Heihe River, Shule River, and other rivers [40]. As the altitude decreases from northwest to southeast, the land cover types are bare land, grassland, and cultivated land in sequence [41]. Bare land is mainly in the west of 98° E, and grassland is mainly in the east of 98° E (Figure 1b). The annual average temperature in the QM is below 4 °C, higher in barren/rocky areas, lower in snow/glacier areas [42], and the temperature gradually decreases with the increase of elevation. Different from air temperature, precipitation is not only affected by altitude, aspect, and slope but also by latitude, longitude, and atmospheric circulation; it shows a decreasing trend from east to west [28].

3. Materials and Methods

3.1. Dataset and Preprocessing

This study used three sets of remote sensing products and reanalysis datasets (Table 1), including MODIS surface albedo, snow cover, normalized difference vegetation index (NDVI) products, and National Centers for Environmental Prediction (NCEP) downward solar radiation reanalysis data.

3.1.1. Remote Sensing Products

The albedo data and NDVI data used in this paper are obtained from the 2001–2020 MODIS MCD43C3 and MOD13C2 data provided by NASA (https://ladsweb.modaps.eosdis.nasa.gov (accessed on 1 November 2020)). The HEG tool was adopted to extract the black sky albedo (BSA) and the white sky albedo (WSA) in the albedo data. BSA represents the albedo under complete direct solar radiation, and WSA represents the albedo under complete diffusion of solar radiation. Then, MATLAB software was used to calculate the daily surface albedo, and the daily data were spatially aggregated into monthly, seasonal, and annual data. For NDVI data, considering that the areas with NDVI < 0.1 are bare soil and sparse vegetation areas, the values of NDVI > 0.1 were screened [47]. However, since this study took the MODIS MOD10CM product provided by the EOS/MODIS data center (http://nsidc.org/NASA/MODIS (accessed on 29 November 2020)) in the United States as snow cover data, a value between 0 and 100 was used to represent the snow cover rate of each pixel.

3.1.2. NCEP Reanalysis Products

To obtain the true surface albedo, the diffuse skylight ratio needs to be calculated from the downward solar flux reanalysis data provided by NCEP [46,48]. Meanwhile, the calculation of the regional average albedo requires surface downward radiation [34]. The data can be downloaded from the NCEP data website (https://psl.noaa.gov/data/gridded/data.ncep.reanalysis.html (accessed on 5 December 2020)). Because the spatial resolution of the NCEP reanalysis data is inconsistent with that of the albedo data, this paper used the nearest-neighbor interpolation to interpolate all NCEP reanalysis data to the same resolution of 0.05° as MODIS data.

3.1.3. Vegetation Coverage Data

The vegetation cover uses the global land cover data GlobeLand30 developed by China in 2020 with a spatial resolution of 30 m (http://www.webmap.cn/mapDataAction.do?method=globalLandCover (accessed on 3 November 2020)). The data covers the land range of 80 degrees north-south latitude, including 10 surface coverage types: cultivated land, forest, grassland, shrub land, wetland, water body, tundra, artificial surface, bare land and, glacier and snow.

3.2. Research Methods

3.2.1. Calculation of Surface Albedo

The true albedo (blue sky albedo) is approximately equal to the weighted combination of the black sky albedo and the white sky albedo [48], and the surface albedo can be used the following formula calculates:
α = ( 1 f d i f ) BSA + f d i f WSA
f d i f = DD v + DD n DD v + DD n + BD v + BD n
where BSA and WSA are the black sky albedo and white sky albedo, f d i f is the diffuse skylight ratio, and DD v , DD n , BD v , and BD n are the visible diffuse downward solar flux, near IR diffuse downward solar flux, visible beam downward solar flux and near IR beam downward solar flux, respectively.

3.2.2. Calculation of Regional Average Albedo

The monthly average surface albedo of an area is calculated according to Equation (3) [34]. For Equation (3), we need to consider the downward radiation.
α ¯ = A i F d i [ ( 1 f d i f i ) BSA i + f d i f i WSA i ] A i F d i
where α ¯ is the spatially aggregated shortwave albedo. For pixel i , A i is the area of the pixel, F d i is the surface downward radiation under all-sky condition, BSA i and WSA i are the BSA and WSA, respectively.

3.2.3. Trend Analysis

In this paper, the univariate linear regression method is used to estimate the interannual change rates of surface albedo, NDVI and snow cover in the QM in the past 20 years. The calculation formula of the change rate θ s l o p e is as follows:
θ s l o p e = n i = 1 n ( i α i ) ( i = 1 n i ) i = 1 n α i n i = 1 n i 2 ( i = 1 n i ) 2
where n is the total number of years in the study period, and α i is the mean value of the variable in year i . θ s l o p e   > 0 means that the change of the variable in n years is an increasing trend; on the contrary, θ s l o p e   < 0 means that the variable is in a decreasing trend. Then, at the confidence level of 0.05, the F-test method is used to test the significance of the change trend of each pixel.

4. Results

4.1. Multi-Year Average Characteristics of Surface Albedo

First, the albedo data of the QM from 2001 to 2020 was used to calculate the monthly average data, and then the multi-year average and spring (March–May), summer (June–August), autumn (September–November), and winter (December–February of the following year) surface albedo was synthesized. The multi-year average surface albedo represents the overall albedo situation of the QM. According to the results shown in Figure 2a, the multi-year average surface albedo of the QM is about 0.25, showing obvious differences in the spatial distribution. The whole surface albedo increases with altitude, and the surface albedo at northwest is high and the southeast is low. The areas with a high-value of surface albedo are mainly distributed in the Daxue Mountain, Shulenan Mountain, Danghenan Mountain, Tergun Daban Mountain, Hark Mountain, and Lenglongling Mountain, etc., showing a northwest-southeast trend similar to the trend of the mountains. Meanwhile, the land cover is mainly desert, bare rock, glacier, and snow, and the surface albedo value is between 0.4 and 0.6. The areas with a low value of surface albedo are mainly distributed at Qinghai Lake, Har Lake, Laji Mountain, and Heihe River Basin, with values between 0.05 and 0.1. The land cover is dominated by lakes, rivers, and high vegetation coverage. Since the lake is similar to a black body and has a strong ability to absorb short waves, Qinghai Lake is the area with a minimum surface albedo.
Then, the standard deviation of the surface albedo was used to represent the degree of abnormality and deviation of the surface albedo from the average value. It can be seen from Figure 2b that the surface albedo sensitive areas in the QM are mainly distributed in the alpine belts of the Tergun Daban Mountain, Hark Mountain, Qaidam Mountain, and Zhongwunong Mountain. Also, the surface albedo has been relatively stable over the past 20 years in the Heihe River Basin, Shiyang River Basin, Laji Mountain, the vicinity of the Qinghai Lake, and the west of Qaidam Mountain with low elevations.
The spatial distribution of the multi-year average surface albedo in the QM in different seasons was further analyzed. As shown in Figure 3, the surface albedo in the QM is high in the west and low in the east in all four seasons, but there are differences in different seasons. The average values of surface albedo in spring, summer, autumn, and winter in the QM are 0.25, 0.18, 0.24, and 0.30, respectively, and the variation curve is in a single-valley “V” shape. It is the smallest in summer and the largest in winter. The spatial distribution of surface albedo in spring and autumn is similar, but the surface albedo is slightly higher in spring. As shown in Figure 3b, the spatial distribution of surface albedo in summer is different from other seasons. The number of areas with a high surface albedo is obviously smaller than that in other seasons. In the Shulenan Mountain and Tergun Daban Mountain, the overall spatial distribution of surface albedo is high in the west and low in the east, which is consistent with the spatial distribution in other seasons. The areas with a high surface albedo in winter are similar to those in spring and autumn. They are concentrated in Daxue Mountain, Shulenan Mountain, Danghenan Mountain, and Tergun Daban Mountain in the west and Lenglongling Mountain in the east. However, the areas with a high surface albedo in winter cover a wider range.

4.2. Annual Variation Characteristics of Surface Albedo in the QM

As shown in Figure 4, the annual variation of the average surface albedo for many years exhibits a “U” shaped, with the “left valley slope” indicating the variation from January to July, the “valley bottom” indicating the variation from July and August, and the “right valley slope” indicating the variation from September to December. The surface albedo was the largest in January and the smallest in August, with a value of 0.31 and 0.17, respectively. It can be seen from the variation trend line that the change slopes from January to August and August to December are respectively −0.02 and 0.03. The surface albedo shows a slow downward trend from January to August and reaches the minimum value in August, and the albedo in July and August is not much different; then, it shows a strong upward trend from September to November and then slowly rises, reaching the maximum in January of the following year.
The influence of the factors (i.e., NDVI and snow cover) on the annual change of surface albedo in the QM were further analyzed. Figure 5a shows that the annual change trend of snow cover and surface albedo is consistent, and there is a significant positive correlation between the two at the 0.01 level (both sides), with a correlation coefficient of 0.96. When the snow cover gradually decreases from January to August, the surface albedo also decreases slowly; when the snow cover increases rapidly from August to December, the surface albedo also increases rapidly. The annual change of NDVI shows a trend of increasing first and then decreasing, which is opposite to the variation trend of surface albedo (Figure 5b). Through Pearson correlation analysis, it was found that the annual change of surface albedo is significantly correlated with that of NDVI at the 0.01 level (both sides), with a correlation coefficient of −0.91. In autumn, the vegetation begins to turn yellow and new snowfall occurs, and the surface albedo gradually increases and peaks in January of the following year. The above analysis results show that the annual change of surface albedo is positively related to surface cover and negatively related to NDVI.

4.3. Characteristics of Interannual Variation of Surface Albedo in QM

The annual average value of surface albedo, snow cover, and NDVI in the QM from 2001 to 2020 was calculated to obtain the interannual variation trend (Figure 6). It can be seen that the annual average surface albedo in the QM shows a slight upward trend, with a change rate of 5.0 × 10⁻³/10a. Since the surface albedo reached the minimum and maximum respectively in 2001 and 2019, the annual average surface albedo of the QM from 2001 to 2020 showed a significant upward trend. However, the growth rate differs in different time periods. The change rate of from 2001 to 2010 and from 2010 to 2020 is 1.5 × 10²/10a and 2.7 × 10²/10a, respectively. From 2001 to 2010, the surface albedo showed an “up-down-up-down” fluctuation; from 2010 to 2013, the surface albedo decreased substantially; from 2016 to 2019, the surface albedo showed a strong upward trend. Overall, the surface albedo fluctuated significantly in the last 10 years (Figure 6a).
The snow cover rate in the QM showed a slight upward trend in general from 2001 to 2020, with a change rate of 0.75/10a. It reached the minimum and maximum in 2001 and 2019, respectively. The snow cover rate increased from 2001 to 2010 with a change rate of 3.6/10a, which is slightly smaller than that from 2010 to 2020 (i.e., 4.8/10a). From 2001 to 2004 and from 2013 to 2015, there were two rising periods of snow cover rate. From 2010 to 2013, the snow cover showed a significant downward trend (Figure 6b), which is consistent with the research results of Liang et al. (2019) on the temporal and spatial variation of snow cover in the QM [49]. The comparison of the interannual changes of surface albedo and snow cover indicates that the two change trends are highly consistent. Through Pearson correlation analysis, it was found that there is a significant positive correlation between the surface albedo and snow cover rate, with a correlation coefficient of 0.95. The indicates that the interannual variation of the surface albedo in the QM is largely affected by the snow cover changes.
The NDVI in the QM changed significantly from 2001 to 2020. It continued to increase and reached the maximum in 2018, with a 20-year change rate of 0.02/10a. There was a strong upward trend in NDVI from 2001 to 2005 and 2008 to 2010, and a slight downward trend from 2005 to 2008 and 2012 to 2016 (Figure 6c). This result is consistent with the observation of Zhang et al. (2021) in analyzing the variation trend of NDVI in the QM during the growing season. Through Pearson correlation analysis, it was found that there is a weak positive correlation between the surface albedo and NDVI, with a correlation coefficient of 0.12. When the linear trend of the two is eliminated, the surface albedo and NDVI are negatively correlated (r = −0.02). In addition, the spatial resolution of the surface albedo and NDVI data is still low, which may not accurately describe the interannual fluctuations of the surface conditions in the QM, resulting in a weak positive correlation between the two in this region [5]. Since the interannual variation cannot fully reflect the relationship between the surface albedo and NDVI, it is necessary to further explore their relationship by using high-precision remote sensing data.

4.4. Spatial Variation Trend of Surface Albedo in QM

The univariate linear regression method was used to calculate the interannual variation trends of the annual average surface albedo, NDVI, and snow cover in the QM. Meanwhile, the F-test method was employed to test the significance of the variation trend of each pixel at a confidence level of 0.05. As shown in Figure 7, the interannual variation of the average annual surface albedo in the QM shows obvious spatial heterogeneity, and the areas with a decreasing annual surface albedo are mainly distributed in the edge of the QM, such as the Qinghai Nanshan, the Shule River Basin, and the Heihe River Basin, accounting for about 39.6% of the total area. Most regions show an increasing trend, and the areas with increased annual surface albedo are mainly distributed in Hark Mountain, Shulenan Mountain, Tulainan Mountain, Tulai Mountain, Datong Mountain and Daban Mountain, accounting for about 60.4% of the total area. Besides, the insignificant areas account for 85.7% of the total area, while the significant areas only account for 14.3% of the total area. The areas with significantly increased annual surface albedo are located in the Tulai Mountain, Datong Mountain and Daban Mountain, accounting for 8.2% of the total area, and areas with significantly decreased annual surface albedo are located in the Qinghainan Mountain, Shule River Basin, and Heihe River Basin, accounting for 6.1% of the total area (Figure 7b).

4.5. Analysis of Influencing Factors of Surface Albedo at a Spatial Scale

Section 4.3 discusses the influencing factors for the regional average interannual variation of the surface albedo. This part focuses on the analysis of the spatially influencing factors of the surface albedo variation. The surface albedo of the QM is not only sensitive to changes in vegetation and snow cover, but also has a differentiation law with changes in terrain such as altitude. To analyze the distribution characteristics of surface albedo and the influencing factors in QM with different altitude gradients, the surface albedo and the influencing factors were divided according to the altitude of QM at an interval of 500 m (Figure 8). With the increase of altitude, the vertical distribution of surface albedo, snow cover, and vegetation cover in the QM changes significantly. A total of 81.8% of the QM are located at the altitude of 3000–4500 m. Overall, the surface albedo and snow cover increase with the increase of altitude; the NDVI shows a trend of first increase and then decrease with the increase of altitude; the snow cover dominates the spatial variation of surface albedo. Further research found that the vertical changes of the surface albedo and its influencing factors in different seasons are consistent with the average vertical changes in many years. There are significant positive correlations between albedo and snow cover and elevation. Therefore, altitude is another important influencing factor of the surface albedo variation in the QM. It is worth noting that when the altitude exceeds 4500 m, the increment rate of surface albedo in winter is not as obvious as that in other seasons. Compared with Figure 9b, it is found that the snow cover rate in winter also decreases in high altitude areas, and it is even smaller than that in other seasons. This may be the reason why the surface albedo in winter is lower than that in spring in the area above 5000 m above sea level.
The spatial distribution of the interannual variation trend of snow cover has a good correspondence with the surface albedo. Specifically, the significant increase in snow cover is distributed in the south of Har Lake, the south of Qinghai Lake, Tulai Mountain, Datong Mountain, and Daban Mountain (as shown in Figure 10a), and the surface albedo also shows an increasing trend in these regions. This indicates that snow cover is an influencing factor of the significant increase in surface albedo in the central QM. Comparing the interannual variation trend of surface albedo and NDVI (Figure 10b), it is found that the spatial distribution of surface albedo and the interannual variation trend of NDVI also has a good correspondence: the areas with improved vegetation coverage is almost the same as those with reduced surface albedo. This suggests that the changes in the vegetation cover in these regions is also an important factor of surface albedo changes.
The distribution of spatial correlation coefficients between surface albedo and influencing factors (Figure 11) shows that snow cover and vegetation have significant feedback on the changes of surface albedo. Surface albedo is significantly positively correlated with snow cover in most parts of the QM but negatively correlated with NDVI (Figure 11). Specifically, the surface albedo and snow cover rate are significantly positively correlated (with a correlation coefficient higher than 0.8) in the areas including Datong Mountain, Tulai Mountain, Hark Mountain, Zhongwunong Mountain, and the west of Tergun Daban Mountain (Figure 11a), accounting for about 72% of the total area. The areas showing a negative correlation between surface albedo and NDVI are distributed in the Shule Lake Basin, Heihe River Basin, Qinghainan Mountain, etc. (Figure 11b), which correspond to the areas with significantly improved vegetation coverage. Besides, there are sporadic positive correlations near the Qaidam Basin and Qinghai Lake, and these areas may have a combined effect of vegetation and snow cover on surface albedo changes [6]. Combining Figure 7b and Figure 10b, it is found that an increase in NDVI in the low vegetation coverage area in the northern QM contributes to a decrease in albedo.

5. Conclusions and Discussion

In this paper, the temporal and spatial dynamic distribution of surface albedo and its influencing factors in the QM from 2001 to 2020 are analyzed by using the MODIS MCD43C3 V006 product, combined with snow cover and NDVI data. The following conclusions are drawn.
(1)
The multi-year average surface albedo in the QM is about 0.25, and there are obvious differences in the spatial distribution. Overall, the surface albedo increases with the altitude, and it is high in the west and low in the east. The areas with significant interannual changes include Daxue Mountain, Tulainan Mountain, Tergun Daban Mountain, Shulenan Mountain, and other high-value areas.
(2)
The spatial distribution of surface albedo in the QM differs in different seasons. The order of surface albedo in the four seasons is winter > spring > autumn > summer, where the spatial distribution of surface albedo in spring and autumn is similar.
(3)
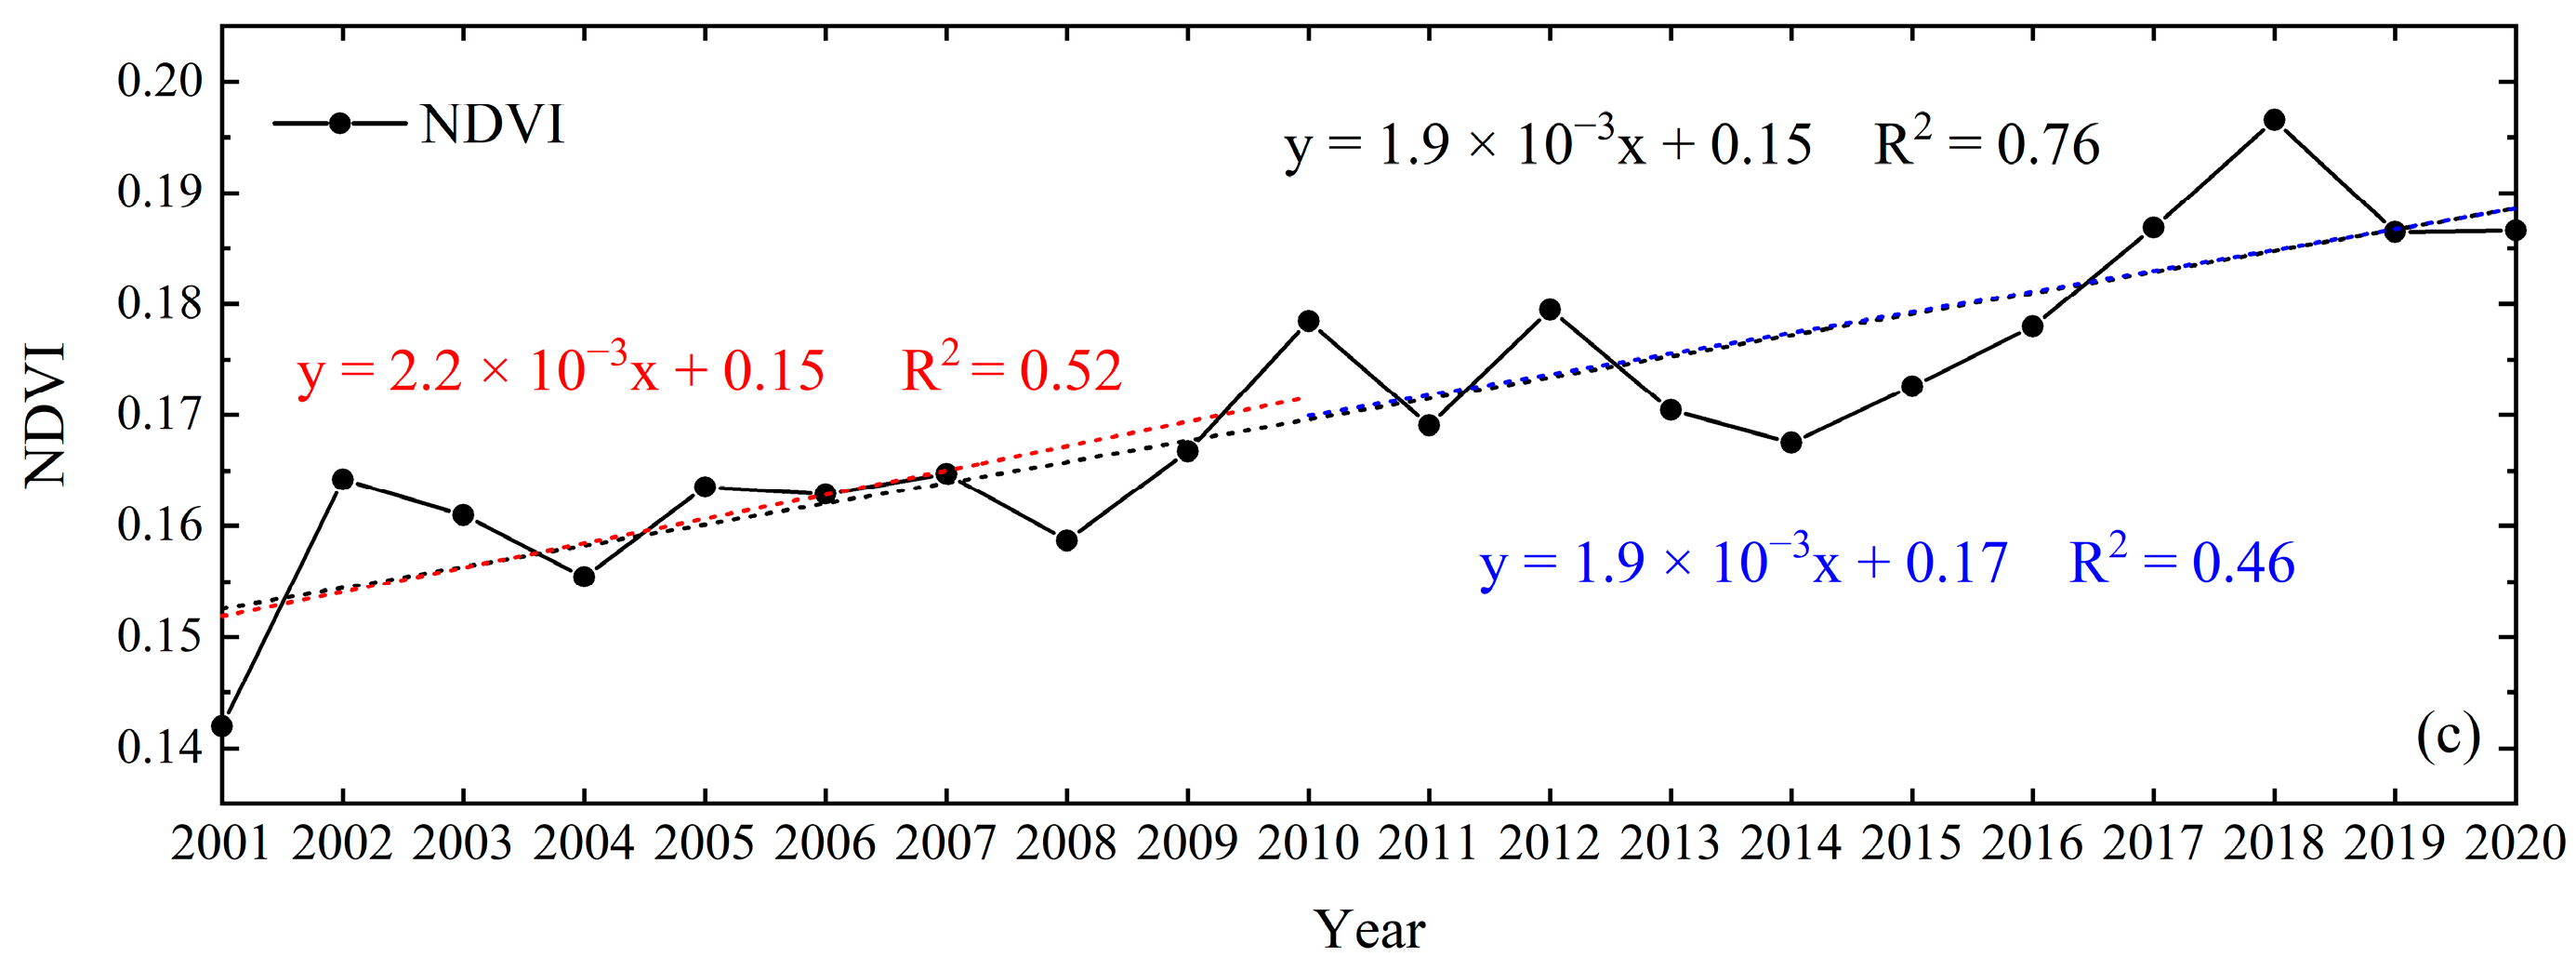
From 2001 to 2020, the interannual variation of the annual average surface albedo in the QM showed a slight upward trend, with a change rate of 5.0 × 10⁻³/10a. The fluctuation of the surface albedo in the study period was obviously more significant than that in the previous 10 years. Snow cover showed a slight increase during this period, and there was a significant positive correlation between surface albedo and snow cover rate. NDVI showed a significant upward trend, indicating that the overall vegetation was improving. Before removing the linear trend of the surface albedo and NDVI, there was a weak positive correlation between the two; when the linear trend was removed, a negative correlation was found between the two.
(4)
The annual and interannual variations of the surface albedo in the QM are closely related to the surface cover. The annual variation of surface albedo is “U” shaped, with the largest variation in January and the smallest variation in August, which is positively correlated with snow cover and negatively correlated with NDVI. As for interannual variation, the increase of the regional average surface albedo is significantly related to the increase of snow cover. In terms of spatial distribution, the interannual variation of the surface albedo in most areas of the QM is mainly affected by the change of snow cover. The improvement of vegetation cover in marginal areas is the main factor of the significant decrease of surface albedo in these areas.
The MODIS surface albedo maintains a good consistency with the ground observations in most time periods, and the inversion accuracy is high [33,50]. Zhang et al. (2021) found that MODIS remote sensing data has good applicability in the QM, and it can be used to study the temporal and spatial changes of snow albedo. In the plateau area, the accuracy of MODIS surface albedo inversion results is not high enough, but after manual analysis and elimination of errors, the root mean square error of the surface observation results can be reduced to 0.00329, which can fully meet the accuracy requirements of climate and land surface process models [51]. In addition, long-time-series surface albedo datasets remove the uncertainty of trend analysis greatly, which is crucial for evaluating surface albedo trends [8].
The Earth’s surface comprehensively manifests various ground features and is complex and changeable, which makes the surface albedo vary greatly in space and time. NDVI is one of the most commonly used vegetation indices, which can accurately reflect characteristics such as vegetation cover density and growth [41,47]. When NDVI gradually increases from a small value, the surface albedo decreases rapidly. Then, as the NDVI continues to increase, the surface albedo decreases slowly. When NDVI > 0.5, the surface albedo almost does not change with the change of NDVI [52]. In addition, ice and snow are highly positively correlated with surface albedo. Usually, the albedo of old snow is 0.7–0.8, and that of new snow is 0.8–0.9 [19]. As time passes, the new snow will be granulated, the grains will be deformed and continuously densified, the particle size will increase, and the pollution will deteriorate. The relationship between the albedo with ice and snow states is as follows: fresh snow > old snow > grain snow > glacier ice > contaminated glacier ice [5,52]. In recent years, under the warming and humidification in the plateau region, the significant changes in the surface cover have caused corresponding changes in the surface albedo, and the surface albedo will react to climate change, thus affecting the regional climate system substantially [2,5,8].
The change of surface albedo in different regions is closely related to the terrain and surface coverage [53]. This study mainly focuses on the relationship between surface albedo and its influencing factors (snow cover, vegetation, and altitude). However, different vegetation cover types make different contributions to surface albedo [54], and further investigation is needed to more accurately monitor vegetation dynamics and understand the impact of surface albedo on ecosystems. In recent years, the local ecological environment damage in the QM has attracted much attention. In response to the ecological problems in the QM, the state has successively adopted a number of remediation measures to strengthen ecological environment protection and ecological restoration in the QM. The rectification and supervision of human activities such as mineral resources development, tourism activities, grazing, and water and soil resources in the QM have achieved initial results. From 2001 to 2020, the vegetation in the QM showed significant improvement, mainly distributed in the Shule River Basin, the Heihe River Basin, and the relatively low-altitude mountains in the Qinghai Lake Basin. Meanwhile, the snow cover increased significantly in the relatively high-altitude Qinghainan Mountain, Datong Mountain, Daban Mountain, and other areas. The improvement of vegetation coverage will cause the surface albedo to decrease, and through the negative feedback of the surface albedo, it will further promote the vegetation, so that the albedo will continue to decrease. The increase of ice and snow coverage will cause the surface albedo to increase, and positive feedback will be formed between ice and snow, albedo and temperature. Based on this, the area of ice and snow will be further expanded, and the albedo will continue to increase. Besides, other factors, such as soil moisture and slope aspect, also affect the surface albedo, and future studies will investigate these factors with high-resolution data. Through the understanding of the surface albedo feedback mechanism, the relationship between climate change and human activities can be deeply understood, thereby providing a scientific basis for the win-win green development of ecological livelihoods in the QM.

Author Contributions

Conceptualization, G.P. and J.L.; methodology, G.P. and X.W.; software, J.L. and F.L.; validation, G.P., J.L. and Y.Z.; formal analysis, J.L.; data curation, J.L.; writing—original draft preparation, J.L.; writing—review and editing, G.P. and X.W.; visualization, J.L.; supervision, G.P. and X.W.; funding acquisition, G.P. and X.W. All authors have read and agreed to the published version of the manuscript.

Funding

This research was funded by the National Natural Science Foundation of China (Grants Nos. 42161025), the National Natural Science Foundation of China (U21A2006), the National Key Research and Development Program of China (2019YFC0507401), the Strategic Priority Research Program of Chinese Academy of Sciences (XDA20100102), the Natural Science Foundation of Gansu Province in China (20JR5RA405), and the Second Tibetan Plateau Scientific Expedition and Research Program (STEP) (2019QZKK0208).

Institutional Review Board Statement

Not applicable.

Informed Consent Statement

Not applicable.

Data Availability Statement

The data (the MCD43C3, MOD10CM, MOD13C2 products, and downward solar radiation reanalysis data) presented in this study are openly available in (NASA EOSDIS Land Processes DAAC), (NASA National Snow and Ice Data Center Distributed Active Archive Center), and (National Centers for Environmental Prediction) at (https://doi.org/10.5067/MODIS/MCD43C3.006), (https://doi.org/10.5067/MODIS/MOD13C2.006.), (https://doi.org/10.5067/MODIS/MOD10CM.061), and (https://psl.noaa.gov/data/gridded/data.ncep.reanalysis.html (accessed on 5 December 2020)), respectively.

Acknowledgments

The authors would like to acknowledge the National Aeronautics and Space Administration (NASA) for providing the MODIS MCD43C3, MOD10CM, and MOD13C2 products, and the National Centers for Environmental Prediction (NCEP) for the downward solar radiation reanalysis data.

Conflicts of Interest

The authors declare no conflict of interest.

References

  1. Liang, S.; Wang, K.; Zhang, X.; Wild, M. Review on estimation of land surface radiation and energy budgets from ground measurement, remote sensing and model simulations. IEEE J. Sel. Top. Appl. Earth Obs. Remote Sens. 2010, 3, 225–240. [Google Scholar] [CrossRef]
  2. Bonan, G.B. Forests and climate change: Forcings, feedbacks, and the climate benefits of forests. Science 2008, 320, 1444–1449. [Google Scholar] [CrossRef] [PubMed] [Green Version]
  3. Trenberth, K.E.; Fasullo, J.T.; Kiehl, J. Earth’s global energy budget. Bull. Am. Meteorol. Soc. 2009, 90, 311–324. [Google Scholar] [CrossRef]
  4. Wang, J.; Gao, F. Discussion on the problems on land surface albedo retrieval by remote sensing Data. Remote Sens. Technol. Appl. 2004, 19, 295–300. [Google Scholar]
  5. Li, Q.; Ma, M.; Wu, X.; Yang, H. Snow cover and vegetation-induced decrease in global albedo from 2002 to 2016. J. Geophys. Res. 2018, 123, 124–138. [Google Scholar] [CrossRef] [Green Version]
  6. Pang, G.; Chen, D.; Wang, X.; Lai, H. Spatiotemporal variations of land surface albedo and associated influencing factors on the Tibetan Plateau. Sci. Total Environ. 2022, 804, 150100. [Google Scholar] [CrossRef]
  7. Meng, X.; Lyu, S.; Zhang, T.; Zhao, L.; Li, Z.; Han, B.; Li, S.; Ma, D.; Chen, H.; Ao, Y. Simulated cold bias being improved by using MODIS time-varying albedo in the Tibetan Plateau in WRF model. Environ. Res. Lett. 2018, 13, 044028. [Google Scholar] [CrossRef]
  8. Li, X.; Zhang, H.; Qu, Y. Land surface albedo variations in SanJiang plain from 1982 to 2015: Assessing with glass data. Chin. Geogr. Sci. 2020, 30, 876–888. [Google Scholar] [CrossRef]
  9. Charney, J.; Stone, P.H.; Quirk, W.J. Drought in the Sahara: A biogeophysical feedback mechanism. Science 1975, 187, 434–435. [Google Scholar] [CrossRef] [Green Version]
  10. Hall, A. The role of surface albedo feedback in climate. J. Clim. 2004, 17, 1550–1568. [Google Scholar] [CrossRef] [Green Version]
  11. Chapin III, F.S.; Sturm, M.; Serreze, M.C.; McFadden, J.P.; Key, J.R.; Lloyd, A.H.; McGuire, A.D.; Rupp, T.S.; Lynch, A.H.; Schimel, J.P.; et al. Role of land-surface changes in Arctic summer warming. Science 2005, 310, 657–660. [Google Scholar] [CrossRef] [PubMed]
  12. Courel, M.F.; Kandel, R.S.; Rasool, S.I. Surface albedo and the Sahel drought. Nature 1984, 307, 528–531. [Google Scholar] [CrossRef]
  13. Ghimire, B.; Williams, C.A.; Masek, J.; Gao, F.; Wang, Z.; Schaaf, C.; He, T. Global albedo change and radiative cooling from anthropogenic land cover change, 1700 to 2005 based on MODIS, land use harmonization, radiative kernels, and reanalysis. Geophys. Res. Lett. 2014, 41, 9087–9096. [Google Scholar] [CrossRef]
  14. Moody, E.G.; King, M.D.; Schaaf, C.B.; Hall, D.K.; Platnick, S. Northern Hemisphere five-year average (2000–2004) spectral albedos of surfaces in the presence of snow: Statistics computed from Terra MODIS land products. Remote Sens. Environ. 2007, 111, 337–345. [Google Scholar] [CrossRef]
  15. Warren, S.G. Optical properties of snow. Rev. Geophys. 1982, 20, 67–89. [Google Scholar] [CrossRef]
  16. Lin, X.; Wen, J.; Liu, Q.; You, D.; Wu, S.; Hao, D.; Xiao, Q.; Zhang, Z.; Zhang, Z. Spatiotemporal variability of land surface albedo over the Tibet Plateau from 2001 to 2019. Remote Sens. 2020, 12, 1188. [Google Scholar] [CrossRef] [Green Version]
  17. Bond, T.C.; Doherty, S.J.; Fahey, D.W.; Forster, P.M.; Berntsen, T.; DeAngelo, B.J.; Flanner, M.G.; Ghan, S.; Kärcher, B.; Koch, D.; et al. Bounding the role of black carbon in the climate system: A scientific assessment. J. Geophys. Res. 2013, 118, 5380–5552. [Google Scholar] [CrossRef]
  18. Takeuchi, N.; Matsuda, Y.; Sakai, A.; Fujita, K. A large amount of biogenic surface dust (cryoconite) on a glacier in the Qilian Mountains, China. Bull. Glaciol. Res. 2005, 22, 1–8. [Google Scholar]
  19. Zhang, R.; Wang, H.; Fu, Q.; Rasch, P.J.; Wang, X. Unraveling driving forces explaining significant reduction in satellite-inferred Arctic surface albedo since the 1980s. Proc. Natl. Acad. Sci. USA 2019, 116, 23947–23953. [Google Scholar] [CrossRef] [Green Version]
  20. Pithan, F.; Mauritsen, T. Arctic amplification dominated by temperature feedbacks in contemporary climate models. Nat. Geosci. 2014, 7, 181–184. [Google Scholar] [CrossRef]
  21. Zhu, Z.; Piao, S.; Myneni, R.B.; Huang, M.; Zeng, Z.; Canadell, J.G.; Ciais, P.; Sitch, S.; Friedlingstein, P.; Zeng, N.; et al. Greening of the Earth and its drivers. Nat. Clim. Chang. 2016, 6, 791–795. [Google Scholar] [CrossRef]
  22. Zheng, L.; Zhao, G.; Dong, J.; Ge, Q.; Tao, J.; Zhang, X.; Qi, Y.; Doughty, R.B.; Xiao, X. Spatial, temporal, and spectral variations in albedo due to vegetation changes in China’s grasslands. ISPRS J. Photogramm. Remote Sens. 2019, 152, 1–12. [Google Scholar] [CrossRef]
  23. Betts, R.A. Offset of the potential carbon sink from boreal forestation by decreases in surface albedo. Nature 2000, 408, 187–190. [Google Scholar] [CrossRef] [PubMed]
  24. Davin, E.L.; de Noblet-Ducoudré, N. Climatic impact of global-scale deforestation: Radiative versus nonradiative processes. J. Clim. 2010, 23, 97–112. [Google Scholar] [CrossRef]
  25. Jiao, T.; Williams, C.A.; Ghimire, B.; Masek, J.; Gao, F.; Schaaf, C. Global climate forcing from albedo change caused by large-scale deforestation and reforestation: Quantification and attribution of geographic variation. Clim. Chang. 2017, 142, 463–476. [Google Scholar] [CrossRef]
  26. Zeng, Z.; Wang, D.; Yang, L.; Wu, J.; Ziegler, A.D.; Liu, M.; Ciais, P.; Searchinger, T.D.; Yang, Z.; Wood, E.F.; et al. Deforestation-induced warming over tropical mountain regions regulated by elevation. Nat. Geosci. 2021, 14, 23–29. [Google Scholar] [CrossRef]
  27. Li, X.; Gou, X.; Wang, N.; Sheng, Y.; Jin, H.; Qi, Y.; Song, X.; Hou, F.; Li, Y.; Niu, X.; et al. Tightening ecological management facilitates green development in the Qilian Mountains. Chin. Sci. Bull. 2019, 64, 2928–2937. (In Chinese) [Google Scholar]
  28. Wang, X.; Pang, G.; Yang, M.; Wan, G.; Liu, Z. Precipitation changes in the Qilian Mountains associated with the shifts of regional atmospheric water vapour during 1960–2014. Int. J. Climatol. 2018, 38, 4355–4368. [Google Scholar] [CrossRef]
  29. Sun, M.; Liu, S.; Yao, X.; Guo, W.; Xu, J. Glacier changes in the Qilian Mountains in the past half-century: Based on the revised First and Second Chinese Glacier Inventory. J. Geogr. Sci. 2018, 28, 206–220. [Google Scholar] [CrossRef] [Green Version]
  30. Wang, T.; Gao, F.; Wang, B.; Wang, P.; Wang, Q.; Song, H.; Yin, C. Status and suggestions on ecological protection and restoration of Qilian Mountains. J. Glaciol. Geocryol. 2017, 39, 229–234. [Google Scholar]
  31. Li, Z.; Feng, Q.; Li, Z.; Wang, X.; Gui, J.; Zhang, B.; Li, Y.; Deng, X.; Xue, J.; Liang, P.; et al. Reversing conflict between humans and the environment-The experience in the Qilian Mountains. Renew. Sustain. Energy Rev. 2021, 148, 111333. [Google Scholar]
  32. Feng, Z.M.; Wen, J.G.; Xiao, Q. Comparison of global albedo products of MODIS V006 and V005 based on FLUXNET. J. Remote Sens. 2018, 22, 97–109. (In Chinese) [Google Scholar]
  33. Cescatti, A.; Marcolla, B.; Vannan, S.K.S.; Pan, J.Y.; Román, M.O.; Yang, X.; Ciais, P.; Cook, R.B.; Law, B.E.; Matteucci, E.; et al. Intercomparison of MODIS albedo retrievals and in situ measurements across the global FLUXNET network. Remote Sens. Environ. 2012, 121, 323–334. [Google Scholar] [CrossRef] [Green Version]
  34. He, T.; Liang, S.; Song, D.X. Analysis of global land surface albedo climatology and spatial-temporal variation during 1981–2010 from multiple satellite products. J. Geophys. Res. 2014, 119, 10281–10298. [Google Scholar] [CrossRef]
  35. Mira, M.; Weiss, M.; Baret, F.; Courault, D.; Hagolle, O.; Gallego-Elvira, B.; Olioso, A. The MODIS (collection V006) BRDF/albedo product MCD43D: Temporal course evaluated over agricultural landscape. Remote Sens. Environ. 2015, 170, 216–228. [Google Scholar] [CrossRef] [Green Version]
  36. Wang, Z.; Schaaf, C.B.; Sun, Q.; Shuai, Y.; Román, M.O. Capturing rapid land surface dynamics with Collection V006 MODIS BRDF/NBAR/Albedo (MCD43) products. Remote Sens. Environ. 2018, 207, 50–64. [Google Scholar] [CrossRef]
  37. Jiang, X.; Wang, N.; Pu, J.; He, J.; Chen, L. Variations of albedo and spectral reflectance on Qiyi Glacier in Qilian Mountains during the ablation season. Sci. Cold Arid. Reg. 2009, 1, 59–70. [Google Scholar]
  38. Zhang, T.; Gao, T.; Diao, W.; Zhang, Y. Snow/ice albedo variation and its impact on glacier mass balance in the Qilian Mountains. J. Glaciol. Geocryol. 2021, 43, 145–157. [Google Scholar]
  39. Tian, H.; Yang, T.; Liu, Q. Climate change and glacier area shrinkage in the Qilian mountains, China, from 1956 to 2010. Ann. Glaciol. 2014, 55, 187–197. [Google Scholar] [CrossRef] [Green Version]
  40. Qian, D.; Du, Y.; Li, Q.; Guo, X.; Cao, G. Alpine grassland management based on ecosystem service relationships on the southern slopes of the Qilian Mountains, China. J. Environ. Manag. 2021, 288, 112447. [Google Scholar] [CrossRef]
  41. Zhang, L.; Yan, H.; Qiu, L.; Cao, S.; He, Y.; Pang, G. Spatial and temporal analyses of vegetation changes at multiple time scales in the Qilian Mountains. Remote Sens. 2021, 13, 5046. [Google Scholar] [CrossRef]
  42. Filonchyk, M.; Hurynovich, V. Validation of MODIS aerosol products with AERONET measurements of different land cover types in areas over Eastern Europe and China. J. Geovisualization Spat. Anal. 2020, 4, 10. [Google Scholar] [CrossRef]
  43. Schaaf, C.; Wang, Z. MCD43C3 MODIS/Terra+Aqua BRDF/Albedo Albedo Daily L3 Global 0.05Deg CMG V006. NASA EOSDIS Land Processes DAAC 2015. [Google Scholar] [CrossRef]
  44. Hall, D.K.; Riggs, G.A. MODIS/Terra Snow Cover Monthly L3 Global 0.05Deg CMG; Version 6.1; NASA National Snow and Ice Data Center Distributed Active Archive Center: Boulder, CO, USA, 2021. [Google Scholar]
  45. Didan, K. MOD13C2 MODIS/Terra Vegetation Indices Monthly L3 Global 0.05Deg CMG V006. NASA EOSDIS Land Processes DAAC 2015. [Google Scholar] [CrossRef]
  46. Kalnay, E.; Kanamitsu, M.; Kistler, R.; Collins, W.; Deaven, D.; Gandin, L.; Iredell, M.; Saha, S.; White, G.; Woollen, J.; et al. The NCEP/NCAR 40-year reanalysis project. Bull. Am. Meteorol. Soc. 1996, 77, 437–472. [Google Scholar] [CrossRef] [Green Version]
  47. Pang, G.; Wang, X.; Yang, M. Using the NDVI to identify variations in, and responses of, vegetation to climate change on the Tibetan Plateau from 1982 to 2012. Quat. Int. 2017, 444, 87–96. [Google Scholar] [CrossRef]
  48. Yang, W.; Wang, Y.; Liu, X.; Zhao, H.; Shao, R.; Wang, G. Evaluation of the rescaled complementary principle in the estimation of evaporation on the Tibetan Plateau. Sci. Total Environ. 2020, 699, 134367. [Google Scholar] [CrossRef]
  49. Liang, P.; Li, Z.; Zhang, H. Temporal-spatial variation characteristics of snow cover in Qilian Mountains from 2001 to 2017. Arid Land Geogr. 2019, 42, 56–66. [Google Scholar]
  50. Rongali, G.; Keshari, A.K.; Gosain, A.K.; Khosa, R. Split-window algorithm for retrieval of land surface temperature using Landsat 8 thermal infrared data. J. Geovisualiz. Spat. Anal. 2018, 2, 14. [Google Scholar] [CrossRef]
  51. Chen, A.; Meng, W.; Hu, S.; Bian, L. Comparative analysis on land surface albedo from MODIS and GLASS over the Tibetan Plateau. Trans. Atmos Sci 2020, 43, 932–942. [Google Scholar]
  52. Xiao, D.; Tao, F.; Moiwo, J.P. Research progress on surface albedo under global change. Adv. Earth Sci. 2011, 26, 1217. [Google Scholar]
  53. Hu, Y.; Hou, M.; Zhao, C.; Zhen, X.; Yao, L.; Xu, Y. Human-induced changes of surface albedo in Northern China from 1992-2012. Int. J. Appl. Earth Obs. Geoinf. 2019, 79, 184–191. [Google Scholar] [CrossRef]
  54. Wang, S.; Hu, Y.; Wang, S.; Shang, K.; Yan, D. Influence of the difference of plant functional types on surface albedo variation. Remote Sens. Technol. Appl. 2015, 30, 932–938. [Google Scholar]
Figure 1. (a) Topography of the QM and (b) the types of vegetation cover.
Remotesensing 14 01922 g001
Figure 2. Spatial distributions of (a) multi-year averaged land surface albedo and (b) standard deviation of annual averaged land surface albedo in the QM.
Remotesensing 14 01922 g002
Figure 3. Spatial distributions of multi-year averaged land surface albedo in the QM for (a) spring (March–May), (b) summer (June–August), (c) autumn (September–November), and (d) winter (December–February of the following year).
Remotesensing 14 01922 g003
Figure 4. Annual variation characteristics of the land surface albedo in the QM.
Remotesensing 14 01922 g004
Figure 5. Annual variations of land surface albedo and snow cover (a) and NDVI (b) in the QM.
Remotesensing 14 01922 g005
Figure 6. The inter-annual variations of regional averaged land surface albedo (a), snow cover (b), and NDVI (c) in the QM.
Remotesensing 14 01922 g006aRemotesensing 14 01922 g006b
Figure 7. Spatial distributions of (a) interannual trend of land surface albedo and (b) the areas with the trend that passed the significance test at the 0.05 level in the QM.
Remotesensing 14 01922 g007
Figure 8. The vertical distributions of regionally annual average land surface albedo snow cover, and NDVI in the QM.
Remotesensing 14 01922 g008
Figure 9. The vertical distributions of (a) land surface albedo and its influencing factors ((b) snow cover and (c) NDVI) in four seasons in the QM.
Remotesensing 14 01922 g009aRemotesensing 14 01922 g009b
Figure 10. Spatial distributions of interannual trends of annual average (a) snow cover and (b) NDVI showing the interannual change rates that passed significance test at the 0.05 level in the QM.
Remotesensing 14 01922 g010
Figure 11. Spatial distributions of correlation coefficients between annual average land surface albedo and influencing factors ((a) snow cover and (b) NDVI) in the QM. The blank area in the study area indicates the area where the correlation coefficient fails the 0.05 significance level test.
Remotesensing 14 01922 g011
Table 1. The data sets used in this study.
ParameterDatasetSpatial ResolutionTemporal ResolutionReferences
AlbedoMCD43C30.05°Daily[43]
Snow coverMOD10CM0.05°Monthly[44]
NDVIMOD13C20.05°Monthly[45]
Downward solar radiationNCEPT62 Gaussian grid 192 × 94Daily[46]
Publisher’s Note: MDPI stays neutral with regard to jurisdictional claims in published maps and institutional affiliations.

