Abstract
The net primary productivity (NPP) of vegetation holds a pivotal character for the global carbon balance as a key parameter for characterizing terrestrial ecological processes. The most commonly used indices for estimating vegetation NPP, for instance, the normalized difference vegetation index (NDVI), often suffer from saturation issues that can compromise the accuracy of NPP estimation. This research utilizes a new vegetation index based on the radial basis function (RBF) to estimate vegetation NPP in Chinese terrestrial ecosystems over the past two decades (2001–2020) and investigates the spatiotemporal variation characteristics of NPP and the driving mechanisms. The results indicate that the kernel vegetation index (kNDVI) can effectively alleviate the saturation problem and significantly improve the accuracy of NPP estimation compared to NDVI. Over the past two decades, the NPP of Chinese terrestrial vegetation ranged from 64.13 to 79.72 g C/m2, with a mean value of 72.75 g C/m2, showing a fluctuating upward trend. Changes in the NPP of terrestrial ecosystems in China are mainly affected by precipitation. The dominant factors influencing NPP changes varied over time and had different impacts. For instance, in the period of 2001–2005 the climate had a positive effect on NPP changes, with the dominant factors being evaporation and precipitation. However, in the period of 2010–2015 the dominant climate factors shifted to evaporation and temperature, and their effect on NPP changes became negative. The outcomes of this research aim to serve as a foundation for carbon cycle research and ecosystem environment construction in China.
1. Introduction
Net primary productivity (NPP) is the remaining portion of the total organic matter produced by photosynthesis per unit area of green vegetation per unit time, excluding its autotrophic respiration [1]. It straightforwardly indicates the productivity and quality of an ecosystem in the context of natural ambient conditions, and is one of the significant elements in deciding the carbon source/sink of an ecosystem [2,3]. In the current context of global climate change, the accurate and timely estimation of the NPP in China’s land ecosystems is critical to implementing the “Double Carbon Strategy” and the advancement of ecological civilization in the country [4].
The integration of remotely sensed data and ecological models has emerged as the primary method for large-scale vegetation NPP estimation owing to its broad coverage, low acquisition cost, and short revisit period. The models currently used for NPP estimation include statistical models, process models, and light energy efficiency models [5]. Statistical models typically rely on the vegetation index (VI) and leaf area index (LAI) for estimation, and the model data are relatively accessible. However, the physiological and ecological mechanisms underlying these models are not always well understood, which can lead to errors in the estimation results [6]. While process-based models, for example the Biome BioGeoChemical Cycles model (BIOME-BGC), Boreal Ecosystem Productivity Simulator (BEPS), Terrestrial Ecosystem Model (TEM), and Integrated Terrestrial Ecosystem C-budget model (InTEC), have clear mechanisms and produce more accurate NPP estimates, their model structures are relatively complexity and require numerous parameters, which can be challenging to scale up to the regional level [7,8,9,10]. Light energy efficiency models, such as the Carnegie–Ames–Stanford Approach (CASA) and Global Production Efficiency Model (GLO-PEM), have been developed [11,12,13], of which the CASA model is based on the theory of plant photosynthesis mechanism and has minimal dependence on ground measurement data. Additionally, the CASA model is relatively straightforward, with few input parameters and high ease of use and applicability, making it one of the most commonly utilized models for NPP estimation across various spatial scales [14].
Despite these advantages, the CASA model has deficiencies in simulating vegetation NPP, such as uncertainties in the estimation of vegetation light energy utilization. To address this, researchers have attempted to compensate for these deficiencies by constructing new water stress factors or correcting the maximum light energy utilization for ideal contexts, thereby improving the accuracy of vegetation NPP estimation [15,16,17]. Additionally, the nonlinear relationship between NDVI and vegetation NPP can be a limitation for accurate estimation of NPP using the CASA model [18,19]. However, the use of NDVI to estimate FPAR has two main issues. First, the relationship between NDVI and vegetation NPP is nonlinear and easily reaches saturation, which may affect the accuracy of NPP estimation. Second, NDVI is mainly reflective of vegetation leaf conditions rather than actual photosynthesis. Several studies have proposed using alternative vegetation indices that are less affected by saturation, such as the NDVI2 [20], red-edge normalized vegetation index [21], and enhanced vegetation index (EVI) [22]. While these methods may improve the estimation accuracy of vegetation NPP to an extent, they cannot fundamentally address the nonlinear relationship and saturation issues between vegetation indices and NPP. Solar-induced chlorophyll fluorescence (SIF) is a promising alternative to traditional reflectance-based vegetation indices, as it directly measures the fluorescence emitted by plants during photosynthesis [23]. Recently, SIF has been increasingly used as a tool for estimating vegetation carbon stocks due to its ability to directly measure plant photosynthetic activity. However, there remains much debate among scholars regarding the relationship between SIF and vegetation green biomass. Additionally, the spatial resolution of SIF is limited, with values ranging from 40 × 80 km2 to 0.05°, which makes it difficult to obtain detailed information on green vegetation biomass [24]. Therefore, the construction of a new remotely sensed vegetation index to improve the accuracy of NPP estimation by solving the problem of linearity and saturation is a pressing issue.
Previous research has attempted to improve the performance of vegetation indices using empirical or parameter transformations. However, these methods only construct new vegetation indices that try to utilize information from bands other than the NIR and red bands, and it is not clear whether all available information is being used. Moreover, these methods fail to address the saturation problem that occurs in vegetation indices. In contrast, the kernel function approach takes a machine learning perspective and can derive nonlinear approaches from linear algorithms while remaining reliant on linear arithmetic for operations [25]. This approach is universal, meaning that any index of kernel vegetation embedded in a Gaussian kernel can optimize the use of spectral information, leading to lower uncertainty in the propagation of kernelized vegetation indices compared to non-kernelized ones.
Therefore, in this study, a new vegetation index is used to address the saturation phenomenon in estimating the vegetation NPP of Chinese terrestrial ecosystems over the past two decades, then the Theil–Sen median and Mann–Kendall trend are used to explore the trends of vegetation NPP in Chinese terrestrial ecosystems. Second-order partial correlation, multiple correlation analysis, the differential equation method, and the PLS-SEM method are used to analyze the role of each influencing factor on the change in vegetation NPP in Chinese terrestrial ecosystems. This study can provide a valuable scientific reference for ecological environmental conservation, carbon cycle, and resource allocation research in China.
2. Research Region and Data
2.1. Research Region
China is located in the southeastern part of Eurasia, along the western coast of the Pacific Ocean, and is characterized by a strong thermal contrast between land and sea [26,27] (Figure 1). China possesses the world’s most typical monsoon climate zone, with high temperatures and heavy precipitation in summer and cold and poor precipitation in winter, when the high-temperature period coincides with the rainy period [28]. China is home to a rich diversity of vegetation types, ranging from cold boreal coniferous forests to warm subtropical broadleaf evergreen forests and tropical rainforests. The main vegetation types include broadleaf evergreen forests, deciduous broadleaf forests, coniferous forests, grasslands, and deserts [29]. These unique characteristics make China an important area for ecological research and natural resource management.
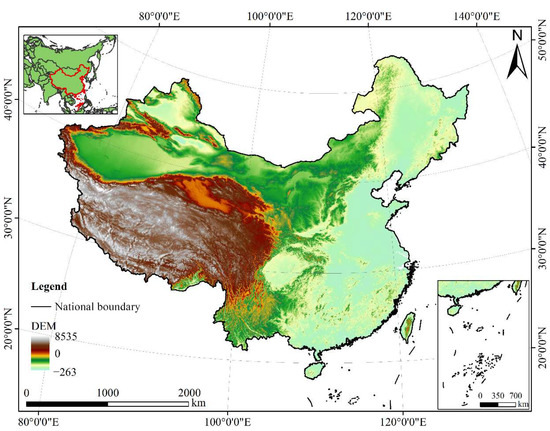
Figure 1.
Map of the research region.
2.2. Material and Processing
(1) Remote-sensing data
For the research, the remote sensing data we required included vegetation-type data and NDVI data. Vegetation-type data images with a spatial resolution of 500 m (Figure 2) were retrieved from https://lpdaac.usgs.gov (accessed on 10 August 2022) and were maintained by the NASA EOSDIS Land Processes Distributed Activity Archive Center (LP DAAC) at the USGS Earth Resources Observation and Science (EROS) Center (https://doi.org/10.5067/MODIS/MCD12Q1.006, accessed on 10 August 2022). The vegetation-type data were then reclassified into thirteen categories according to the needs of the study (Table 1). The spatial distribution dataset of China’s monthly 1 km vegetation index (NDVI) was based on the ten-day 1 km vegetation index data of SPOT/VEGETATION PROBA-V 1 km PRODUCTS (http://www.vito-eodata.be, accessed on 6 June 2022) using the maximum value synthesis method.
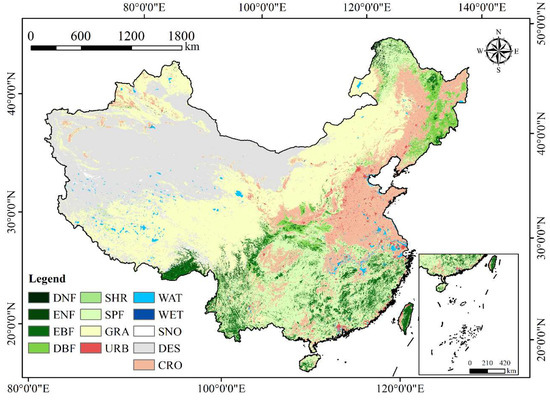
Figure 2.
Spatial arrangement of vegetation types in China.

Table 1.
Reclassified vegetation types.
(2) Meteorological data
This research required the following meteorological data: monthly average temperature, monthly total precipitation, monthly total solar radiation, and potential evapotranspiration data. The temperature, precipitation, and evaporation data were obtained from National Earth System Science Data Center and National Science and Technology Infrastructure of China (http://www.geodata.cn, accessed on 2 September 2022), with a spatial resolution of 1 km. The solar radiation data were obtained from the European Centre for Medium-Range Weather Forecasts (ECMWF) (https://doi.org/10.24381/cds.68d2bb30, accessed on 30 August 2022), with a spatial resolution of 1 km.
(3) NPP validation data
The NPP validation data required for the study included both station data and NPP product data. The data of eight carbon flux observation stations were downloaded from the China National Ecological Science Data Centre Resource Sharing Service Platform (http://www.cnern.org.cn, accessed on 30 October 2022); the specifics of the eight sites are listed in Table 2, with the shared flux data comprising the net ecosystem exchange (NEE) and ecosystem respiration (Re). To validate and evaluate the reliability of the NPP simulation results, this study converted the flux tower observations from January to December 2010 to NPP (GPP = Re − NEE, NPPEC = α × GPP) [30]. The NPP simulation results of the sites were extracted based on the latitude and longitude information, and a linear correlation analysis was used for NPP validation. The NPP product data used for validation were MOD17A3HGF images obtained from https://lpdaac.usgs.gov (accessed on 30 October 2022) and maintained by the NASA EOSDIS Land Processes Distributed Activity Archive Center (LP DAAC) at the USGS Earth Resources Observation and Science (EROS) Center (https://doi.org/10.5067/MODIS/MOD17A3HGF.061, accessed on 30 October 2022). Chinese NPP data for 2001–2010 were provided by the Resource and Environmental Science and Data Centre (acronym “GLO-PEM”) (https://www.resdc.cn/, accessed on 30 October 2022), and the Global Change Science Research Data Publishing (http://www.geodoi.ac.cn/, accessed on 30 October 2022) ChinaNPP_1985_2015 data were provided by the Global Change Science Research Data Publishing System (abbreviated as “Chinanpp”).
Table 2.
Details of the observation stations of carbon flux.
(4) Additional data
Additional data considered for the study comprised administrative boundary data, soil data, socio-economic data, and topographical data. Data on administrative divisions were taken from the National Centre for Basic Geographical Information (http://ngcc.sbsm.gov.cn/, accessed on 15 June 2022). GDP and population data were taken from the Resource and Environmental Science and Data Centre (https://www.resdc.cn/, accessed on 19 September 2022). Soil texture data were acquired from the Harmonized world soil data base v1.2 of the Geographical FAO database of the Chinese Academy of Sciences. The 30 m resolution DEM data were downloaded from the Geospatial Data Cloud (http://www.gscloud.cn/, accessed on 15 June 2022) and slope data were extracted on the basis of these data (Table 3).
Table 3.
The datasets used in this paper.
3. Methods
The technical route for this study encompassed the four main aspects illustrated in Figure 3: (1) Data Acquisition, which involves obtaining remote-sensing data, meteorological data, validation data, and other relevant data sources; (2) Construction of the kernel function by referencing the RBF algorithm in machine learning to optimize the normalized vegetation index NDVI; (3) Estimation and Accuracy Validation of the net primary productivity (NPP) utilizing the CASA model to estimate vegetation NPP in Chinese terrestrial ecosystems in the past two decades and validating the results using the validation data; and (4) Analysis of the spatiotemporal evolution of NPP, including trend analysis and examination of the driving mechanisms.
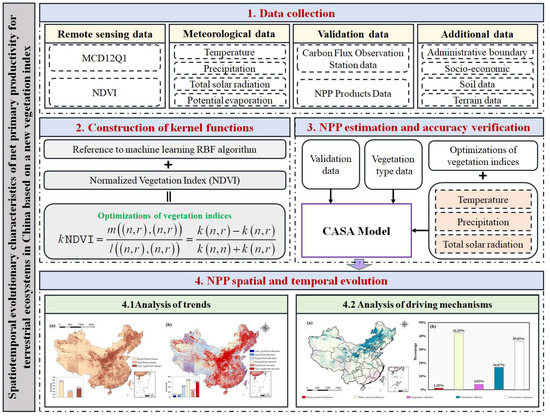
Figure 3.
Technical flow chart.
3.1. Construction of kNDVI
With reference to the RBF machine learning algorithm [25], this study used linear algebra to perform operations and derive a nonlinear algorithm from the linear algorithm to ensure that the normalized vegetation index NDVI could be optimized.
This study refers to [25] and uses the RBF kernel function k(a,b) = exp(−(a − b)2/((2σ2)) in all cases, where the σ parameter controls the concept of the distance between the IR and NIR bands. This kernel function is calculated as follows:
The kNDVI is calculated by taking the length scale parameter σ to the average distance between the NIR and IR bands with σ = 0.5 (n + r). Thus, the equation for kNDVI can be further simplified as provided below.
3.2. NPP Estimation Model
Based on the modified CASA model from [31], the parameters required for the models were processed accordingly to finally estimate the vegetation NPP with a temporal resolution of one month and a spatial resolution of 1 km. The model estimation equation is
where NPP(x,t) is the NPP of pixel x in month t (g C/m2·month1), APAR(x,t) is the photosynthetically active radiation absorbed by pixel x in month t (g C/m2·month1), and ε(x,t) is the actual light energy utilization of pixel x in month t (g C/MJ).
3.3. NPP Trend Analysis
The combination of the Theil–Sen median trend analysis with the Mann–Kendall trend test approach is a valuable method to identify trends in long-term sequence data [32]. This method has become increasingly popular for analyzing long-term vegetation data. For this research, we utilized the Theil–Sen median to examine the trends in vegetation NPP over the past two decades in Chinese terrestrial ecosystems.
Theil–Sen median trend analysis is a reliable non-parametric statistical approach to trend analysis that can reduce the impact of outliers [33]. Its formula is
where median is the median function and NPPj and NPPi are the NPP in year j and year I, respectively. When β > 0, it means that NPP shows an increasing trend, while the shows a decreasing trend.
The Mann–Kendall test is a non-parametric test that neither demands a sample to obey a specific distribution nor is influenced by a few outliers [34]. During the test, the vegetation NPP results for the period from 2001–2020 were constructed as a set of time series with per-pixel metavalues to determine significance differences:
where Z is the statistic of the NPP series, S refers to the test statistic, var(S) is the variance of the S statistic, n denotes the time series length, sgn denotes a symbolic function, and NPPi and NPPj are the time series datasets. In the double-lateral trend test, Z > 0 shows an uptrend, Z < 0 shows a downtrend, and Z = 0 shows unchanged. Thus, provided the level of importance α, if |Z| > u1−α/2 this implies the fact that the NPP time series shows significant changes at the α level. In this paper, we determined the importance of change trends in vegetation NPP time series at the 0.05 confidence level.
3.4. Driving Mechanisms of NPP Changes
3.4.1. Response of NPP to Climatic Factors
Vegetation NPP is usually influenced by climate elements such as temperature, precipitation, and radiation. Therefore, in this study, temperature, precipitation, and radiation were used as climatological influences on NPP, as well as correlation and significance levels among vegetation NPP, with temperature and precipitation investigated on pixel-by-pixel bases using partial and multiple correlation analyses.
The second-order partial correlation coefficient allows the correlation between the remaining two variables to be analyzed by excluding the interference of two of the four variables [35]. It is calculated as shown below:
where rab,cd denotes the partial correlation coefficients for variables a and b with the constant variables c and d, and rab,c, rad,c, and rbd,c denote the partial correlation coefficients for variables a and b, a and d, and b and d, respectively.
A t-test was used to test the significance of the statistics:
where r12,34,…,m indicates the bias correlation coefficient, n indicates the sample size, and m indicates the quantity of independent variables. In this study, p ≤ 0.05 was accepted as statistically meaningful.
Multiple correlation analysis focuses on the influence of multiple factors on one factor [36]. Assuming that y and z are independent variables and x is the dependent variable, the multiple correlation coefficient between them is calculated as follows:
where x is the time series NPP, y represents temperature, and z represents precipitation.
An F-test was conducted as well:
where rx,yz is the multiple correlation coefficient, n is the sample size, and k is the independent variable number.
In order to discriminate the impacts of climatic factors on vegetation NPP in different areas, the relative response of climatic factors to NPP was classified into five categories based on previous studies (Table 4).
Table 4.
Relative types of impacts of temperature and precipitation on NPP.
3.4.2. The Role of Climate and Human Activities in NPP Changes
Overall, temperature, precipitation, and solar radiation were used as climate-influencing factors for NPP, and differential equations were used to assess the contributions of climate change and human activities to the vegetation NPP of the terrestrial ecosystems of China for 2001–2020. On each stage, the drivers of vegetation NPP change were discussed using a partial least squares-structural equation (PLS-SEM) approach with a five-year period, integrating four types of influencing factors—meteorological, topographic, soil, and socio-economic—to reveal how vegetation NPP responded to climatic factors across terrestrial ecosystems of the country.
(1) Differential equation method
Differential equation methods can quantitate the response for climate change and human activities to changes in vegetation NPP for a function y = f (x1, x2, …). The variability of the dependent factor y may be represented as [37]:
It then follows that:
Alternatively,
where dNPP/dt is the trend in the long time series NPP and dNPP/dt, dtem/dt, dpre/dt, and dradi/dt represent the slope of the linear regression of NPP, temperature, precipitation, and solar radiation at time t, respectively. Moreover, Ccc = Ctem + Cpre+ Cradi, Cha = Ɛ, Ctem, Cpre, and Cradi are the response of climate change, human activity, temperature, precipitation, and radiation to the long-term trend in NPP, respectively, and Ɛ is the systematic error. Although there are many drivers other than climate change that affect NPP changes, human activities constitute the dominant part. Finally, the individual proportional contributions of climate change (Equation (16)) and human activity (Equation (17)) to NPP trends, p(x), can be estimated as follows:
(2) PLS-SEM method
The advantages of PLS-SEM are that it fully exploits the information in the data, minimizes the error term, and does not require a particular (high) sample size, model identification problems, or distribution state of the data. Therefore, the problem of covariance between variables can be dealt with effectively. The model is composed of two major components; one is a measuring model characterizing the relationship between latent and explicit variables, and the other is a structuring model characterizing the relationship of latent and explicit variables [38]. Its methodology for estimating the parameterization is separated into two procedures: (1) iteration to obtain the estimates of the latent variables, and (2) linear regression using partial least squares to obtain the estimates of the parameters for structural and measurement models. In this study, using a stratified random sampling method, 50,000 sample points were selected to analyze the effect of each influencing factor on the changes in NPP.
Considering k latent variables and each of k sets of dominant variables which each contain m variables, each dominant variable set may be denoted as
It is assumed that the latent variables are all linearly combined with the latent variables and the latent variables are linearly combined with the dominant variables. As each dominant variable is correlated as a distinct latent variable, the equation for measuring the model is
The equation of the structural model is as follows:
where ξi is the standardized latent variable, λij is the factor loading, βij is the path coefficient, and σij and εi are error correction terms with mean zero and that are uncorrelated with the predictor.
4. Results and Analysis
4.1. Accuracy Validation of NPP
This research compared simulated NPP values with data from eight flux sites during the same period. In addition, it compared NPP simulations for forests, shrubs, and grasslands in 2005–2010 with time series data from the Dinghu Mountain, Haibei, and Dangxiong sites. To further evaluate the NPP estimates for various vegetation types, this study included three NPP products (MOD17A3HGF, GLO_PEM, and Chinanpp).
The study results show that the simulated NPP values based on the CASA model are strongly correlated with the measured values at the stations (R2 > 0.6) (Figure 4). Interestingly, the NPP estimated with kNDVI (R2 = 0.74) had a better correlation than that estimated with NDVI (R2 = 0.65). This finding suggests that the NPP values estimated using kNDVI were more accurate than those obtained using NDVI. Compared with NDVI, the NPP values estimated based on kNDVI were closer to the measured NPP values in both densely vegetated and sparsely vegetated sites (Figure 5), and more closely matched the phenological cycle measured at the flux stations, making this approach more suitable for estimating terrestrial vegetation NPP on a national scale.
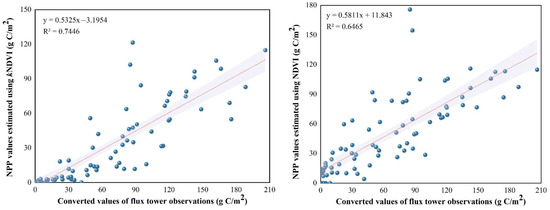
Figure 4.
Model validation.
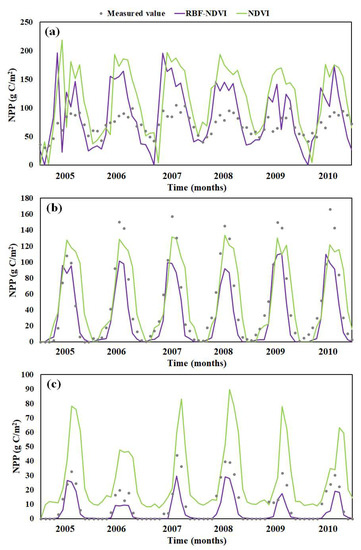
Figure 5.
NPP time series of (a) forest at Dinghushan station, (b) scrub at Haibei station, and (c) grassland at Dangxiong station from 2005 to 2010.
The comparison revealed that the mean values of the three NPP products and NPP estimated by this study varied (Figure 6), with GLO-PEM NPP (1431.95 g C/m2) > NDVI NPP (1161.43 g C/m2) > kNDVI NPP (942.46 g C/m2) > MOD17A3HGF NPP (864.17 g C/m2) > Chinanpp NPP (397.33 g C/m2). The authors of [39] demonstrated that the NPP values estimated by the GLO-PEM model were generally higher than the MOD17A3HGF product NPP values and [40] produced the Chinanpp dataset, with the maximum light energy utilization determined as 0.55, while the maximum light energy utilization estimated by the other two products and in this study was defined according to each vegetation type (Table 1); thus, the NPP values of Chinanpp products were low. The NPP mean estimated by NDVI in this study was high compared with the NPP mean of the MOD17A3HGF product, which was overestimated, while the NPP mean estimated by kNDVI was close to the NPP mean of MOD17A3HGF, and both of them were in better concordance. Generally, the NPP values estimated using kNDVI in this study were reliable and could be used in subsequent analysis.
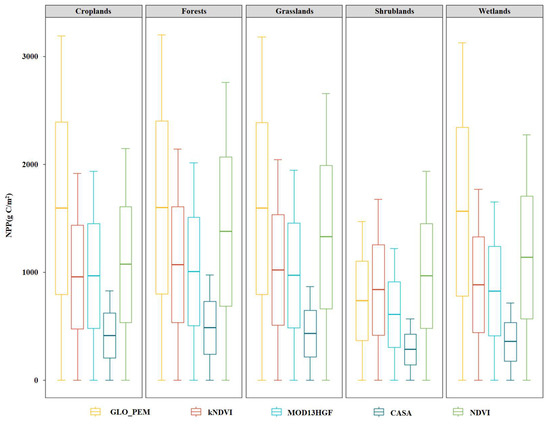
Figure 6.
Box plot of the correlation between the NPP of different vegetation types for different products.
4.2. Characteristics of Spatiotemporal Variation in NPP
4.2.1. Temporal Trends
On an interannual scale, the NPP variation within the research area from 2001 to 2020 showed a fluctuating upward trend between 64.13 and 79.72 g C/m2 with a rate of increase of 0.7235 g C/m2 (R2 = 0.82) and a mean value of 72.75 g C/m2 (Figure 7). The trend of NPP changes during the study period was not continuous, with large ups and downs and fluctuating characteristics during 2001–2016 and leveling off during 2017–2020. The maximum value of NPP over the studied period occurred in 2016, exceeding the average by 6.97 g C/m2, while the minimum value of NPP occurred in 2001 and was below the mean value of 8.62 g C/m2.
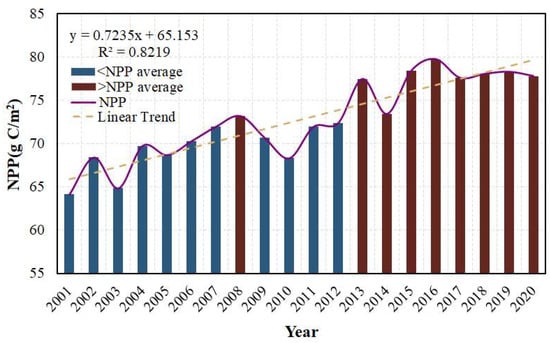
Figure 7.
Graph of the average NPP in 2001–2020.
On a monthly scale, the NPP trend line for the study area over the studied period from January to December generally showed an inverted “V” shape (Figure 8), with the NPP peaking in July each year. The monthly variation features of NPP are similar to the climate characteristics, with higher NPP values in summer and lower NPP values in winter. Because the changes in vegetation NPP are influenced by the control of vegetation growing process and light energy utilization, in turn, light energy utilization is affected by different circumstantial factors, which include temperature, precipitation, and solar radiation. The hot and humid environment in summer is suitable for vegetation growth, while the cold and poor rainfall in winter is not conducive to the accumulation of vegetation organic matter.
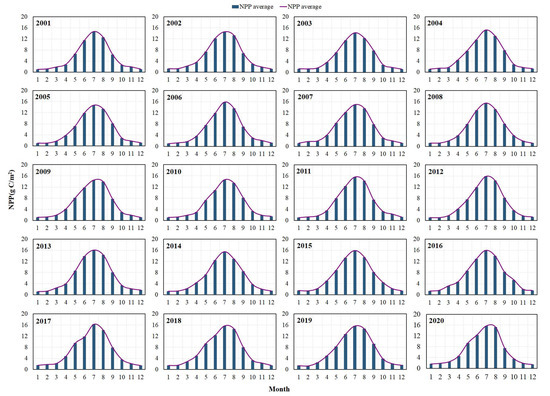
Figure 8.
Graph of the monthly NPP averages in 2001–2020.
4.2.2. Spatial Distribution Characteristics
In the study area, there was a clear pattern of regional variation in the multi-annual NPP averages, with a general spatial trend showing a decrease from the southeast coast to northwest inland (Figure 9 and Figure 10). High NPP regions were focused in the eastern and southern portions of the mainland, mainly in southwestern Hainan Province, Fujian Province, and most of Taiwan Province. These regions have low latitudes, sufficient heat, and abundant precipitation, which are conducive to the accumulation of organic compounds in vegetation. Low NPP regions were clustered in the western and northern parts of the continent, mainly in China’s Inner Mongolia Autonomous Region, Xinjiang Uygur Autonomous Region, Gansu Province, Qinghai Province, Ningxia Hui Autonomous Region, and Tibet Autonomous Region. These areas have an arid climate, poorer soils, and low vegetation cover, which are not beneficial for the accumulation of organic material in vegetation.
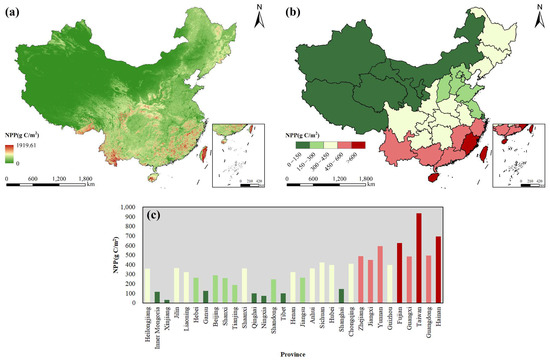
Figure 9.
Average value of NPP in China, 2001–2020. (a) Spatial distribution of NPP averages in China; (b) spatial distribution of NPP averages by province; and (c) histogram of NPP averages by province.
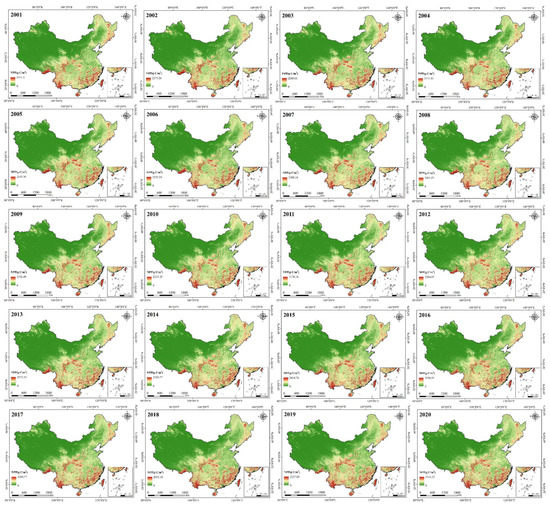
Figure 10.
NPP of vegetation in terrestrial ecosystems in China, 2001–2020.
The number of NPP values in the domain of 0–150 g C/m2 was the highest, with 56.03%, followed by 300–450 g C/m2, 450–600 g C/m2, and 150–300 g C/m2 with 22.82%, 12.90%, and 6.36%, respectively, and finally >600 g C/m2 with the lowest percentage of 1.89%. In terms of the statistical histogram by province (Figure 9), Taiwan Province had the largest mean multi-annual NPP values of 984.44 g C/m2, followed by Hainan Province (724.04 g C/m2) and Fujian Province (638.46 g C/m2). The mean multi-year NPP value in Xinjiang Uygur Autonomous Region was the smallest, at 30.79 g C/m2.
4.2.3. Spatial Variation Characteristics
The proportion of areas with increasing and decreasing NPP trends was 72.96% and 27.04%, respectively (Figure 11). This study presents the spatial distribution of NPP for the two subregions for 2005, 2010, 2015, and 2020, as well as the overall trend distribution for these twenty years (Figure 11). It is obvious that the NPP in subregion A gradually increases and the NPP in subregion B progressively decreases as time passes. The significance tests of the NPP trend results indicated that the percentage of significant and very significant changes in regional NPP were 17.10% and 30.10%, respectively (Figure 12a). The results of the overlay analysis of the NPP trend and significance show a significant increase and a very significant increase of 12.07% and 28.86% in these areas, respectively (Figure 12b), while the regions with significant and very significant decreases are 3.46% and 3.31%, respectively.
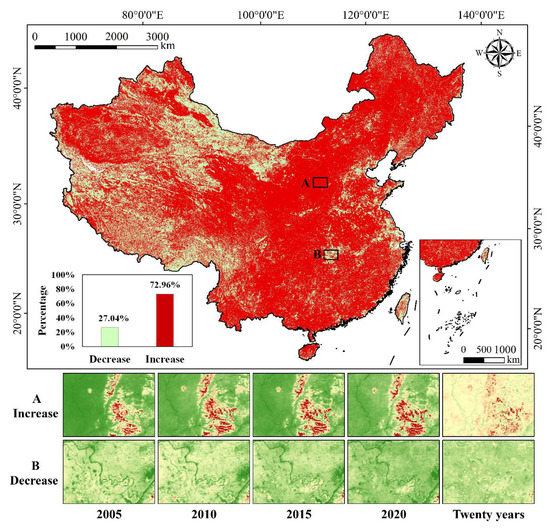
Figure 11.
Theil–Sen medium trend distribution.
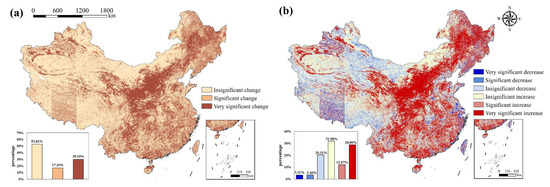
Figure 12.
Significance graphs. (a) Mann-Kendall trend test results; (b) Theil-Sen median trend analysis and Mann-Kendall trend test superimposed analysis results.
There were significant and very significant increases in NPP concentrated in the Northeast Plain, Loess Plateau, and Sichuan Basin in a band-like distribution, which is related to the national policy guidance. For example, major items such as the return of cultivated land to forest and grass, the “Three-North” Shelterbelt Program, and the amelioration of saline–alkaline soil all achieved certain results [41]. Regions with significant and very significant decreases in NPP were primarily in the eastern Xinjiang Uygur Autonomous Region, western Inner Mongolia, northwestern Qinghai and Gansu Provinces, and most of the Tibet Autonomous Region, which is climate-related. These areas are located in the interior of China, with low precipitation, low vegetation cover, and vast desert areas (Taklamakan Desert, 357,300 km2; Gurbantunggut Desert, 56,800 km2; Badain Jaran Desert, 55,000 km2; and Tengger Desert, 41,900 km2), thus, the vegetation productivity level is considered low.
4.3. Analysis of the Mechanisms Driving the Spatiotemporal Evolution of NPP in China in the Studied Period
4.3.1. Trends in Climate Change and their Impact on Vegetation NPP
Over the studied period, there was an overall upward trend in the average annual temperature in the research region (Figure 13), with a rate of increase of 0.004 °C. However, a downward trend was evident from 2007 onwards, dropping to a minimum of 2.04 °C in 2012 before turning into a significant upward trend. The annual average solar radiation as a whole shows a decreasing trend with a rate of −1.7791 MJ/m2, with significant decreasing trends in 2009–2010, 2013–2016, and 2019–2020, especially from 2019 to 2020, with a decrease of 17.40 MJ/m2. The average annual precipitation fluctuated relatively smoothly, with the lowest average annual precipitation in 2011 (63.82 mm) and the highest in 2010 (75.20 mm).
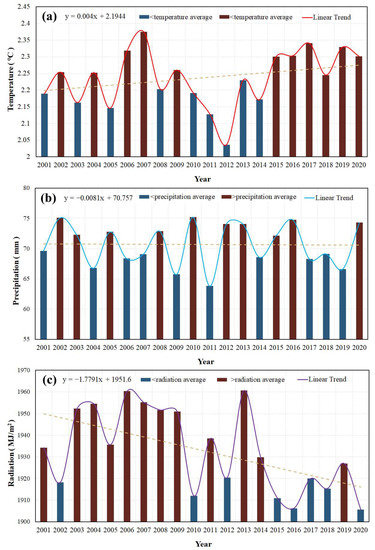
Figure 13.
Trends in temperature (a), precipitation (b), and radiation (c) over the studied period of 2001–2020.
The impacts of temperature, precipitation, and radiation on vegetation NPP were analyzed separately, eliminating the impacts of additional elements. The main positive correlation was among vegetation NPP and temperature, precipitation, and radiation in the research region (Figure 14d). The areas where NPP showed a positive correlation with the temperature accounted for 62.19% of the total, primarily in East China and South China, the southern part of Central China, the eastern and southern parts of North and Northeast China, the northern and eastern parts of Northwest China, and the western and eastern parts of Southwest China (Figure 14a). The areas where NPP was positively correlated with precipitation were as high as 79.65%, mainly in Northeast and North China, the northern part of East China, and the northern and eastern parts of Northwest China (Figure 14b). The precipitation in certain regions was negatively correlated with the NPP process, mainly in southern China, central China, and southern East China. The areas where NPP was positively correlated with solar radiation accounted for 69.86% and were mainly located in North China and Central China, the eastern part of Southwest China, most of Northwest China, North China, and East China (Figure 14c).
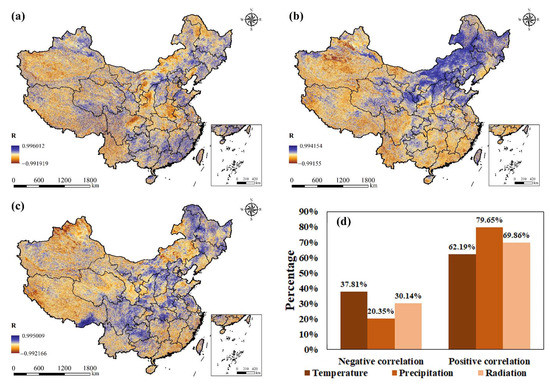
Figure 14.
Plots of the bias correlation coefficients with NPP for (a) temperature, (b) precipitation, and (c) solar radiation; (d) Histograms of the bias correlation coefficients for all three factors.
The part of the research region in which NPP was positively correlated with precipitation, temperature, and radiation for only twenty years was larger than the area occupied by a negative correlation (Figure 15). The percentage of area with a significant positive correlation between temperature and NPP was 10.15%, and the percentage of area with a significant negative correlation was 3.53%. The precipitation and NPP had a significant positive correlation between the areas with a percentage of 31.82%, and only 1.34% of the area had a significant negative correlation. The percentage of areas with a significant positive correlation between the radiation and NPP was 13.79%, and the percentage of areas with a significant negative correlation was 1.82%.
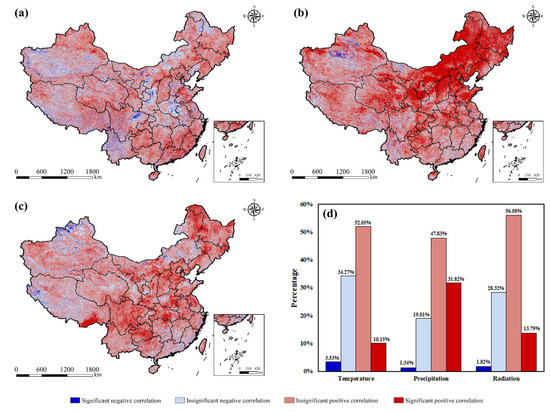
Figure 15.
Significance test plots: (a) temperature, (b) precipitation, (c) radiation and NPP bias correlation coefficient test; (d) significance histograms.
The combined investigation of the impacts of the temperature and precipitation factors on the vegetation NPP demonstrated that the multiple correlation coefficients of temperature, precipitation, and vegetation NPP ranged from 0 to 1 (Figure 16a). The correlation between temperature, precipitation, and vegetation NPP was predominantly non-significant by the F-significance test (Figure 16b). The relative role of temperature and precipitation on NPP was further explored (Figure 17), with climatic factors affecting up to 64.18% of the area. The highest percentage of regions with a weak common influence was 42.23%. This was followed by precipitation and temperature, with 16.67% and 4.02%, respectively. The strong common influence saw the lowest percentage of regions, with only 1.25%.
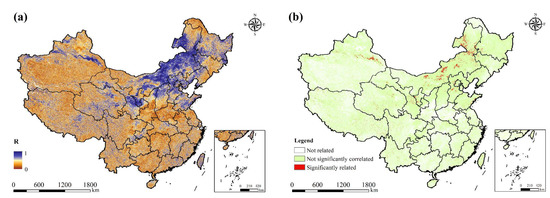
Figure 16.
Plot of the multiple correlation coefficient (a) and F-test (b).
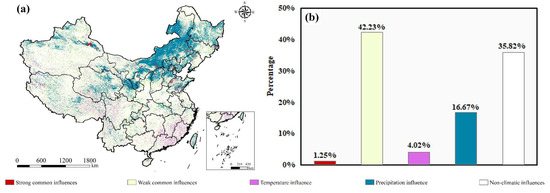
Figure 17.
Spatial distribution of the compound effect of (a) temperature and (b) precipitation on NPP.
4.3.2. Relative Contributions of Climate and Human Activities to NPP Changes
The predicted NPP change rate over the past two decades in the study area ranged from −88.5608 to 127.417, and the anthropogenic NPP slope ranged from −99.4355 to 92.722 (Figure 18). The combination of the results of climate change and human activity contributions to NPP can be found in Figure 19. The percentage of the area where NPP increased owing to climate change was 61.87%, of which 6.63% was contributed by >80%, primarily in the eastern part of Northeast and North China. The decrease was 38.13%, mainly in the southeastern part of the Qinghai–Tibet Plateau. The region of NPP increased by human activities was 73.92%, of which 38.01% was contributed by >80%, mainly in Central China and South China, central parts of North China, north and south parts of Northeast China, east and south parts of Northwest China, and the Qinghai–Tibet Plateau. The decrease accounted for 26.08%, mainly in the northeastern part of Northwest China and the western part of North China.
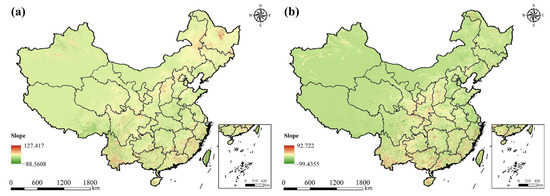
Figure 18.
Spatial distribution of (a) the slope of the predicted NPP and (b) the slope of the NPP generated by human activities.
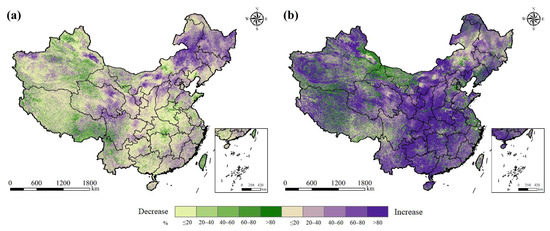
Figure 19.
Spatial distribution of the contribution of (a) climate change and (b) human activities to NPP changes.
5. Discussion
5.1. Relationship between Drivers and NPP Changes at Each Stage
The driving factors affecting vegetation NPP changes may differ at different stages, and the main contributors may differ for each time period. In this study, the relationships between each driver and vegetation NPP changes were analyzed using a structural equation PLS-SEM with a five-year cycle by integrating soil, climate, socioeconomic, and topographical factors.
This research first validated the reliability and validity of the PLS-SEM model (Table 5). VIF was used to detect multicollinearity in the variables and provided values between 1 and 5, indicating that there was no significant covariance between the factors. A composite reliability (CR) greater than 0.7 and not lower than 0.6 indicated that the model was reliable, and an average variance extracted (AVE) greater than 0.5 demonstrated that the model was valid. The data in this study satisfied the above conditions well and prove that the model was reasonable and reliable [42].
Table 5.
PLS-SEM reliability and validity assessment.
The PLS-SEM model of the relationship between the latent and explicit variables for the changes in NPP in 2001–2020 is shown in Figure 20. The results show that changes in human activities always had a negative impact on NPP changes, with path coefficients of −0.017, −0.075, −0.041, and −0.006 for 2001–2005, 2005–2010, 2010–2015, and 2015–2020, respectively. For the periods 2001–2005 and 2015–2020, topographical change had a positive impact, with path coefficients of 0.096 and 0.234, respectively. Soil change had a positive impact in 2001–2005, 2010–2015, and 2015–2020, with path coefficients of 0.078, 0.463, and 0.220, respectively. In addition, the path coefficients and main impact factors of the climate changed. The impact of climate (evaporation and precipitation) on NPP changes in 2001–2005 was positive (β = 0.375). The impact of climate (evaporation and temperature) was positive (β = 0.092) in 2005–2010 and became negative in 2010–2015. The impact of climate on NPP changes (evaporation and solar radiation) was positive (β = 0.151) for the period of 2015–2020.
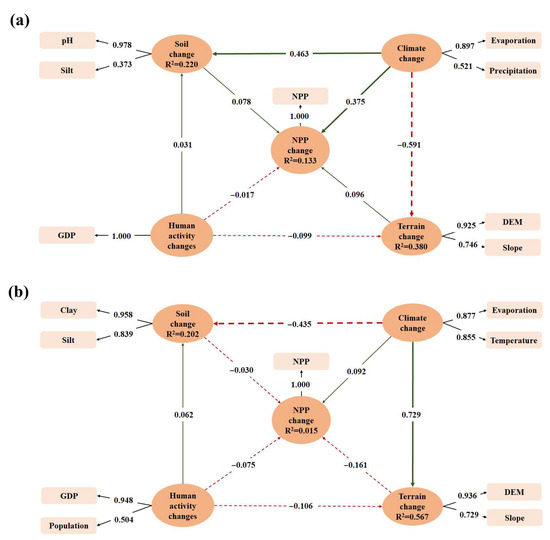
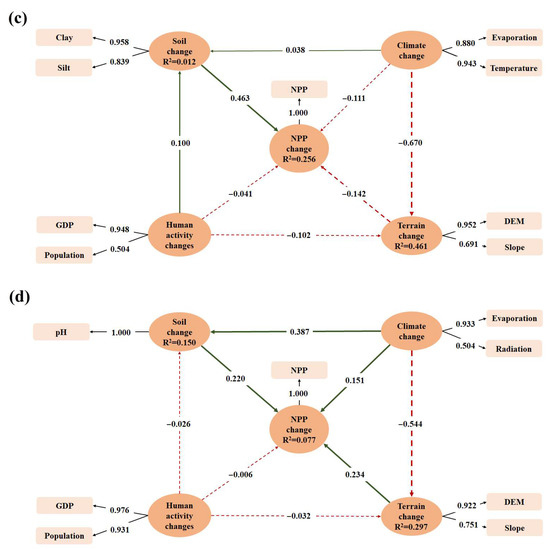
Figure 20.
PLS-SEM model plots: (a) 2001–2005, (b) 2005–2010, (c) 2010–2015, and (d) 2015–2020 for the relationship between changes in each variable and changes in NPP. Ovals indicate latent variables, rounded rectangles indicate explicit variables, arrows indicate their association, red dashed lines indicate negative correlations, and green solid lines indicate positive correlations.
The amount of fertilizer used has an effect on vegetation NPP changes; unfortunately, raster data on fertilizer inputs such as N and P were lacking in this study. In a forthcoming follow-up study, we intend to obtain raster data on various types of fertilizer inputs to enhance the accuracy and reliability of the influence factors of vegetation NPP.
5.2. Comparison with Other NPP Reports
The data sources used in NPP studies can be broadly divided into two categories: existing NPP products [43,44,45,46,47] (Table 6), which have a fixed spatial resolution, and estimations of NPP using NDVI and FPAR. To analyze the relationship between NPP changes and influencing factors, studies have mainly explored the overall response mechanism of NPP to climate change and human activities; in addition, they have considered mainly the effects of temperature and precipitation [36,43,46,48,49]. Other studies have considered additional influencing factors, such as relative humidity, sunshine hours, chlorophyll-a, photosynthetic availability, wind stress curl, salinity, nitrates, phosphates, and CO2 concentration [44,47,50]. Compared with other studies, this paper conducted a relatively comprehensive study of the climatic and anthropogenic influences on vegetation NPP; however, other influencing factors, such as CO2 concentrations, nitrates, and phosphates, could be considered in subsequent studies.
Table 6.
Comparison with other NPP research.
5.3. Limitations and Prospects
Although the accuracy of kNDVI estimates at the site scale was higher than that of NDVI, unfortunately, ChinaFLUX shared flux observations only for certain stations. This makes it difficult to rely on observational data alone when assessing the quality of NPP data at the national scale. In the future, more measured data will be sought as much as possible to improve the quality of the estimated NPP data.
For accuracy validation, direct real NPP data were not available in this research, and were obtained by converting flux data. It is worth noting that the value of the NPP/GPP ratio α used in conversion varies with geography, meteorology, and vegetation type, while in this study we used the regional average NPP/GPP ratio (α = 0.64), which could potentially have an impact on the NPP conversion value.
6. Conclusions
Based on an improved CASA model driven by the new kNDVI vegetation index, this paper estimated the NPP of China’s terrestrial ecosystem vegetation from 2001 to 2020 and used the Theil–Sen median, Mann–Kendall trend, second-order partial correlation, multiple correlation analysis, differential equation method, and PLS-SEM method to analyze the temporal and spatial evolution of vegetation NPP in China’s terrestrial ecosystems. The results show that kNDVI can effectively improve the saturation problem, cope with complex phenological changes, and improve the precision of NPP estimation. The NPP of Chinese vegetation presented a fluctuating upward trend on the time scale from 2001 to 2020. It increased by a mean of 0.7235 g C/m2 each year, showing a low northwest to high southeast pattern in the spatial distribution, with the highest average multi-year NPP value by province in Taiwan Province and the lowest in Xinjiang Uygur Autonomous Region. The changes in NPP were dominated by an increasing trend (72.96%), and the areas showing significant and very significant increases were concentrated in the Northeast Plain, Loess Plateau, and Sichuan Basin. In Northeast and North China, vegetation NPP was mainly influenced by precipitation, while in Southwest and South China it was mainly influenced by temperature and in Central China by solar radiation. With the passage of time, the dominant factors influencing the changes in NPP change and have different impacts. The main influencing factors of the climate in 2001–2005 were evaporation and precipitation, and the main influencing factors of the climate in 2005–2010 were evaporation and temperature; moreover, the influences of both phases were positive. However, in 2010–2015 the impact of the climate was negative. Climate change and human activities have a major positive effect on NPP change. The areas where the NPP increased due to climate change were mainly located in Northeast and North China, and the areas where the NPP increased due to human activities were mainly located in Central and South China. The results of this research can be used in China and around the world to better prepare for and respond to climate change.
Author Contributions
S.Q.: Conceptualization, Methodology, Software, Formal analysis, Project administration, Funding acquisition, Investigation, Writing—original draft, Writing—review and editing. H.Z.: Investigation, review. M.Z.: Data curation, Investigation, Funding acquisition, Writing—original draft. All authors have read and agreed to the published version of the manuscript.
Funding
This study was funded by the National Natural Science Foundation of China (41901385), the Natural Science Foundation of Hunan Province of China (2022JJ40873), and in part by the Education Department of Hunan Province of China (21A0177).
Data Availability Statement
Not applicable.
Conflicts of Interest
The authors declare that they have no conflict of interest related to this work. We declare that we do not have any commercial or associative interest that could represent a conflict of interest in connection with the work submitted.
References
- Zhang, Y.; Hu, Q.; Zou, F. Spatio-Temporal Changes of Vegetation Net Primary Productivity and Its Driving Factors on the Qinghai-Tibetan Plateau from 2001 to 2017. Remote Sens. 2021, 13, 1566. [Google Scholar] [CrossRef]
- Liu, G.; Shao, Q.; Fan, J.; Ning, J.; Rong, K.; Huang, H.; Liu, S.; Zhang, X.; Niu, L.; Liu, J. Change Trend and Restoration Potential of Vegetation Net Primary Productivity in China over the Past 20 Years. Remote Sens. 2022, 14, 1634. [Google Scholar] [CrossRef]
- Liu, Y.; Yang, Y.; Wang, Q.; Du, X.; Li, J.; Gang, C.; Zhou, W.; Wang, Z. Evaluating the Responses of Net Primary Productivity and Carbon Use Efficiency of Global Grassland to Climate Variability along an Aridity Gradient. Sci. Total Environ. 2019, 652, 671–682. [Google Scholar] [CrossRef]
- Ning, K.; Chen, J.; Li, Z.; Liu, C.; Nie, X.; Liu, Y.; Wang, L.; Hu, X. Land Use Change Induced by the Implementation of Ecological Restoration Programs Increases Future Terrestrial Ecosystem Carbon Sequestration in Red Soil Hilly Region of China. Ecol. Indic. 2021, 133, 108409. [Google Scholar] [CrossRef]
- Zhang, F.; Zhang, Z.; Kong, R.; Chang, J.; Tian, J.; Zhu, B.; Jiang, S.; Chen, X.; Xu, C.Y. Changes in Forest Net Primary Productivity in the Yangtze River Basin and Its Relationship with Climate Change and Human Activities. Remote Sens. 2019, 11, 1451. [Google Scholar] [CrossRef]
- Redmann, R.E. Primary Productivity. In Encyclopedia of Entomology; Springer: Dordrecht, The Netherlands, 2008. [Google Scholar] [CrossRef]
- Running, S.W.; Hunt, E.R. Generalization of a Forest Ecosystem Process Model for Other Biomes, BIOME-BGC, and an Application for Global-Scale Models; Woodhead Publishing Limited: Shaxton, UK, 1993. [Google Scholar]
- Chen, W.; Chen, J.; Liu, J.; Cihlar, J. Atmospheric Disturbances I Mineralization • Canopy Radiation Model C, N CO:On C-Budget. Glob. Biogeochem. Cycles 2000, 14, 827–838. [Google Scholar] [CrossRef]
- David McGuire, A.; Melillo, J.M.; Kicklighter, D.W.; Pan, Y.; Xiao, X.; Helfrich, J.; Moore, B.; Vorosmarty, C.J.; Schloss, A.L. Equilibrium Responses of Global Net Primary Production and Carbon Storage to Doubled Atmospheric Carbon Dioxide: Sensitivity to Changes in Vegetation Nitrogen Concentration. Global Biogeochem. Cycles 1997, 11, 173–189. [Google Scholar] [CrossRef]
- Wilcox, B.P. Ecohydrology Bearing-Invited Commentary Transformation Ecosystem Change and Ecohydrology: Ushering in a New Era for Watershed Management. Ecohydrology 2010, 130, 126–130. [Google Scholar]
- Wang, C.; Jiang, Q.; Deng, X.; Lv, K.; Zhang, Z. Spatio-Temporal Evolution, Future Trend and Phenology Regularity of Net Primary Productivity of Forests in Northeast China. Remote Sens. 2020, 12, 3670. [Google Scholar] [CrossRef]
- Qi, S.; Chen, S.; Long, X.; An, X.; Zhang, M. Quantitative Contribution of Climate Change and Anthropological Activities to Vegetation Carbon Storage in the Dongting Lake Basin in the Last Two Decades. Adv. Sp. Res. 2023, 71, 845–868. [Google Scholar] [CrossRef]
- Zhou, Z.; Qin, D.; Chen, L.; Jia, H.; Yang, L.; Dai, T. Novel Model for NPP Prediction Based on Temperature and Land Use Changes: A Case in Sichuan and Chongqing, China. Ecol. Indic. 2022, 145, 109724. [Google Scholar] [CrossRef]
- Yin, C.; Luo, M.; Meng, F.; Sa, C.; Yuan, Z.; Bao, Y. Contributions of Climatic and Anthropogenic Drivers to Net Primary Productivity of Vegetation in the Mongolian Plateau. Remote Sens. 2022, 14, 3383. [Google Scholar] [CrossRef]
- Xiao, X.; Hollinger, D.; Aber, J.; Goltz, M.; Davidson, E.A.; Zhang, Q.; Moore, B. Satellite-Based Modeling of Gross Primary Production in an Evergreen Needleleaf Forest. Remote Sens. Environ. 2004, 89, 519–534. [Google Scholar] [CrossRef]
- Bao, G.; Bao, Y.; Qin, Z.; Xin, X.; Bao, Y.; Bayarsaikan, S.; Zhou, Y.; Chuntai, B. Modeling Net Primary Productivity of Terrestrial Ecosystems in the Semi-Arid Climate of the Mongolian Plateau Using LSWI-Based CASA Ecosystem Model. Int. J. Appl. Earth Obs. Geoinf. 2016, 46, 84–93. [Google Scholar] [CrossRef]
- Liang, L.; Geng, D.; Yan, J.; Qiu, S.; Shi, Y.; Wang, S.; Wang, L.; Zhang, L.; Kang, J. Remote Sensing Estimation and Spatiotemporal Pattern Analysis of Terrestrial Net Ecosystem Productivity in China. Remote Sens. 2022, 14, 1902. [Google Scholar] [CrossRef]
- Bidoglio, G.; De Plano, A.; Avogadro, A.; Murray, C.N. Migration Behaviour and Chemical Speciation of Np and Am under Nuclear Waste Repository Conditions. Inorg. Chim. Acta 1984, 95, 1–3. [Google Scholar] [CrossRef]
- Xu, X.; Jiang, H.; Guan, M.; Wang, L.; Huang, Y.; Jiang, Y.; Wang, A. Vegetation Responses to Extreme Climatic Indices in Coastal China from 1986 to 2015. Sci. Total Environ. 2020, 744, 140784. [Google Scholar] [CrossRef]
- Wang, S.; Zhang, L.; Huang, C.; Qiao, N. An NDVI-Based Vegetation Phenology Is Improved to Be More Consistent with Photosynthesis Dynamics through Applying a Light Use Efficiency Model over Boreal High-Latitude Forests. Remote Sens. 2017, 9, 695. [Google Scholar] [CrossRef]
- Wu, W. The Generalized Difference Vegetation Index (GDVI) for Dryland Characterization. Remote Sens. 2014, 6, 1211. [Google Scholar] [CrossRef]
- Xue, J.; Su, B. Significant Remote Sensing Vegetation Indices: A Review of Developments and Applications. J. Sens. 2017, 2017, 17. [Google Scholar] [CrossRef]
- Shan, N.; Xi, L.; Zhang, Q.; Lin, N.; Xu, D.; Cao, B. Better Revisiting Chlorophyll Content Retrieval with Varying Senescent Material and Solar-Induced Chlorophyll Fluorescence Simulation on Paddy Rice during the Entire Growth Stages. Ecol. Indic. 2021, 130, 108057. [Google Scholar] [CrossRef]
- Kang, X.; Huang, C.; Zhang, L.; Zhang, Z.; Lv, X. Downscaling Solar-Induced Chlorophyll Fluorescence for Field-Scale Cotton Yield Estimation by a Two-Step Convolutional Neural Network. Comput. Electron. Agric. 2022, 201, 107260. [Google Scholar] [CrossRef]
- Camps-Valls, G.; Campos-Taberner, M.; Moreno-Martínez, Á.; Walther, S.; Duveiller, G.; Cescatti, A.; Mahecha, M.D.; Muñoz-Marí, J.; García-Haro, F.J.; Guanter, L.; et al. A Unified Vegetation Index for Quantifying the Terrestrial Biosphere. Sci. Adv. 2021, 7, eabc7447. [Google Scholar] [CrossRef] [PubMed]
- Shi, S.; Zhu, L.; Luo, Z.; Qiu, H. Quantitative Analysis of the Contributions of Climatic and Anthropogenic Factors to the Variation in Net Primary Productivity, China. Remote Sens. 2023, 15, 789. [Google Scholar] [CrossRef]
- Fu, J.; Gong, Y.; Zheng, W.; Zou, J.; Zhang, M.; Zhang, Z.; Qin, J.; Liu, J.; Quan, B. Spatial-Temporal Variations of Terrestrial Evapotranspiration across China from 2000 to 2019. Sci. Total Environ. 2022, 825, 153951. [Google Scholar] [CrossRef]
- Liu, J.; Wang, Z.; Duan, Y.; Li, X.; Zhang, M.; Liu, H.; Xue, P.; Gong, H.; Wang, X.; Chen, Y.; et al. Effects of Land Use Patterns on the Interannual Variations of Carbon Sinks of Terrestrial Ecosystems in China. Ecol. Indic. 2023, 146, 109914. [Google Scholar] [CrossRef]
- Kong, R.; Zhang, Z.; Huang, R.; Tian, J.; Feng, R.; Chen, X. Projected Global Warming-Induced Terrestrial Ecosystem Carbon across China under SSP Scenarios. Ecol. Indic. 2022, 139, 108963. [Google Scholar] [CrossRef]
- Su, S.; Zeng, Y.; Zhao, D.; Zheng, Z.; Wu, X. Optimization of Net Primary Productivity Estimation Model for Terrestrial Vegetation in China Based on CERN Data. Acta Ecol. Sin. 2022, 42, 1276–1289. [Google Scholar] [CrossRef]
- Zhu, W.; Pan, Y.; He, H.; Yu, D.; Hu, H. Simulation of Maximum Light Use Efficiency for Some Typical Vegetation Types in China. Chinese Sci. Bull. 2006, 51, 457–463. [Google Scholar] [CrossRef]
- Yin, C.; Chen, X.; Luo, M.; Meng, F.; Sa, C.; Bao, S.; Yuan, Z.; Zhang, X.; Bao, Y. Quantifying the Contribution of Driving Factors on Distribution and Change of Net Primary Productivity of Vegetation in the Mongolian Plateau. Remote Sens. 2023, 15, 1986. [Google Scholar] [CrossRef]
- Li, Y.; Xie, Z.; Qin, Y.; Zheng, Z. Estimating Relations of Vegetation, Climate Change, and Human Activity: A Case Study in the 400 Mm Annual Precipitation Fluctuation Zone, China. Remote Sens. 2019, 11, 1159. [Google Scholar] [CrossRef]
- Li, M.; Chu, R.; Shen, S.; Islam, A.R.M.T. Dynamic Analysis of Pan Evaporation Variations in the Huai River Basin, a Climate Transition Zone in Eastern China. Sci. Total Environ. 2018, 625, 496–509. [Google Scholar] [CrossRef]
- Zhang, M.; Yuan, N.; Lin, H.; Liu, Y.; Zhang, H. Quantitative Estimation of the Factors Impacting Spatiotemporal Variation in NPP in the Dongting Lake Wetlands Using Landsat Time Series Data for the Last Two Decades. Ecol. Indic. 2022, 135, 108544. [Google Scholar] [CrossRef]
- Tu, H.; Guli, J.; Yu, T.; Li, X.; Chen, B. Analysis of Spatio temporal Variation Characteristics and Influencing Factors of Net Primary Productivity in Terrestrial Ecosystems of China. Acta Ecol. Sin. 2023, 43, 1219–1233. [Google Scholar] [CrossRef]
- Yang, S.; Zhang, J.; Wang, J.; Zhang, S.; Bai, Y.; Shi, S.; Cao, D. Spatiotemporal Variations of Water Productivity for Cropland and Driving Factors over China during 2001–2015. Agric. Water Manag. 2022, 262, 107328. [Google Scholar] [CrossRef]
- An, X.; Jin, W.; Zhang, H.; Liu, Y.; Zhang, M. Analysis of Long-Term Wetland Variations in China Using Land Use/Land Cover Dataset Derived from Landsat Images. Ecol. Indic. 2022, 145, 109689. [Google Scholar] [CrossRef]
- Fan, J.; Li, D.; Zhou, H. Comparison of GLOPEM and MOD17A3NPP. J. Shaanxi Meteorol. 2013, 1, 21–25. [Google Scholar]
- Chen, P. Monthly 1-Km Raster Dataset of Net Primary Productivity of Chinese Terrestrial Ecosystems North of 18°N Latitude (1985–2015). J. Glob. Chang. Data Discov. 2019, 3, 35–41. [Google Scholar] [CrossRef]
- Liang, W.; Quan, Q.; Wu, B.; Mo, S. Response of Vegetation Dynamics in the Three-North Region of China to Climate and Human Activities from 1982 to 2018. Sustainability 2023, 15, 73. [Google Scholar] [CrossRef]
- Zhang, Y.; She, J.; Long, X.; Zhang, M. Spatio-Temporal Evolution and Driving Factors of Eco-Environmental Quality Based on RSEI in Chang-Zhu-Tan Metropolitan Circle, Central China. Ecol. Indic. 2022, 144, 109436. [Google Scholar] [CrossRef]
- Shi, Z.; Wang, Y.; Zhao, Q.; Zhang, L.; Zhu, C. The Spatiotemporal Changes of NPP and Its Driving Mechanisms in China from 2001 to 2020. Ecol. Environ. Sci. 2022, 31, 2111–2123. [Google Scholar]
- Ma, Z.; Cui, H.; Ge, Q. Prediction of Net Primary Productivity Change Pattern in China Based on Vegetation Dynamic Models. Acta Geogr. Sin. 2022, 77, 1821–1836. [Google Scholar] [CrossRef]
- Li, D.; Wang, Z. The Characteristics of NPP of Terrestrial Vegetation in China Based on MOD17A3 Data. Ecol. Environ. Sci. 2018, 27, 397–405. [Google Scholar] [CrossRef]
- Naeem, S.; Zhang, Y.; Tian, J.; Qamer, F.M.; Latif, A.; Paul, P.K. Quantifying the Impacts of Anthropogenic Activities and Climate Variations on Vegetation Productivity Changes in China from 1985 to 2015. Remote Sens. 2020, 12, 1113. [Google Scholar] [CrossRef]
- Cervantes-Duarte, R.; González-Rodríguez, E.; Funes-Rodríguez, R.; Ramos-Rodríguez, A.; Torres-Hernández, M.Y.; Aguirre-Bahena, F. Variability of Net Primary Productivity and Associated Biophysical Drivers in Bahía de La Paz (Mexico). Remote Sens. 2021, 13, 1644. [Google Scholar] [CrossRef]
- Sun, J.; Niu, H.; Yuan, M. Spatial Pattern Change and Analysis of NPP in Terrestrial Vegetation Ecosystem in China. Trans. Chinese Soc. Agric. Mach. 2020, 51, 162–168. [Google Scholar] [CrossRef]
- Martínez, B.; Sánchez-Ruiz, S.; Campos-Taberner, M.; García-Haro, F.J.; Gilabert, M.A. Exploring Ecosystem Functioning in Spain with Gross and Net Primary Production Time Series. Remote Sens. 2022, 14, 1310. [Google Scholar] [CrossRef]
- Rafique, R.; Zhao, F.; De Jong, R.; Zeng, N.; Asrar, G.R. Global and Regional Variability and Change in Terrestrial Ecosystems Net Primary Production and NDVI: A Model-Data Comparison. Remote Sens. 2016, 8, 177. [Google Scholar] [CrossRef]


Disclaimer/Publisher’s Note: The statements, opinions and data contained in all publications are solely those of the individual author(s) and contributor(s) and not of MDPI and/or the editor(s). MDPI and/or the editor(s) disclaim responsibility for any injury to people or property resulting from any ideas, methods, instructions or products referred to in the content. |
© 2023 by the authors. Licensee MDPI, Basel, Switzerland. This article is an open access article distributed under the terms and conditions of the Creative Commons Attribution (CC BY) license (https://creativecommons.org/licenses/by/4.0/).