
Exploiting Earth Observations to Enable Groundwater Modeling in the Data-Sparse Region of Goulbi Maradi, Niger

 ,
,  , , ,
, , ,
Abstract
:
1. Introduction
1.1. Location and Socio-Cultural Context
1.2. Geology and Hydrogeologic Setting
1.3. Previous Research
1.4. Objective
2. Data
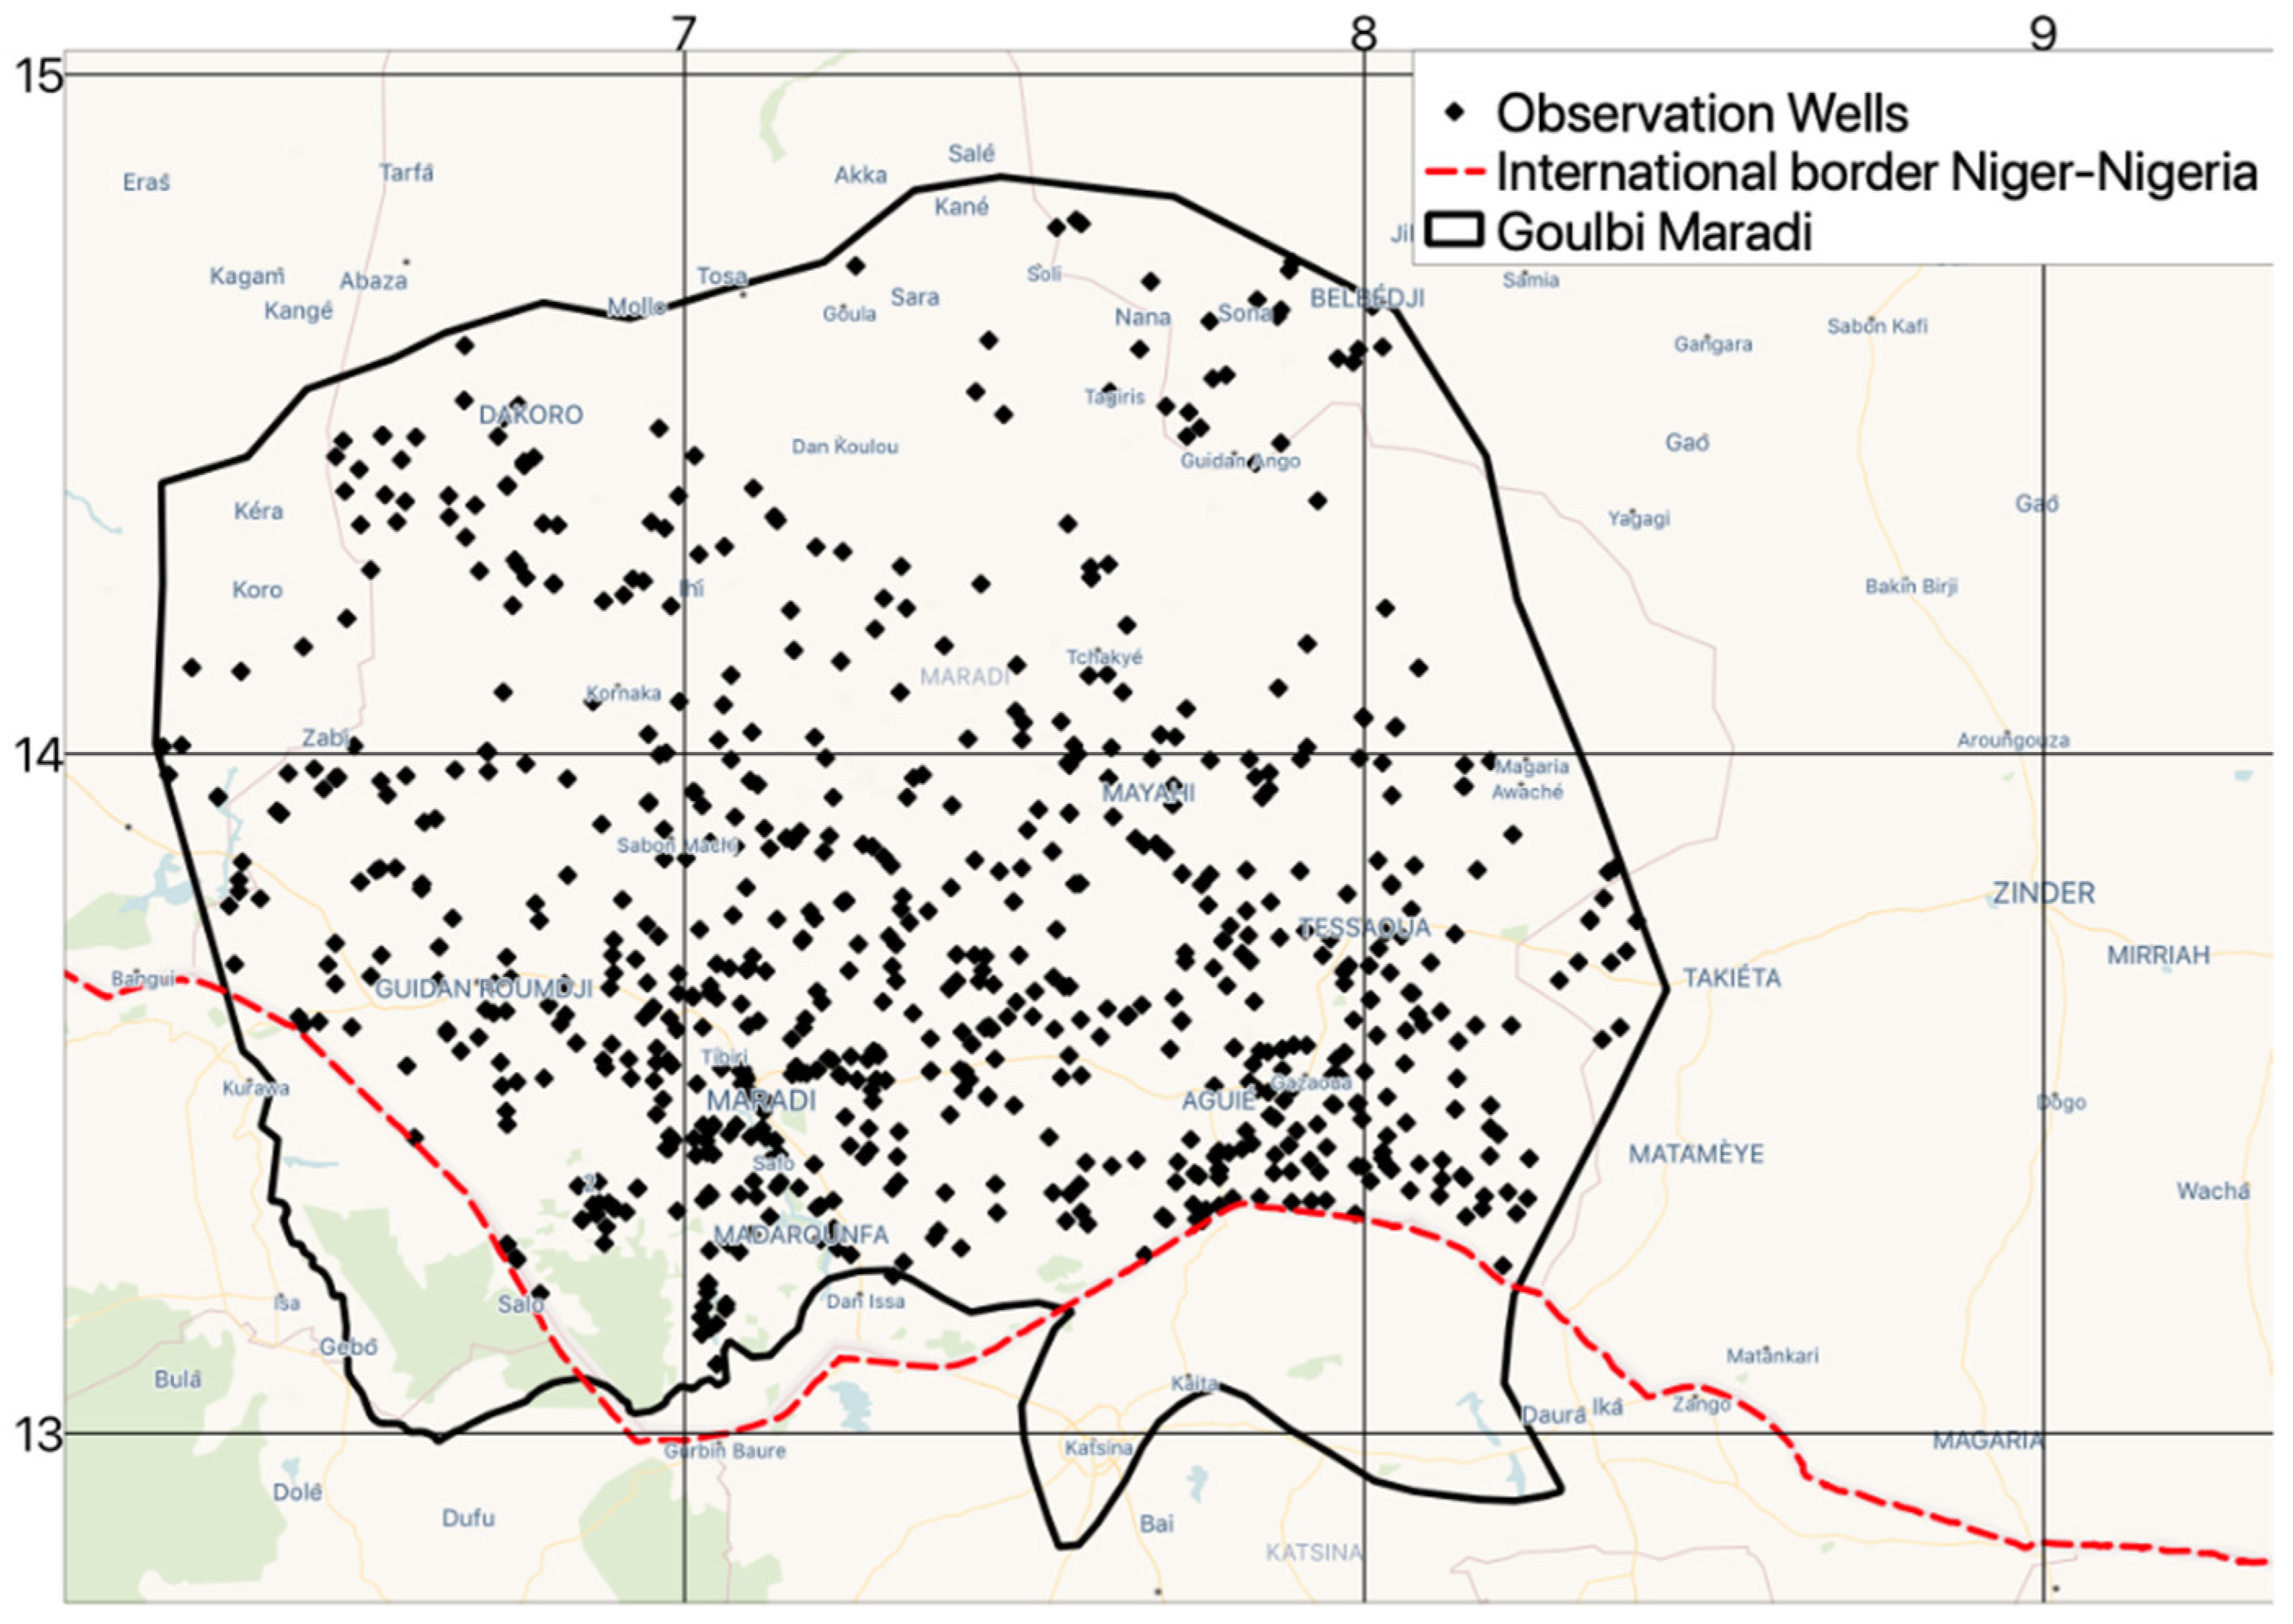
2.1. Well Data
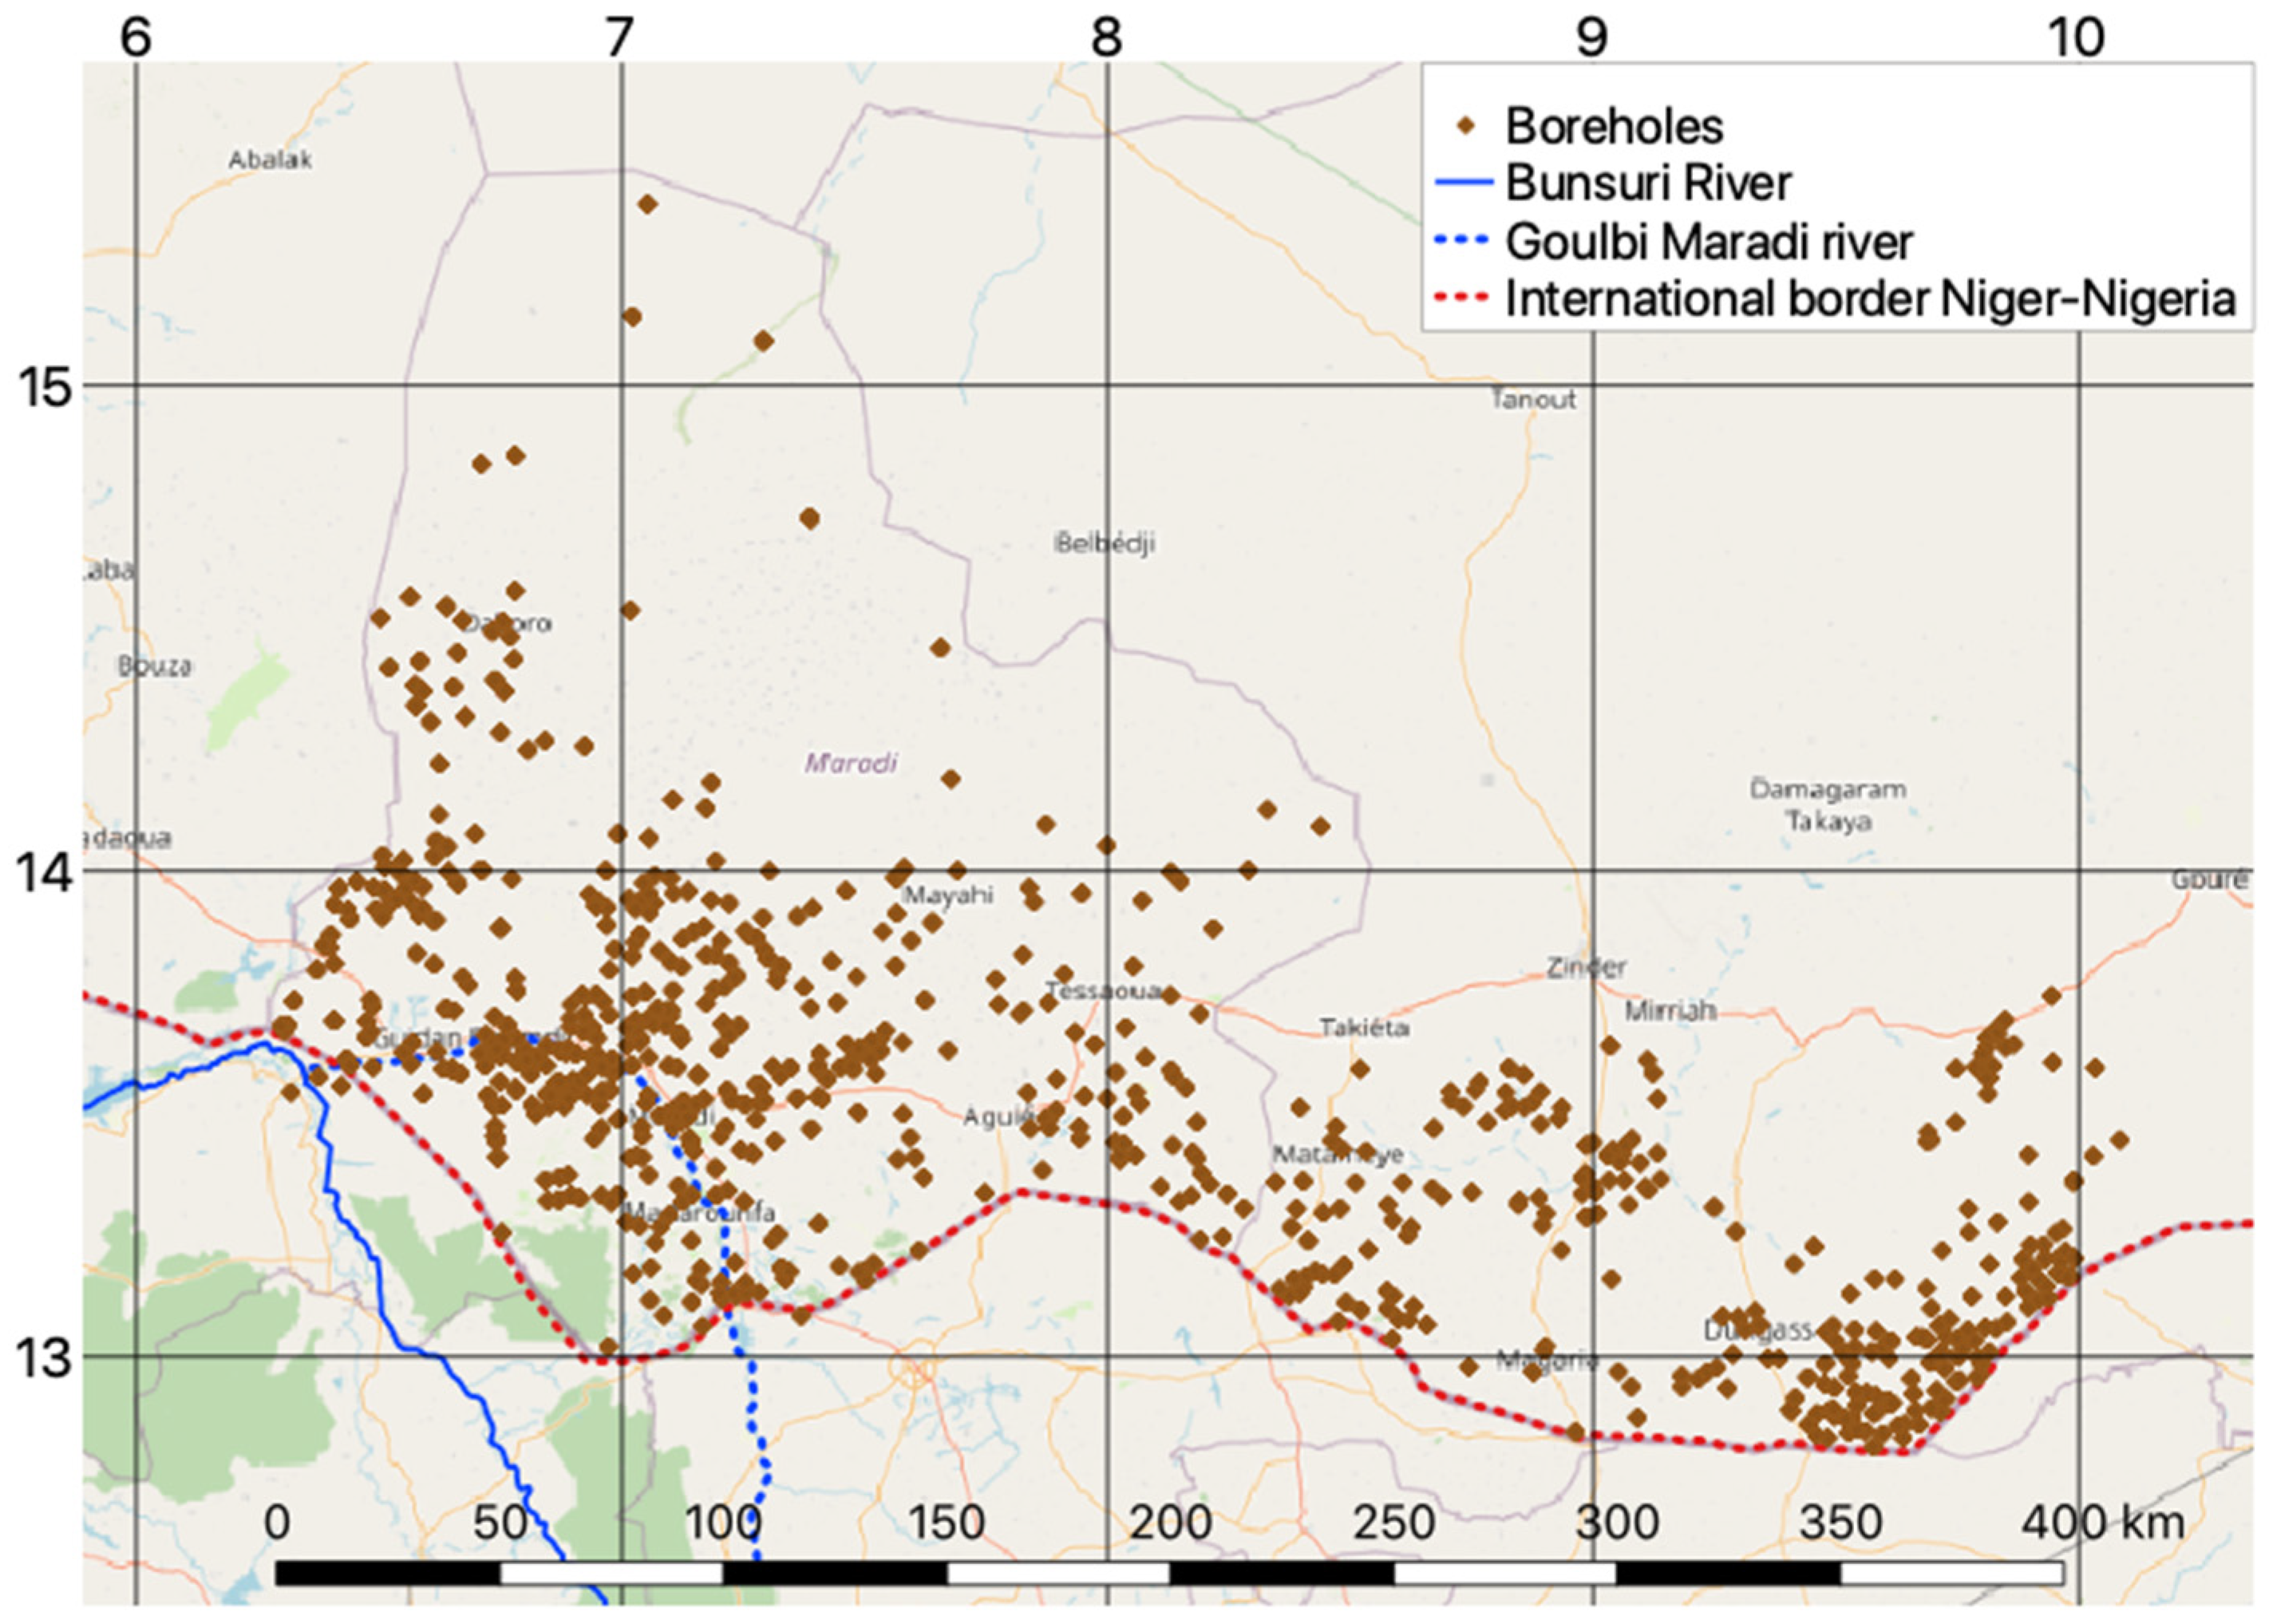
2.2. Boreholes
2.3. GRACE Data
3. Methods
3.1. Conceptual Model
3.1.1. Boundary Conditions
3.1.2. Flow Budget
3.2. MODFLOW
4. Model Development
4.1. Groundwater Volume
4.2. Recharge Rates
4.3. Computational Grid
4.4. Model Calibration
4.4.1. Parameters
4.4.2. Observations
4.5. Conversion to Predictive Model
5. Results
5.1. Calibration Results
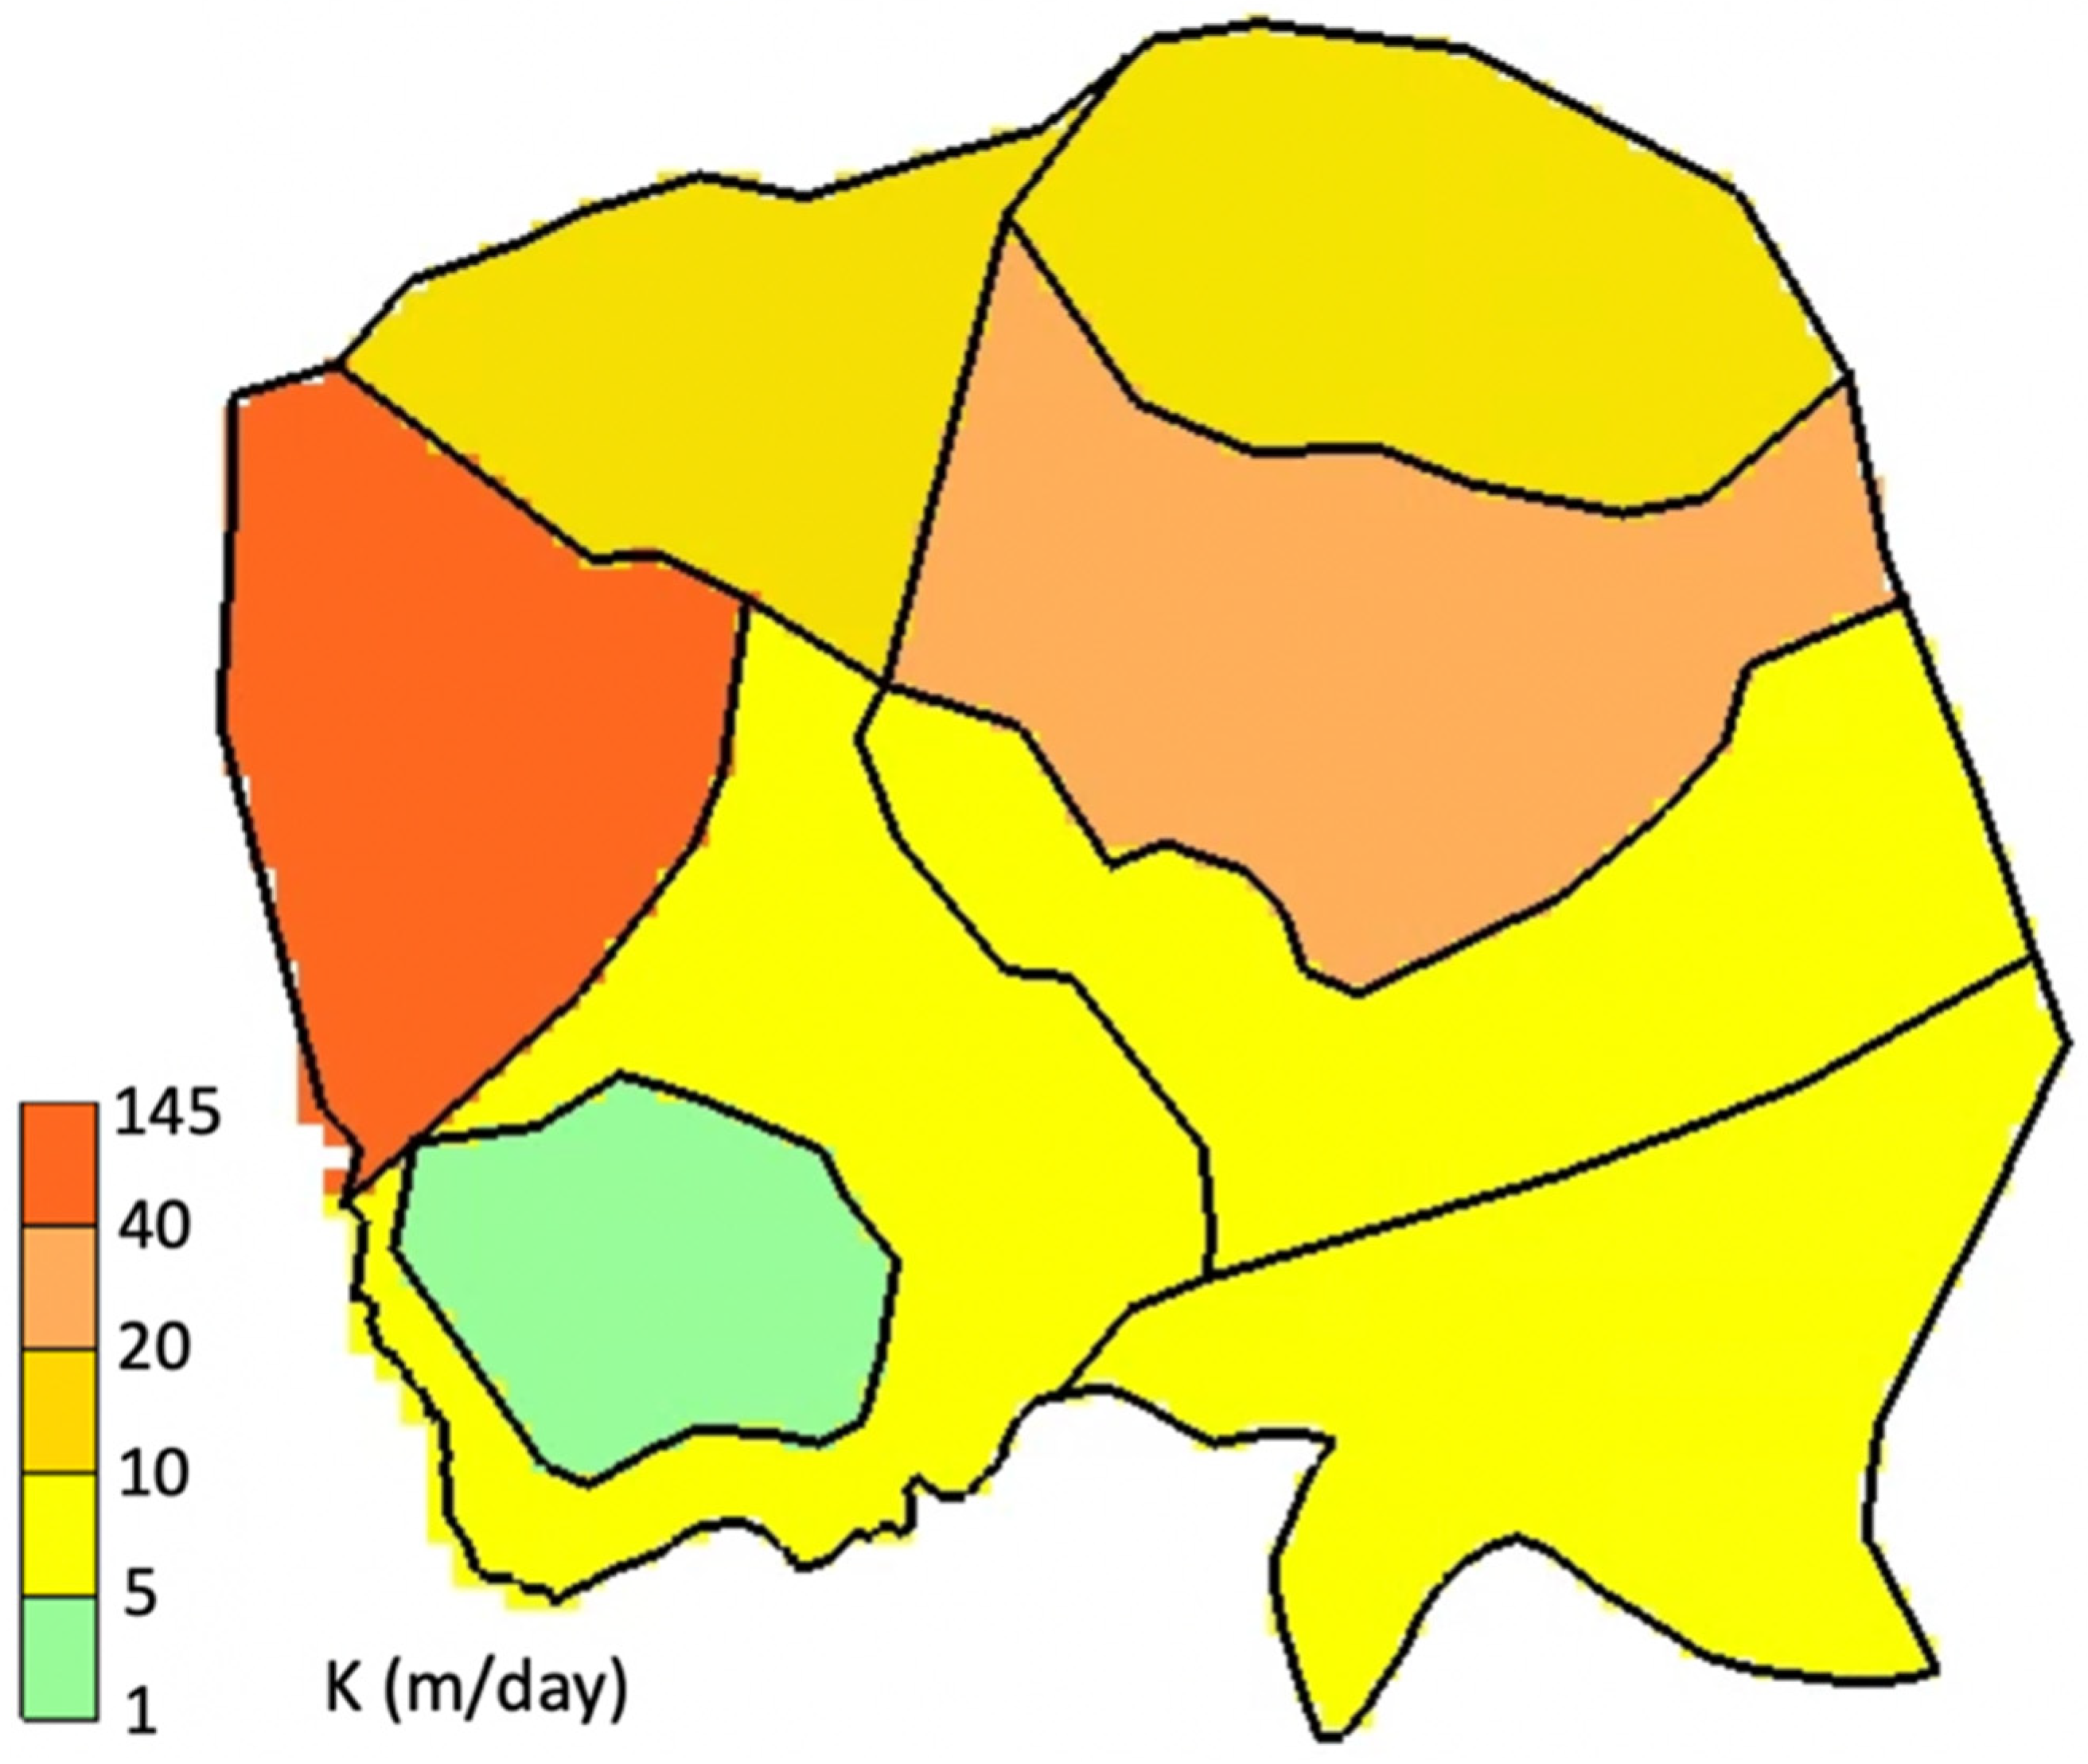
5.1.1. Optimized Parameter Values
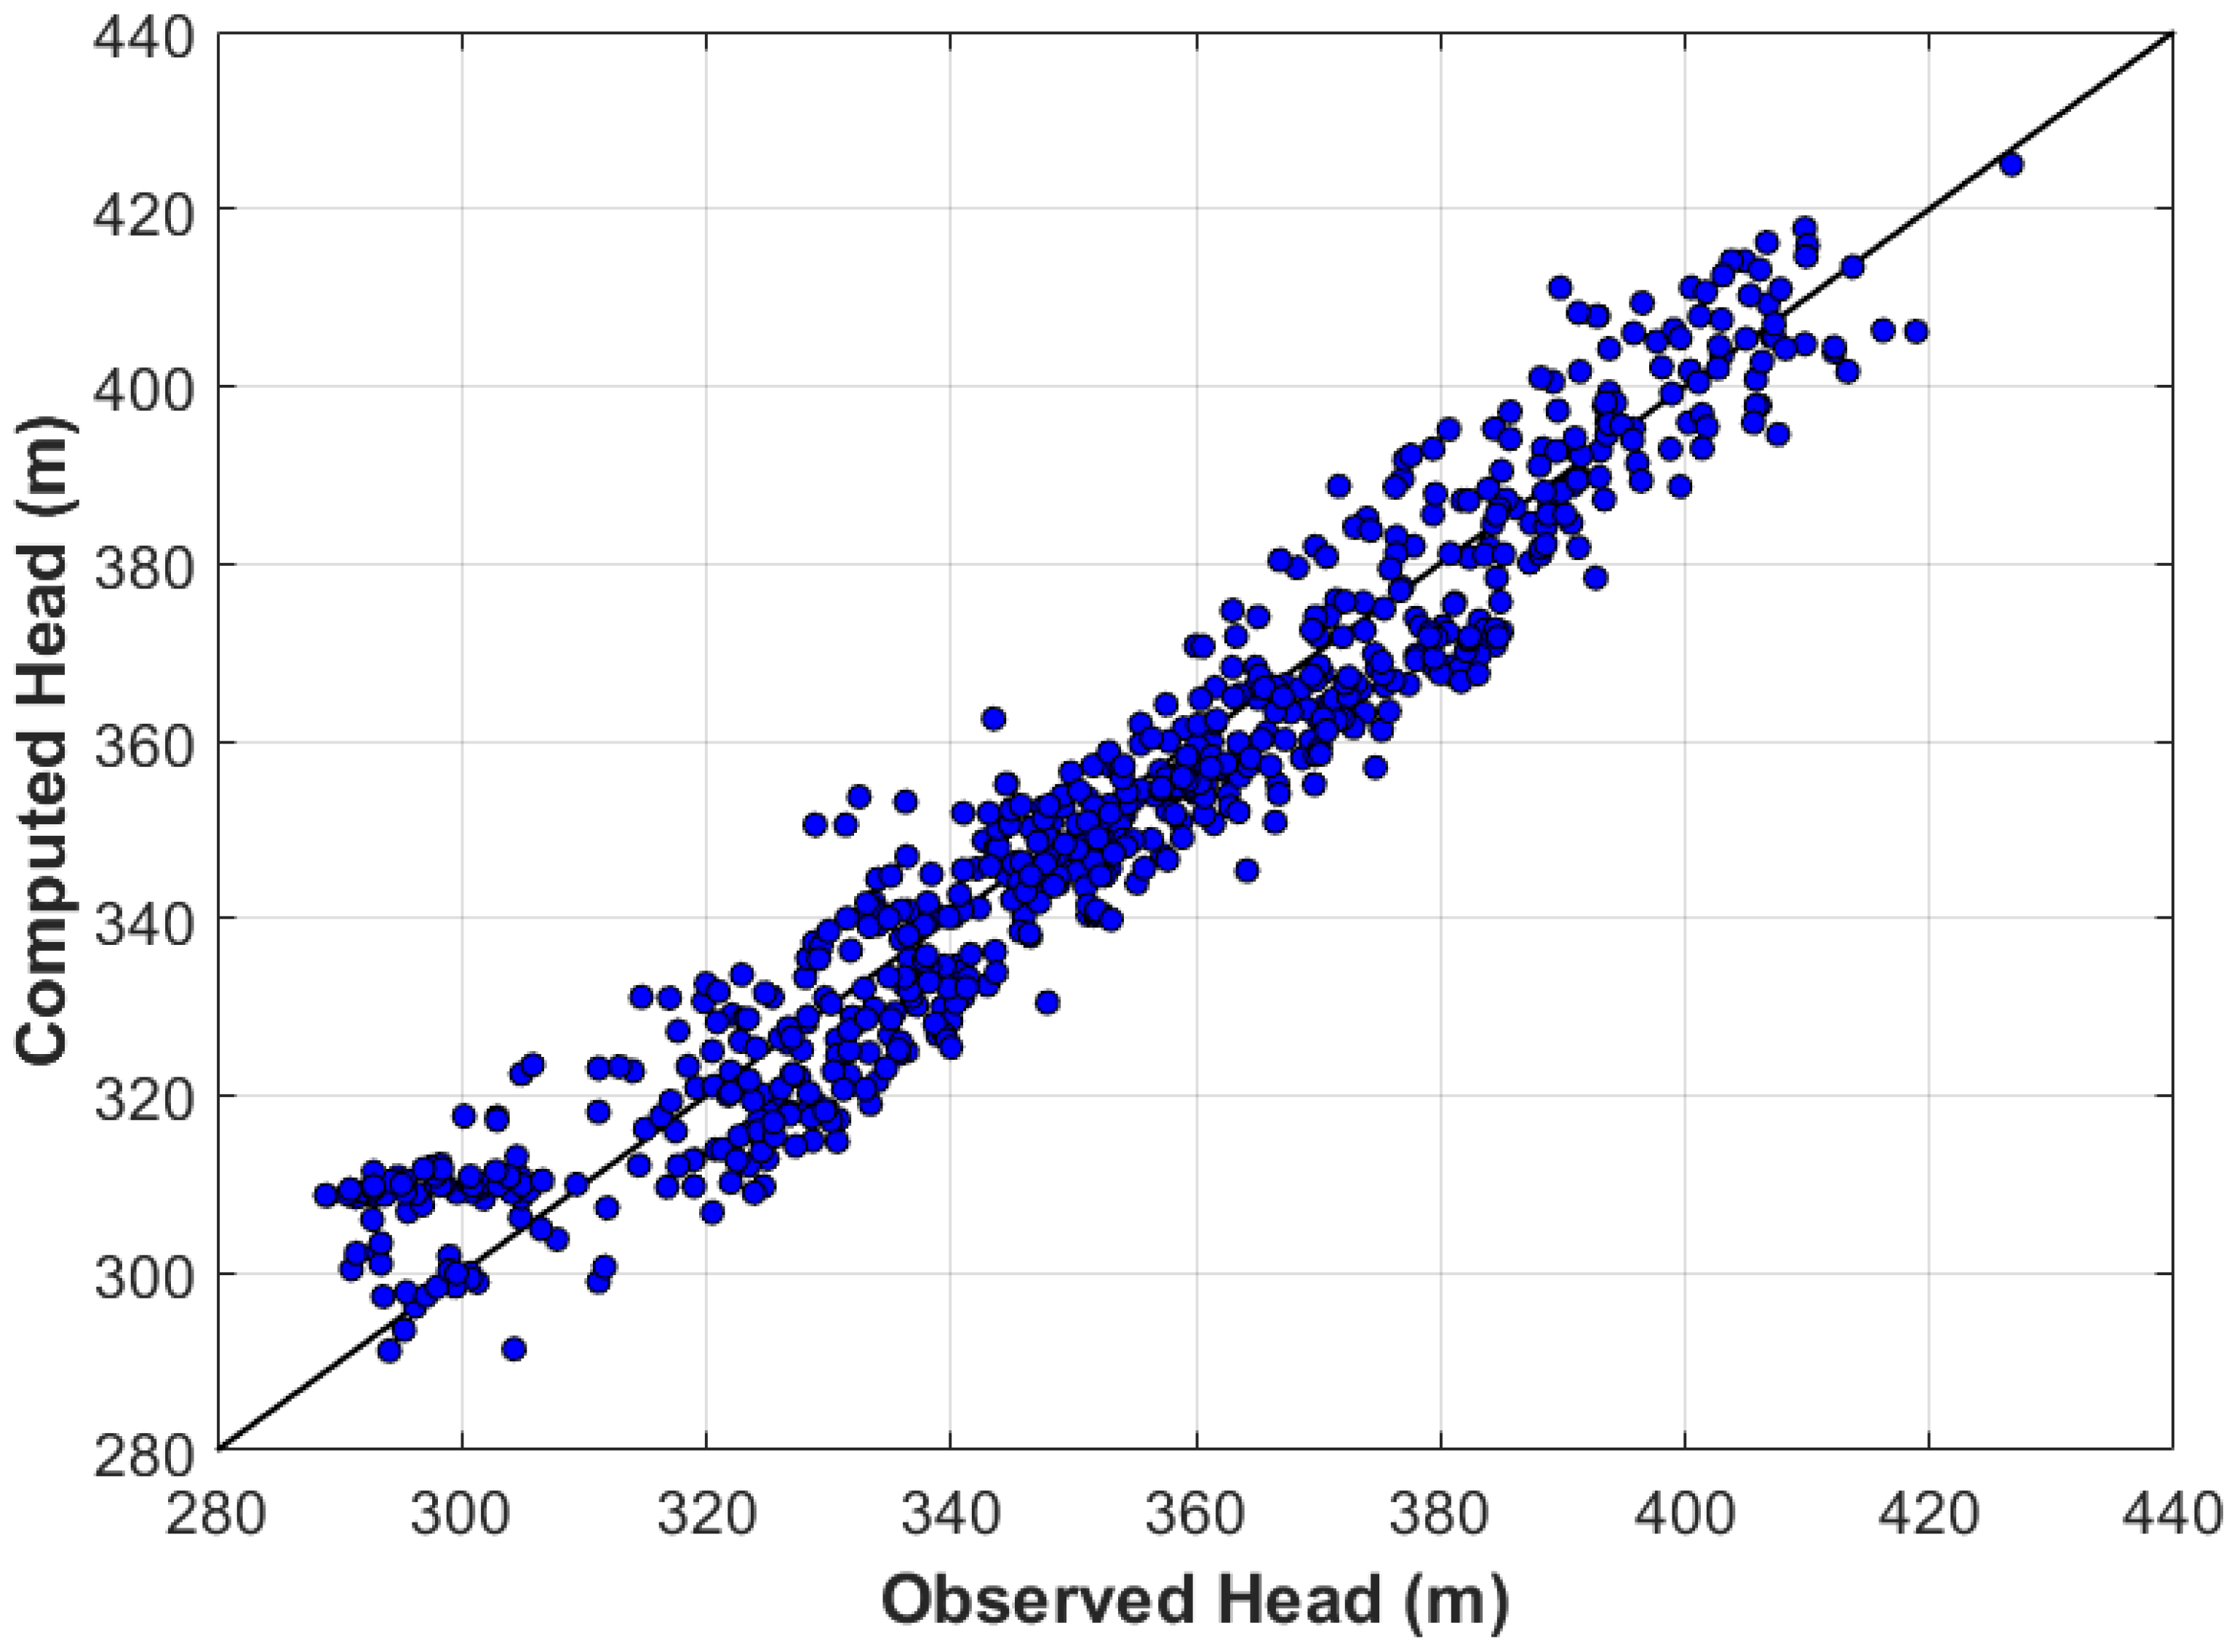
5.1.2. Computed vs. Observed Head Values
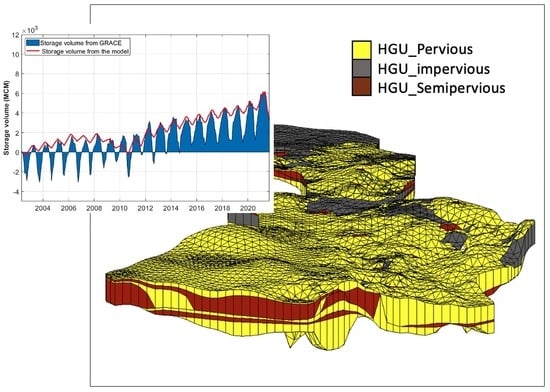
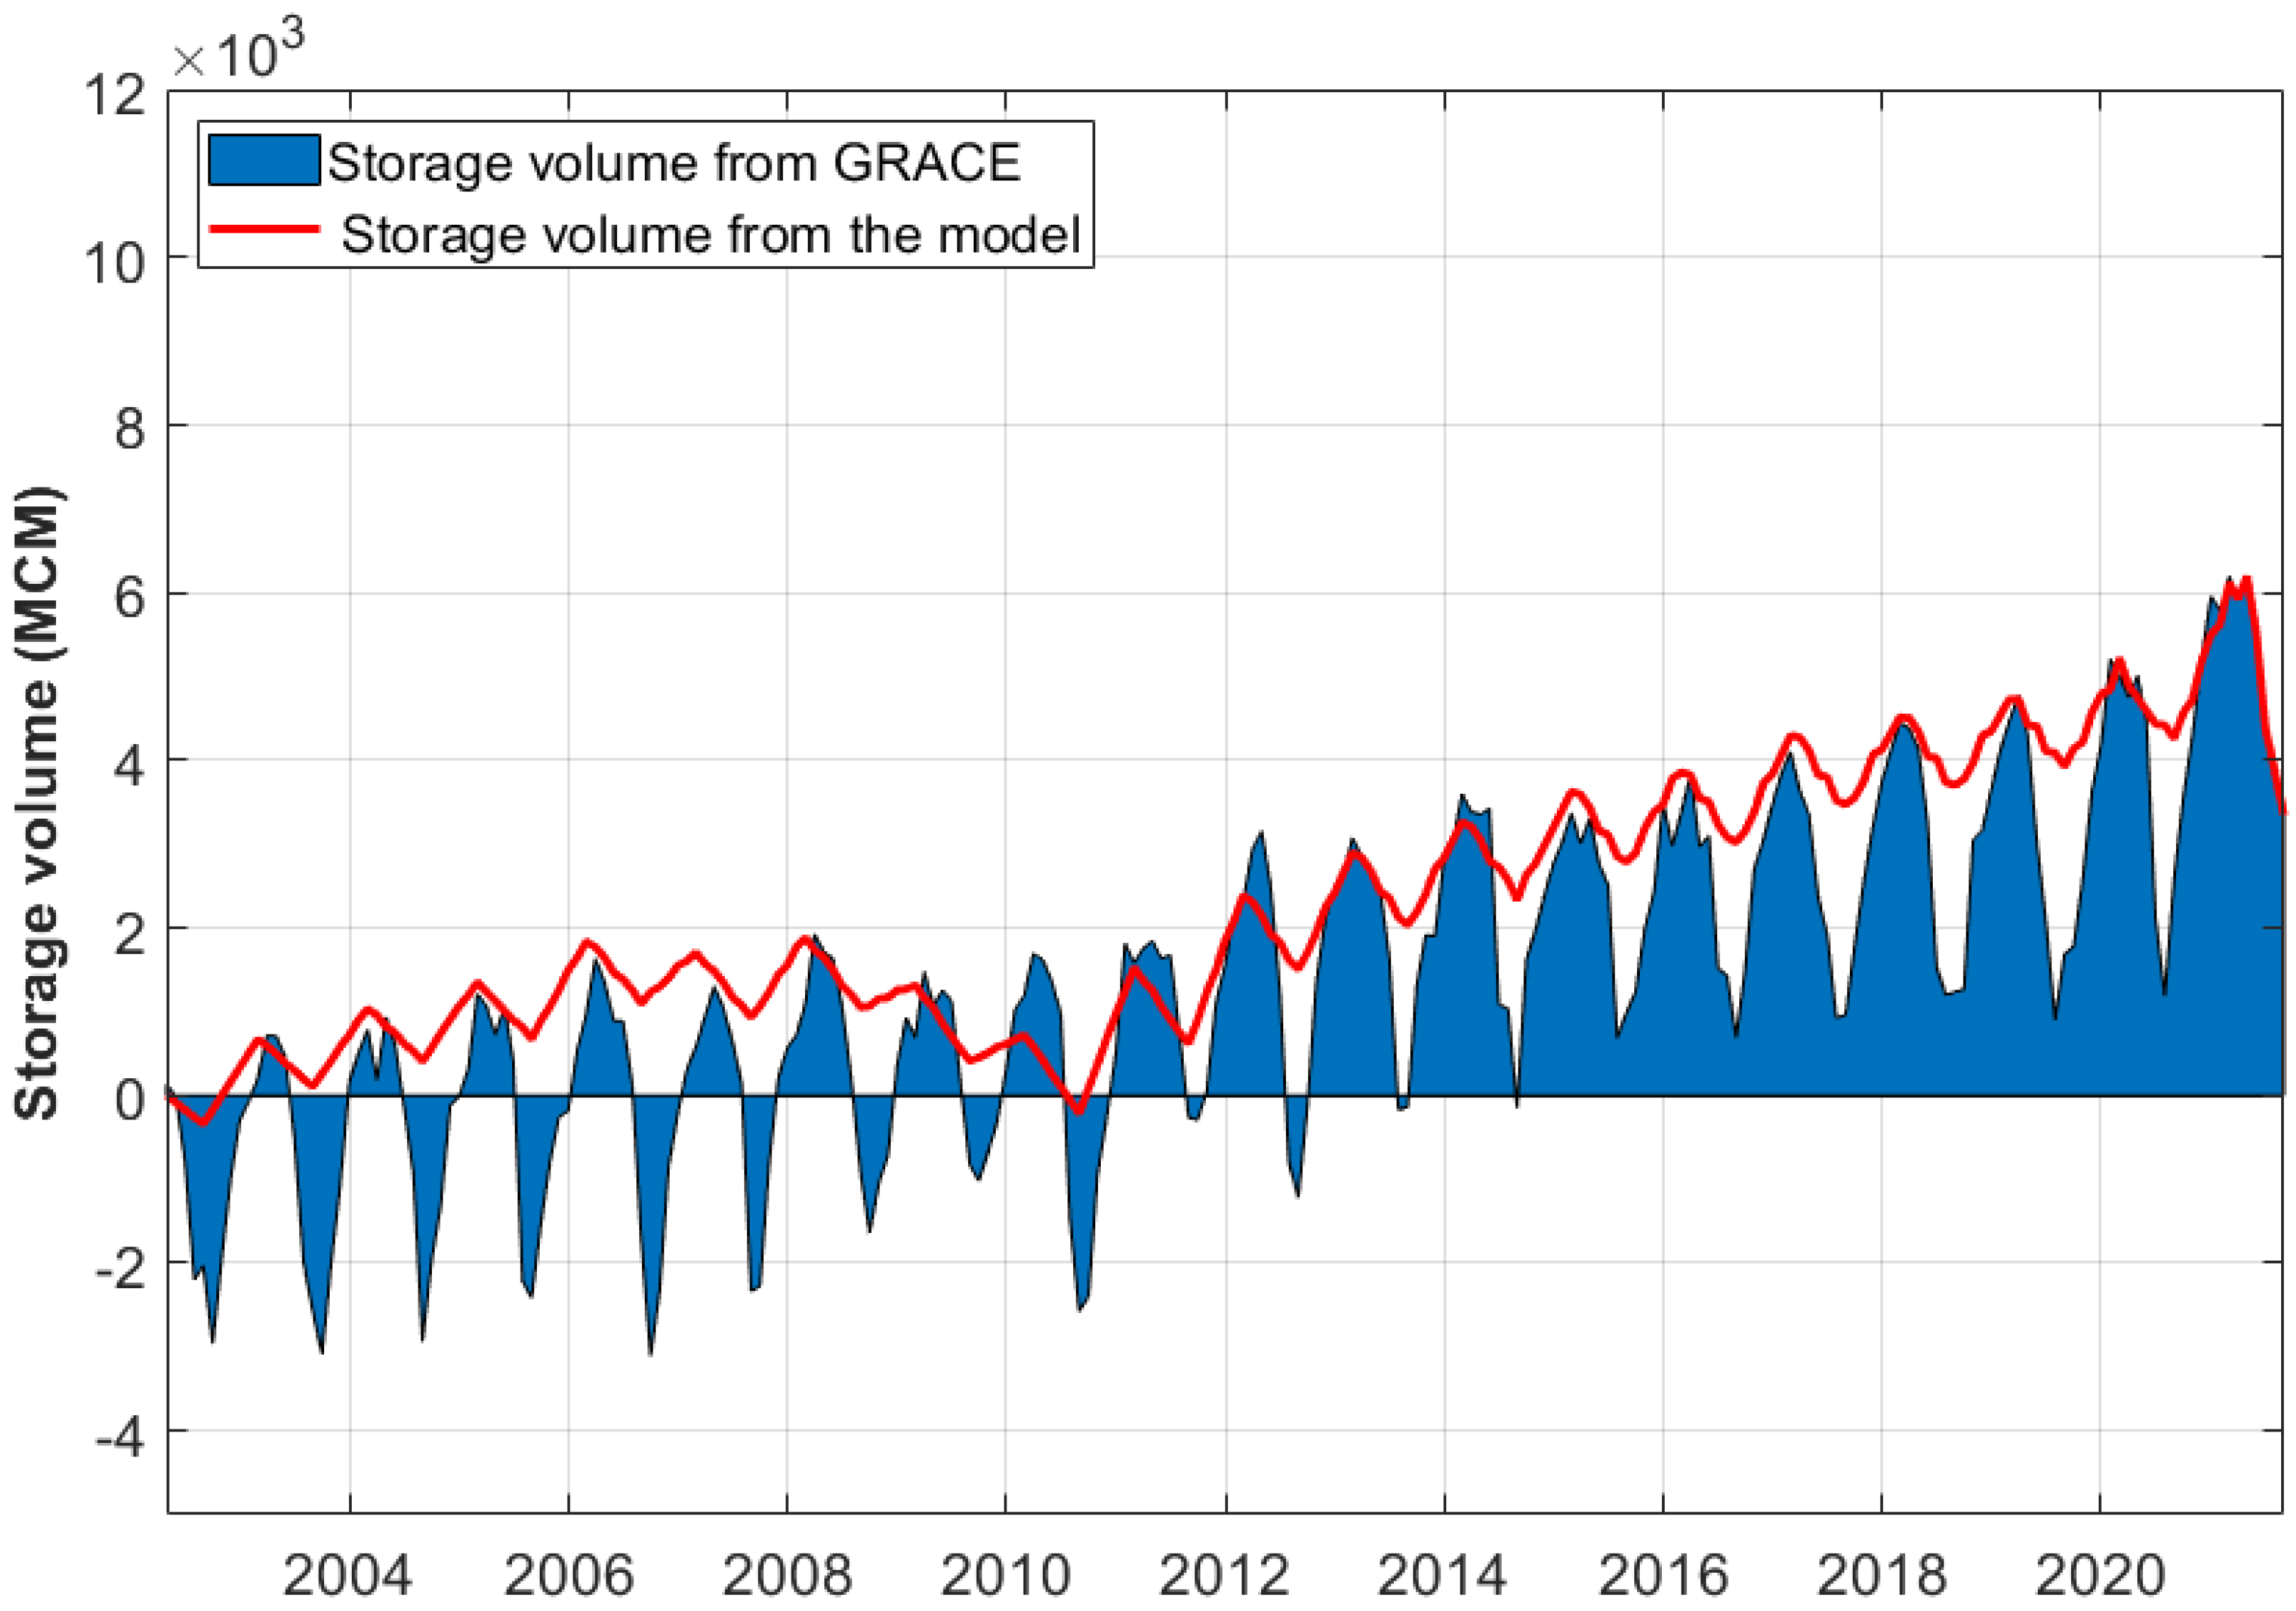
5.1.3. Storage Changes
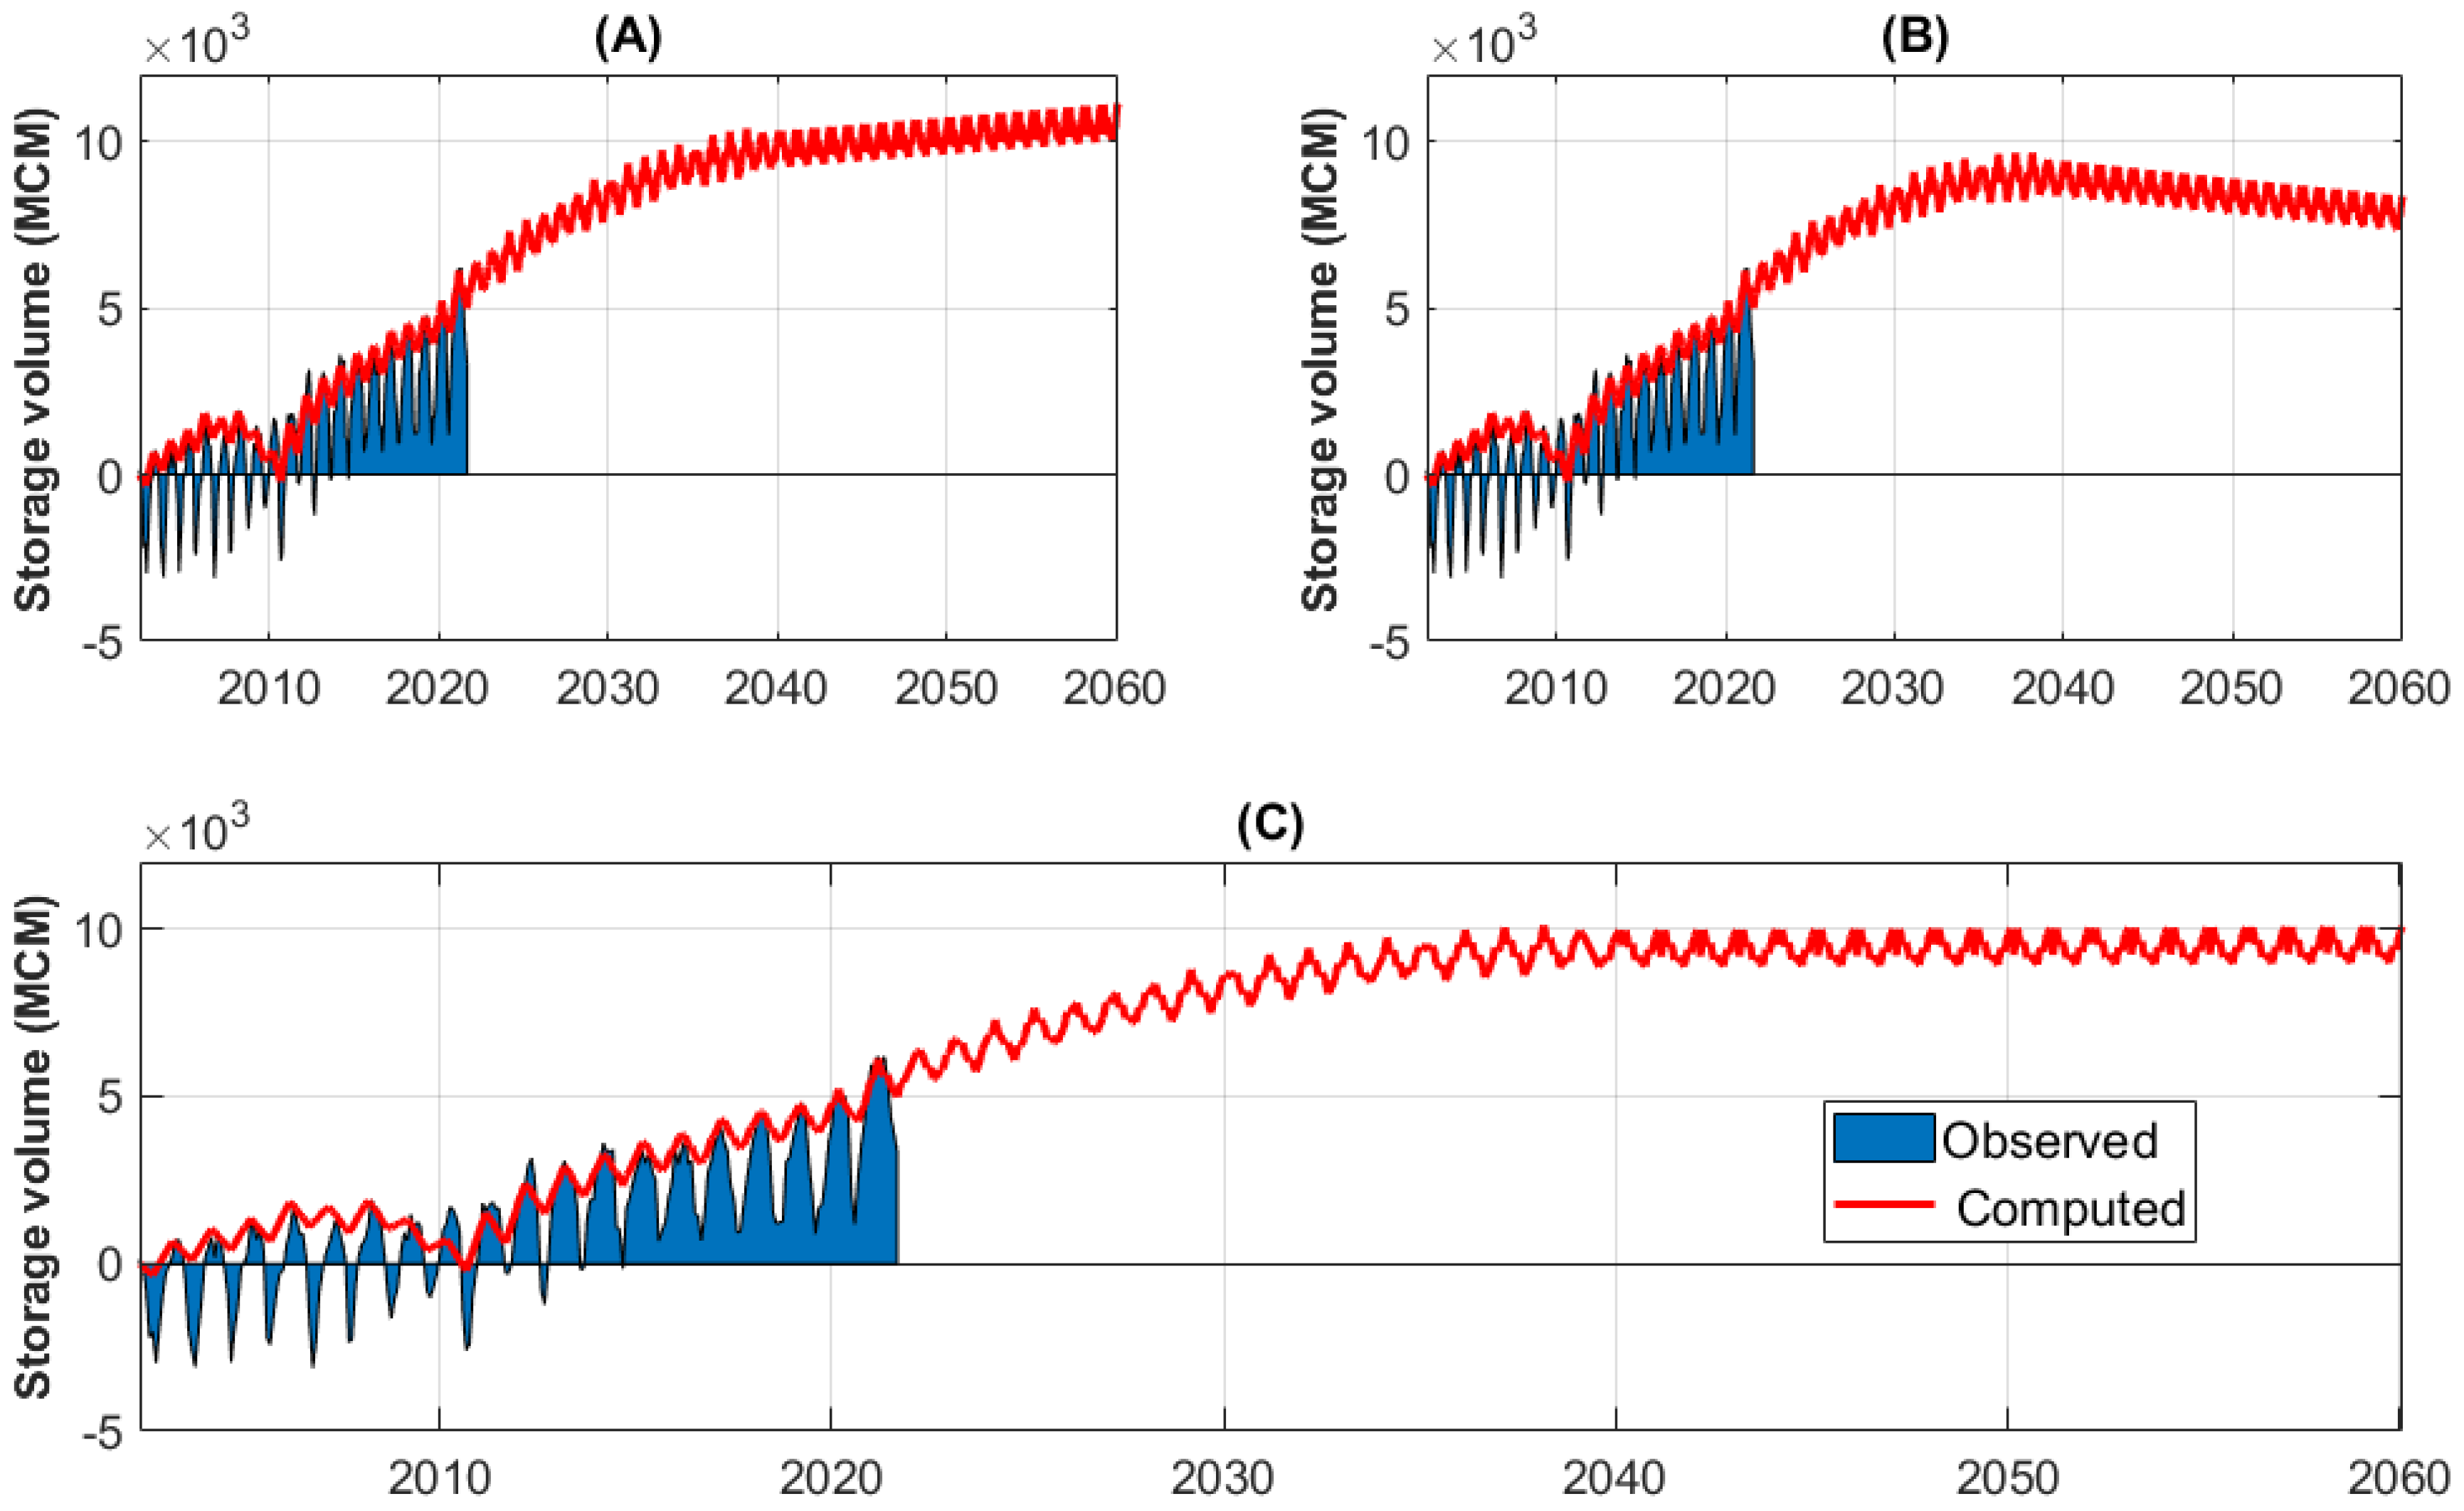
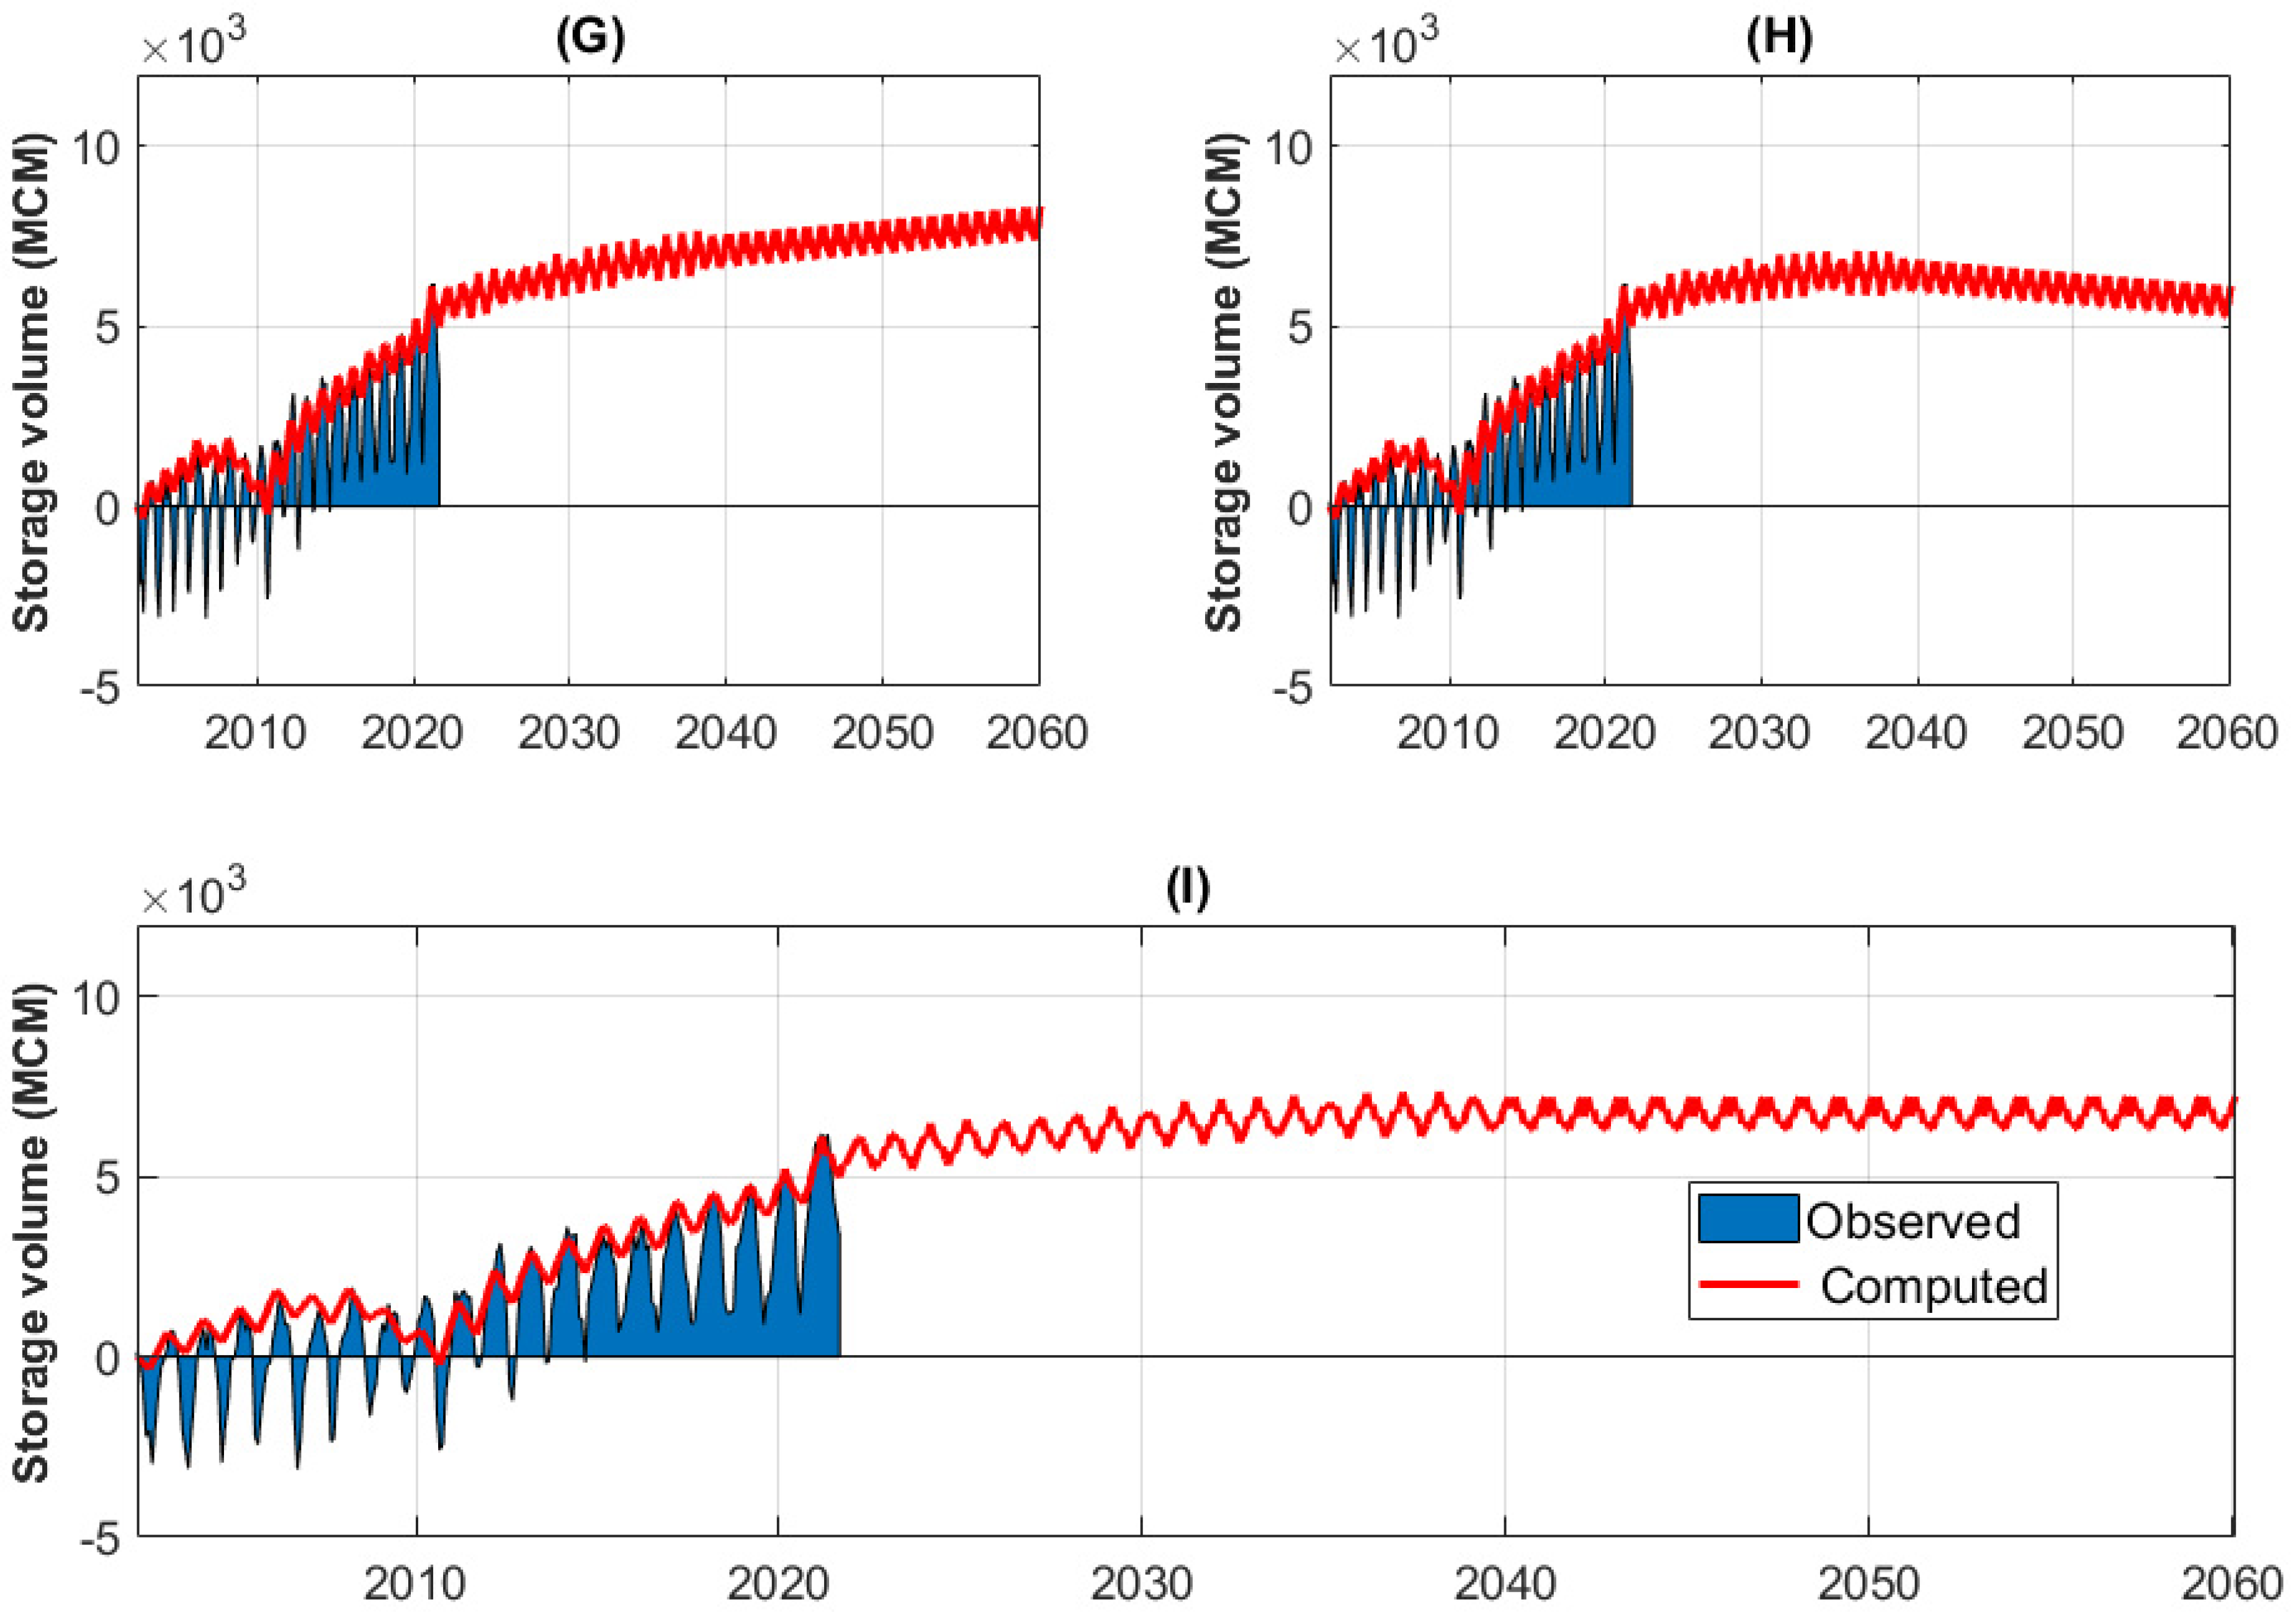
5.2. Predictive Model
5.2.1. Scenario 1: 5-Year Average Recharge
5.2.2. Scenario 2: 10-Year Average Recharge
5.2.3. Scenario 3: 20-Year Average Recharge
6. Conclusions
Author Contributions
Funding
Data Availability Statement
Conflicts of Interest
References
- INS-Niger. Recensement Général de La Population et de l’Habitat—Etat et Structure de la Population du Niger en 2012; Institute National de la Statistique: Niamey, Niger, 2015; 88p. [Google Scholar]
- Issoufou Ousmane, B.; Nazoumou, Y.; Favreau, G.; Abdou Babaye, M.S.; Abdou Mahaman, R.; Boucher, M.; Issoufa, I.; Lawson, F.M.A.; Vouillamoz, J.-M.; Legchenko, A.; et al. Changes in Aquifer Properties along a Seasonal River Channel of the Niger Basin: Identifying Groundwater Recharge Pathways in a Dryland Environment. J. Afr. Earth Sci. 2023, 197, 104742. [Google Scholar] [CrossRef]
- Andres, L.; Dambo, L.; Bode, S.; Baboussouna, A.; Yamba, B.; Lebailly, P. Irrigated Food Systems in Maradi, Republic of Niger: A Comparison between Operating Accounts. In Proceedings of the VII International Scientific Agriculture Symposium “AGROSYM 2016”, East Sarajevo, Bosnia, 6–9 October 2016; pp. 2763–2768. [Google Scholar]
- Yahouza, L.; Sandao, I.; Ousmane, B. Framework of the StudyContribution of Stable Isotopes of Water (18O and 2H) to the Characterization of Goulbi N’kaba Valley Aquifer, Region of Maradi in the Republic of Niger. Int. J. Hydro 2018, 2, 560–565. [Google Scholar]
- OCHA. Niger Maradi-Situation des Inondations, au 4 Octobre 2021-Niger|ReliefWeb. Available online: https://reliefweb.int/report/niger/niger-maradi-situation-des-inondations-au-04-octobre-2021 (accessed on 1 August 2023).
- Descloitres, M.; Chalikakis, K.; Legchenko, A.; Moussa, A.M.; Genthon, P.; Favreau, G.; Le Coz, M.; Boucher, M.; Oï, M. Investigation of Groundwater Resources in the Komadugu Yobe Valley (Lake Chad Basin, Niger) Using MRS and TDEM Methods. J. Afr. Earth Sci. 2013, 87, 71–85. [Google Scholar] [CrossRef]
- Qian, J.; Zhou, X.; Zhan, H.; Dong, H.; Ma, L. Numerical Simulation and Evaluation of Groundwater Resources in a Fractured Chalk Aquifer: A Case Study in Zinder Well Field, Niger. Env. Earth Sci. 2014, 72, 3053–3065. [Google Scholar] [CrossRef]
- Werth, S.; White, D.; Bliss, D.W. GRACE Detected Rise of Groundwater in the Sahelian Niger River Basin. J. Geophys. Res. Solid Earth 2017, 122, 10459–10477. [Google Scholar] [CrossRef]
- Jackson, T.J. Remote Sensing of Soil Moisture: Implications for Groundwater Recharge. Hydrogeol. J. 2002, 10, 40–51. [Google Scholar] [CrossRef]
- Brunner, P.; Bauer, P.; Eugster, M.; Kinzelbach, W. Using Remote Sensing to Regionalize Local Precipitation Recharge Rates Obtained from the Chloride Method. J. Hydrol. 2004, 294, 241–250. [Google Scholar] [CrossRef]
- Schmid, T.; Koch, M.; Gumuzzio, J. Multisensor Approach to Determine Changes of Wetland Characteristics in Semiarid Environments (Central Spain). IEEE Trans. Geosci. Remote Sens. 2005, 43, 2516–2525. [Google Scholar] [CrossRef]
- OSS. Système Aquifère d’Iullemeden: Gestion Concertée Des Ressources En Eau Partagées d’un Aquifère Transfrontalier Sahélien|Bienvenue à l’Observatoire Du Sahara et Du Sahel. Available online: http://www.oss-online.org/fr/publications/OSS-SAI-CS1 (accessed on 7 December 2022).
- Durand, A.; Icole, M.; Bieda, S. Sediments Et Climats Quaternaires Du Sahel Central: Exemple de La Vallee de Maradi Niger Meridional. Cah. ORSTOM Série Géologie 1981, 12, 77–90. [Google Scholar]
- OSS. Iullemeden Aquifer System: Hydrogeological Model—Volume III; Sahara and Sahel Observatory: Tunis, Tunisia, 2011; 89p. [Google Scholar]
- Barbosa, S.A.; Pulla, S.T.; Williams, G.P.; Jones, N.L.; Mamane, B.; Sanchez, J.L. Evaluating Groundwater Storage Change and Recharge Using GRACE Data: A Case Study of Aquifers in Niger, West Africa. Remote Sens. 2022, 14, 1532. [Google Scholar] [CrossRef]
- Scanlon, B.R.; Rateb, A.; Anyamba, A.; Kebede, S.; MacDonald, A.M.; Shamsudduha, M.; Small, J.; Sun, A.; Taylor, R.G.; Xie, H. Linkages between GRACE Water Storage, Hydrologic Extremes, and Climate Teleconnections in Major African Aquifers. Environ. Res. Lett. 2022, 17, 014046. [Google Scholar] [CrossRef]
- Bonsor, H.C.; Shamsudduha, M.; Marchant, B.P.; MacDonald, A.M.; Taylor, R.G. Seasonal and Decadal Groundwater Changes in African Sedimentary Aquifers Estimated Using GRACE Products and LSMs. Remote Sens. 2018, 10, 904. [Google Scholar] [CrossRef]
- NASA JPL. Prolific Earth Gravity Satellites End Science Mission. Available online: https://www.jpl.nasa.gov/news/prolific-earth-gravity-satellites-end-science-mission (accessed on 4 March 2020).
- Landerer, F.W.; Flechtner, F.M.; Save, H.; Webb, F.H.; Bandikova, T.; Bertiger, W.I.; Bettadpur, S.V.; Byun, S.H.; Dahle, C.; Dobslaw, H. Extending the Global Mass Change Data Record: GRACE Follow-On Instrument and Science Data Performance. Geophys. Res. Lett. 2020, 47, e2020GL088306. [Google Scholar] [CrossRef]
- Callery, S. GRACE-FO Launches Aboard a SpaceX Falcon 9. Available online: https://gracefo.jpl.nasa.gov/resources/77/grace-fo-launches-aboard-a-spacex-falcon-9 (accessed on 4 March 2020).
- Tapley, B.D.; Bettadpur, S.; Ries, J.C.; Thompson, P.F.; Watkins, M.M. GRACE Measurements of Mass Variability in the Earth System. Science 2004, 305, 503–505. [Google Scholar] [CrossRef] [PubMed]
- Dunbar, B. “GRACE Mission”. Spacecraft. Available online: http://www.nasa.gov/mission_pages/Grace/spacecraft/index.html (accessed on 1 May 2023).
- Dunbar, B. “GRACE Mission” Mission Overview. Available online: http://www.nasa.gov/mission_pages/Grace/overview/index.html (accessed on 29 January 2022).
- Scanlon, B.R.; Zhang, Z.; Save, H.; Wiese, D.N.; Landerer, F.W.; Long, D.; Longuevergne, L.; Chen, J. Global Evaluation of New GRACE Mascon Products for Hydrologic Applications. Water Resour. Res. 2016, 52, 9412–9429. [Google Scholar] [CrossRef]
- Chen, J.L.; Wilson, C.R.; Tapley, B.D. The 2009 Exceptional Amazon Flood and Interannual Terrestrial Water Storage Change Observed by GRACE. Water Resour. Res. 2010, 46. [Google Scholar] [CrossRef]
- Reager, J.T.; Famiglietti, J.S. Characteristic Mega-Basin Water Storage Behavior Using GRACE. Water Resour. Res. 2013, 49, 3314–3329. [Google Scholar] [CrossRef] [PubMed]
- Idowu, D.; Zhou, W. Performance Evaluation of a Potential Component of an Early Flood Warning System—A Case Study of the 2012 Flood, Lower Niger River Basin, Nigeria. Remote Sens. 2019, 11, 1970. [Google Scholar] [CrossRef]
- Chen, X.; Jiang, J.; Li, H. Drought and Flood Monitoring of the Liao River Basin in Northeast China Using Extended GRACE Data. Remote Sens. 2018, 10, 1168. [Google Scholar] [CrossRef]
- Sun, Z.; Zhu, X.; Pan, Y.; Zhang, J. Assessing Terrestrial Water Storage and Flood Potential Using GRACE Data in the Yangtze River Basin, China. Remote Sens. 2017, 9, 1011. [Google Scholar] [CrossRef]
- Leblanc, M.J.; Tregoning, P.; Ramillien, G.; Tweed, S.O.; Fakes, A. Basin-Scale, Integrated Observations of the Early 21st Century Multiyear Drought in Southeast Australia. Water Resour. Res. 2009, 45. [Google Scholar] [CrossRef]
- Chen, J.L.; Wilson, C.R.; Tapley, B.D.; Longuevergne, L.; Yang, Z.L.; Scanlon, B.R. Recent La Plata Basin Drought Conditions Observed by Satellite Gravimetry. J. Geophys. Res. Atmos. 2010, 115. [Google Scholar] [CrossRef]
- Paredes-Trejo, F.; Barbosa, H.A.; Giovannettone, J.; Kumar, T.V.; Thakur, M.K.; Buriti, C.d.O.; Uzcátegui-Briceño, C. Drought Assessment in the São Francisco River Basin Using Satellite-Based and Ground-Based Indices. Remote Sens. 2021, 13, 3921. [Google Scholar] [CrossRef]
- Tian, K.; Wang, Z.; Li, F.; Gao, Y.; Xiao, Y.; Liu, C. Drought Events over the Amazon River Basin (1993–2019) as Detected by the Climate-Driven Total Water Storage Change. Remote Sens. 2021, 13, 1124. [Google Scholar] [CrossRef]
- Shahzaman, M.; Zhu, W.; Ullah, I.; Mustafa, F.; Bilal, M.; Ishfaq, S.; Nisar, S.; Arshad, M.; Iqbal, R.; Aslam, R.W. Comparison of Multi-Year Reanalysis, Models, and Satellite Remote Sensing Products for Agricultural Drought Monitoring over South Asian Countries. Remote Sens. 2021, 13, 3294. [Google Scholar] [CrossRef]
- Wang, W.; Shen, Y.; Wang, F.; Li, W. Two Severe Prolonged Hydrological Droughts Analysis over Mainland Australia Using GRACE Satellite Data. Remote Sens. 2021, 13, 1432. [Google Scholar] [CrossRef]
- Kalu, I.; Ndehedehe, C.E.; Okwuashi, O.; Eyoh, A.E. Assessing Freshwater Changes over Southern and Central Africa (2002–2017). Remote Sens. 2021, 13, 2543. [Google Scholar] [CrossRef]
- Chen, Z.; Zhang, X.; Chen, J. Monitoring Terrestrial Water Storage Changes with the Tongji-Grace2018 Model in the Nine Major River Basins of the Chinese Mainland. Remote Sens. 2021, 13, 1851. [Google Scholar] [CrossRef]
- Nicolas, J.; Verdun, J.; Boy, J.-P.; Bonhomme, L.; Asri, A.; Corbeau, A.; Berthier, A.; Durand, F.; Clarke, P. Improved Hydrological Loading Models in South America: Analysis of GPS Displacements Using M-SSA. Remote Sens. 2021, 13, 1605. [Google Scholar] [CrossRef]
- McStraw, T.C.; Pulla, S.T.; Jones, N.L.; Williams, G.P.; David, C.H.; Nelson, J.E.; Ames, D.P. An Open-Source Web Application for Regional Analysis of GRACE Groundwater Data and Engaging Stakeholders in Groundwater Management. JAWRA J. Am. Water Resour. Assoc. 2021, 58, 1002–1016. [Google Scholar] [CrossRef]
- Rodell, M.; Famiglietti, J.S. The Potential for Satellite-Based Monitoring of Groundwater Storage Changes Using GRACE: The High Plains Aquifer, Central US. J. Hydrol. 2002, 263, 245–256. [Google Scholar] [CrossRef]
- Mehrnegar, N.; Jones, O.; Singer, M.B.; Schumacher, M.; Jagdhuber, T.; Scanlon, B.R.; Rateb, A.; Forootan, E. Exploring Groundwater and Soil Water Storage Changes across the CONUS at 12.5 Km Resolution by a Bayesian Integration of GRACE Data into W3RA. Sci. Total Environ. 2021, 758, 143579. [Google Scholar] [CrossRef]
- Sun, A.Y.; Green, R.; Swenson, S.; Rodell, M. Toward Calibration of Regional Groundwater Models Using GRACE Data. J. Hydrol. 2012, 422–423, 1–9. [Google Scholar] [CrossRef]
- Scanlon, B.R.; Longuevergne, L.; Long, D. Ground Referencing GRACE Satellite Estimates of Groundwater Storage Changes in the California Central Valley, USA. Water Resour. Res. 2012, 48. [Google Scholar] [CrossRef]
- Voss, K.A.; Famiglietti, J.S.; Lo, M.; De Linage, C.; Rodell, M.; Swenson, S.C. Groundwater Depletion in the Middle East from GRACE with Implications for Transboundary Water Management in the Tigris-Euphrates-Western Iran Region. Water Resour. Res. 2013, 49, 904–914. [Google Scholar] [CrossRef] [PubMed]
- Strassberg, G.; Scanlon, B.R.; Chambers, D. Evaluation of Groundwater Storage Monitoring with the GRACE Satellite: Case Study of the High Plains Aquifer, Central United States. Water Resour. Res. 2009, 45. [Google Scholar] [CrossRef]
- Wahr, J.; Molenaar, M.; Bryan, F. Time Variability of the Earth’s Gravity Field: Hydrological and Oceanic Effects and Their Possible Detection Using GRACE. J. Geophys. Res. Solid Earth 1998, 103, 30205–30229. [Google Scholar] [CrossRef]
- Lemon, A.M.; Jones, N.L. Building Solid Models from Boreholes and User-Defined Cross-Sections. Comput. Geosci. 2003, 29, 547–555. [Google Scholar] [CrossRef]
- Purdy, A.J.; David, C.H.; Sikder, M.S.; Reager, J.T.; Chandanpurkar, H.A.; Jones, N.L.; Matin, M.A. An Open-Source Tool to Facilitate the Processing of GRACE Observations and GLDAS Outputs: An Evaluation in Bangladesh. Front. Environ. Sci. 2019, 7, 00155. [Google Scholar] [CrossRef]
- Syed, T.H.; Famiglietti, J.S.; Rodell, M.; Chen, J.; Wilson, C.R. Analysis of Terrestrial Water Storage Changes from GRACE and GLDAS. Water Resour. Res. 2008, 44. [Google Scholar] [CrossRef]
- Famiglietti, J.S.; Lo, M.; Ho, S.L.; Bethune, J.; Anderson, K.J.; Syed, T.H.; Swenson, S.C.; de Linage, C.R.; Rodell, M. Satellites Measure Recent Rates of Groundwater Depletion in California’s Central Valley. Geophys. Res. Lett. 2011, 38. [Google Scholar] [CrossRef]
- Rodell, M.; Velicogna, I.; Famiglietti, J.S. Satellite-Based Estimates of Groundwater Depletion in India. Nature 2009, 460, 999–1002. [Google Scholar] [CrossRef] [PubMed]
- Richey, A.S.; Thomas, B.F.; Lo, M.-H.; Reager, J.T.; Famiglietti, J.S.; Voss, K.; Swenson, S.; Rodell, M. Quantifying Renewable Groundwater Stress with GRACE. Water Resour. Res. 2015, 51, 5217–5238. [Google Scholar] [CrossRef]
- Khaki, M.; Forootan, E.; Kuhn, M.; Awange, J.; Papa, F.; Shum, C.K. A Study of Bangladesh’s Sub-Surface Water Storages Using Satellite Products and Data Assimilation Scheme. Sci. Total Environ. 2018, 625, 963–977. [Google Scholar] [CrossRef]
- Xiao, R.; He, X.; Zhang, Y.; Ferreira, V.; Chang, L. Monitoring Groundwater Variations from Satellite Gravimetry and Hydrological Models: A Comparison with in-Situ Measurements in the Mid-Atlantic Region of the United States. Remote Sens. 2015, 7, 686–703. [Google Scholar] [CrossRef]
- Nanteza, J.; Reager, J.T.; Richey, A.S.; Liu, H.; Famiglietti, J.S.; Rodell, M. The Link between Surface and Groundwater Variations over East Africa Using GRACE and Altimetry Data. In Proceedings of the AGU 2012, San Francisco, CA, USA, 3–7 December 2012. [Google Scholar]
- Joodaki, G.; Wahr, J.; Swenson, S. Estimating the Human Contribution to Groundwater Depletion in the Middle East, from GRACE Data, Land Surface Models, and Well Observations. Water Resour. Res. 2014, 50, 2679–2692. [Google Scholar] [CrossRef]
- Ali, S.; Liu, D.; Fu, Q.; Cheema, M.J.M.; Pham, Q.B.; Rahaman, M.; Dang, T.D.; Anh, D.T. Improving the Resolution of GRACE Data for Spatio-Temporal Groundwater Storage Assessment. Remote Sens. 2021, 13, 3513. [Google Scholar] [CrossRef]
- Zhang, J.; Liu, K.; Wang, M. Seasonal and Interannual Variations in China’s Groundwater Based on GRACE Data and Multisource Hydrological Models. Remote Sens. 2020, 12, 845. [Google Scholar] [CrossRef]
- Tiwari, V.M.; Wahr, J.; Swenson, S. Dwindling Groundwater Resources in Northern India, from Satellite Gravity Observations. Geophys. Res. Lett. 2009, 36. [Google Scholar] [CrossRef]
- Wu, Q.; Si, B.; He, H.; Wu, P. Determining Regional-Scale Groundwater Recharge with GRACE and GLDAS. Remote Sens. 2019, 11, 154. [Google Scholar] [CrossRef]
- Lubczynski, M.W.; Gurwin, J. Integration of Various Data Sources for Transient Groundwater Modeling with Spatio-Temporally Variable Fluxes—Sardon Study Case, Spain. J. Hydrol. 2005, 306, 71–96. [Google Scholar] [CrossRef]
- Healy, R.W.; Cook, P.G. Using Groundwater Levels to Estimate Recharge. Hydrogeol. J. 2002, 10, 91–109. [Google Scholar] [CrossRef]
- Nimmo, J.R.; Horowitz, C.; Mitchell, L. Discrete-Storm Water-Table Fluctuation Method to Estimate Episodic Recharge. Groundwater 2015, 53, 282–292. [Google Scholar] [CrossRef] [PubMed]
- Chaperon, P. Note Hydrologique sur le Goulbi de Maradi et le lac de Madarounfa (Niger); ORSTOM: Paris, France, 1971; 26p. [Google Scholar]
- Vannucci, R.; Calvino, F.; Cortesogno, L.; Tolomeo, L. Jurassic Volcanism Findings in Sokoto State (NW-Nigeria). J. Afr. Earth Sci. 1989, 9, 245–258. [Google Scholar] [CrossRef]
- Lutz, A.; Thomas, J.M.; Pohll, G.; Keita, M.; McKay, W.A. Sustainability of Groundwater in Mali, West Africa. Env. Geol 2009, 58, 1441. [Google Scholar] [CrossRef]
- USGS. User’s Documentation for MODFLOW-96, an Update to the U.S. Geological Survey Modular Finite-Difference Ground-Water Flow Model—Open-File Report 96-485; United States Geologic Survey: Reston, VA, USA, 1996; 63p. [Google Scholar]
- GMS:MODFLOW-XMS Wiki. Available online: https://www.xmswiki.com/wiki/GMS:MODFLOW (accessed on 30 April 2021).
- GMS:PEST-XMS Wiki. Available online: https://www.xmswiki.com/wiki/GMS:PEST (accessed on 19 July 2023).
- Earth Resources Observation and Science (EROS) Center. Global 30 Arc-Second Elevation (GTOPO30); EROS: Sioux Falls, SD, USA, 2017. [Google Scholar]
- Hydraulic Conductivity. Wikipedia. 2022. Available online: https://en.wikipedia.org/wiki/Hydraulic_conductivity (accessed on 29 October 2023).
- Karimi, L.; Motagh, M.; Entezam, I. Modeling Groundwater Level Fluctuations in Tehran Aquifer: Results from a 3D Unconfined Aquifer Model. Groundw. Sustain. Dev. 2019, 8, 439–449. [Google Scholar] [CrossRef]
- GMS 10.6 Tutorials. Available online: https://www.aquaveo.com/software/gms-learning-tutorials (accessed on 27 April 2022).


Disclaimer/Publisher’s Note: The statements, opinions and data contained in all publications are solely those of the individual author(s) and contributor(s) and not of MDPI and/or the editor(s). MDPI and/or the editor(s) disclaim responsibility for any injury to people or property resulting from any ideas, methods, instructions or products referred to in the content. |
© 2023 by the authors. Licensee MDPI, Basel, Switzerland. This article is an open access article distributed under the terms and conditions of the Creative Commons Attribution (CC BY) license (https://creativecommons.org/licenses/by/4.0/).
Share and Cite
Barbosa, S.A.; Jones, N.L.; Williams, G.P.; Mamane, B.; Begou, J.; Nelson, E.J.; Ames, D.P. Exploiting Earth Observations to Enable Groundwater Modeling in the Data-Sparse Region of Goulbi Maradi, Niger. Remote Sens. 2023, 15, 5199. https://doi.org/10.3390/rs15215199
Barbosa SA, Jones NL, Williams GP, Mamane B, Begou J, Nelson EJ, Ames DP. Exploiting Earth Observations to Enable Groundwater Modeling in the Data-Sparse Region of Goulbi Maradi, Niger. Remote Sensing. 2023; 15(21):5199. https://doi.org/10.3390/rs15215199
Chicago/Turabian StyleBarbosa, Sergio A., Norman L. Jones, Gustavious P. Williams, Bako Mamane, Jamila Begou, E. James Nelson, and Daniel P. Ames. 2023. "Exploiting Earth Observations to Enable Groundwater Modeling in the Data-Sparse Region of Goulbi Maradi, Niger" Remote Sensing 15, no. 21: 5199. https://doi.org/10.3390/rs15215199