
Masked Image Modeling Auxiliary Pseudo-Label Propagation with a Clustering Central Rectification Strategy for Cross-Scene Classification


Abstract
1. Introduction
- (1)
- A novel DA framework called is proposed for cross-scene classification in the RS domain, which can not only achieve a powerful DA representation ability from source to target domain even if under severe domain discrepancy, but also can provide a high-quality pseudo-label propagation for learning a superior target domain specific classifier to achieve the SOTA cross-scene classification performance.
- (2)
- A new DA representation way is proposed based on a supervised class-token contrastive learning incorporated with self-supervised MIM mechanism, which not only can utilize a low random masking ratio as a specific data augmentation for unlabeled data to encourage the search for more consistent contextual clues between source and target domain, but also adopt random masking pixel reconstruction to reveal the capture of the domain-specific information for further improving the discriminability in-domain. Thus, the DA representation with transferability while maintaining discriminability is set up, which is a solid foundation for high-quality pseudo-label generation.
- (3)
- A novel clustering central rectification strategy is proposed to assist in setting up a specific classifier in target domain based on a powerful DA representation, which can effectively rectify unreliable pseudo-label based on adaptively updating the reliable clustering central representations by referring to the classifier learned from source domain. Thus, by fully excavating valuable information from unlabeled data, a superior target domain specific classifier can be constructed for cross-scene classification.
2. Related Work
2.1. Domain Adaptation
2.2. Pseudo-Labeling
2.3. Masked Image Modeling
3. Methodology
3.1. Overview
3.2. Domain Adaption Representation Learning
3.3. Clustering Central Rectification Strategy
| Algorithm 1 Algorithm of Clustering Central Rectification Strategy |
| Input: Class tokens of the target domain; source domain classifier ; metric ; category number K |
| Output: Final pseudo-labels of the target domain |
| Acquire initial predictions ; Calculate by Equation (6); |
| for to K do |
| Calculate the average of which has initial predictions to obtain ; |
| Pick which into reliable set ; |
| Compute the reliable class center by Equation (7); |
| end for |
| Put the rest in unreliable set ; |
| Obtain final pseudo-labels by Equation (8). |
3.4. Total Loss
- (1)
- : is the cross-entropy loss of classifier supervised by source labels :where is the cross-entropy loss function.
- (2)
- : is the cross-entropy loss of classifier supervised by target pseudo-labels :
- (3)
- : The contrastive learning-based alignment loss can be expressed as follows:where represents the sets of class tokens corresponding to the encoded features of all source samples and is the set of class tokens of positive samples in source domain for a target sample , i.e., .
- (4)
- : The reconstruction loss in the target domain is calculated as the mean square error (MSE) between the reconstructed image and the normalized original pixels, and this calculation is only performed on the masked patches:where M denotes the set of masked pixels and is the corresponding normalized pixel values of .
4. Experiments and Results
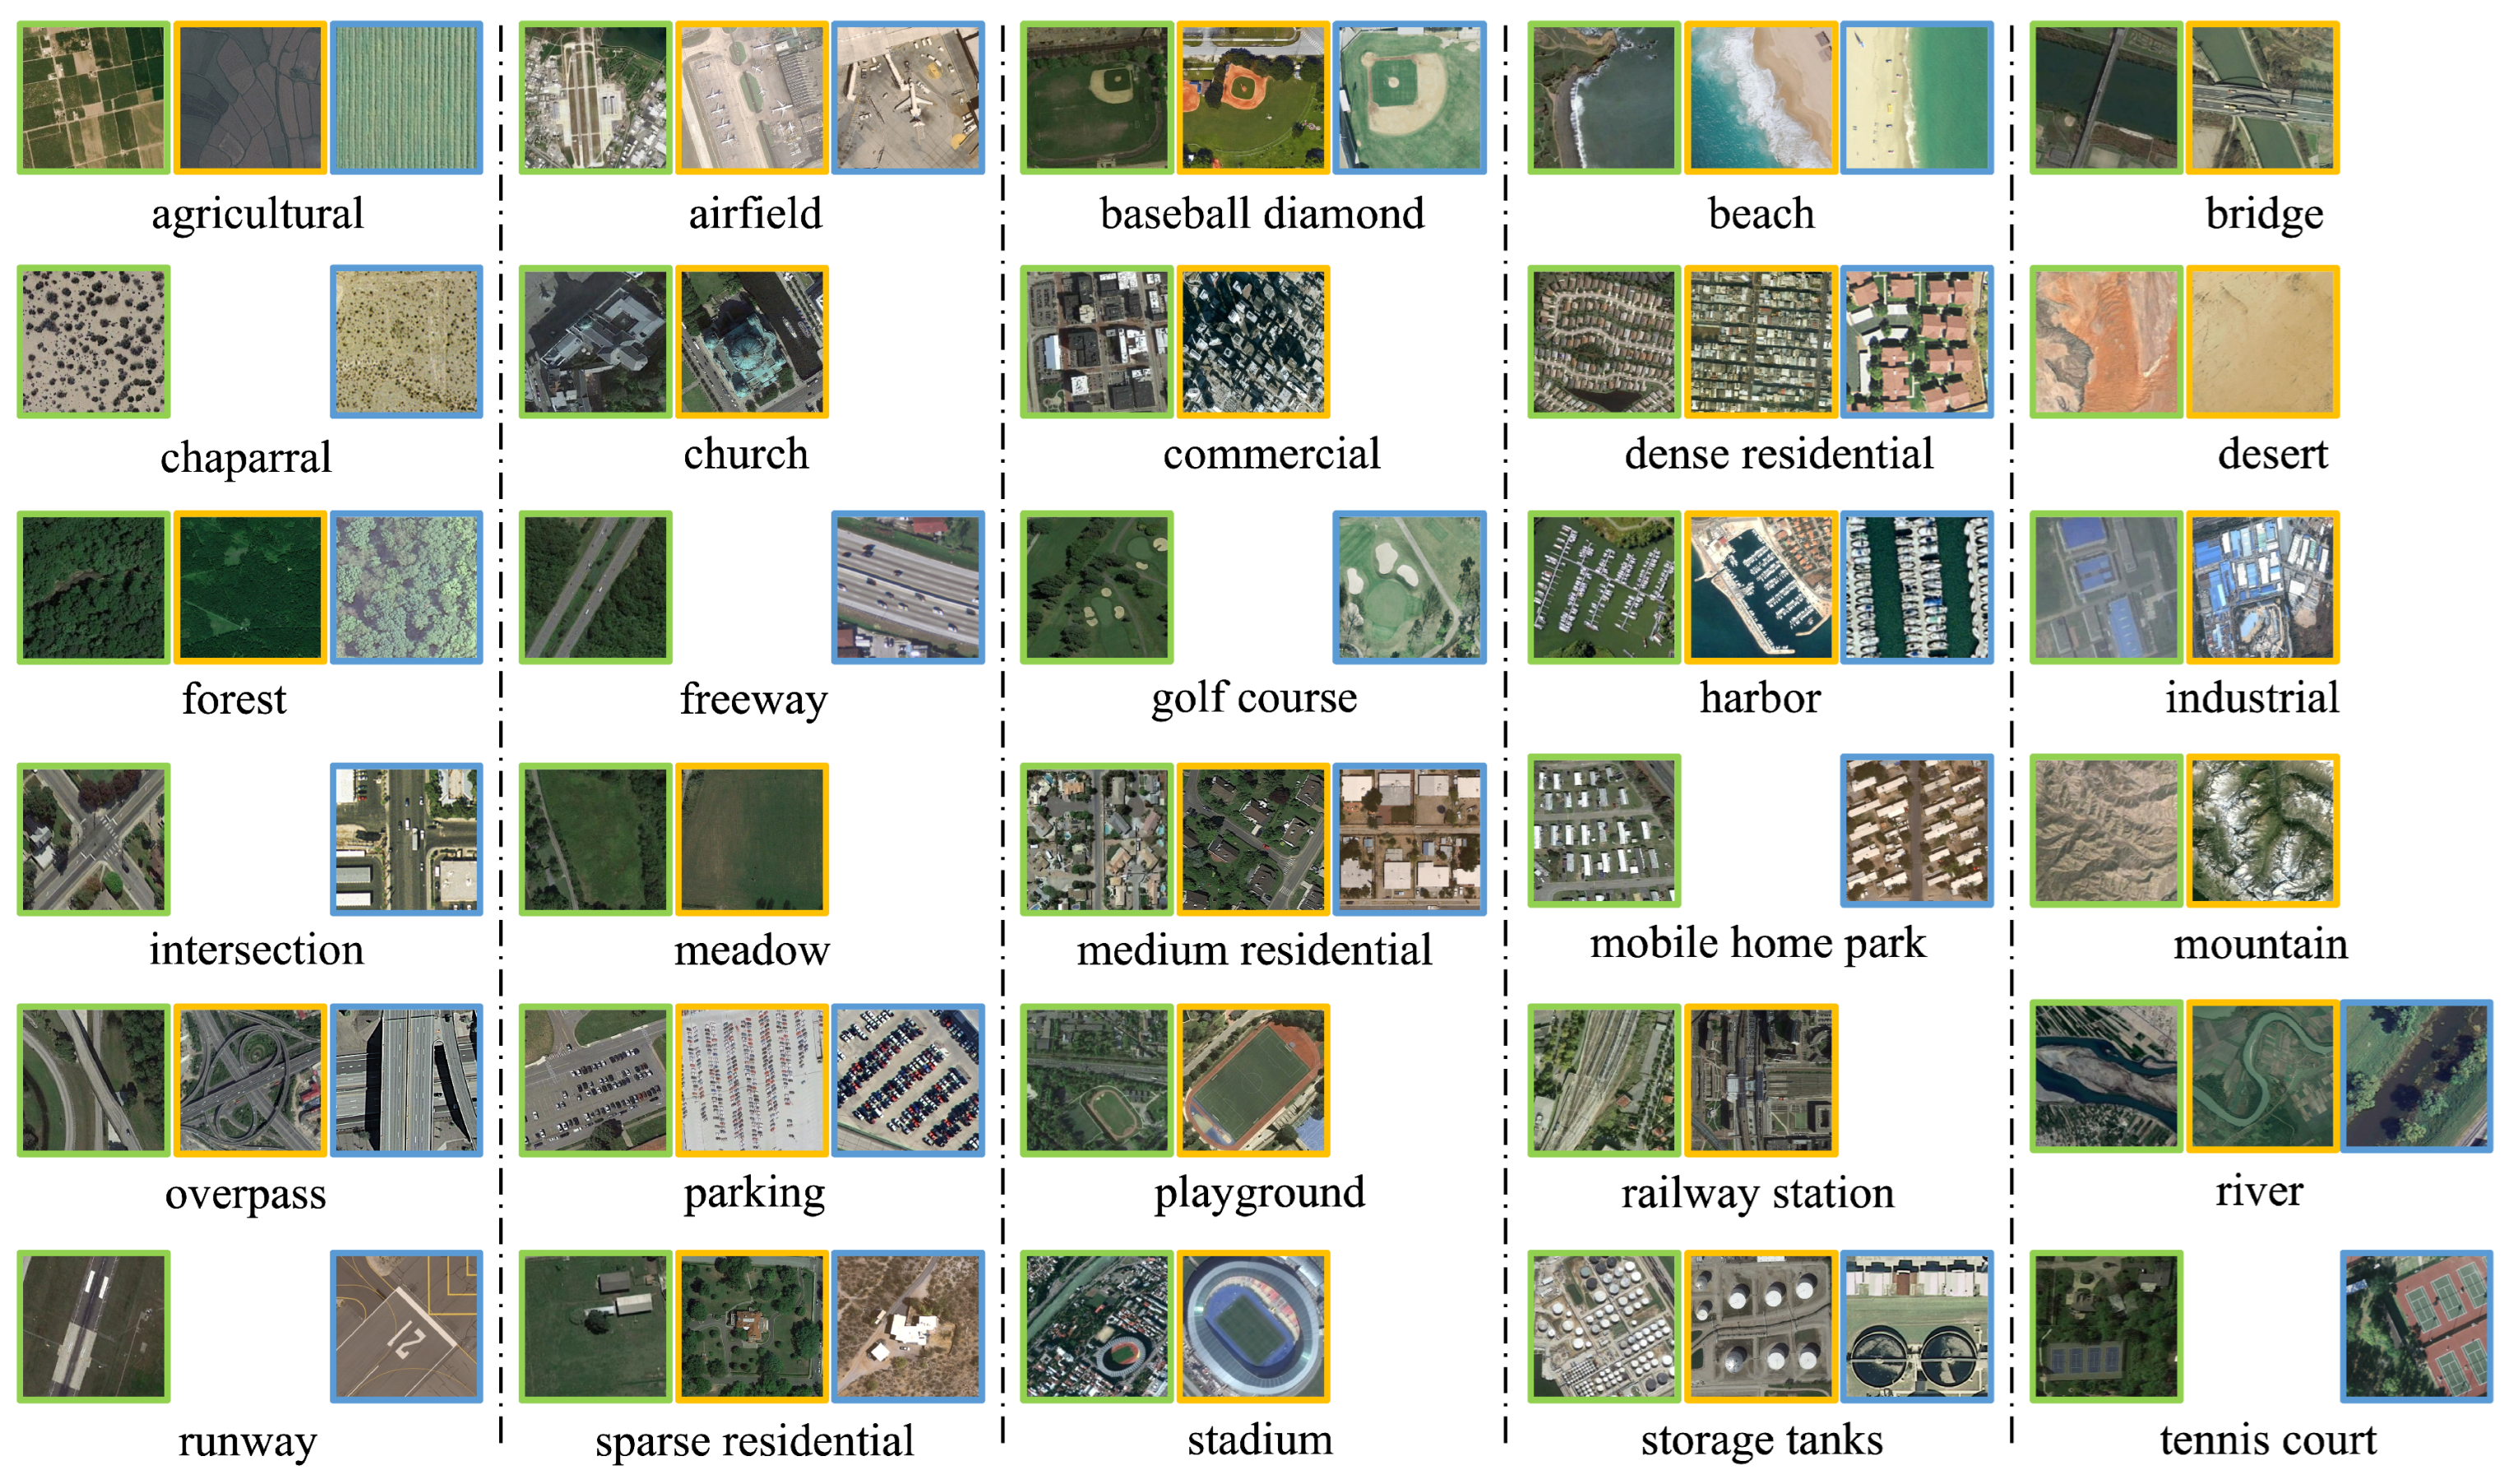
4.1. Datasets
- The NWPU-RESISC45 dataset stands as a large-scale open-source benchmark in the realm of RS scene classification, meticulously crafted by Northwestern Polytechnical University. Sourced from the Google Earth service, this dataset encompasses 31,500 images that span 45 distinct classes of RS scenes. Spatial resolutions across the dataset range from 0.2 m to 30 m. Notably, each class is represented by 700 images, each measuring 256 × 256 pixels in size.
- The AID dataset is derived from the Google Earth service, comprising 10,000 aerial images spanning 30 scene classes. The quantity of sample images varies, ranging from 220 to 420 across different aerial scene categories. Each aerial image is sized at 600 × 600 pixels, with a spatial resolution ranging from 0.5 m to 8 m.
- The UC Merced Land-Use dataset is composed of 21 diverse land use image types extracted from aerial orthoimagery, boasting a spatial resolution of 0.3 m. Originating from the United States Geological Survey (USGS) National Map, the original images spanning 20 distinct regions across the United States. Following the download, these images were cropped into 256 × 256 pixels. Each class is represented by a set of 100 images, culminating in a dataset totaling 2100 images.
4.2. Experimental Implementation Details
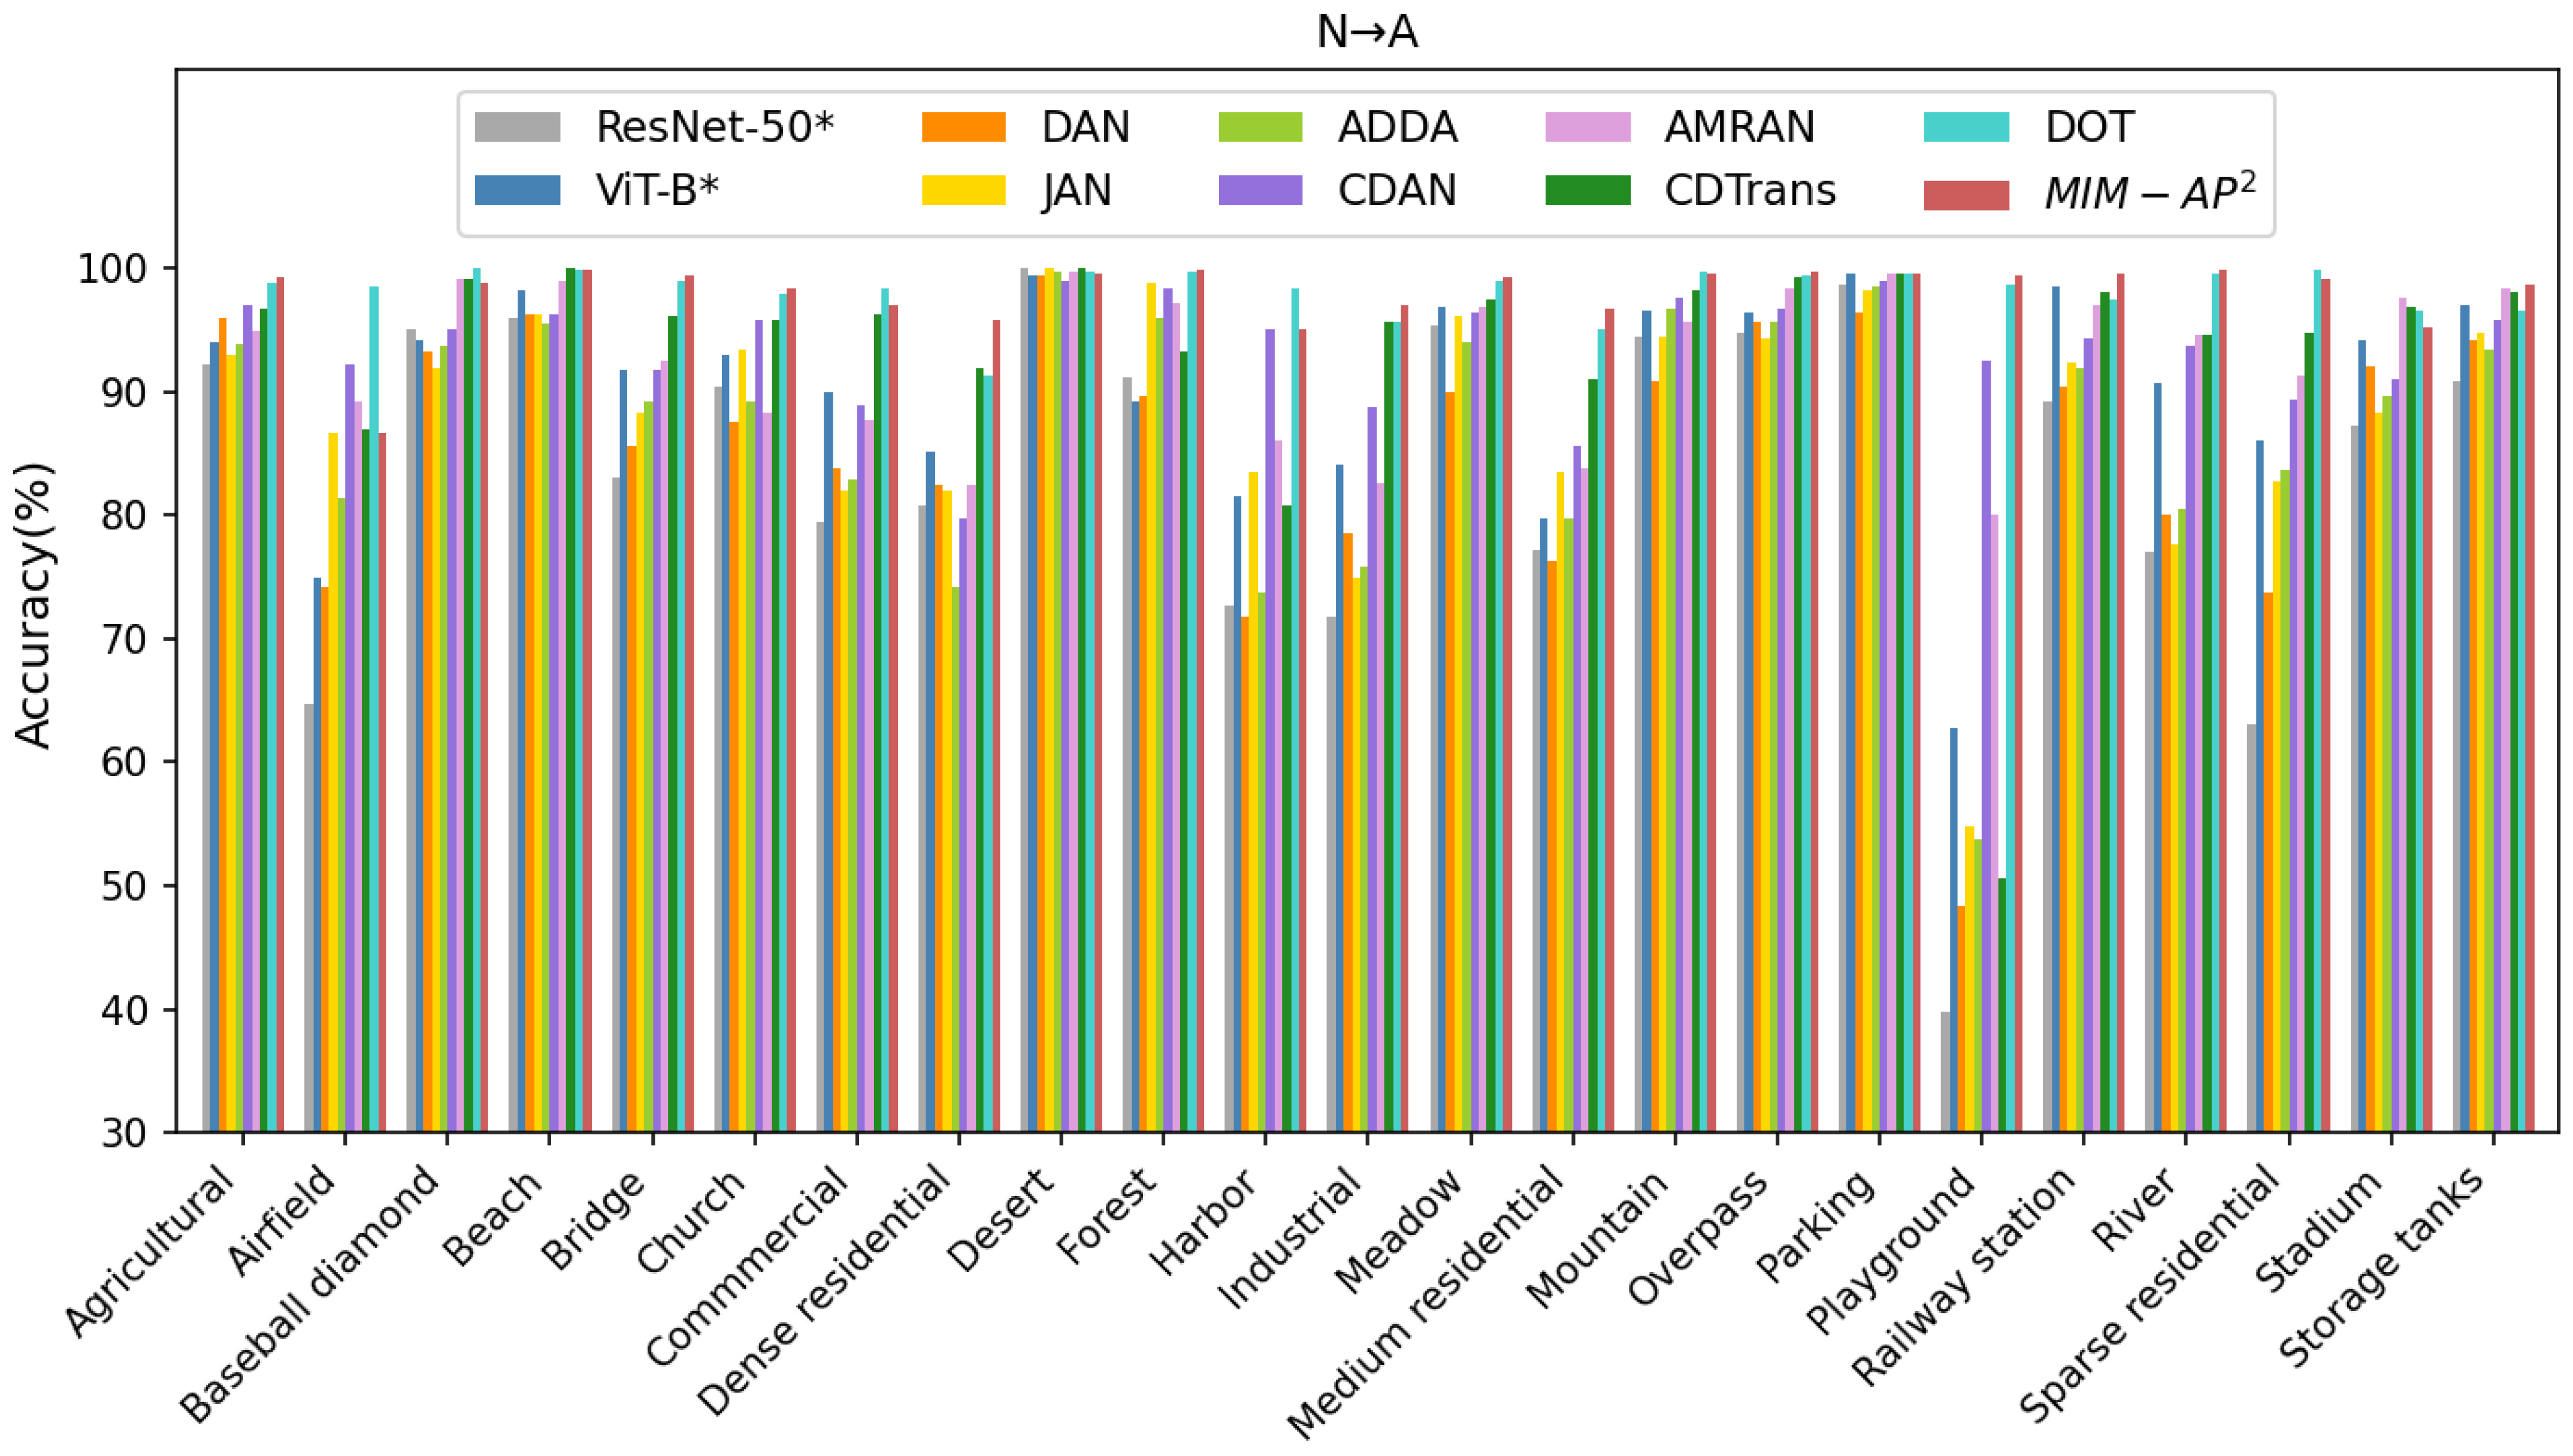
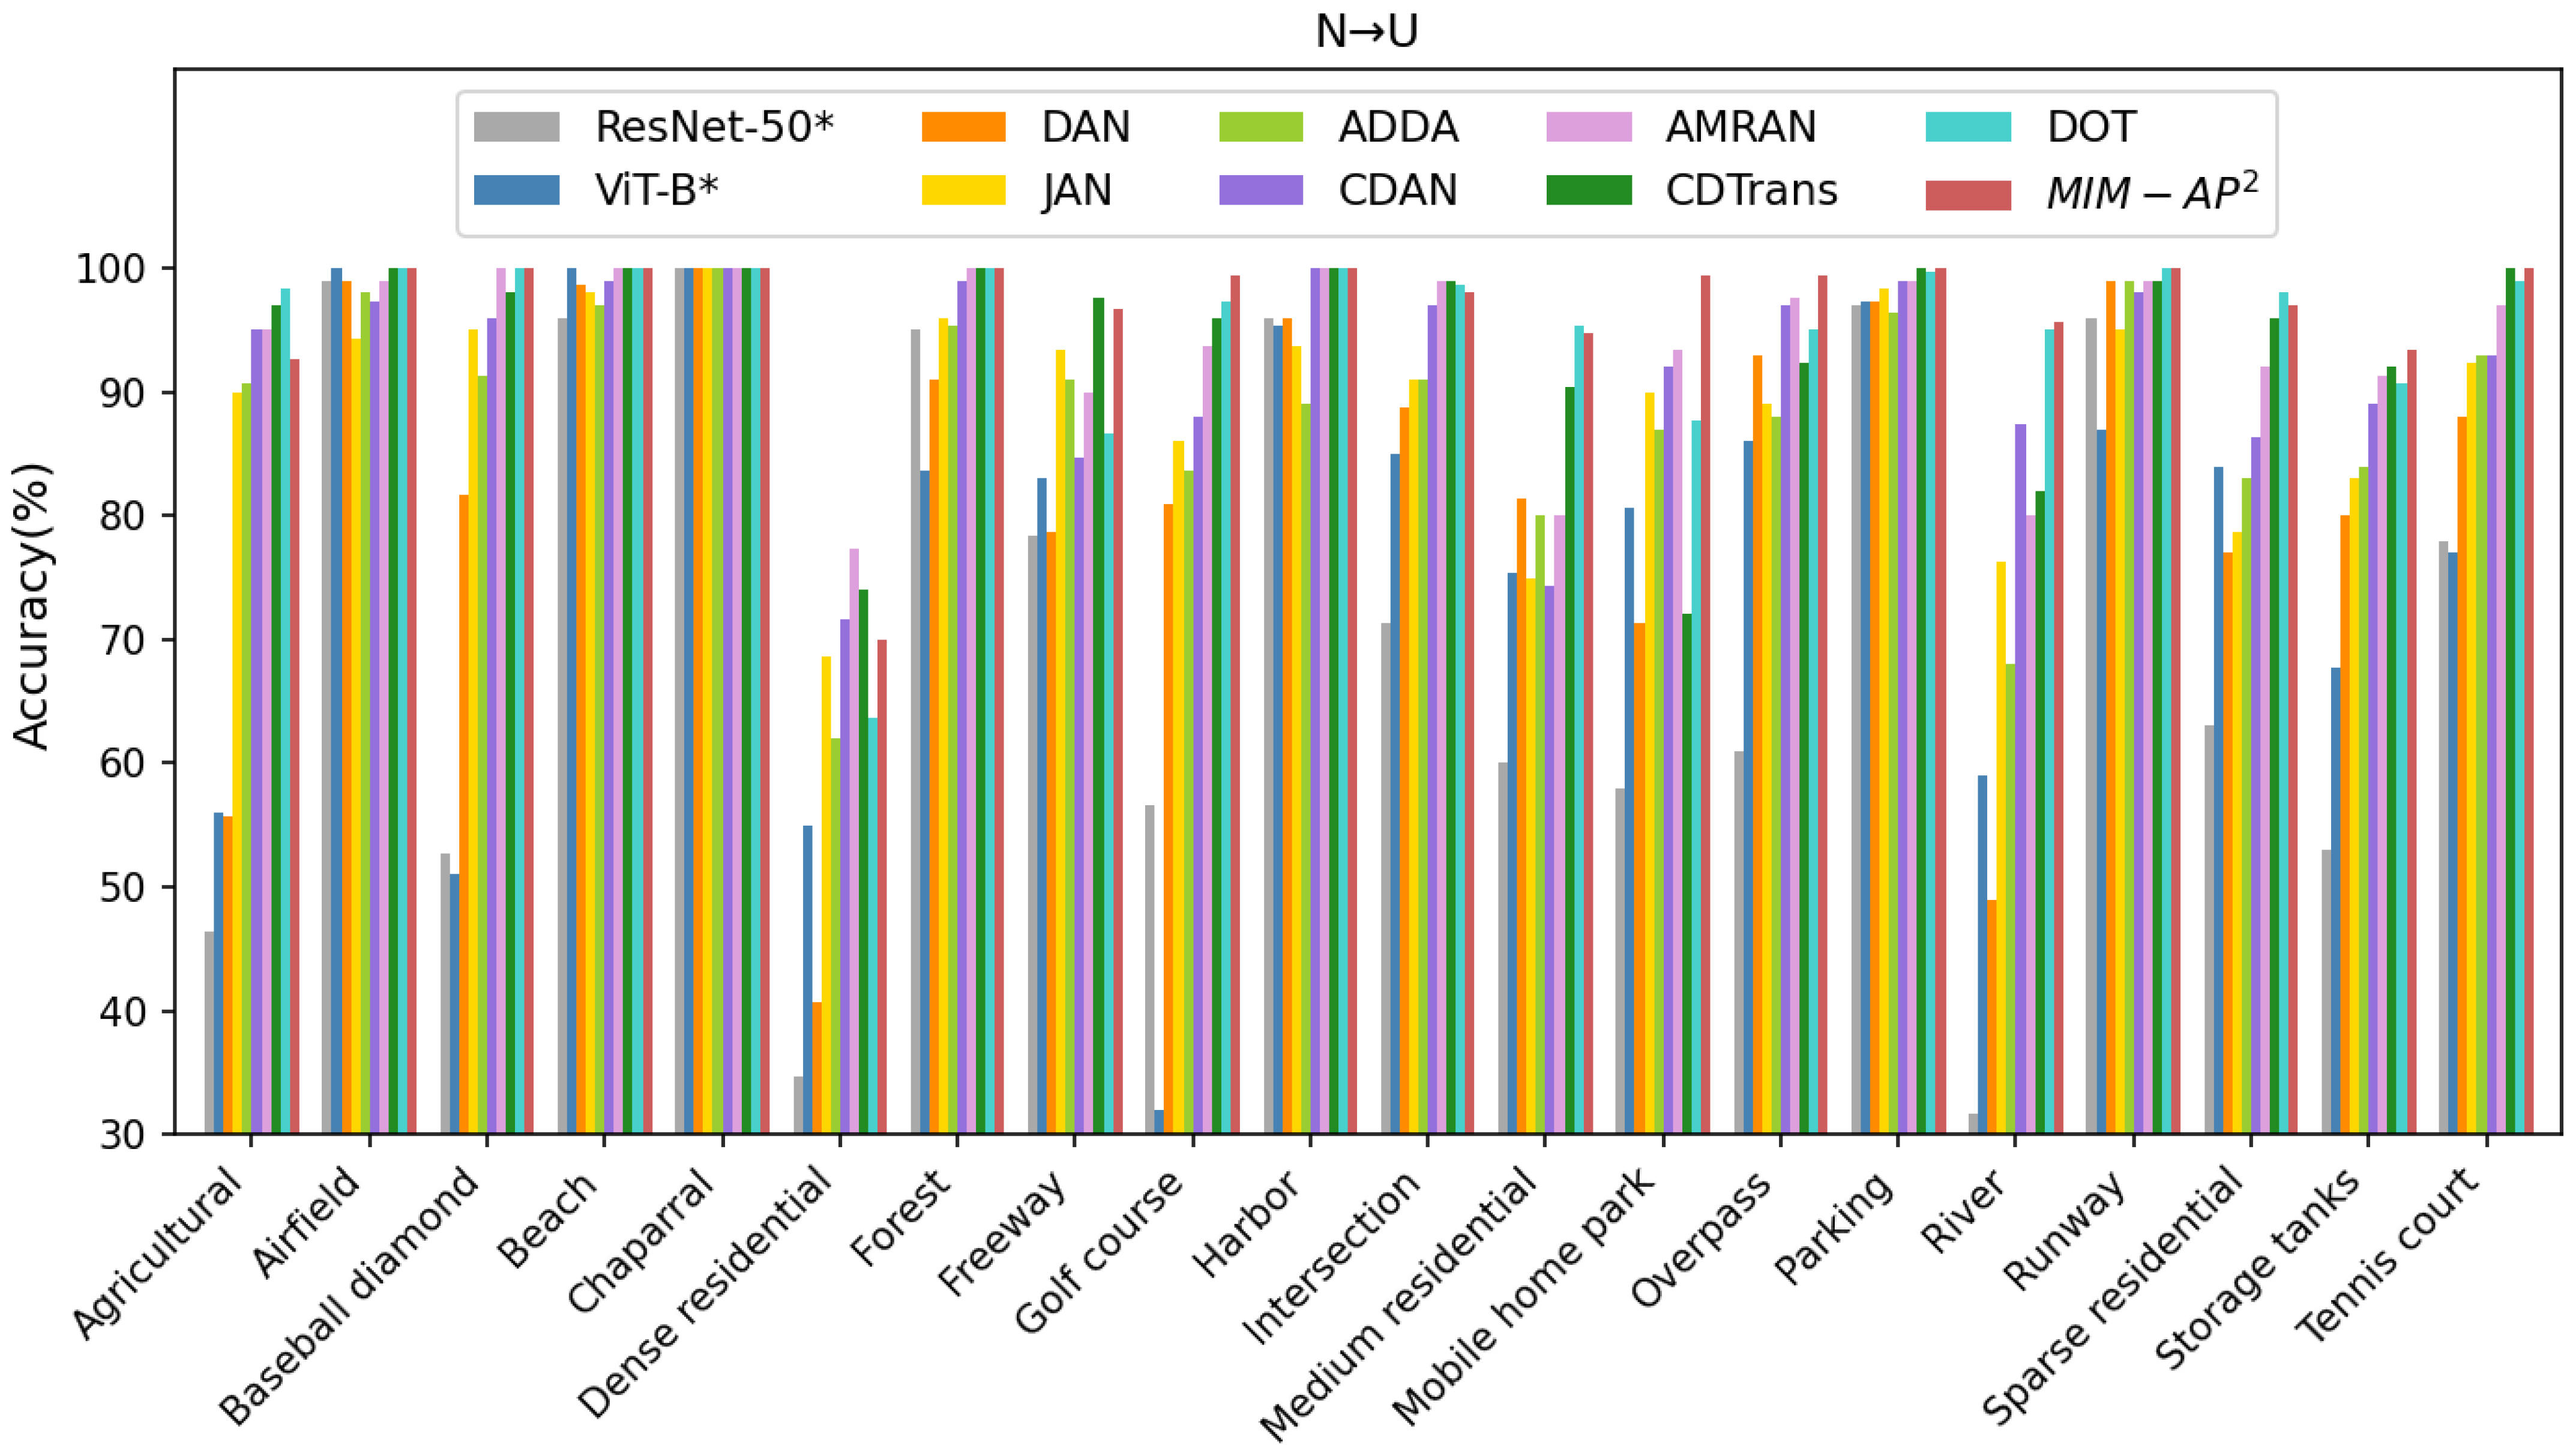
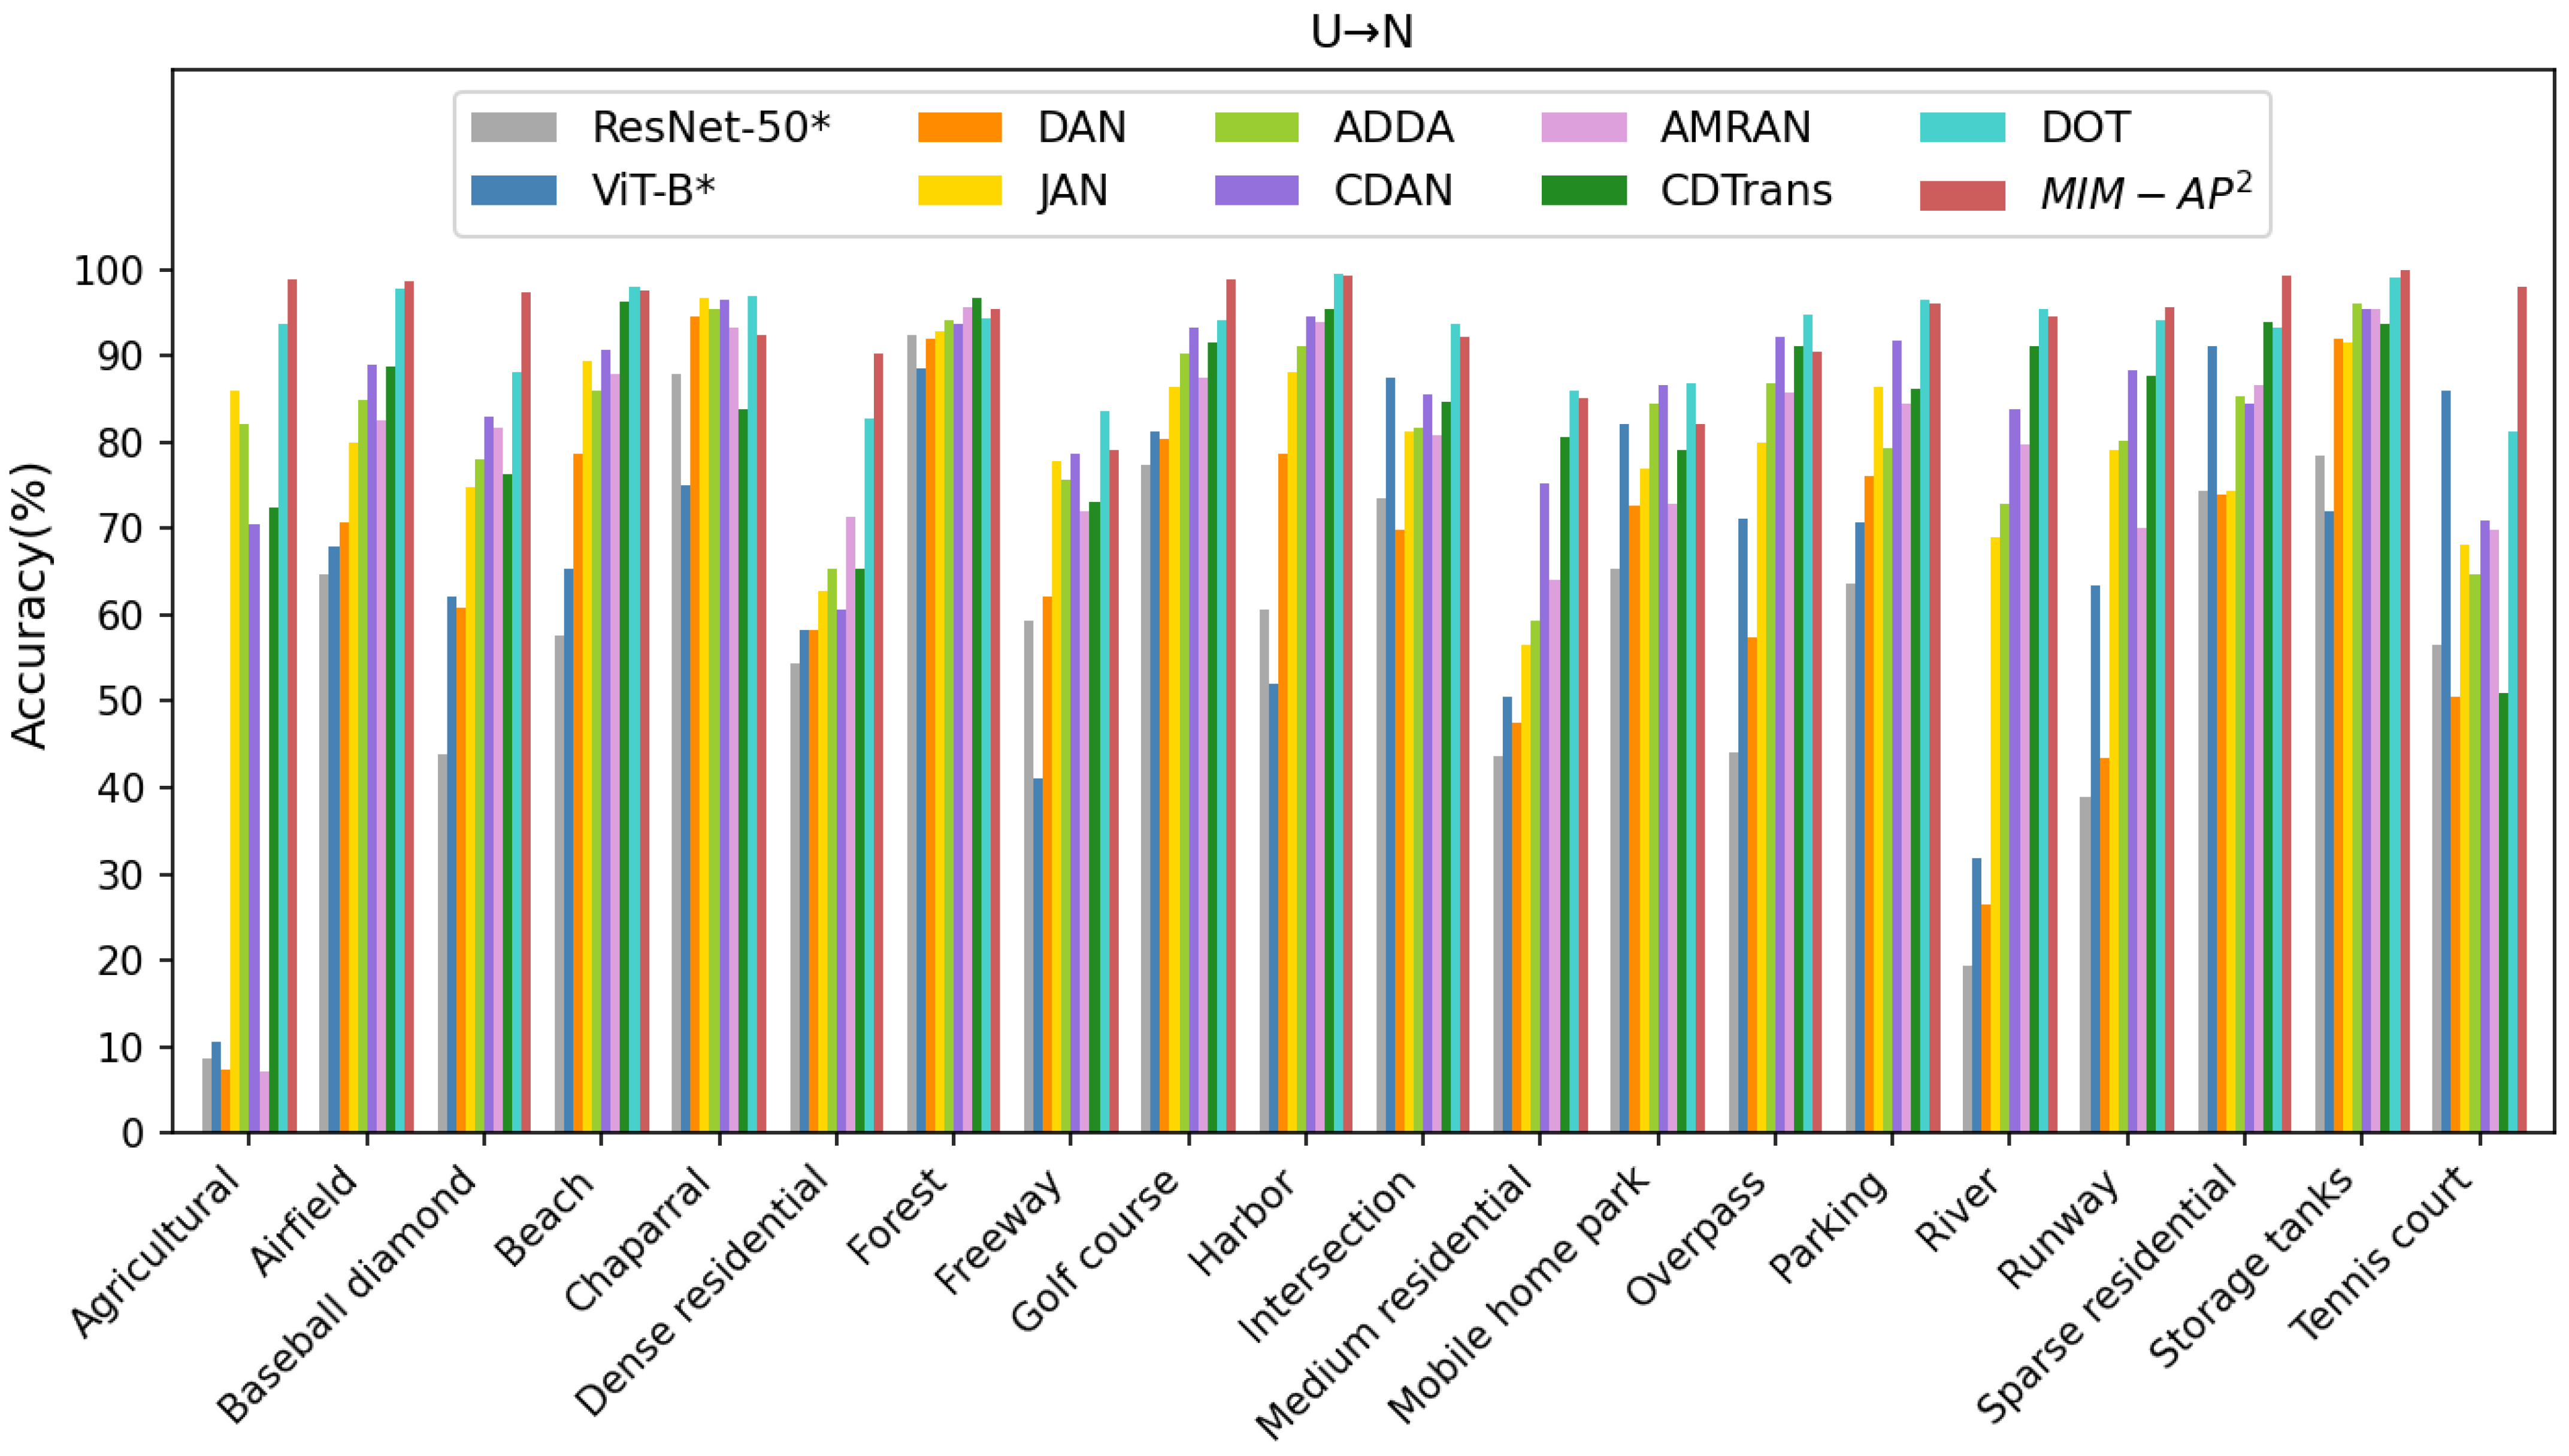
4.3. Comparison Analysis
4.4. Ablation Study
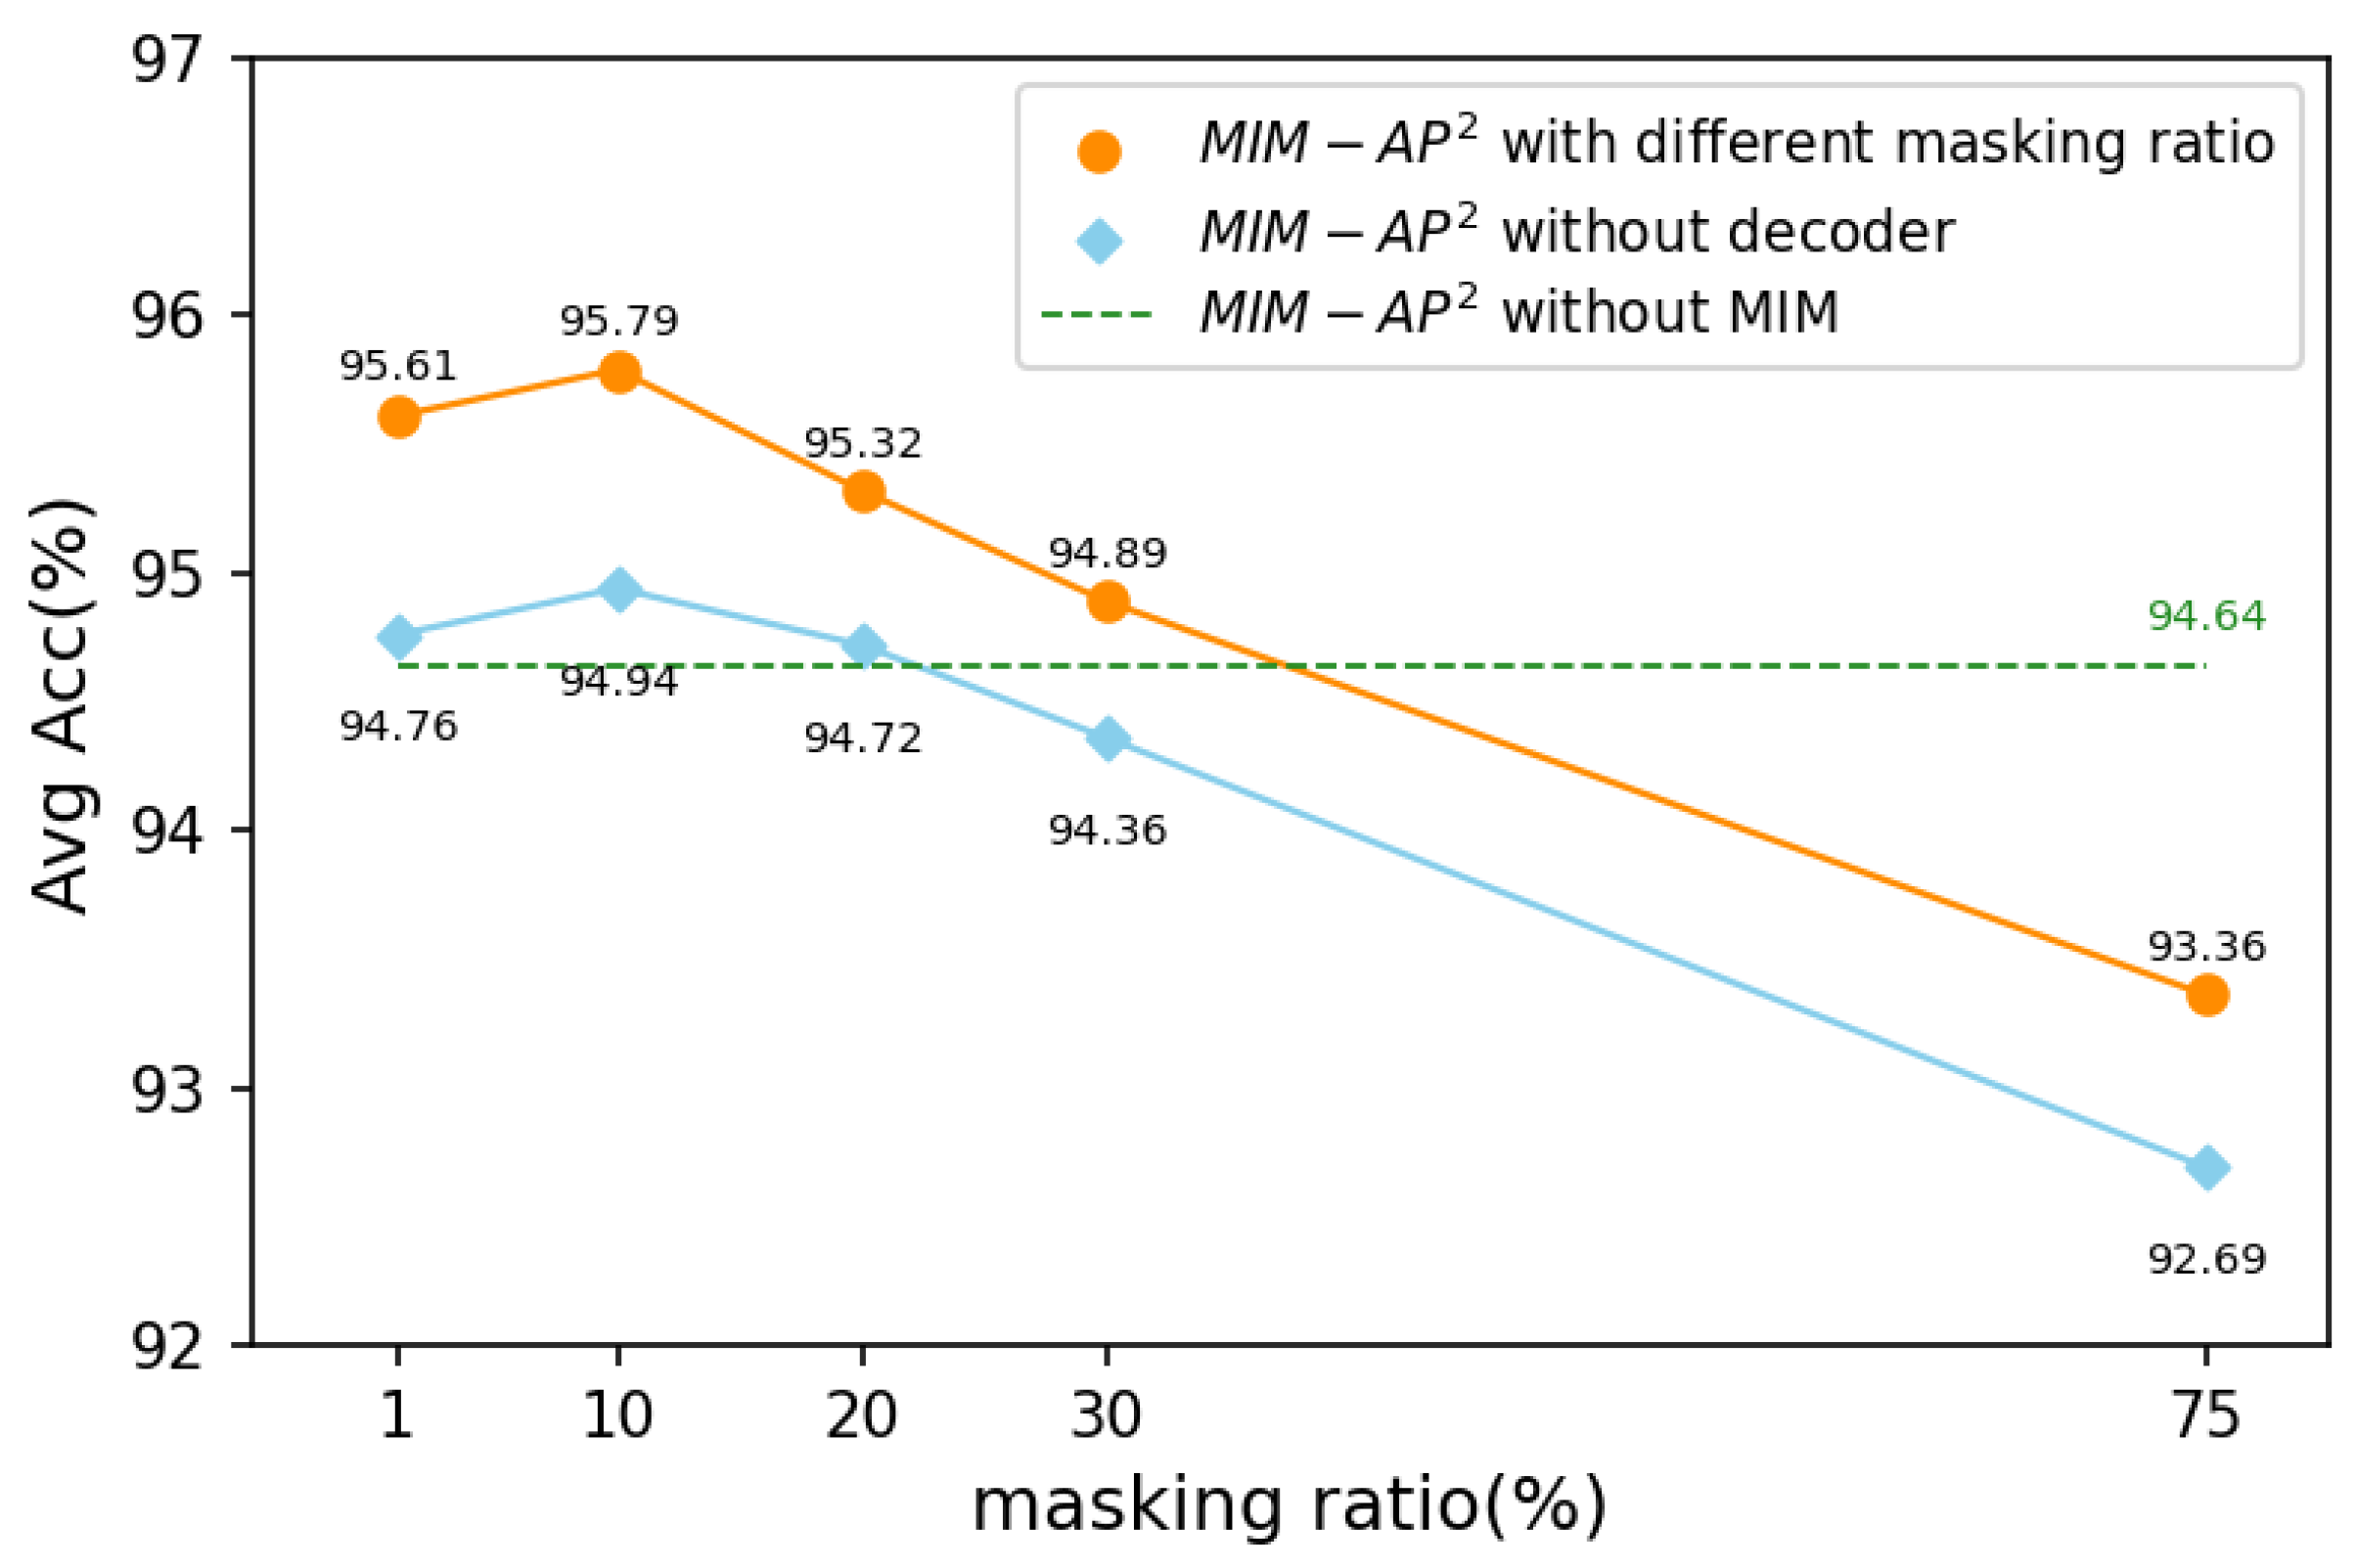
4.5. Parameter Discussion
5. Discussion
6. Conclusions
Author Contributions
Funding
Data Availability Statement
Conflicts of Interest
References
- Al-Kindi, K.M.; Alqurashi, A.F.; Al-Ghafri, A.; Power, D. Assessing the Impact of Land Use and Land Cover Changes on Aflaj Systems over a 36-Year Period. Remote Sens. 2023, 15, 1787. [Google Scholar] [CrossRef]
- Fernandez, L.; Ruiz-de Azua, J.A.; Calveras, A.; Camps, A. On-Demand Satellite Payload Execution Strategy for Natural Disasters Monitoring Using LoRa: Observation Requirements and Optimum Medium Access Layer Mechanisms. Remote Sens. 2021, 13, 4014. [Google Scholar] [CrossRef]
- Bai, H.; Li, Z.; Guo, H.; Chen, H.; Luo, P. Urban Green Space Planning Based on Remote Sensing and Geographic Information Systems. Remote Sens. 2022, 14, 4213. [Google Scholar] [CrossRef]
- Liu, Q.; He, M.; Kuang, Y.; Wu, L.; Yue, J.; Fang, L. A Multi-Level Label-Aware Semi-Supervised Framework for Remote Sensing Scene Classification. IEEE Trans. Geosci. Remote Sens. 2023, 61, 5616112. [Google Scholar] [CrossRef]
- Tian, Y.; Dong, Y.; Yin, G. Early Labeled and Small Loss Selection Semi-Supervised Learning Method for Remote Sensing Image Scene Classification. Remote Sens. 2021, 13, 4039. [Google Scholar] [CrossRef]
- Miao, W.; Geng, J.; Jiang, W. Semi-Supervised Remote-Sensing Image Scene Classification Using Representation Consistency Siamese Network. IEEE Trans. Geosci. Remote Sens. 2022, 60, 5616614. [Google Scholar] [CrossRef]
- Li, J.; Liao, Y.; Zhang, J.; Zeng, D.; Qian, X. Semi-Supervised DEGAN for Optical High-Resolution Remote Sensing Image Scene Classification. Remote Sens. 2022, 14, 4418. [Google Scholar] [CrossRef]
- Zhu, S.; Du, B.; Zhang, L.; Li, X. Attention-Based Multiscale Residual Adaptation Network for Cross-Scene Classification. IEEE Trans. Geosci. Remote Sens. 2022, 60, 5400715. [Google Scholar] [CrossRef]
- Yang, C.; Dong, Y.; Du, B.; Zhang, L. Attention-Based Dynamic Alignment and Dynamic Distribution Adaptation for Remote Sensing Cross-Domain Scene Classification. IEEE Trans. Geosci. Remote Sens. 2022, 60, 5634713. [Google Scholar] [CrossRef]
- Niu, B.; Pan, Z.; Wu, J.; Hu, Y.; Lei, B. Multi-Representation Dynamic Adaptation Network for Remote Sensing Scene Classification. IEEE Trans. Geosci. Remote Sens. 2022, 60, 5633119. [Google Scholar] [CrossRef]
- Zhang, X.; Yao, X.; Feng, X.; Cheng, G.; Han, J. DFENet for Domain Adaptation-Based Remote Sensing Scene Classification. IEEE Trans. Geosci. Remote Sens. 2022, 60, 5611611. [Google Scholar] [CrossRef]
- Huang, W.; Shi, Y.; Xiong, Z.; Wang, Q.; Zhu, X.X. Semi-supervised bidirectional alignment for Remote Sensing cross-domain scene classification. ISPRS J. Photogramm. Remote Sens. 2023, 195, 192–203. [Google Scholar] [CrossRef]
- Liang, C.; Cheng, B.; Xiao, B.; Dong, Y. Unsupervised Domain Adaptation for Remote Sensing Image Segmentation Based on Adversarial Learning and Self-Training. IEEE Geosci. Remote Sens. Lett. 2023, 20, 6006005. [Google Scholar] [CrossRef]
- Zhu, J.; Guo, Y.; Sun, G.; Yang, L.; Deng, M.; Chen, J. Unsupervised Domain Adaptation Semantic Segmentation of High-Resolution Remote Sensing Imagery With Invariant Domain-Level Prototype Memory. IEEE Trans. Geosci. Remote Sens. 2023, 61, 5603518. [Google Scholar] [CrossRef]
- Sun, Y.; Wang, Y.; Liu, H.; Hu, L.; Zhang, C.; Wang, S. Gradual Domain Adaptation with Pseudo-Label Denoising for SAR Target Recognition When Using Only Synthetic Data for Training. Remote Sens. 2023, 15, 708. [Google Scholar] [CrossRef]
- Long, M.; Cao, Y.; Wang, J.; Jordan, M. Learning Transferable Features with Deep Adaptation Networks. In Proceedings of the 32nd International Conference on Machine Learning, Lille, France, 7–9 July 2015; Bach, F., Blei, D., Eds.; Volume 37, pp. 97–105. [Google Scholar]
- Gretton, A.; Borgwardt, K.M.; Rasch, M.J.; Schölkopf, B.; Smola, A. A Kernel Two-Sample Test. J. Mach. Learn. Res. 2012, 13, 723–773. [Google Scholar]
- Long, M.; Zhu, H.; Wang, J.; Jordan, M.I. Deep Transfer Learning with Joint Adaptation Networks. In Proceedings of the 34th International Conference on Machine Learning, Sydney, Australia, 6–11 August 2017; Precup, D., Teh, Y.W., Eds.; PMLR: Birmingham, UK; Volume 70, pp. 2208–2217. [Google Scholar]
- Li, J.; Chen, E.; Ding, Z.; Zhu, L.; Lu, K.; Shen, H.T. Maximum Density Divergence for Domain Adaptation. IEEE Trans. Pattern Anal. Mach. Intell. 2021, 43, 3918–3930. [Google Scholar] [CrossRef]
- Ganin, Y.; Ustinova, E.; Ajakan, H.; Germain, P.; Larochelle, H.; Laviolette, F.; March, M.; Lempitsky, V. Domain-Adversarial Training of Neural Networks. J. Mach. Learn. Res. 2016, 17, 1–35. [Google Scholar]
- Tzeng, E.; Hoffman, J.; Saenko, K.; Darrell, T. Adversarial Discriminative Domain Adaptation. In Proceedings of the 2017 IEEE Conference on Computer Vision and Pattern Recognition (CVPR), Honolulu, HI, USA, 21–26 July 2017; pp. 2962–2971. [Google Scholar] [CrossRef]
- Goodfellow, I.; Pouget-Abadie, J.; Mirza, M.; Xu, B.; Warde-Farley, D.; Ozair, S.; Courville, A.; Bengio, Y. Generative Adversarial Nets. In Proceedings of the Advances in Neural Information Processing Systems, Montreal, QC, Canada, 8–13 December 2014; Ghahramani, Z., Welling, M., Cortes, C., Lawrence, N., Weinberger, K., Eds.; MIT Press: Cambridge, MA, USA, 2014; Volume 27. [Google Scholar]
- Long, M.; Cao, Z.; Wang, J.; Jordan, M.I. Conditional Adversarial Domain Adaptation. In Proceedings of the Advances in Neural Information Processing Systems, Montreal, QC, Canada, 3–8 December 2018; Bengio, S., Wallach, H., Larochelle, H., Grauman, K., Cesa-Bianchi, N., Garnett, R., Eds.; MIT Press: Cambridge, MA, USA, 2018; Volume 31. [Google Scholar]
- Saito, K.; Watanabe, K.; Ushiku, Y.; Harada, T. Maximum Classifier Discrepancy for Unsupervised Domain Adaptation. In Proceedings of the IEEE Conference on Computer Vision and Pattern Recognition (CVPR), Salt Lake City, UT, USA, 18–23 June 2018. [Google Scholar]
- Ammour, N.; Bashmal, L.; Bazi, Y.; Al Rahhal, M.M.; Zuair, M. Asymmetric Adaptation of Deep Features for Cross-Domain Classification in Remote Sensing Imagery. IEEE Geosci. Remote Sens. Lett. 2018, 15, 597–601. [Google Scholar] [CrossRef]
- Song, S.; Yu, H.; Miao, Z.; Zhang, Q.; Lin, Y.; Wang, S. Domain Adaptation for Convolutional Neural Networks-Based Remote Sensing Scene Classification. IEEE Geosci. Remote Sens. Lett. 2019, 16, 1324–1328. [Google Scholar] [CrossRef]
- Zhu, S.; Luo, F.; Du, B.; Zhang, L. Adversarial Fine-Grained Adaptation Network for Cross-Scene Classification. In Proceedings of the 2021 IEEE International Geoscience and Remote Sensing Symposium IGARSS, Brussels, Belgium, 11–16 July 2021; pp. 2369–2372. [Google Scholar] [CrossRef]
- Teng, W.; Wang, N.; Shi, H.; Liu, Y.; Wang, J. Classifier-Constrained Deep Adversarial Domain Adaptation for Cross-Domain Semisupervised Classification in Remote Sensing Images. IEEE Geosci. Remote Sens. Lett. 2020, 17, 789–793. [Google Scholar] [CrossRef]
- Ma, C.; Sha, D.; Mu, X. Unsupervised Adversarial Domain Adaptation with Error-Correcting Boundaries and Feature Adaption Metric for Remote-Sensing Scene Classification. Remote Sens. 2021, 13, 1270. [Google Scholar] [CrossRef]
- Zheng, Z.; Zhong, Y.; Su, Y.; Ma, A. Domain Adaptation via a Task-Specific Classifier Framework for Remote Sensing Cross-Scene Classification. IEEE Trans. Geosci. Remote Sens. 2022, 60, 5620513. [Google Scholar] [CrossRef]
- Yang, J.; Liu, J.; Xu, N.; Huang, J. TVT: Transferable Vision Transformer for Unsupervised Domain Adaptation. arXiv 2021, arXiv:2108.05988. [Google Scholar]
- Xu, T.; Chen, W.; WANG, P.; Wang, F.; Li, H.; Jin, R. CDTrans: Cross-domain Transformer for Unsupervised Domain Adaptation. In Proceedings of the International Conference on Learning Representations, Virtual, 25–29 April 2022. [Google Scholar]
- Wang, X.; Guo, P.; Zhang, Y. Domain Adaptation via Bidirectional Cross-Attention Transformer. arXiv 2022, arXiv:2201.05887. [Google Scholar]
- Ma, W.; Zhang, J.; Li, S.; Liu, C.H.; Wang, Y.; Li, W. Making The Best of Both Worlds: A Domain-Oriented Transformer for Unsupervised Domain Adaptation. In Proceedings of the 30th ACM International Conference on Multimedia (MM’22), Lisboa, Portugal, 10–14 October 2022; pp. 5620–5629. [Google Scholar] [CrossRef]
- Lee, D.H. Pseudo-label: The simple and efficient semi-supervised learning method for deep neural networks. In Proceedings of the Workshop on Challenges in Representation Learning, ICML, Atlanta, GA, USA, 16–21 June 2013; Volume 3, p. 896. [Google Scholar]
- Liang, J.; Hu, D.; Feng, J. Domain Adaptation with Auxiliary Target Domain-Oriented Classifier. In Proceedings of the IEEE/CVF Conference on Computer Vision and Pattern Recognition (CVPR), Nashville, TN, USA, 20–25 June 2021; pp. 16632–16642. [Google Scholar]
- Liang, J.; Hu, D.; Feng, J. Do we really need to access the source data? Source hypothesis transfer for unsupervised domain adaptation. In Proceedings of the International Conference on Machine Learning, PMLR, Virtual, 13–18 July 2020; pp. 6028–6039. [Google Scholar]
- Gu, X.; Sun, J.; Xu, Z. Unsupervised and Semi-supervised Robust Spherical Space Domain Adaptation. IEEE Trans. Pattern Anal. Mach. Intell. 2022, 46, 1757–1774. [Google Scholar] [CrossRef] [PubMed]
- Zhang, W.; Xu, D.; Ouyang, W.; Li, W. Self-Paced Collaborative and Adversarial Network for Unsupervised Domain Adaptation. IEEE Trans. Pattern Anal. Mach. Intell. 2021, 43, 2047–2061. [Google Scholar] [CrossRef]
- Lu, Y.; Wong, W.K.; Zeng, B.; Lai, Z.; Li, X. Guided Discrimination and Correlation Subspace Learning for Domain Adaptation. IEEE Trans. Image Process. 2023, 32, 2017–2032. [Google Scholar] [CrossRef]
- Yu, Y.C.; Lin, H.T. Semi-Supervised Domain Adaptation with Source Label Adaptation. In Proceedings of the 2023 IEEE/CVF Conference on Computer Vision and Pattern Recognition (CVPR), Vancouver, BC, Canada, 17–24 June 2023; pp. 24100–24109. [Google Scholar] [CrossRef]
- Kwak, G.H.; Park, N.W. Unsupervised domain adaptation with adversarial self-training for crop classification using remote sensing images. Remote Sens. 2022, 14, 4639. [Google Scholar] [CrossRef]
- Gao, K.; Yu, A.; You, X.; Qiu, C.; Liu, B. Prototype and Context Enhanced Learning for Unsupervised Domain Adaptation Semantic Segmentation of Remote Sensing Images. IEEE Trans. Geosci. Remote Sens. 2023, 61, 5608316. [Google Scholar] [CrossRef]
- Kenton, J.D.M.W.C.; Toutanova, L.K. Bert: Pre-training of deep bidirectional transformers for language understanding. In Proceedings of the naacL-HLT, Minneapolis, MN, USA, 2–7 June 2019; Volume 1, p. 2. [Google Scholar]
- Bao, H.; Dong, L.; Piao, S.; Wei, F. BEiT: BERT Pre-Training of Image Transformers. In Proceedings of the International Conference on Learning Representations, Virtual, 25–29 April 2022. [Google Scholar]
- Xie, Z.; Zhang, Z.; Cao, Y.; Lin, Y.; Bao, J.; Yao, Z.; Dai, Q.; Hu, H. SimMIM: A Simple Framework for Masked Image Modeling. arXiv 2021, arXiv:2111.09886. [Google Scholar]
- He, K.; Chen, X.; Xie, S.; Li, Y.; Dollár, P.; Girshick, R. Masked Autoencoders Are Scalable Vision Learners. In Proceedings of the 2022 IEEE/CVF Conference on Computer Vision and Pattern Recognition (CVPR), New Orleans, LA, USA, 18–24 June 2022; pp. 15979–15988. [Google Scholar] [CrossRef]
- Bachmann, R.; Mizrahi, D.; Atanov, A.; Zamir, A. MultiMAE: Multi-modal Multi-task Masked Autoencoders. arXiv 2022, arXiv:2204.01678. [Google Scholar]
- Gao, P.; Lin, Z.; Zhang, R.; Fang, R.; Li, H.; Li, H.; Qiao, Y. Mimic before reconstruct: Enhancing masked autoencoders with feature mimicking. Int. J. Comput. Vis. 2023, 132, 1546–1556. [Google Scholar] [CrossRef]
- Liu, J.; Huang, X.; Yoshie, O.; Liu, Y.; Li, H. MixMIM: Mixed and Masked Image Modeling for Efficient Visual Representation Learning. arXiv 2022, arXiv:2205.13137. [Google Scholar]
- Wei, C.; Fan, H.; Xie, S.; Wu, C.Y.; Yuille, A.; Feichtenhofer, C. Masked feature prediction for self-supervised visual pre-training. In Proceedings of the IEEE/CVF Conference on Computer Vision and Pattern Recognition, New Orleans, LA, USA, 18–24 June 2022; pp. 14668–14678. [Google Scholar]
- Sun, X.; Wang, P.; Lu, W.; Zhu, Z.; Lu, X.; He, Q.; Li, J.; Rong, X.; Yang, Z.; Chang, H.; et al. RingMo: A Remote Sensing Foundation Model with Masked Image Modeling. IEEE Trans. Geosci. Remote Sens. 2022, 61, 5612822. [Google Scholar] [CrossRef]
- Wang, D.; Zhang, Q.; Xu, Y.; Zhang, J.; Du, B.; Tao, D.; Zhang, L. Advancing Plain Vision Transformer Towards Remote Sensing Foundation Model. arXiv 2022, arXiv:2208.03987. [Google Scholar] [CrossRef]
- Zhang, T.; Gao, P.; Dong, H.; Zhuang, Y.; Wang, G.; Zhang, W.; Chen, H. Consecutive Pre-Training: A Knowledge Transfer Learning Strategy with Relevant Unlabeled Data for Remote Sensing Domain. Remote Sens. 2022, 14, 5675. [Google Scholar] [CrossRef]
- Wang, R.; Wu, Z.; Weng, Z.; Chen, J.; Qi, G.J.; Jiang, Y.G. Cross-Domain Contrastive Learning for Unsupervised Domain Adaptation. IEEE Trans. Multimed. 2023, 25, 1665–1673. [Google Scholar] [CrossRef]
- Liu, W.; Wang, X.; Owens, J.; Li, Y. Energy-based out-of-distribution detection. Adv. Neural Inf. Process. Syst. 2020, 33, 21464–21475. [Google Scholar]
- Wang, H.; Liu, W.; Bocchieri, A.; Li, Y. Energy-based Out-of-distribution Detection for Multi-label Classification. In Proceedings of the International Conference on Learning Representations, ICLR 2021, Vienna, Austria, 4 May 2021. [Google Scholar]
- Lin, Z.; Roy, S.D.; Li, Y. MOOD: Multi-Level Out-of-Distribution Detection. In Proceedings of the IEEE/CVF Conference on Computer Vision and Pattern Recognition (CVPR), Nashville, TN, USA, 20–25 June 2021; pp. 15313–15323. [Google Scholar]
- Choi, H.; Jeong, H.; Choi, J.Y. Balanced Energy Regularization Loss for Out-of-distribution Detection. In Proceedings of the IEEE/CVF Conference on Computer Vision and Pattern Recognition, Vancouver, BC, Canada, 17–24 June 2023; pp. 15691–15700. [Google Scholar]
- Cheng, G.; Han, J.; Lu, X. Remote Sensing Image Scene Classification: Benchmark and State of the Art. Proc. IEEE 2017, 105, 1865–1883. [Google Scholar] [CrossRef]
- Xia, G.S.; Hu, J.; Hu, F.; Shi, B.; Bai, X.; Zhong, Y.; Zhang, L.; Lu, X. AID: A Benchmark Data Set for Performance Evaluation of Aerial Scene Classification. IEEE Trans. Geosci. Remote Sens. 2017, 55, 3965–3981. [Google Scholar] [CrossRef]
- Yang, Y.; Newsam, S. Bag-of-Visual-Words and Spatial Extensions for Land-Use Classification. In Proceedings of the 18th SIGSPATIAL International Conference on Advances in Geographic Information Systems (GIS’10), San Jose, CA, USA, 2–5 November 2010; pp. 270–279. [Google Scholar] [CrossRef]
- He, K.; Zhang, X.; Ren, S.; Sun, J. Deep Residual Learning for Image Recognition. In Proceedings of the 2016 IEEE Conference on Computer Vision and Pattern Recognition (CVPR), Las Vegas, NV, USA, 27–30 June 2016; pp. 770–778. [Google Scholar] [CrossRef]
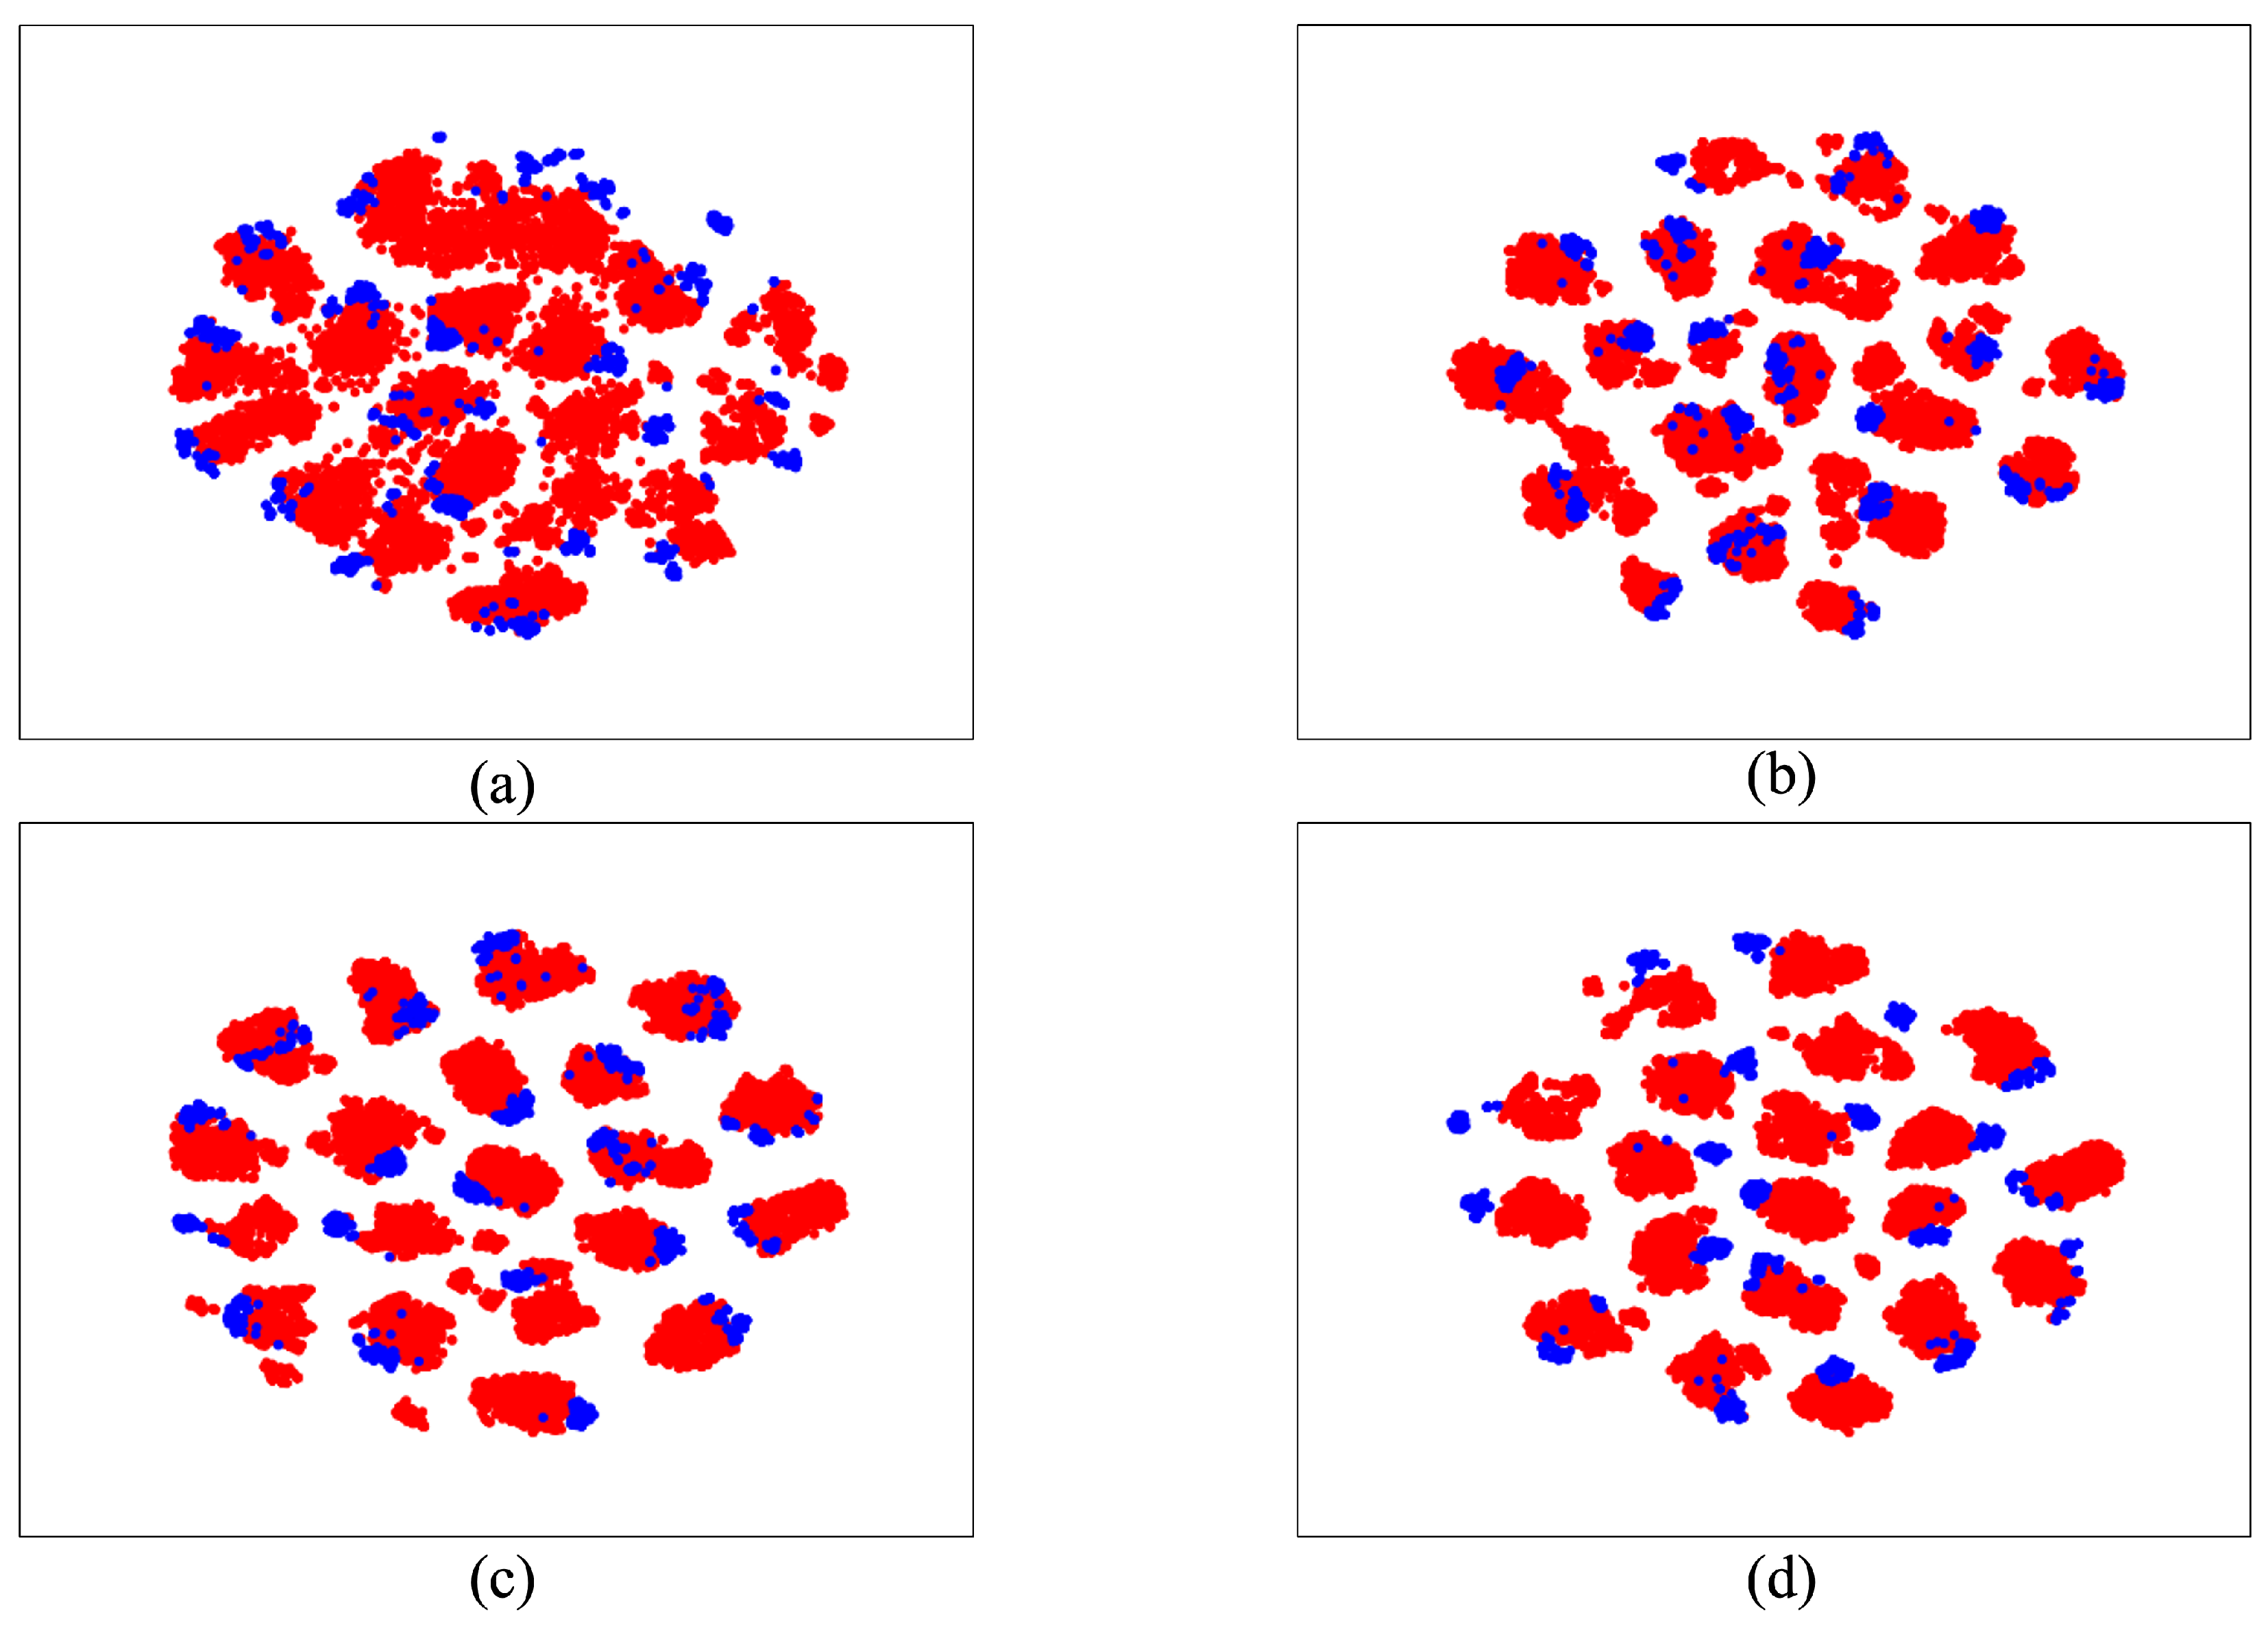
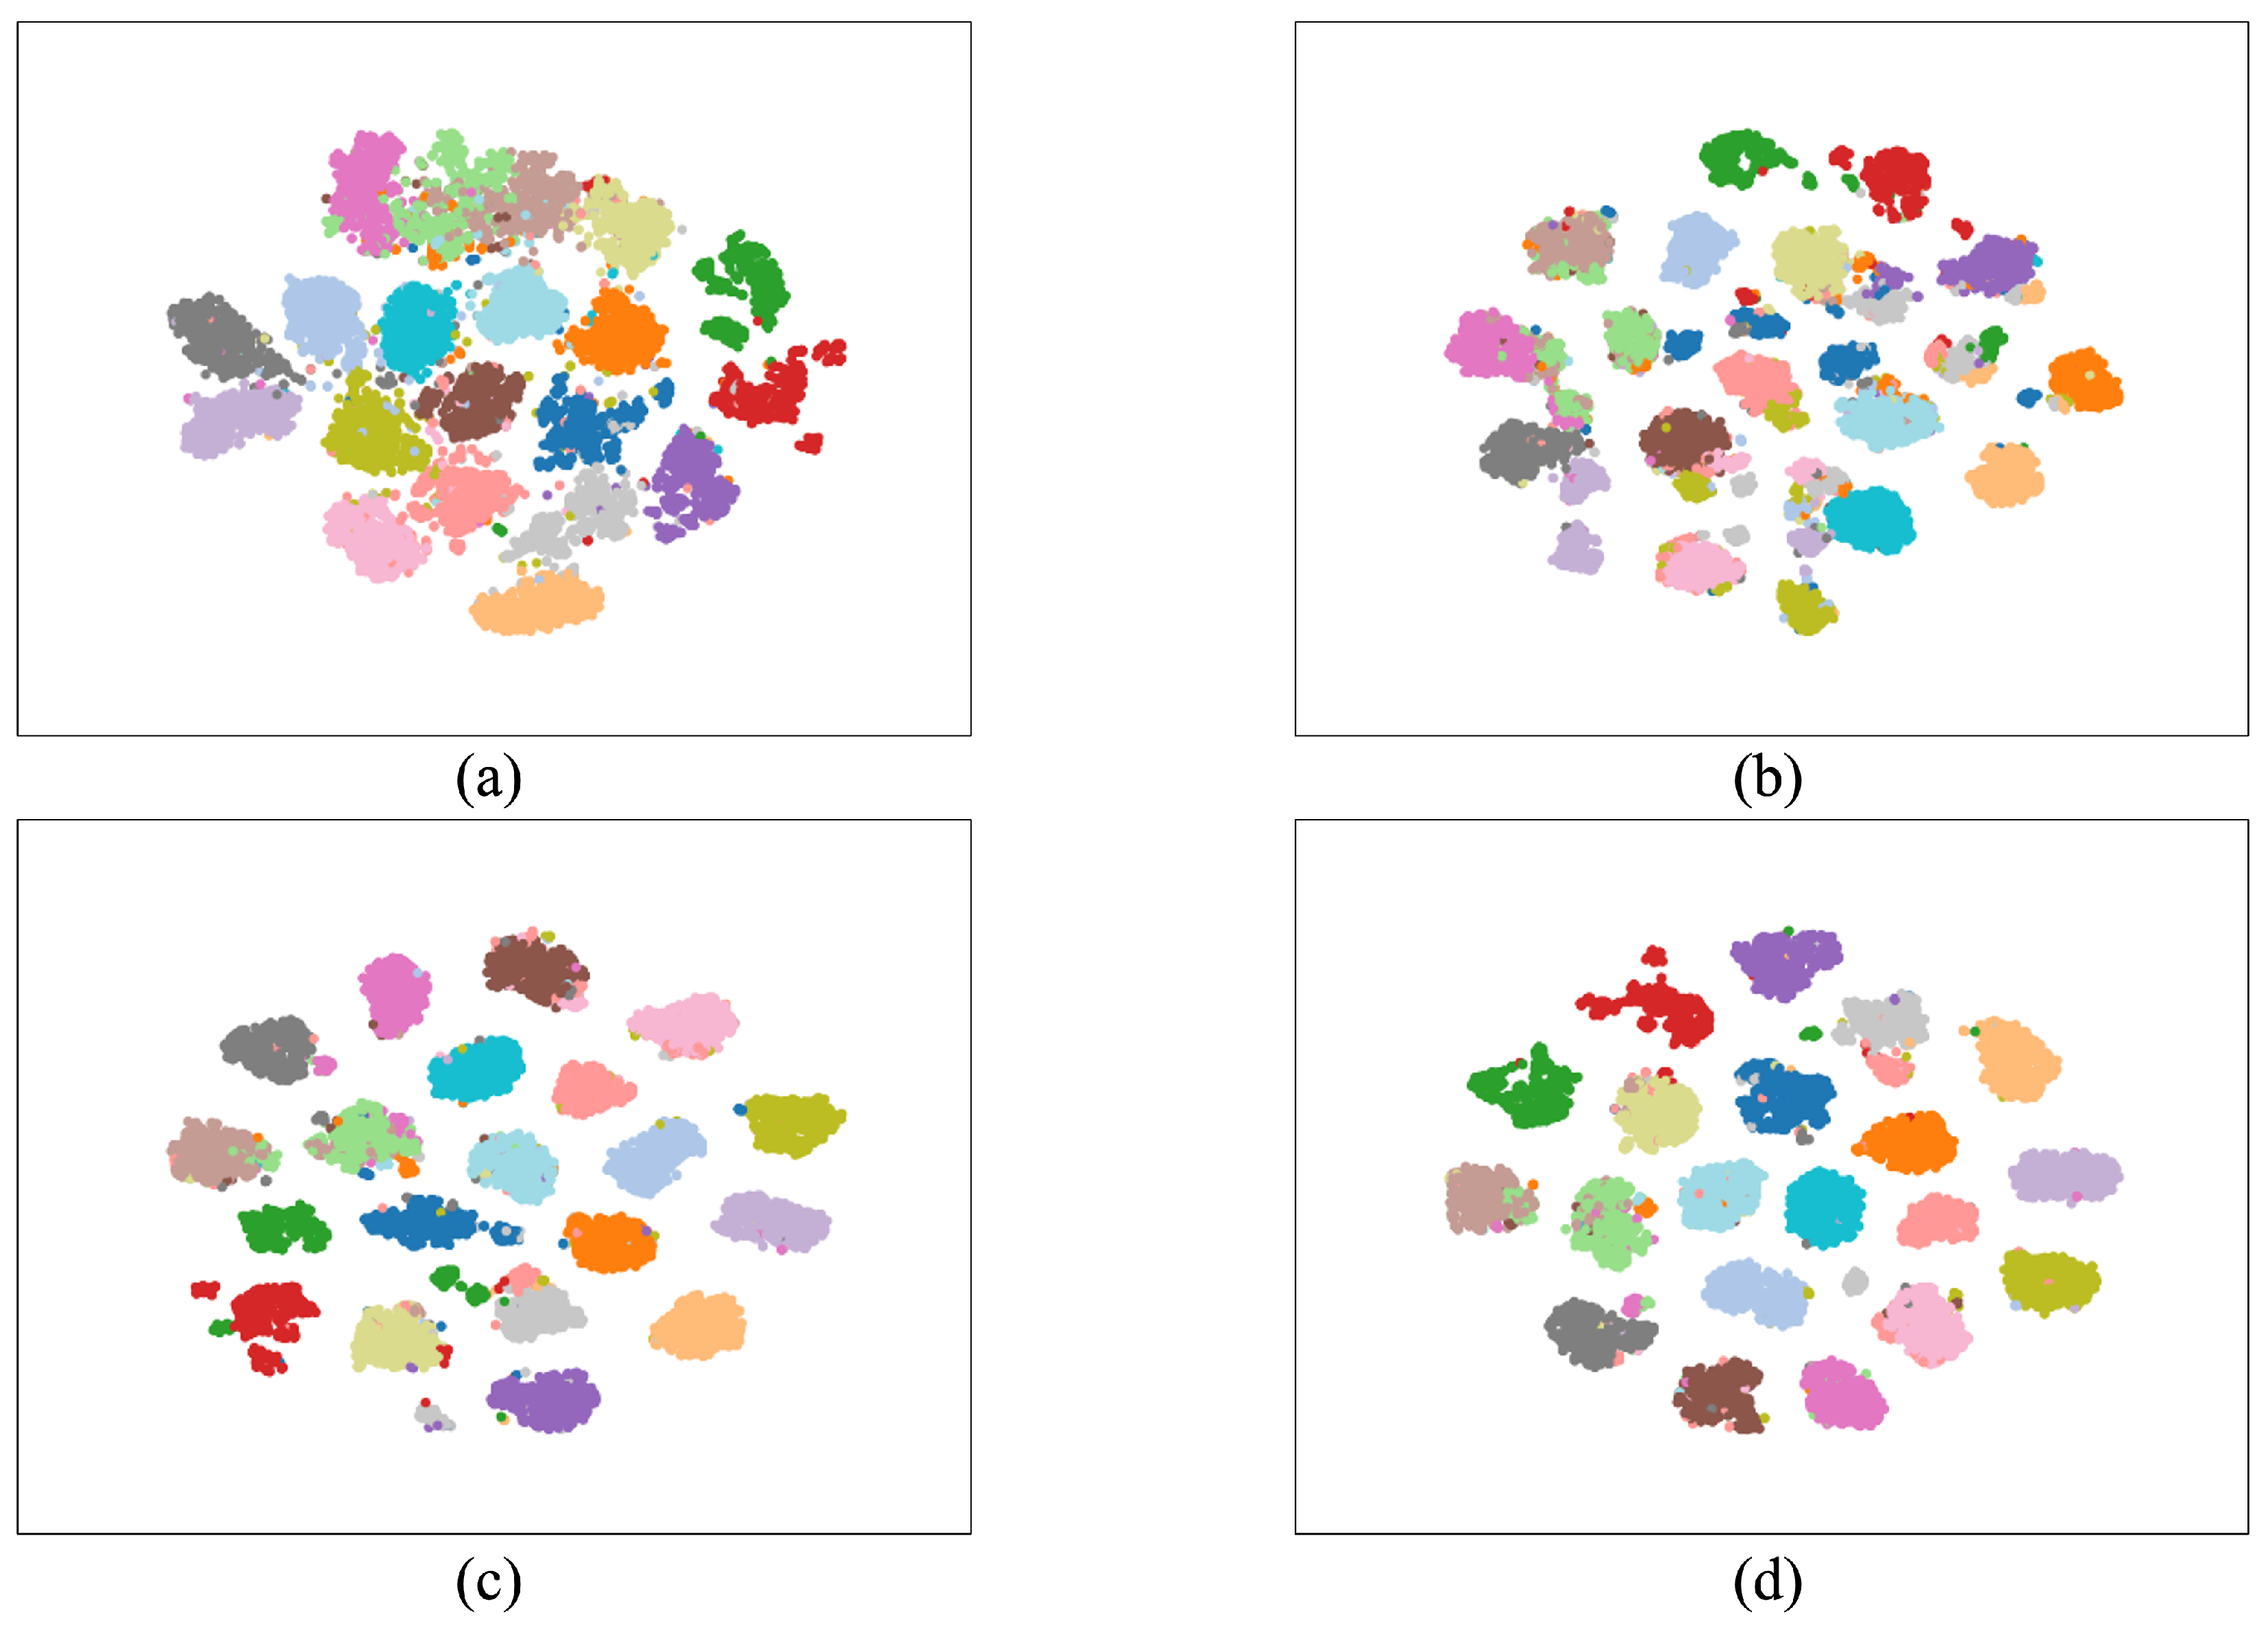
- Van der Maaten, L.; Hinton, G. Visualizing data using t-SNE. J. Mach. Learn. Res. 2008, 9, 2579–2605. [Google Scholar]


| Task | Labeled Source | Unlabeled Target | Common Classes |
|---|---|---|---|
| N→A | 16,100 | 7740 | 23 |
| A→N | 7740 | 16,100 | 23 |
| N→U | 14,000 | 2000 | 20 |
| U→N | 2000 | 14,000 | 20 |
| A→U | 4560 | 1300 | 13 |
| U→A | 1300 | 4560 | 13 |
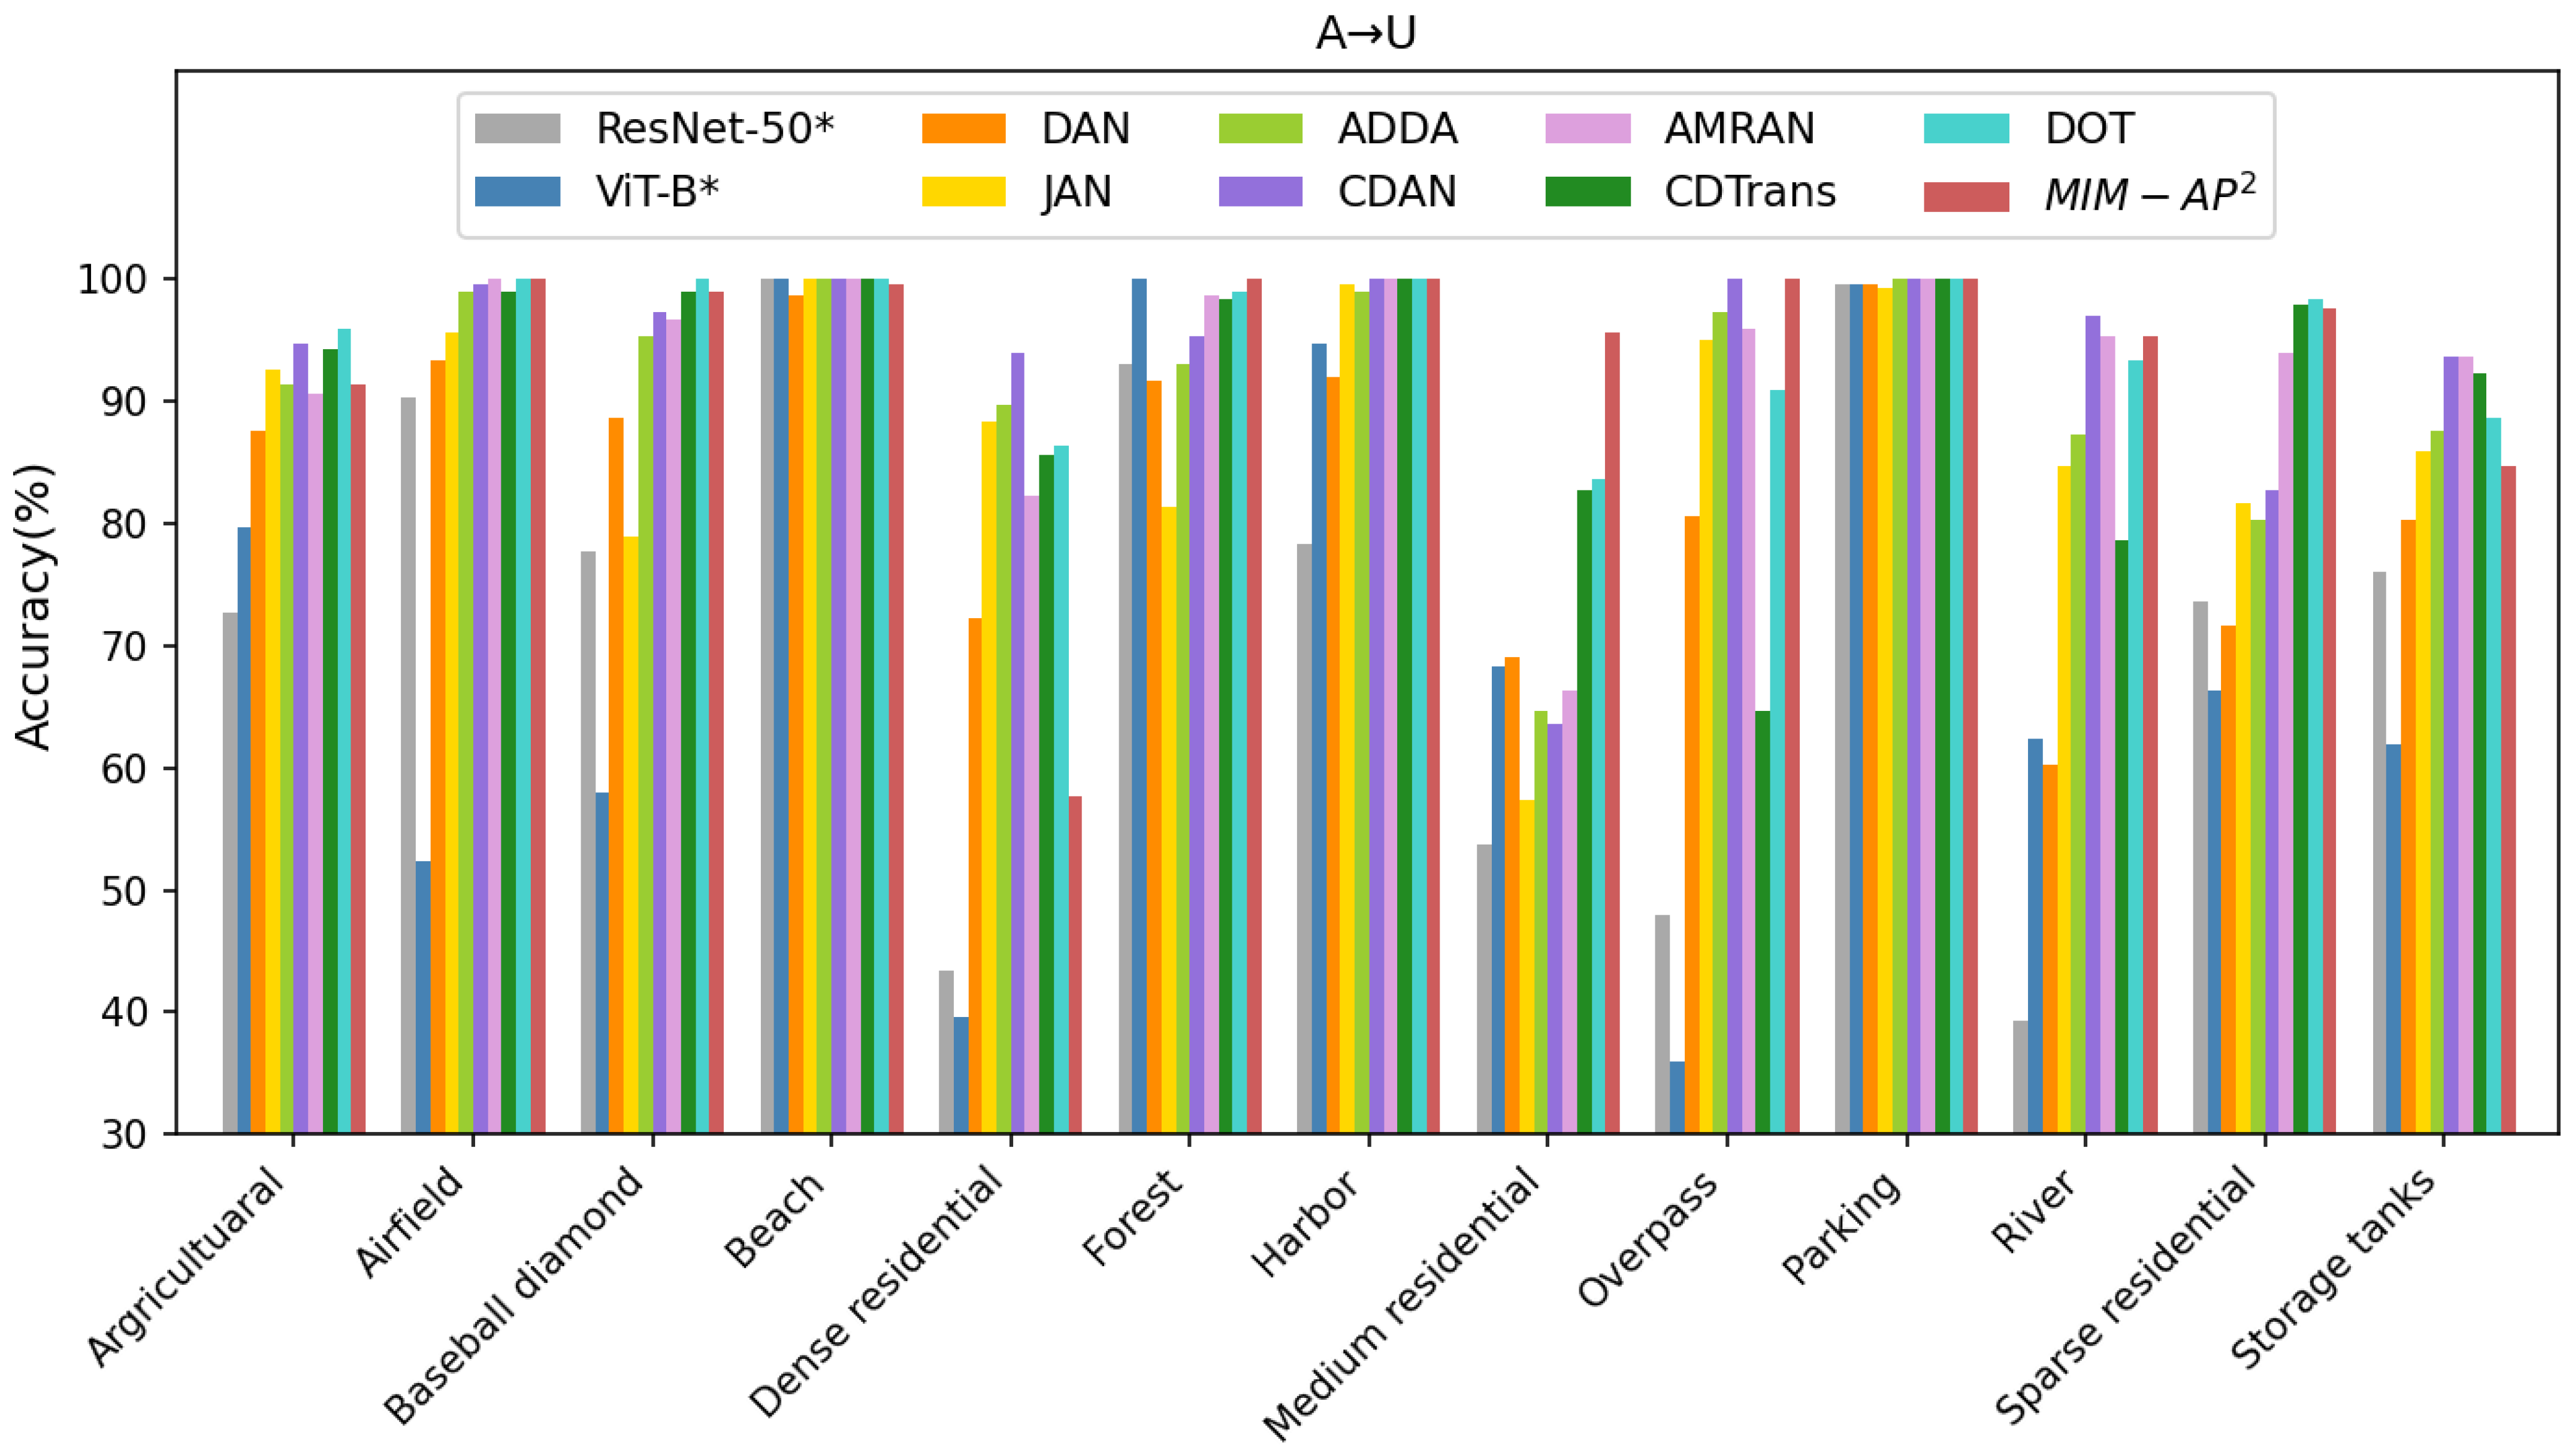
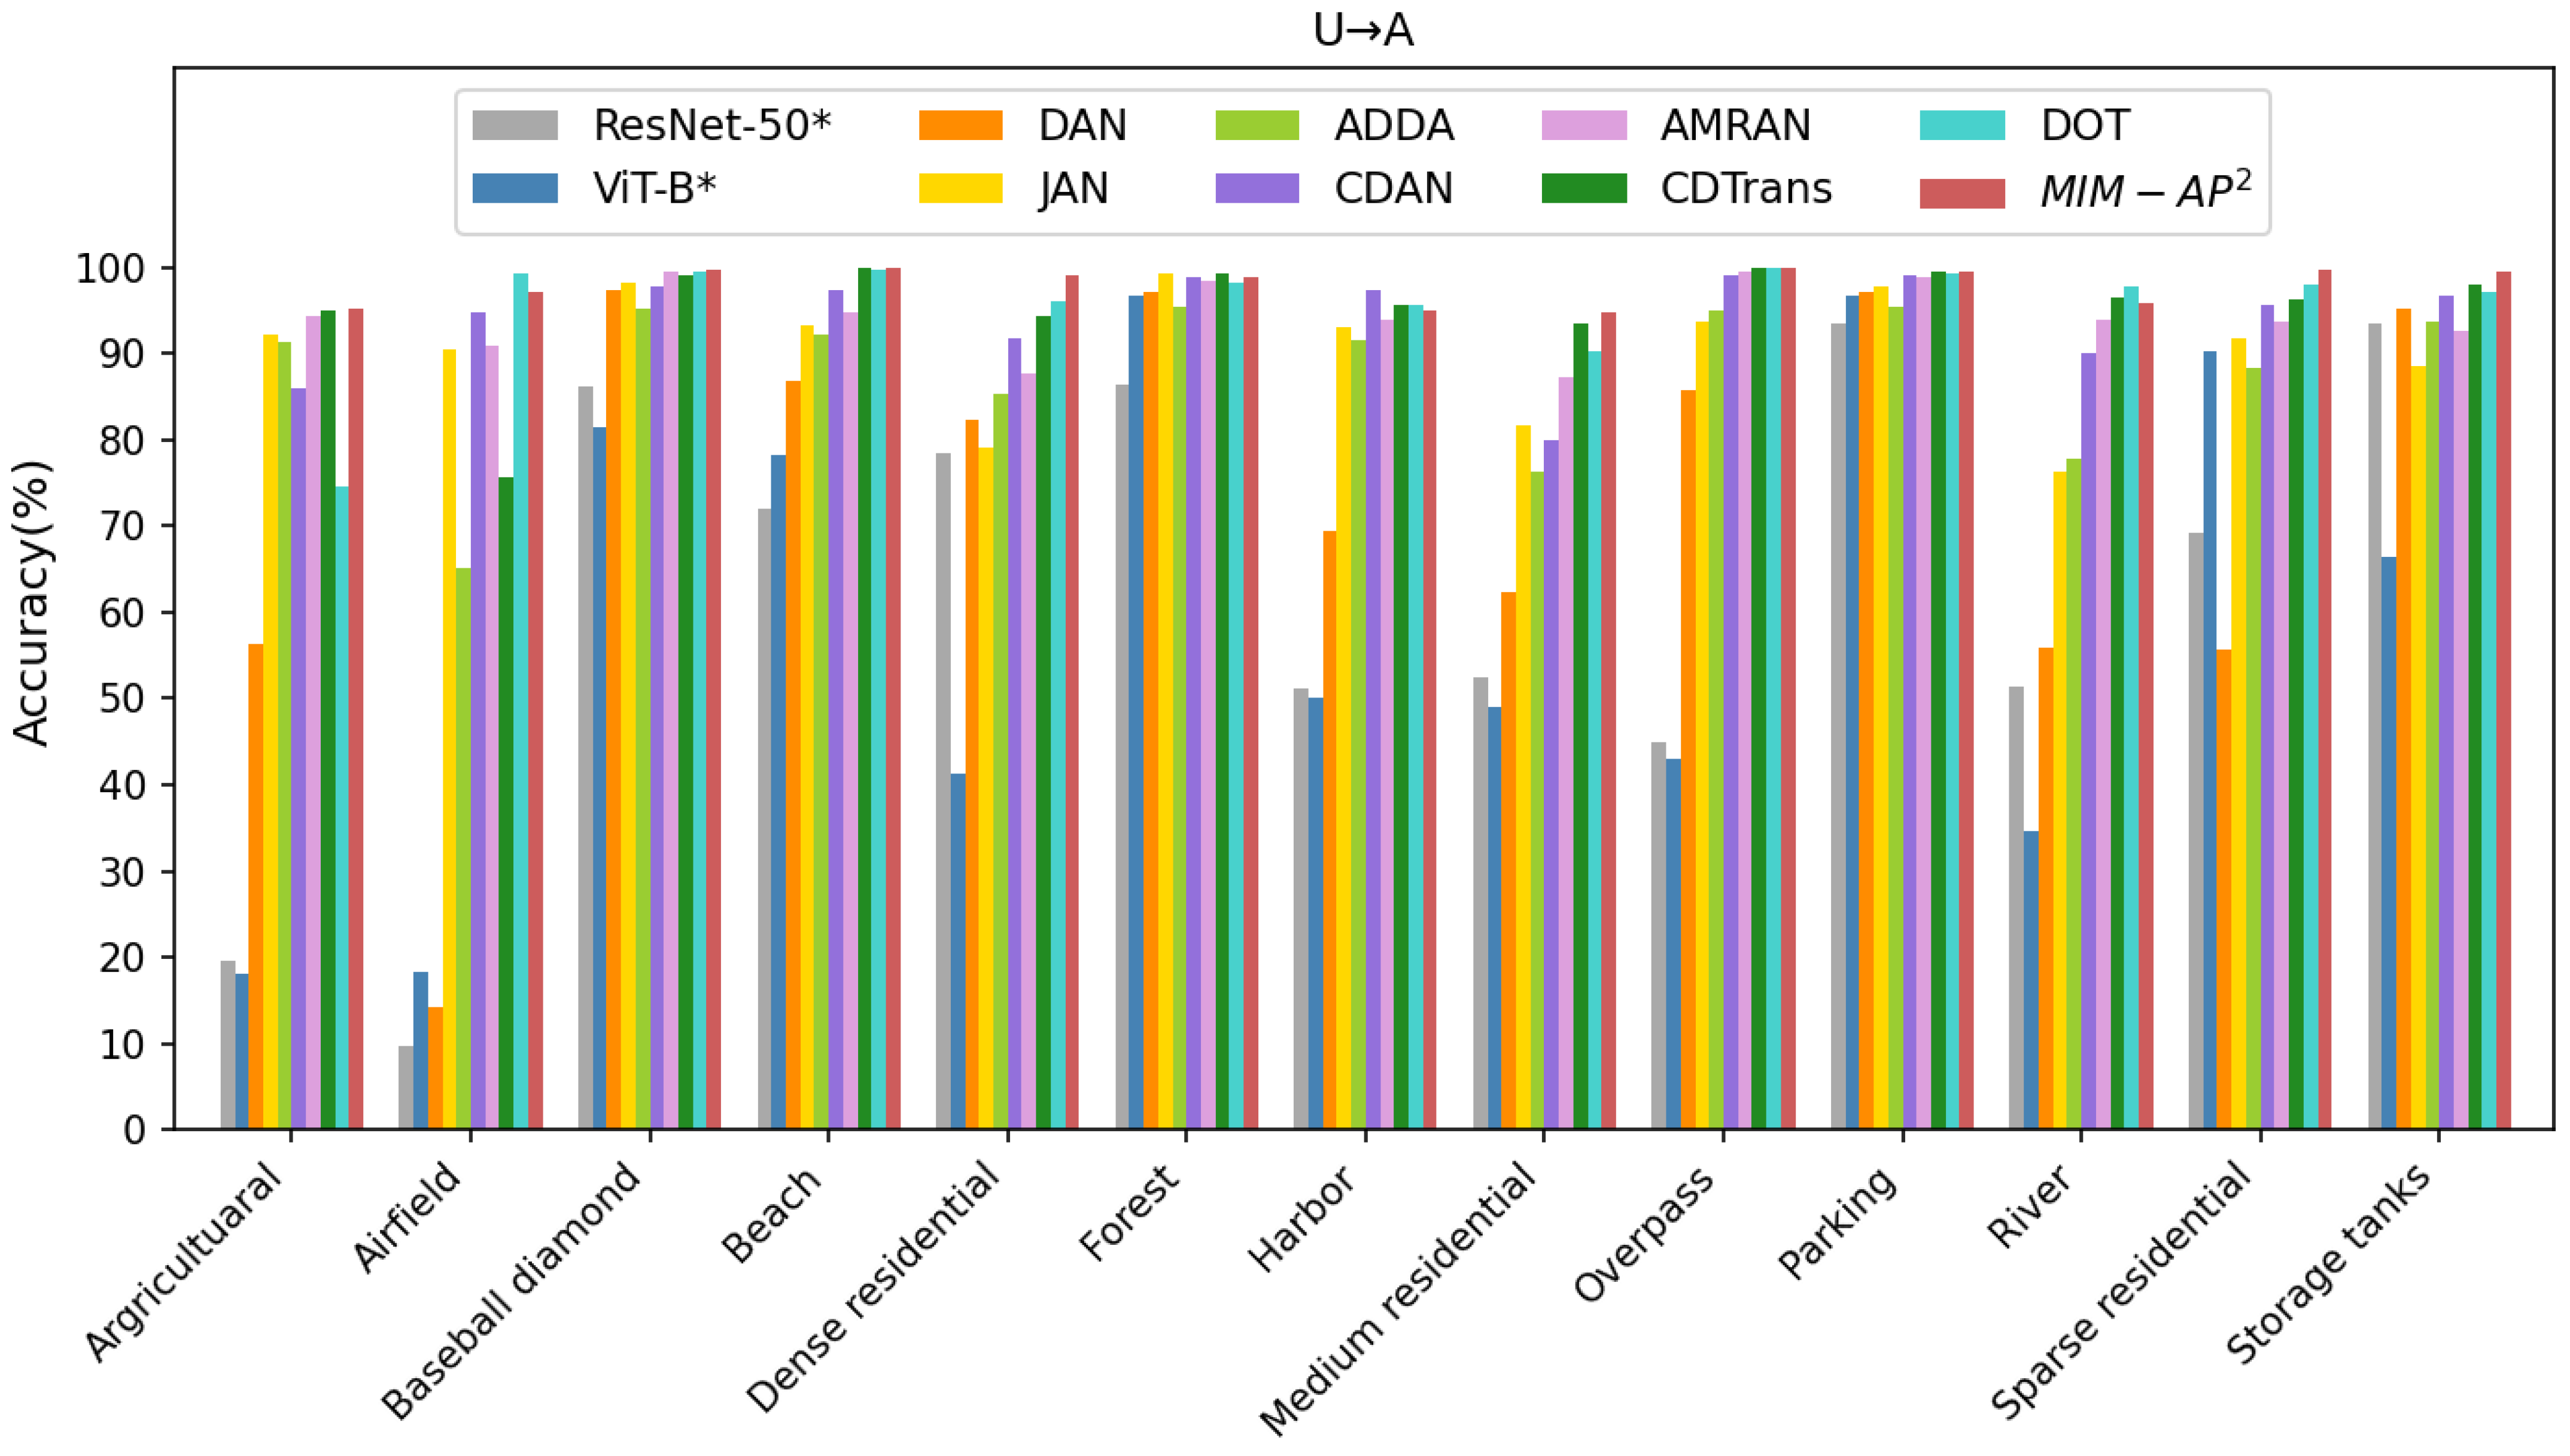
| Method | Public | N→A | A→N | N→U | U→N | A→U | U→A | Avg | FLOPs(G) |
|---|---|---|---|---|---|---|---|---|---|
| ResNet-50 * [63] | CVPR 2016 | 83.14 | 71.74 | 71.18 | 58.24 | 72.74 | 60.89 | 69.66 | 4.13 |
| ViT-B * [54] | RS 2022 | 89.88 | 83.22 | 77.75 | 65.42 | 70.69 | 56.57 | 73.92 | 16.86 |
| DAN [16] | ICML 2015 | 85.16 | 76.68 | 82.35 | 64.64 | 83.54 | 72.87 | 77.54 | 4.13 |
| JAN [18] | ICML 2017 | 87.61 | 82.04 | 89.18 | 79.89 | 87.74 | 89.88 | 86.06 | 4.13 |
| ADDA [21] | CVPR 2017 | 86.51 | 81.53 | 88.37 | 81.64 | 91.13 | 87.71 | 86.15 | 4.13 |
| CDAN [23] | NIPS 2018 | 93.32 | 86.86 | 92.18 | 85.21 | 93.69 | 94.17 | 90.91 | 4.13 |
| AMRAN [8] | TGRS 2021 | 92.43 | 86.06 | 94.17 | 78.14 | 93.36 | 94.09 | 89.71 | 8.32 |
| CDTrans [32] | ICLR 2022 | 93.23 | 85.93 | 94.27 | 83.89 | 91.74 | 95.53 | 90.76 | 16.98 |
| DOT [34] | ACMMM 2022 | 98.13 | 91.52 | 95.25 | 92.44 | 95.10 | 95.77 | 94.70 | 16.95 |
| ours | 97.92 | 94.08 | 96.80 | 94.02 | 93.92 | 97.97 | 95.79 | 16.86 |
| Pre | Contrastive Learning | Strategy | MIM | Avg (%) |
|---|---|---|---|---|
| ✓ | ||||
| ✓ | ✓ | |||
| ✓ | ✓ | ✓ | ||
| ✓ | ✓ | ✓ | ✓ |
Disclaimer/Publisher’s Note: The statements, opinions and data contained in all publications are solely those of the individual author(s) and contributor(s) and not of MDPI and/or the editor(s). MDPI and/or the editor(s) disclaim responsibility for any injury to people or property resulting from any ideas, methods, instructions or products referred to in the content. |
© 2024 by the authors. Licensee MDPI, Basel, Switzerland. This article is an open access article distributed under the terms and conditions of the Creative Commons Attribution (CC BY) license (https://creativecommons.org/licenses/by/4.0/).
Share and Cite
Zhang, X.; Zhuang, Y.; Zhang, T.; Li, C.; Chen, H. Masked Image Modeling Auxiliary Pseudo-Label Propagation with a Clustering Central Rectification Strategy for Cross-Scene Classification. Remote Sens. 2024, 16, 1983. https://doi.org/10.3390/rs16111983
Zhang X, Zhuang Y, Zhang T, Li C, Chen H. Masked Image Modeling Auxiliary Pseudo-Label Propagation with a Clustering Central Rectification Strategy for Cross-Scene Classification. Remote Sensing. 2024; 16(11):1983. https://doi.org/10.3390/rs16111983
Chicago/Turabian StyleZhang, Xinyi, Yin Zhuang, Tong Zhang, Can Li, and He Chen. 2024. "Masked Image Modeling Auxiliary Pseudo-Label Propagation with a Clustering Central Rectification Strategy for Cross-Scene Classification" Remote Sensing 16, no. 11: 1983. https://doi.org/10.3390/rs16111983
APA StyleZhang, X., Zhuang, Y., Zhang, T., Li, C., & Chen, H. (2024). Masked Image Modeling Auxiliary Pseudo-Label Propagation with a Clustering Central Rectification Strategy for Cross-Scene Classification. Remote Sensing, 16(11), 1983. https://doi.org/10.3390/rs16111983