Abstract
Oil spill detection plays an important role in marine environment protection. The technique of global navigation satellite system-reflectometry (GNSS-R) has the advantage of a short revisit time, which could help with timely cleanup of marine oil pollution. The conventional GNSS-R oil spill detection algorithm can resolve only the dielectric constant of oil based on power ratio measurements, while that of water cannot be realized. This is because the dielectric constant of water is much larger than that of oil such that the range of the equation used in the conventional algorithm is inadequate. To resolve this problem, we proposed a new algorithm containing a new equation with a larger scope, which has never been applied previously to GNSS-R oil spill detection. We derived a lookup method to resolve the dielectric constant of both oil and water. To validate our method, a drone-borne GNSS-R experiment based on dual-frequency QZSS reflection signals was conducted on 17 July 2023 using experimental pools simulating oil spills. Raw IF data in the L1 and L5 bands, collected using dual antennas and a data recorder, were processed using a software-defined receiver to deduce the power ratios and SNR of the GNSS signals. Results showed that the proposed algorithm is capable of resolving the dielectric constants of the reflected surface. In addition, the L5 signal was found to provide more detail and better contrast than the L1 C/A signal.
1. Introduction
Oil spills on the sea surface can seriously harm the marine environment. Therefore, it is urgent that a powerful technique be developed to detect oil on the sea surface, which could help with timely cleanup operations. Currently, marine oil spills are detected using a combination of radar and optical satellite imagery [1,2]. However, optical satellite retrievals are affected substantially by adverse weather conditions, while the acquisition of radar data can be expensive and intermittent. The technique of global navigation satellite system-reflectometry (GNSS-R) has the advantages of all-weather operation, low cost, and rich signal sources, making it suitable for low-orbit satellite networking observation. Moreover, it is possible to realize global revisit times at the hourly level.
The GNSS-R technique was proposed originally for mesoscale altimetry [3], but it is recognized as a technology with great application potential in many other remote sensing fields [4,5,6,7]. Previous studies reviewed the feasibility of detecting an oil-slicked sea surface using GNSS-R based mainly on scattering coefficient retrievals using delay-Doppler map (DDM) measurements [8,9]. The methodology of a spatial integration approach was applied to a sea surface oil slick detection simulation [10]. In [11], certain improvements were applied to this technique to reduce its limitations in practical applications. A previous study generated a DDM of an oil-slicked sea surface under a general scenario by combining the mean-square slope model for oil slicked/clean surfaces and the GNSS-R Zavorotny–Voronovich scattering model [12], which was applied to BeiDou-R satellite signals in [13]. Subsequently, [14] analyzed the sensitivity of the peak of the DDM over the ocean to the relative speed vectors between the transmitter and the receiver, wind speed and direction, or the presence of oil slicks. A method proposed in 2017 introduced a shore-based approach for detecting oil spills on the sea surface that exploits the discrepancy between the inverted dielectric constant and that of seawater as a distinguishing criterion [15].
Earlier related studies generally failed to distinguish oil and water using a single equation. Therefore, we developed a novel algorithm to distinguish oil and water by inverting the dielectric constant. We conducted a drone-borne GNSS-R experiment based on QZSS L1 C/A and L5 signals to verify the feasibility of the proposed algorithm for oil spill detection using two pools that simulate an oil spill on the sea surface. We opted for a drone because of its high flexibility, allowing it to conduct surveys in our specific and targeted areas. The raw IF data in the L1 and L5 bands, which covered a 20-min period, were collected using dual antennas and an IF data recorder. The data were processed by a software-defined receiver to determine the power ratio and the SNR measurements of the direct and reflected signals. The dielectric constant of the reflected surface was resolved based on power ratio measurements. The inversion diagram of the dielectric constant and SNR was constructed by combining the dielectric constant and the SNR with reflectance points. Then, the inversion diagram of the SNR was used to verify the inversion diagram of the dielectric constant. In our experiment, the QZSS GEO satellite was selected because it has continuous all-weather capability, and is a reasonably stable platform with constant attitude and elevation. Moreover, our experiment marked the first time that the L5 signal and airborne GNSS-R were combined for oil spill detection.
The remainder of this paper is organized as follows. In Section 2, we briefly introduce the geometry of the reflected signal and the principles underlying our work, which include a new relationship that we derived between the reflectance and the dielectric constant, and a new approach to dealing with the dielectric constant. Section 3 provides details of our oil spill detection experiment and describes the setups used. Meanwhile, our experimental results are presented and analyzed. In Section 4, the main results are summarized and the problems that remain unresolved are discussed. Finally, the derived conclusions are presented in Section 5.
2. Materials and Methods
From the software-defined receiver, certain physical quantities can be obtained, e.g., the peak size and the mean size of the DDM of the direct and reflected signals. The dielectric constant and the SNR can be obtained using the following methods.
2.1. Solving the Dielectric Constant
The power ratio between the direct signal and the reflected signal can be derived from the raw IF data using our SDR with a 1-s interval. In this study, the power ratio was taken to represent reflectance. The relationship between the dielectric constant of the reflecting surface and reflectance is expressed in the following two equations [16,17]:
where represents the dielectric constant, represents the satellite elevation, represents the reflected signal power, represents the direct signal power, and is the power ratio.
In our experiment, the power ratio was the quotient between the peak size of the DDM of the reflected signal and the peak size of the DDM of the direct signal. Because the zenith and nadir antennas were the same except in terms of polarization, the power ratio can be regarded as reflectance. Figure 1 illustrates the relationship between reflectance and the dielectric constant computed using Equations (1) (red curve) and (2) (blue curve). It is evident that as the reflectance increases, Equation (2) fails to compute the dielectric constant, whereas the results derived using Equation (1) are valid.
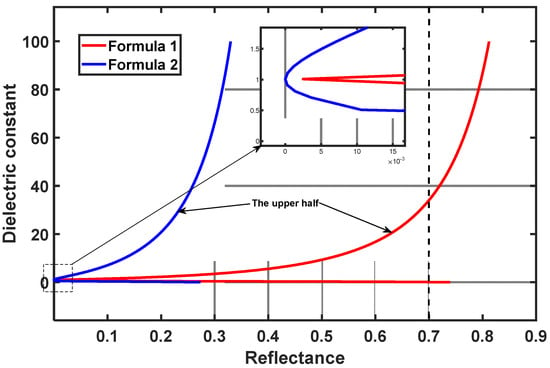
Figure 1.
Dielectric constant–reflectance plots computed using Equations (1) and (2). The function images are multivalued. For example, the reflectance of 0.7 in the figure corresponds to the two dielectric constants of Equation (1). A program was used to retain the portion of the dielectric constant in the range of 0.01~100 based on the actual dielectric constant of oil and water. The lower part of the curve starts with a dielectric constant of 0.01 and the upper part of the curve has a dielectric constant of 100. The two curves intersect at the coordinate origin, which has been magnified in the diagram.
The dielectric constant of oil (water) is in the range of 2~4 (70~90). Because the conventional method of inverting the dielectric constant is applicable only to cases with small reflectance, it is not applicable to cases with large reflectance such as water. To solve this problem, we proposed a novel lookup method to resolve the dielectric constant of oil and water together, which is based on the power ratios obtained using the software-defined receiver by processing the IF data. The specific steps of the lookup method are as follows:
- Equations (1) and (2) are used to generate the table of one-to-one corresponding dielectric constants based on a series of reflectance values from 0.01 to 100, spaced at 0.01 intervals.
- Then, the power ratios are compared with the data in the table, and the values of the corresponding dielectric constants are computed by averaging the dielectric constants of its adjacent power ratios.
- From Figure 1, it can be seen that the curve has a multivalued characteristic; hence, the second step will yield two dielectric constant values that differ significantly. Since the dielectric constants of both oil and water are greater than 2 (From the enlarged curve, it can be seen that the boundary point between the upper and lower halves of the curve is less than 2. Due to the decreasing nature of the lower half of the curve, it is known that the solutions corresponding to the lower half of the curve must be less than 2), the larger value obtained in the second step is taken as the correct dielectric constant. Namely, the values from the upper half of the curve are taken.
- By repeating the second and third steps, the dielectric constant values for all points can be obtained. It is evident from Figure 1 that the two equations correspond to different reflectance ranges as the dielectric constant varies in the range of 2~100. The reflectance range of Equation (1) is larger than that of Equation (2). The reason is that the derivation condition is different between the two equations. Equation (1) is applicable to linear polarization modes and has a wider range of applicability, whereas Equation (2) applies to Fresnal cross-polar reflection polarization, which has a smaller range of the dielectric constant [16,17]. Oil on water is considered a smooth surface, which is why we used Equation (1) as the model in our experiment.
2.2. Solving the SNR
The SNR, which is the second important parameter used to distinguish oil and water surfaces in our experiment, provides validation of the inversion diagram of the dielectric constant. The SNR is defined as follows:
where represents the effective power of the signal and represents the effective power of the noise. In our study, adopted the peak size of the DDM of the reflected signal and adopted the mean size of the DDM of the reflected signal. Thus, the SNR could be computed.
2.3. Inversion Diagram of the Dielectric Constant and the SNR
Figure 2 illustrates the process involved in producing the inversion diagram of the dielectric constant and the SNR. RTK is a basic positioning method [18], through which the exact position of the drone can be obtained. Then, using the satellite ephemeris, the elevation and azimuth of the satellite during the experiment can be computed. The position of the reflection point can be derived according to the geometric relationship The position and shape of the experimental pools were measured during the experiment, and the images of the shape of the experimental pools and the reflection points can be drawn in the same coordinate system. The peak size and the mean size of the DDMs of the direct and reflected signals can be obtained from the software-defined receiver. Then, the dielectric constant and the SNR corresponding to each reflection point can be solved using the above steps. By assigning the dielectric constant and the SNR to each reflection point at corresponding times, the inversion diagram of the dielectric constant and the SNR can be realized.
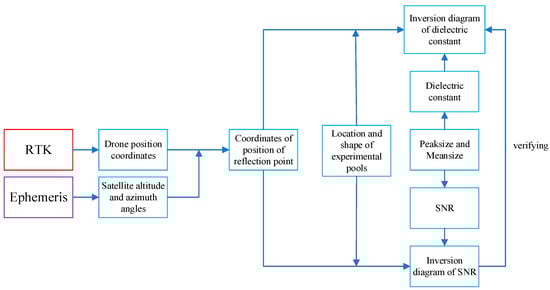
Figure 2.
Basic principles in distinguishing oil and water.
In this experiment, a coherent integration time of 500 was used in our software-defined receiver. The dielectric constant can be solved from the power ratio, and then the inversion diagram of the dielectric constant can be realized.
The dielectric constant is proportional to the reflectance in Figure 1. In this study, the power ratio was taken to represent reflectance. As the power ratio increases, the signal strength increases while the noise remains fairly constant or changes little, so the SNR also increases. Thus, the power ratio is proportional to the SNR. Therefore, inversion diagram of the SNR can be used to verify that of the dielectric constant.
The inversion diagram of the dielectric constant and the SNR can be used to distinguish oil and water. Moreover, using two signal frequencies (i.e., L1 C/A and L5) allows comparison of their performance.
3. Results and Analysis
On 16 July 2023, we conducted an oil spill detection experiment in Qingdao, Shandong Province, China. The experimental site comprised mainly open grassland with two pools: one large pool (named pool 1) and one small pool (named pool 2). Pool 1 was divided into six rectangles (each approximately 3 × 5 m) into which different types of oil (e.g., crude oil and palm oil) were poured. The size of pool 2 was approximately 8 × 8 m. The wind caused the water in pool 2 to collect in the lower-right corner, whereas the oil was distributed in other locations.
3.1. Roving Station and Reference Station with Corresponding Accessories
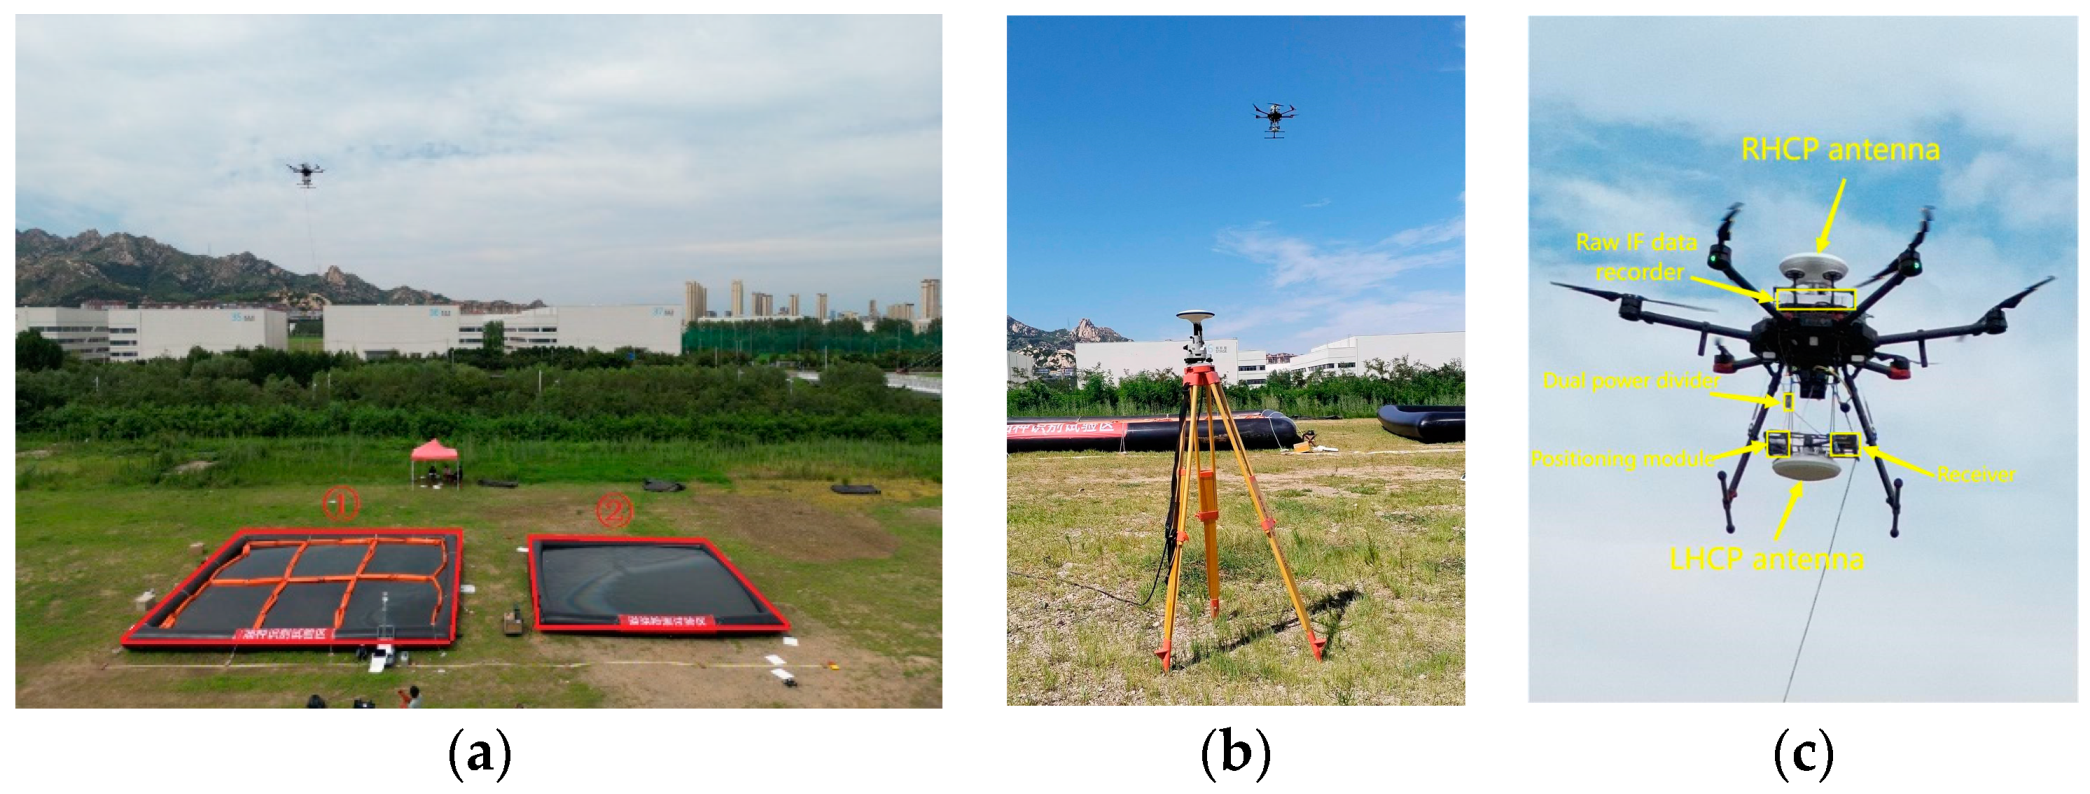
The main experimental equipment comprised a drone equipped with a right-handed circular polarization (RHCP) antenna on its upper body that received direct satellite signals, and a left-handed circular polarization (LHCP) antenna on its lower body that received satellite signals reflected from the surface of the water or oil. The upper and lower antennas had the same gain. The normal gains of the circular antennas are listed in Table 1. In addition, the drone was also equipped with a positioning module, a raw IF data recorder, and other related accessories that enable it to act as a roving station. The drone flew at heights of 8, 10, 12, and 15 m above the experimental pools. The direct antenna received the GNSS direct signal and cooperated with the positioning module to obtain the real-time dynamic high-precision position of the drone, whereas the reflective antenna received the reflected signal from the experimental pools. The IF data recorder down-converted the original received GNSS signal to the IF and stored the data. Figure 3 presents photographs of the corresponding experimental equipment.

Table 1.
Antenna normal gains of the L1 C/A and L5 signals.

Figure 3.
(a) The drone hovering above the experimental pools whose serial number is marked in the figure received a steady stream of data, (b) the reference station, and (c) the drone and its accessories.
During the experiment, the drone first hovered at the height of 10 m, at a position with a horizontal distance of 10 m from the north of pool 1. Then, it hovered at the same height, at a position with a horizontal distance of 10 m from the north of pool 2. In addition, a ground-based reference station was installed dozens of meters from the roving station, as shown in Figure 3b, and its observational data were transmitted to the drone using the China Unicom network. The drone acted as a roving station, equipped with a mobile phone chip, which received satellite signals and observational data from the reference station simultaneously. Furthermore, the precise location of the drone was obtained.
3.2. Geometric Relationship between the Satellite and the Drone
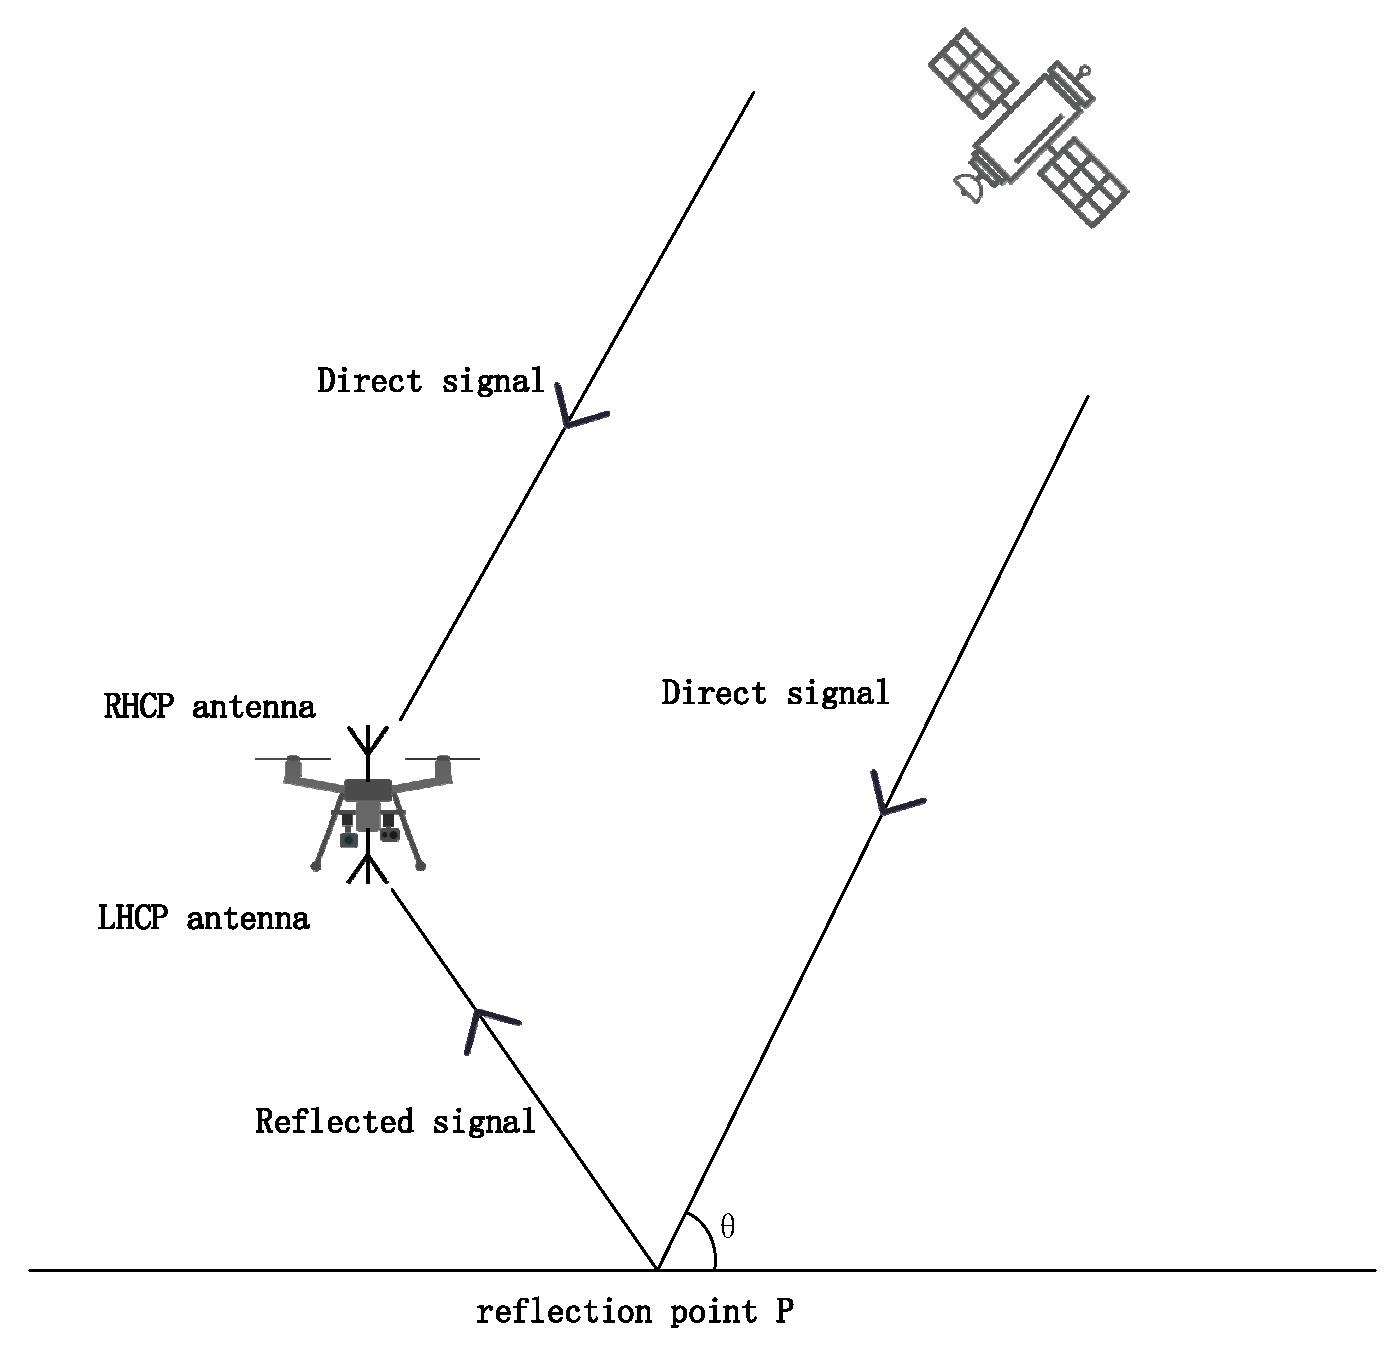
Because the transmitter and the receiver were not collocated, the transmitted GNSS signal was reflected or scattered in a forward direction. The mean elevation of the satellite was 48.87 during the experiment. The specific geometric relationship between the drone, satellite, and reflecting surface is shown in Figure 4.
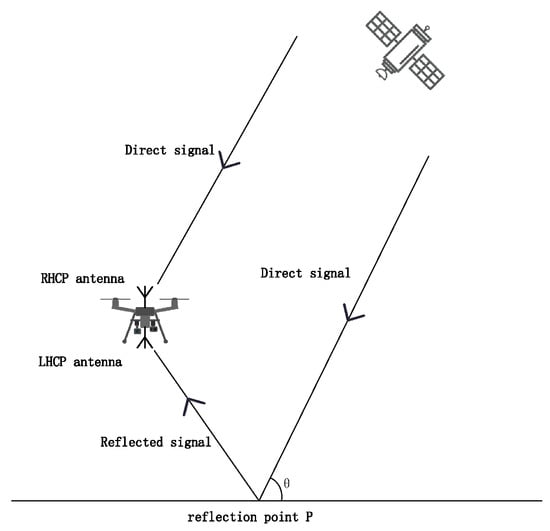
Figure 4.
Geometric relationship between the drone, satellite, and reflecting surface. The arrow represents the direction of signal propagation.
In Figure 4, point P is the specular reflection point and θ is the angle of satellite elevation. The satellite signal is a right circularly polarized wave that is reflected by the liquid surface and becomes a left circularly polarized signal. The RHCP antenna is carried above the drone to receive the direct signals from the satellite, and the LHCP antenna is suspended below the drone to receive the reflected signals from the liquid surface. In our experiment, the distance between the RHCP antenna and the LHCP antenna was neglected.
The satellite used in the experiment was a satellite in geostationary orbit that has little variation in elevation and azimuth. Thus, the influence of satellite-specific parameters on the experimental result was largely eliminated.
The experiment was conducted on 17 July 2023 in Qingdao, Shandong Province, China. The start time of the experiment was 09:41:27 and the end time was 10:00:57 Beijing time. The satellite used was PRN 199, which is a geostationary orbit satellite in the QZSS satellite system. During the experiment, the mean elevation of the satellite was 48.87, making it suitable as a signal emission source. Its azimuth and elevation during the experimental period were obtained through the satellite ephemeris. Because the satellite is positioned to the south of the experimental site, the drone was flown to the north of the experimental site to receive the satellite signal reflected by the experimental pools.
3.3. Location and Height of the Drone
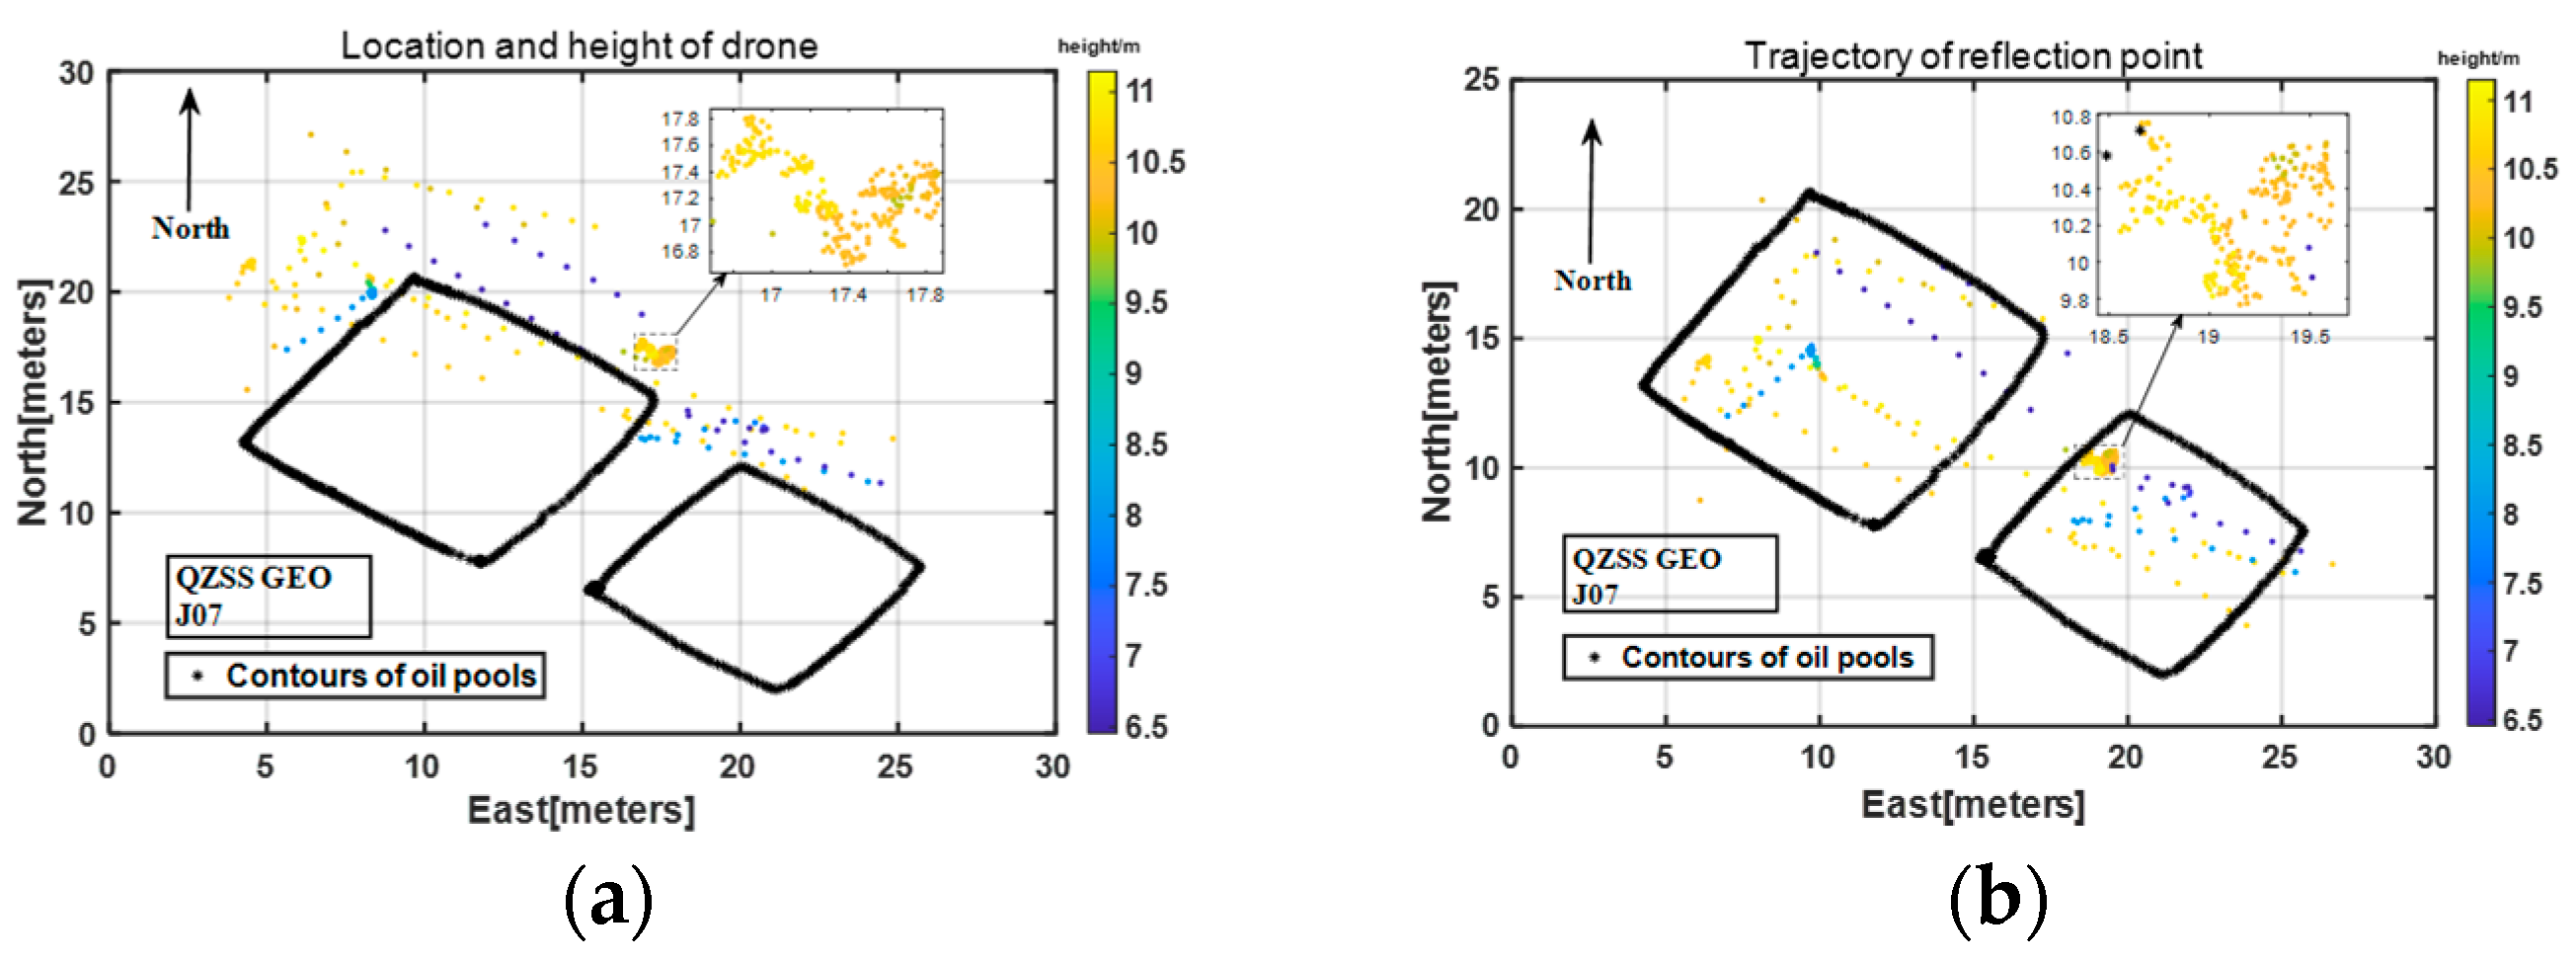
The location and the height of the drone were obtained using the positioning module mounted on the drone. The location of the drone is plotted in Figure 5a, in which the colored dots represent the various heights of the drone. It is clear that the drone was positioned to the north of the experimental pools to facilitate reception of the QZSS signal. The location of the reflection point was calculated using the geometric relationship illustrated in Figure 4. Through temporal correspondence, the corresponding heights of the drone are also shown together with the reflectance points in Figure 5b.

Figure 5.
(a) Locations and heights of the drone, and (b) the trajectory of the reflection points and the corresponding height of the drone. The drone was in a hovering (moving) state when the distribution of the colored dots is dense (sparse). The ‘*’ represents the contours of theexperimental pools. Figure 6 and Figure 7 follow the same logic.
3.4. Inversion Diagram of the Dielectric Constant of the L1 C/A and L5 Signals
The inversion diagram of the dielectric constant was constructed by combining the positional mapping of the reflection points and the corresponding dielectric constant of each point. The positional mapping of the reflection points is shown in Figure 5. The dielectric constant of each reflection point was obtained from the ratio between the power of the direct signal and the power of the reflected signal; the results are shown in Figure 6.

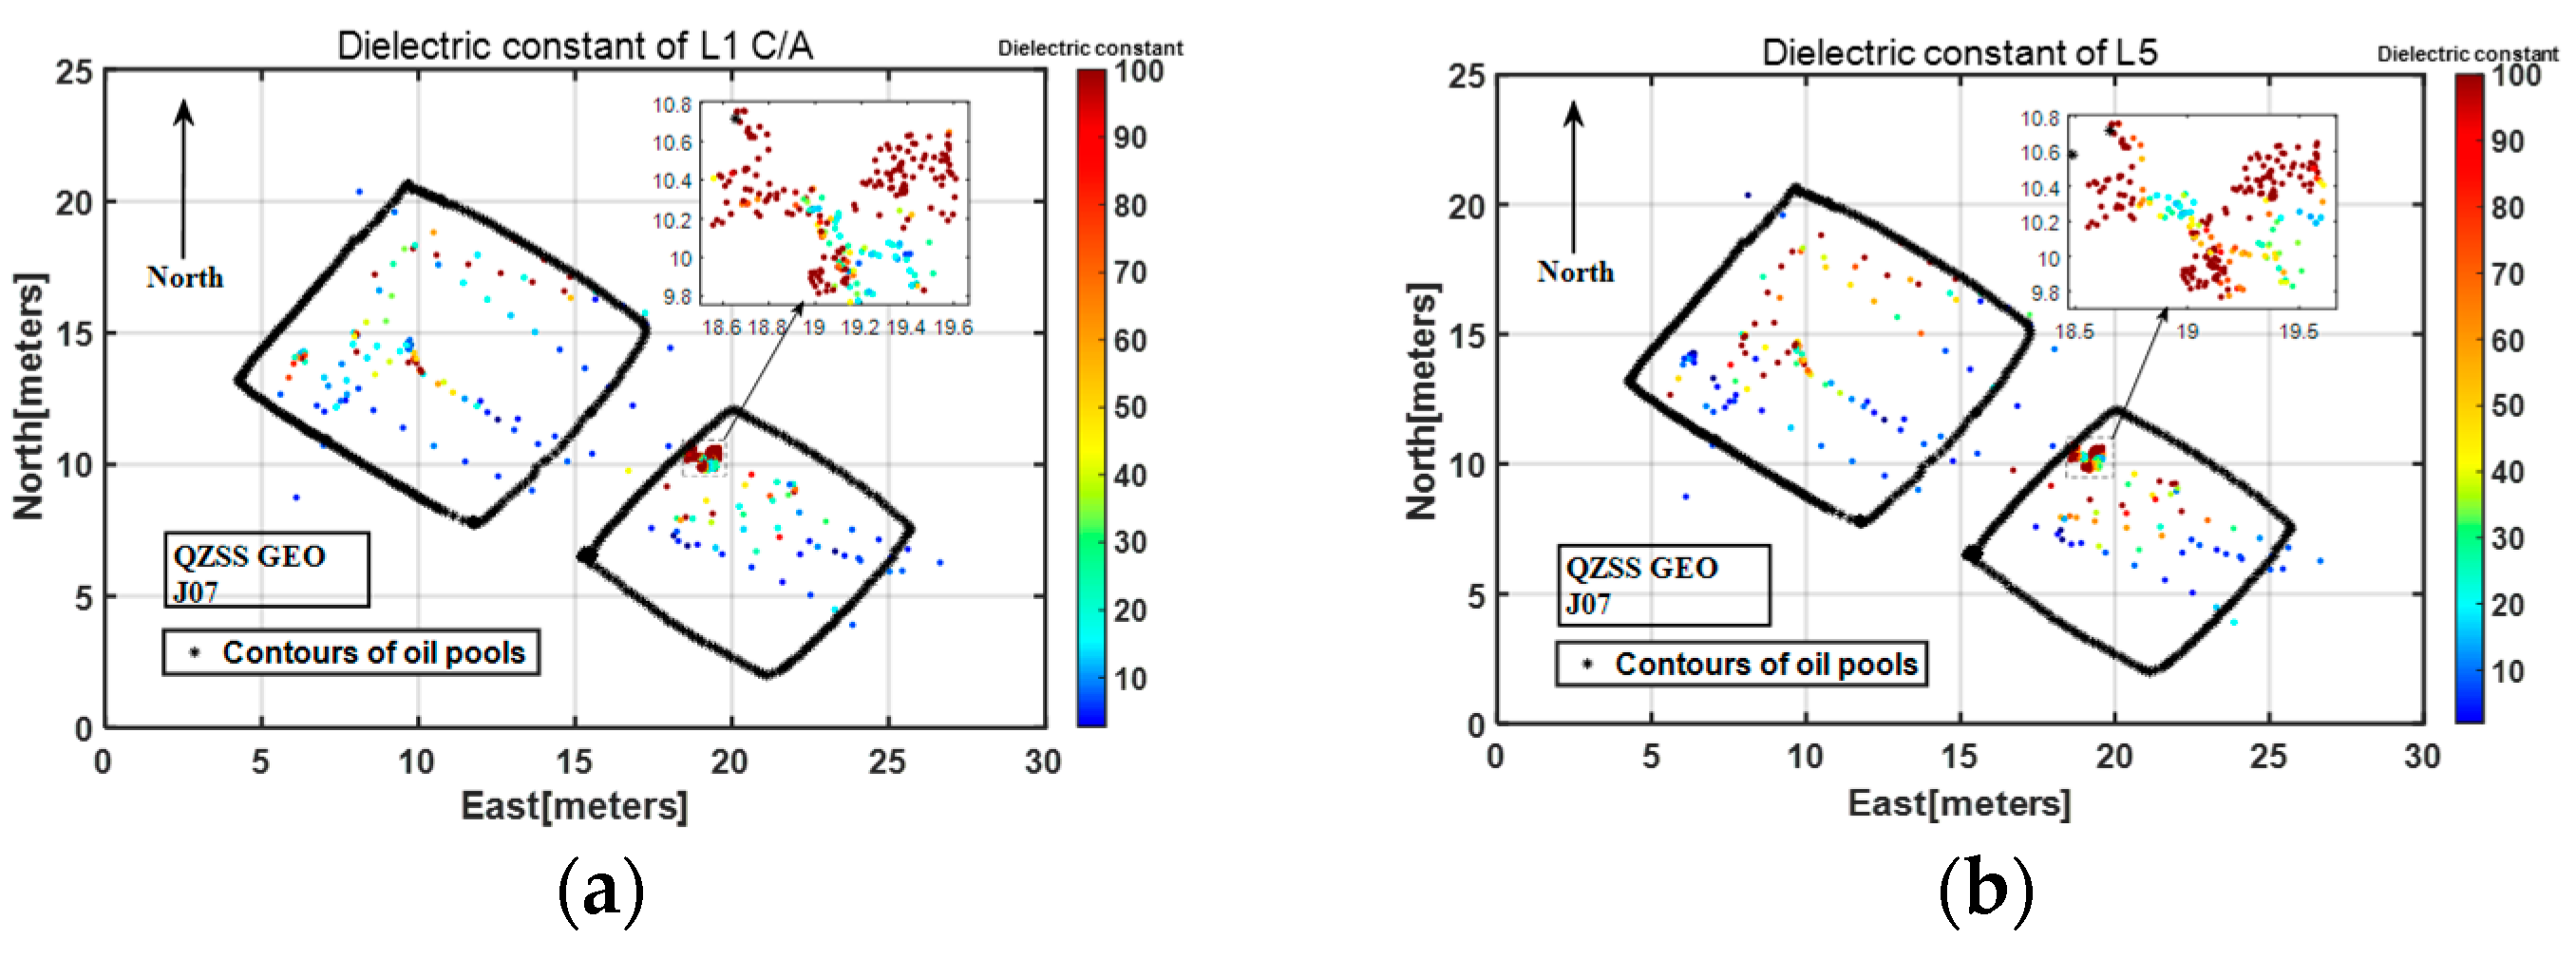
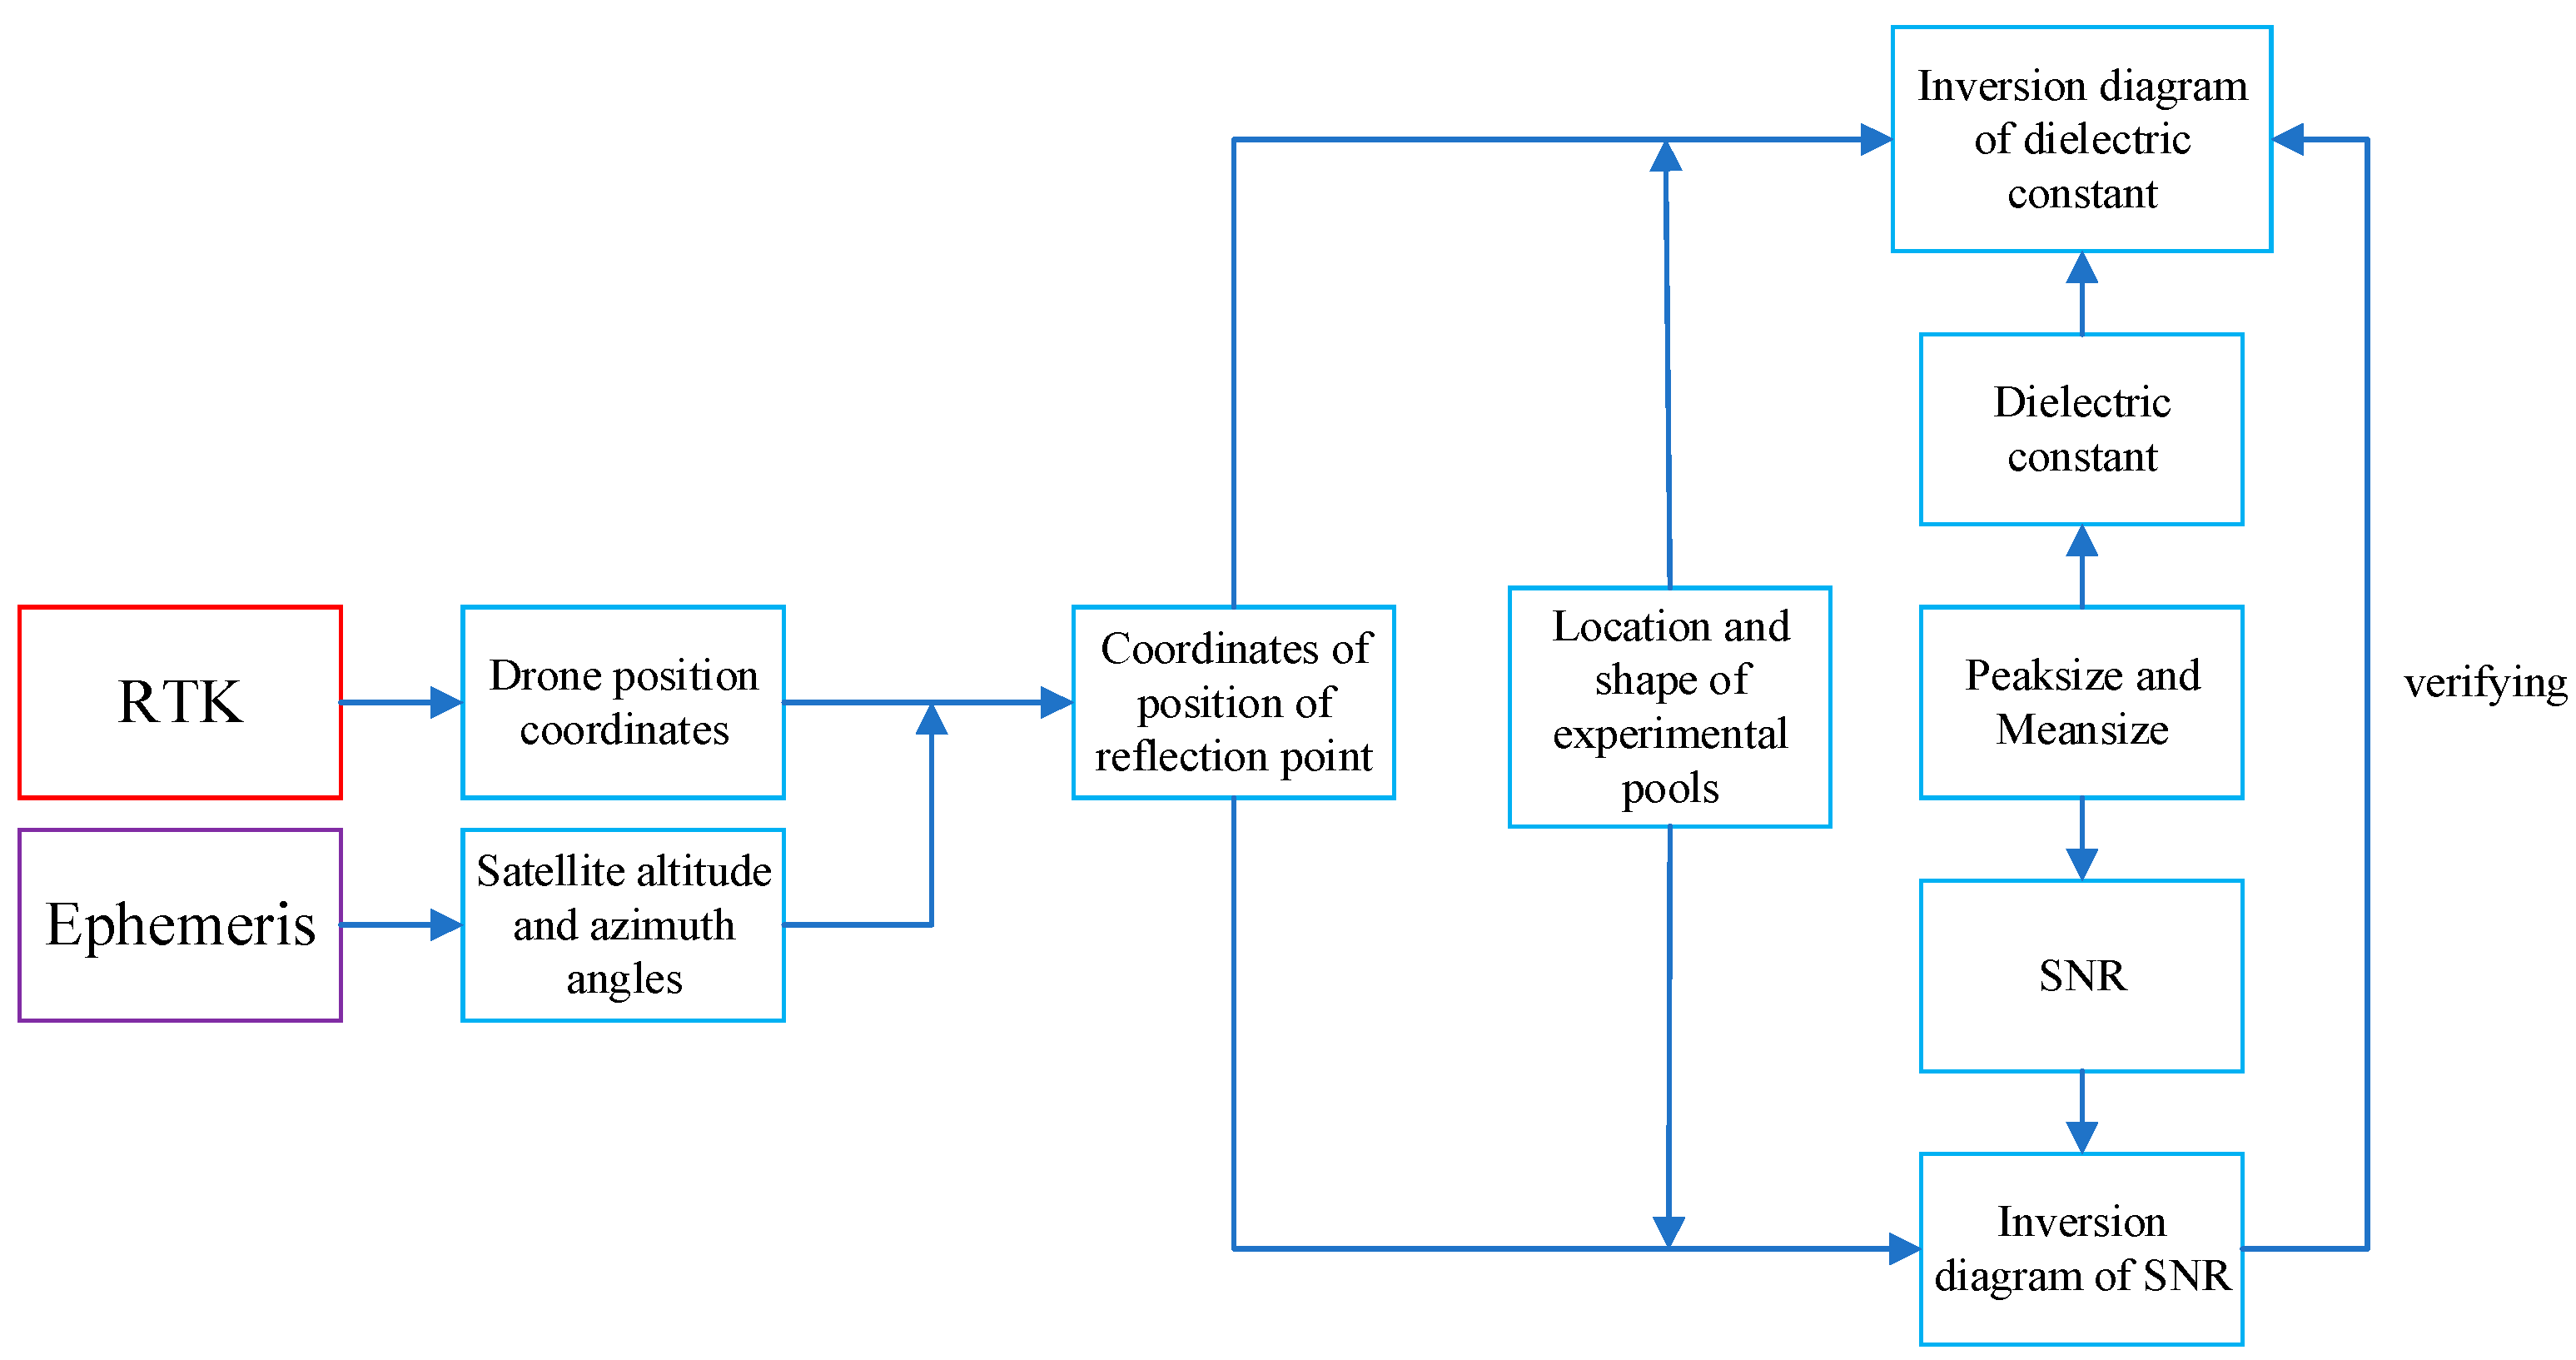
Figure 6.
Inversion diagram of the dielectric constant of (a) the L1 C/A signal and (b) the L5 signal.
Figure 6.
Inversion diagram of the dielectric constant of (a) the L1 C/A signal and (b) the L5 signal.
The marked difference between oil and water is evident in Figure 6. The blue color represents oil with a low dielectric constant, whereas the red color represents water with a high dielectric constant. The center shows an oil–water mixture. This distribution mainly reflects the fact that the drone was positioned to the north of pool 2, and the downdraft caused the lighter oil to become dispersed mainly in the southern part of pool 2.
3.5. Inversion Diagram of the SNR of the L1 C/A and L5 Signals
The inversion diagram of the SNR was constructed by combining the positional mapping of the reflection points and the corresponding SNR of each point. The positional mapping of the reflection points is shown in Figure 5. The SNR of each reflection point was calculated using Equation (3) and the results are shown in Figure 7.
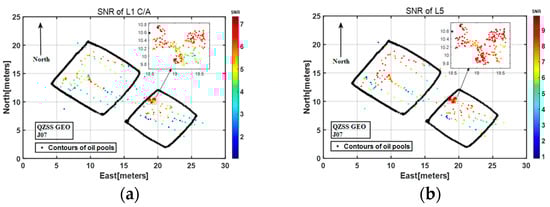
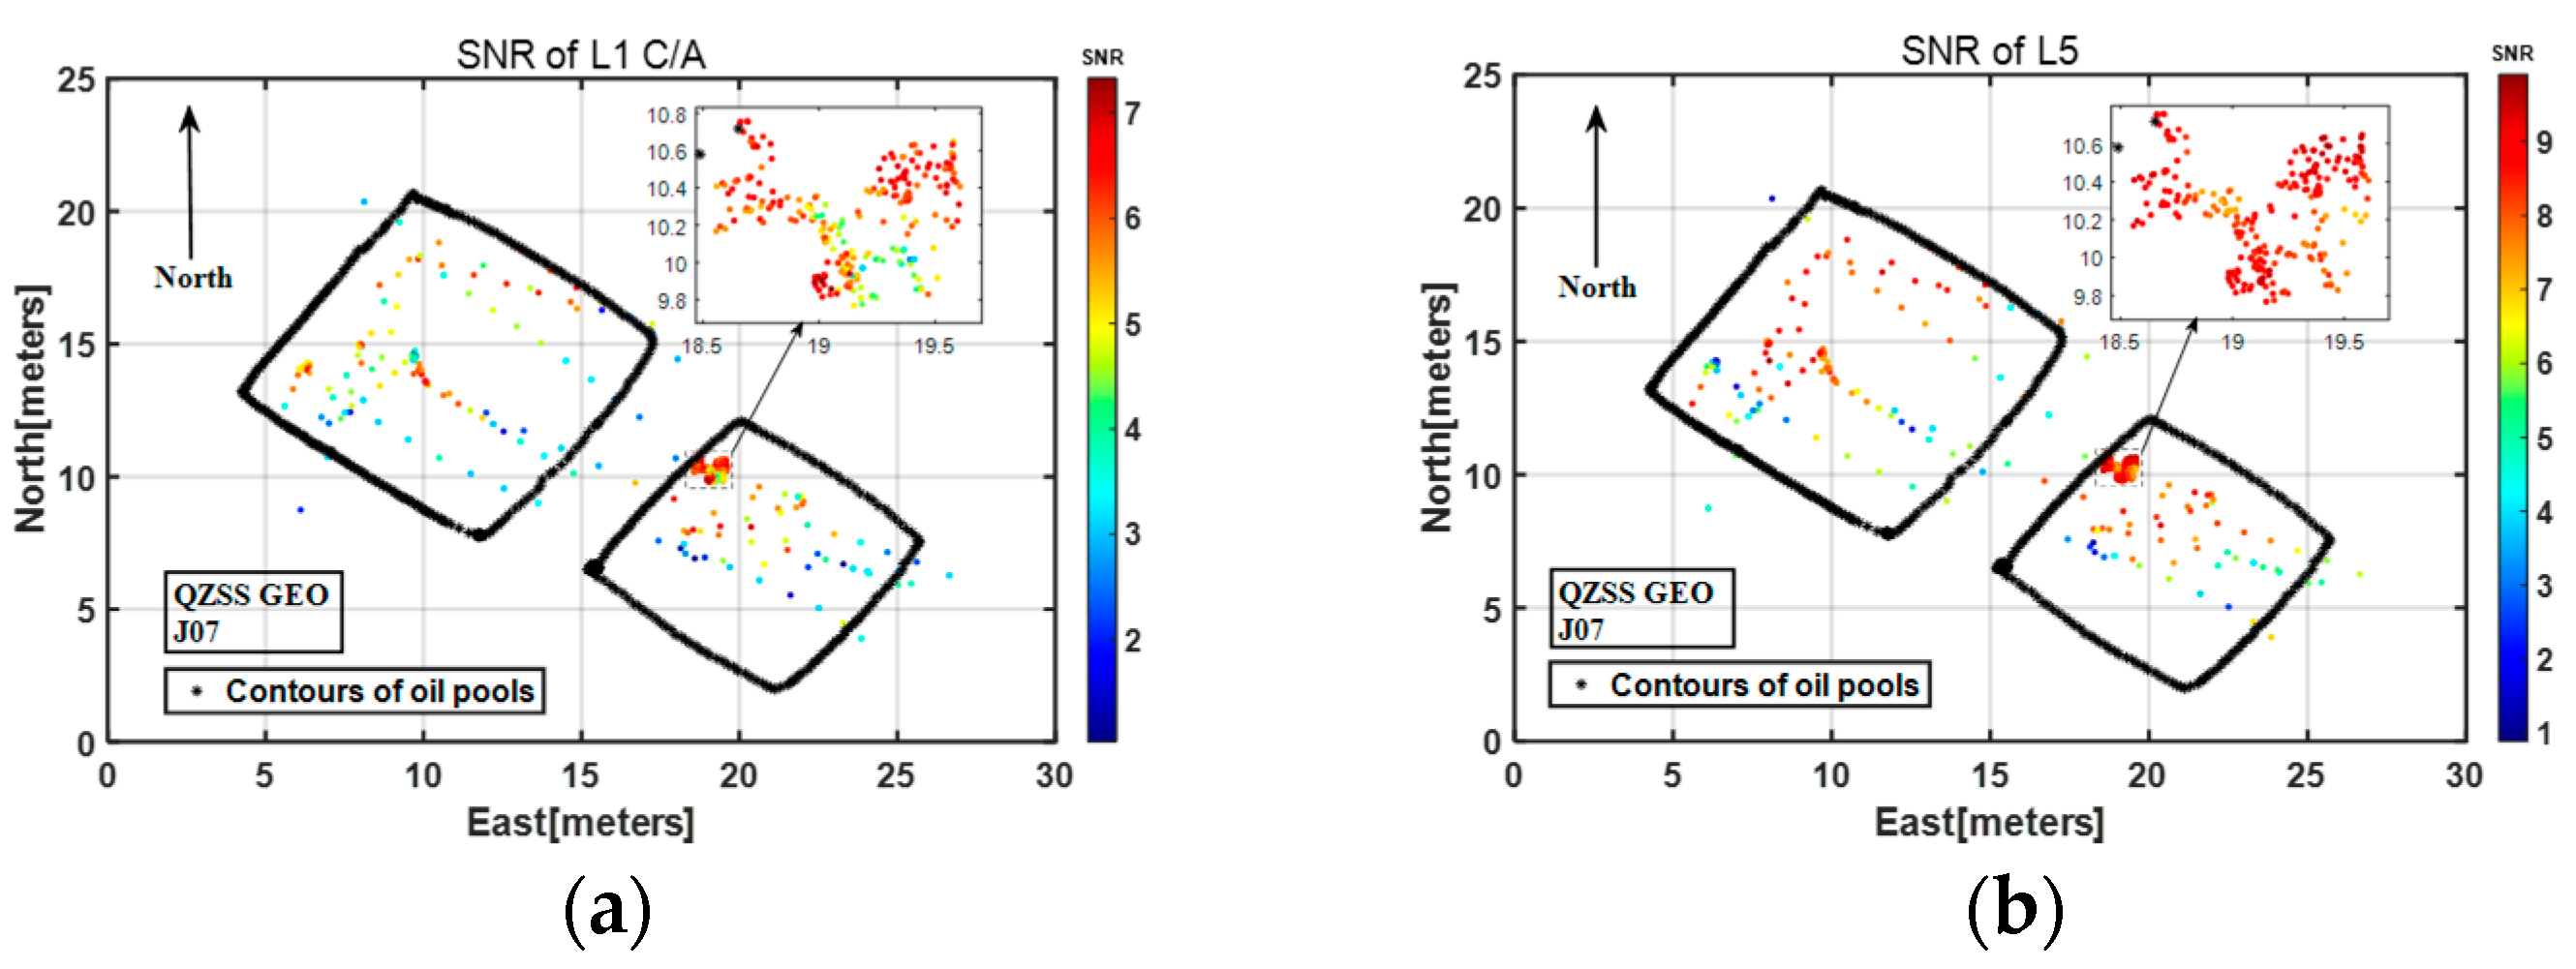
Figure 7.
Inversion diagram of the SNR of (a) the L1 C/A signal and (b) the L5 signal.
Figure 7.
Inversion diagram of the SNR of (a) the L1 C/A signal and (b) the L5 signal.
The marked difference between oil and water is evident in Figure 7. The blue color represents oil with a low SNR, whereas the red color represents water with a high SNR. The center shows an oil–water mixture. The inversion diagram of the SNR is consistent with that of the dielectric constant. It is also evident from Figure 7 that the inversion diagram of the L5 signal has a larger color difference and is more effective in distinguishing oil and water. In addition, the SNR of the L5 signal is higher than that of the L1 C/A signal. The reason is that the dielectric constant of the L1 C/A signal is different to that of the L5 signal, which can affect the SNR of the signals.
It is evident from Figure 6 and Figure 7 that there were several points in both experimental pools where the dielectric constant and the SNR were consistent with those of the oil. The middle part of both pools was made of fine gravel, the dielectric constant of which is in the range of 4~12, i.e., similar to that of oil.
3.6. Relationship between the Dielectric Constant or the SNR and the Height of the Drone for the L1 C/A and L5 Signals
In addition to resolving the dielectric constant and the SNR of the two signals, we also studied the relationship between the dielectric constant or the SNR and the flight height of the drone. We selected three surfaces (i.e., area of oil, area of water, and area of mixed oil and water) to research the correlation between the dielectric constant or the SNR and the flight height of the drone.
The correlation coefficient is a statistical measure that expresses the extent of the linear relation of two variables. The correlation coefficient used most widely is the Pearson correlation coefficient, which is defined as follows:
where R is the Pearson correlation coefficient; and are individual sample points for variable i and j, respectively; and are the means of the two variables; and ∑ denotes the summation of the products of the deviations from the mean for each variable. The value of R ranges from −1 to 1, where −1 indicates a perfect negative linear relationship and 1 indicates a perfect positive linear relationship.
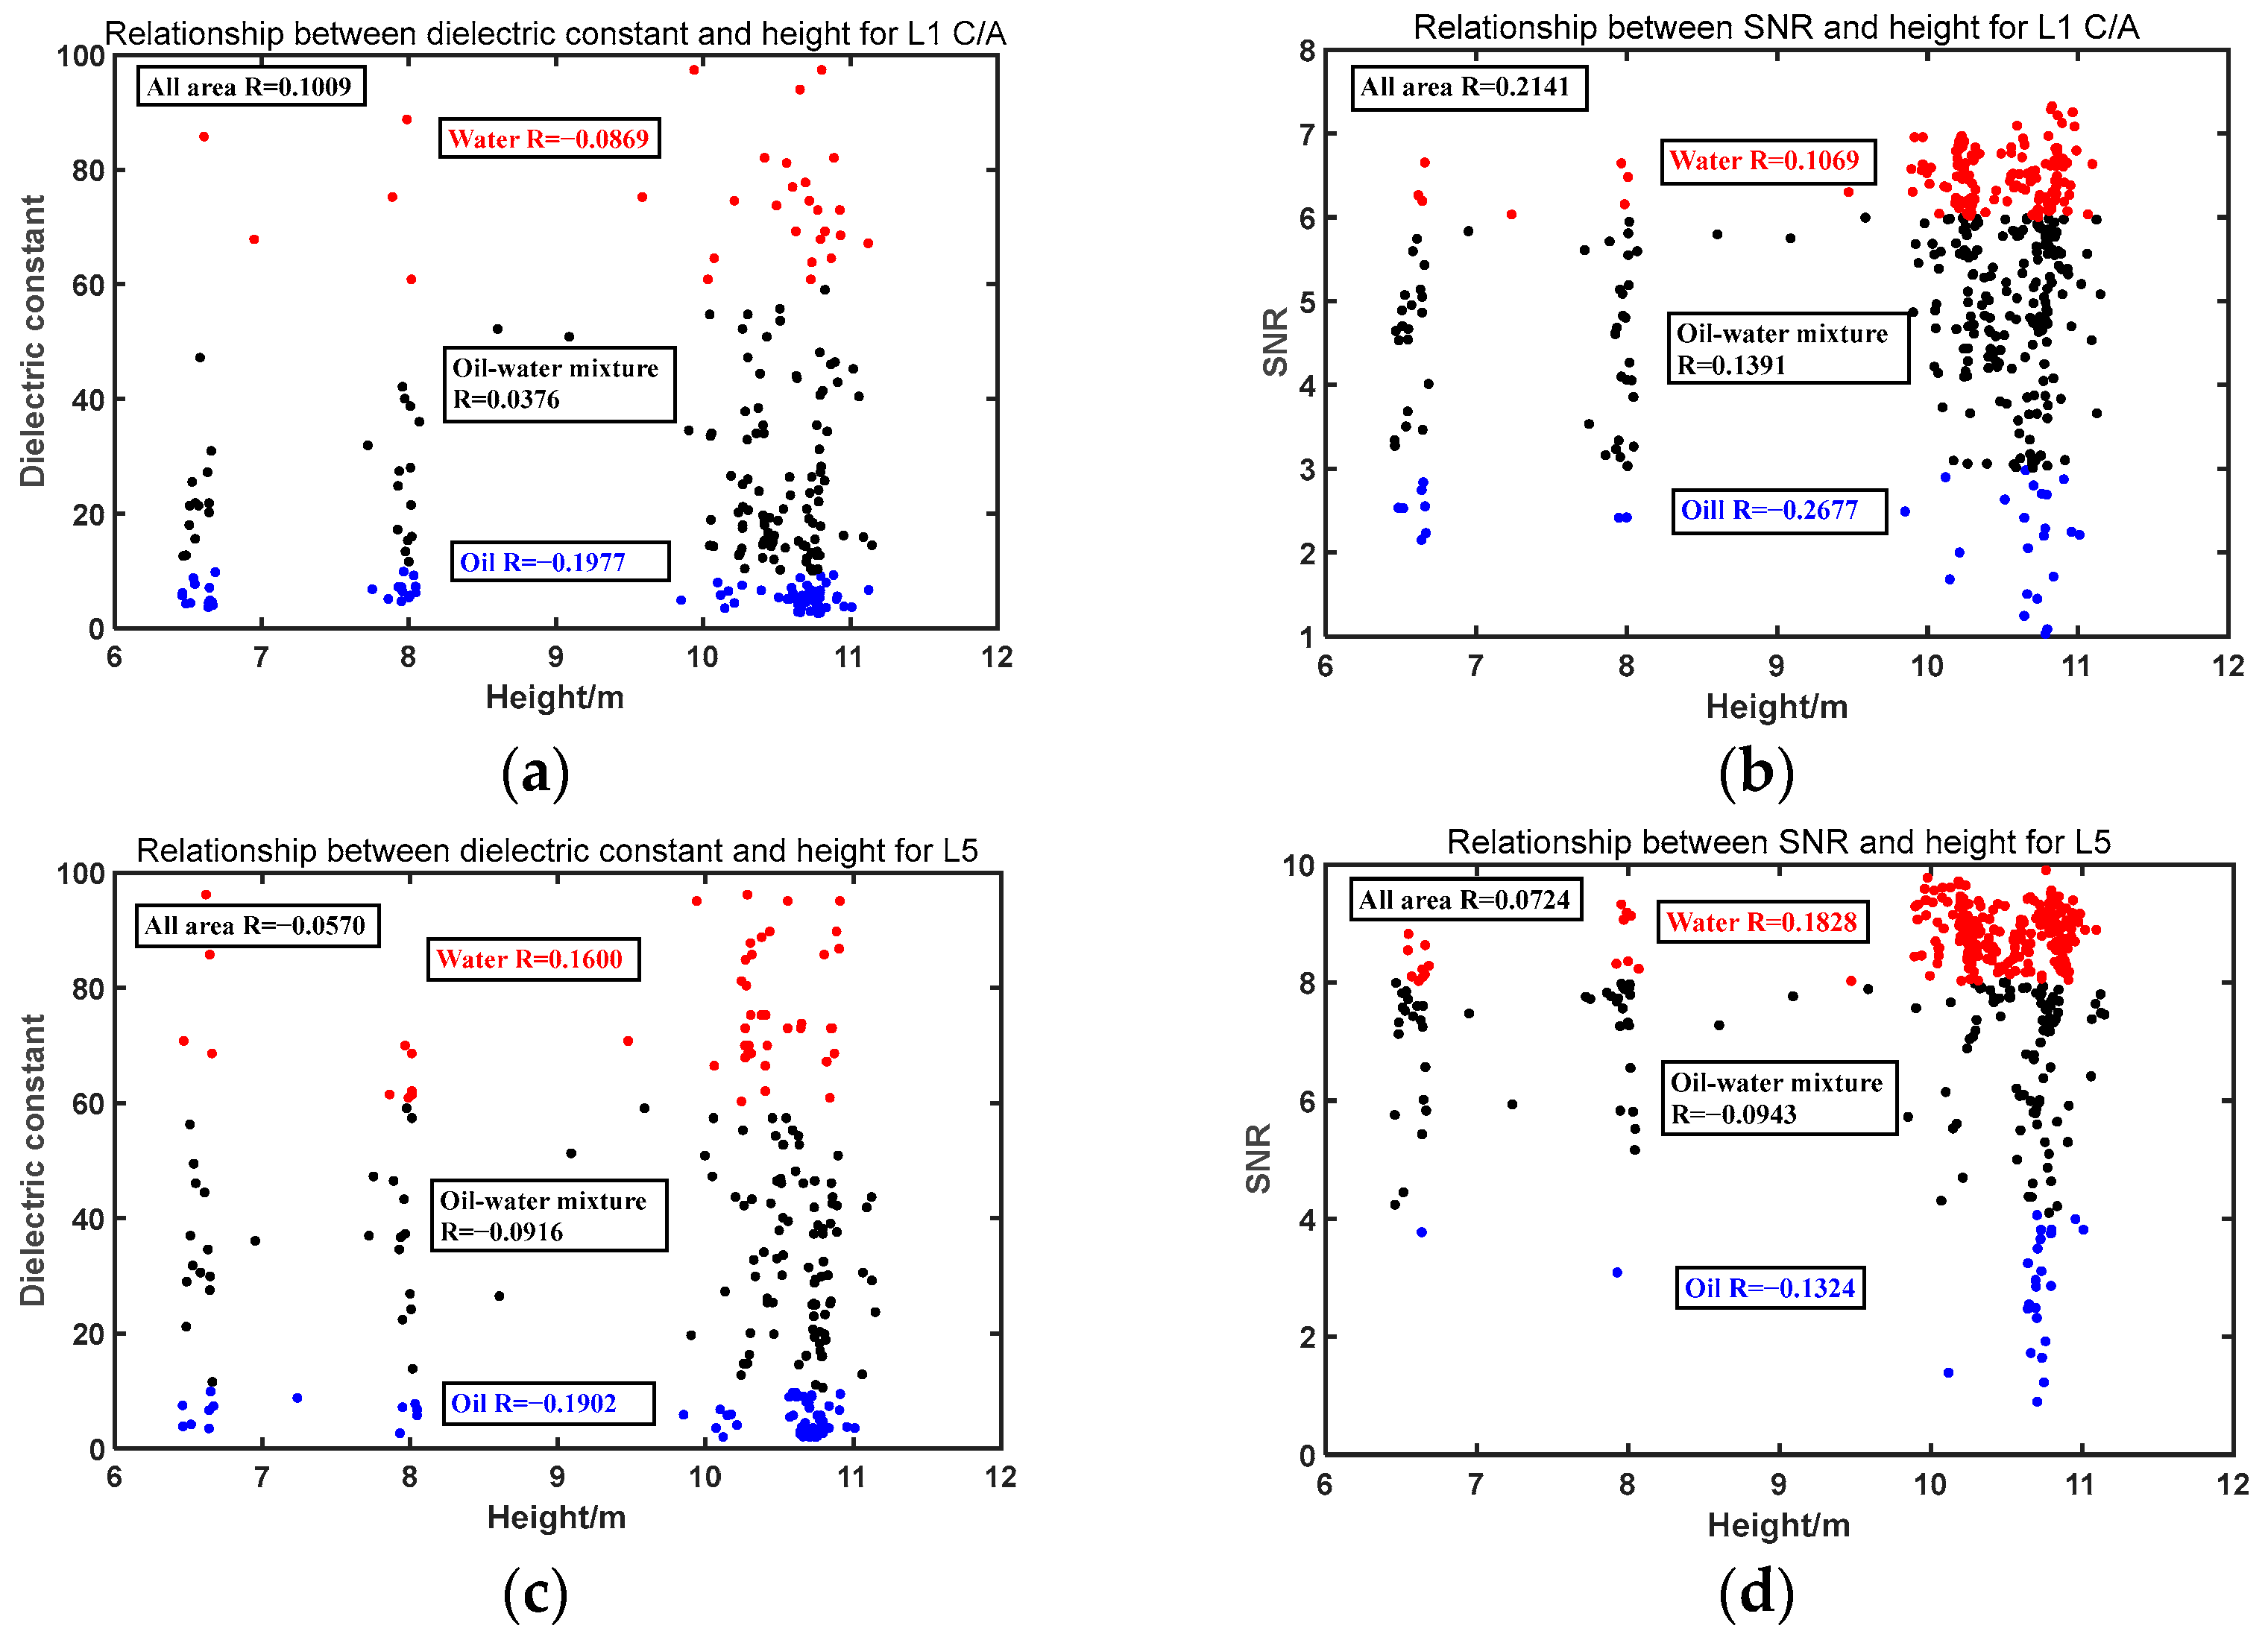
The R value shown in Figure 8 represents the correlation coefficient between the dielectric constant or the SNR and the flight height of the drone. Figure 6 and Figure 7 revealed that all the reflection points could be divided into three areas (i.e., water area, mixed oil–water area, and oil area) based on the inversion diagram of the dielectric constant and the SNR. In Figure 8, the red points represent the water area, the blue points represent the oil area, and the black points represent the mixed oil–water area. The correlation coefficients of each individual area and of the total area were calculated, which revealed that the dielectric constant and the SNR both have low correlation with the flight height of the drone (Figure 8), irrespective of whether the L1 C/A or the L5 signal was used. Hence, it can be inferred that the dielectric constant and the SNR are not directly related to the flight height of the drone.
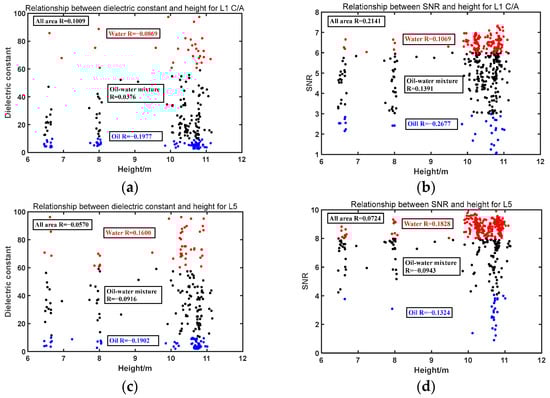
Figure 8.
(a) Relationship between the dielectric constant and the flight height of the drone for the L1 C/A signal, (b) relationship between the SNR and the flight height of the drone for the L1 C/A signal, (c) relationship between the dielectric constant and the flight height of the drone for the L5 signal, and (d) relationship between the SNR and the flight height of the drone for the L5 signal.
4. Discussion
First, the inversion diagram of the dielectric constant is broadly in accord with the inversion diagram of the SNR. Second, the inversion diagram of the dielectric constant is more accurate than that of the SNR because it has a larger range of colors that can contain more detailed information, as is evident in Figure 6 and Figure 7.
There are many factors that could have affected the results of our experiment. First, the existence of the multipath effect causes the peak size of the DDM of the reflected signal in some areas to be larger than that of the direct signal when resolving the dielectric constant. This causes the reflectance of these areas to be >1 and to have no corresponding dielectric constant value. To resolve this problem, the linear fitting method was used. Because the reflectance of oil and water is continuous in adjacent areas, the average value of the dielectric constant on two adjacent sides was used as a replacement for the vacant value. Second, the experiment was conducted using a drone with very low flight height, and the downdraft from the drone dispersed the oil on the surface of the experimental pools. In the future, similar experiments should be conducted using a drone flying at higher altitude, which would have smaller impact on the oil surface. In an actual situation, a drone would not be very close to the sea surface. In this study, it was considered beneficial to examine the performance of our algorithm for oil spill detection in a relatively hostile environment. Finally, the oil film on the experimental pools was thin, whereas an oil layer dispersed on the sea surface in the region of an oil spill would be thicker. The reason is that the violent movement of seawater causes mixing of the oil and water, forming small oil droplets that stack and thicken. In future experiments, the thickness of the oil film will be further increased to simulate a real oil spill on the sea surface.
The dual-frequency satellite reflected signal technology can distinguish well oil and water, but it currently cannot distinguish different oil types. In future experiments, we plan to expand the distribution of our experimental sites to enable accurate detection of the boundary lines within the experimental pool. The method of oil spill detection using GNSS-R could be further optimized, e.g., with continued development of hardware and algorithms, the accuracy and the resolution of oil spill detection are both expected to improve. If this technology were popularized and applied, it could play an important role in offshore oil exploitation and marine environmental protection. Moreover, the entire process could be integrated into a hardware–software system that could realize timely detection of oil spills.
5. Conclusions
In this study, we developed a new method for the detection of marine oil spills. We conducted experiments using two signals (i.e., L1 C/A and L5) to validate the new method, and to investigate the potential of applying Quasi-Zenith Satellite System-Reflectometry (QZSS-R) for oil spill detection using a drone. The principal conclusions derived are as follows:
- Differentiation between oil and water surfaces can be achieved. Thus, the proposed approach that includes a new equation and an appropriate inversion method is feasible. Through Equation (1), the dielectric constant and the reflectance correspondence table can be obtained. The inversion diagram of the dielectric constant and the SNR makes it easy to distinguish oil and water. In Figure 6 and Figure 7, the red area represents the water surface, the blue area represents the oil surface, and the remaining area represents the mixed oil–water surface.
- By comparing and analyzing the effects of the inversion diagram of the two signals, it was found that the inversion diagram of the L5 signal has better contrast than that of the L1 C/A signal. The reason is that the L5 signal has a shorter chip length than the L1 C/A signal. In addition, the higher transmitting power and the bandwidth of the L5 signal provide it with greater immunity to interference. Hence, the L5 signal has a higher SNR than that of the L1 C/A signal, as evidenced from the color bar in Figure 7.
- Equation (1), which was used in our work, has a larger range of application than Equation (2), which was used in [15] for reflectance when they had the same dielectric constant. The reason is that the derivation conditions for Equations (1) and (2) are different. The former applies to smooth ideal surfaces, whereas the latter applies only to rough surfaces such as soil.
- The signals reflected from the oil surface had a lower SNR than those reflected from the water surface. The reason is that the dielectric constant of oil is lower than that of water.
- Irrespective of whether the reflecting surfacer was an area of water, oil, or oil–water mixture, the dielectric constant and the SNR had low correlation to the drone flight height, as shown in Figure 8.
Author Contributions
Conceptualization, R.L., F.G. and S.G.; Methodology, R.L.; Software, F.G.; Validation, X.L., H.S. and Y.K.; Formal Analysis, R.L.; Investigation, R.L. and F.G.; Resources, C.Y., W.B. and C.J.; Data curation, F.G. and Z.Z.; Writing—Original Draft Preparation, R.L.; Writing—Review and Editing, R.L. and F.G.; Visualization, R.L.; Supervision, F.G.; Project Administration, F.G.; Funding Acquisition, F.G., D.S. and B.W. All authors have read and agreed to the published version of the manuscript.
Funding
This work was supported by the Key Program of the Joint Fund of the National Natural Science Foundation of China and Shandong Province under Grant U22A20586, the Key Research and Development Program of Shandong Province (Major Technological Innovation Project) under Grant 2021ZDSYS01, and the Program of the National Natural Science Foundation of China, grant number 41604003, 41704017, 42101409.
Data Availability Statement
The datasets analyzed in this study are managed by the School of Space Science and Physics, Shandong University, and can be made available by the corresponding author on request.
Acknowledgments
The authors thank the satellite navigation and remote sensing research group of the Institute of Space Science of Shandong University for its site and technical support. The authors thank the professors of China University of Petroleum and National Space Science Center who kindly provided help during the experiment.
Conflicts of Interest
The authors declare no conflicts of interest.
References
- Fiscella, B.; Giancaspro, A.; Nirchio, F.; Pavese, P. Oil spill detection using marine SAR images. Int. J. Remote Sens. 2000, 21, 3561–3566. [Google Scholar] [CrossRef]
- Liu, S.; Chi, M.; Zou, Y.; Samat, A.; Benediktsson, J.A.; Plaza, A. Oil Spill Detection via Multitemporal Optical Remote Sensing Images: A Change Detection Perspective. IEEE Geosci. Remote Sens. Lett. 2017, 14, 324–328. [Google Scholar] [CrossRef]
- Martin-Neira, M. A Passive Reflectometry and Interferometry System (PARIS): Application to ocean altimetry. ESA J. 1993, 17, 331–355. [Google Scholar]
- Di Simone, A.; Iodice, A.; Riccio, D.; Camps, A.; Park, H. GNSS-R: A useful tool for sea target detection in near real-time. In Proceedings of the 2017 IEEE 3rd International Forum on Research and Technologies for Society and Industry (RTSI), Modena, Italy, 11–13 September 2017; pp. 1–6. [Google Scholar] [CrossRef]
- Gonga, A.; Pérez-Portero, A.; Camps, A.; Pascual, D.; de Fockert, A.; de Maagt, P. GNSS-R Observations of Marine Plastic Litter in a Water Flume: An Experimental Study. Remote Sens. 2023, 15, 637. [Google Scholar] [CrossRef]
- Perez-Portero, A.; Munoz-Martin, J.F.; Park, H.; Camps, A. Airborne GNSS-R: A Key Enabling Technology for Environmental Monitoring. IEEE J. Sel. Top. Appl. Earth Obs. Remote Sens. 2021, 14, 6652–6661. [Google Scholar] [CrossRef]
- Ban, W.; Zhang, K.; Yu, K.; Zheng, N.; Chen, S. Detection of Red Tide Over Sea Surface Using GNSS-R Spaceborne Observations. IEEE Trans. Geosci. Remote Sens. 2022, 60, 5802911. [Google Scholar] [CrossRef]
- Valencia, E.; Camps, A.; Park, H.; Rodriguez-Alvarez, N.; Bosch-Lluis, X.; Ramos-Perez, I. Oil slicks detection using GNSS-R. In Proceedings of the 2011 IEEE International Geoscience and Remote Sensing Symposium, Vancouver, BC, Canada, 24–29 July 2011; pp. 4383–4386. [Google Scholar] [CrossRef]
- Valencia, E.; Camps, A.; Rodriguez-Alvarez, N.; Park, H.; Ramos-Perez, I. Using GNSS-R Imaging of the Ocean Surface for Oil Slick Detection. IEEE J. Sel. Top. Appl. Earth Obs. Remote Sens. 2013, 6, 217–223. [Google Scholar] [CrossRef]
- Li, C.; Huang, W. Sea surface oil slick detection from GNSS-R Delay-Doppler Maps using the spatial integration approach. In Proceedings of the 2013 IEEE Radar Conference (RadarCon13), Ottawa, ON, Canada, 24–29 July 2011; pp. 1–6. [Google Scholar] [CrossRef]
- Li, C.; Huang, W.; Gleason, S. Dual Antenna Space-Based GNSS-R Ocean Surface Mapping: Oil Slick and Tropical Cyclone Sensing. IEEE J. Sel. Top. Appl. Earth Obs. Remote Sens. 2015, 8, 425–435. [Google Scholar] [CrossRef]
- Li, C.; Huang, W. Simulating gnss-r delay-doppler map of oil slicked sea surfaces under general scenarios. Prog. Electromagn. Res. B 2013, 48, 61–76. [Google Scholar] [CrossRef]
- Zhang, Y.; Chen, S.; Hong, Z.; Han, Y.; Li, B.; Yang, S.; Wang, J. Feasibility of Oil Slick Detection Using BeiDou-R Coastal Simulation. Math. Probl. Eng. 2017, 2017, 1–8. [Google Scholar] [CrossRef]
- Camps, A.; Park, H. Sensitivity of Delay Doppler Map in Spaceborne GNSS-R to Geophysical Variables of the Ocean. IEEE J. Sel. Top. Appl. Earth Obs. Remote Sens. 2022, 15, 8624–8631. [Google Scholar] [CrossRef]
- Wu, J.; Zhang, B.; Hong, X.; Yang, D.; Han, M. Sea surface oil spill detection method using BeiDou satellite reflected signal and its experiment. J. Beijing Univ. Aeronaut. Astronaut. 2017, 43, 193–199. (In Chinese) [Google Scholar] [CrossRef]
- Jia, Y.; Jin, S.; Savi, P.; Gao, Y.; Tang, J.; Chen, Y.; Li, W. GNSS-R Soil Moisture Retrieval Based on a XGboost Machine Learning Aided Method: Performance and Validation. Remote Sens. 2019, 11, 1655. [Google Scholar] [CrossRef]
- Wang, N.; Chen, S.; Hong, Z.; Han, Y.; Li, B.; Yang, S.; Wang, J. Soil Moisture Estimation Based on GNSS-R Using L5 Signals From a Quasi-Zenith Satellite System. IEEE Geosci. Remote Sens. Lett. 2022, 19, 2505005. [Google Scholar] [CrossRef]
- Li, X.X.; Huang, J.X.; Li, X.; Shen, Z.; Han, J.; Li, L.; Wang, B. Review of PPP–RTK: Achievements, challenges, and opportunities. Satell. Navig. 2022, 3, 28. [Google Scholar] [CrossRef]

Disclaimer/Publisher’s Note: The statements, opinions and data contained in all publications are solely those of the individual author(s) and contributor(s) and not of MDPI and/or the editor(s). MDPI and/or the editor(s) disclaim responsibility for any injury to people or property resulting from any ideas, methods, instructions or products referred to in the content. |
© 2024 by the authors. Licensee MDPI, Basel, Switzerland. This article is an open access article distributed under the terms and conditions of the Creative Commons Attribution (CC BY) license (https://creativecommons.org/licenses/by/4.0/).