Article

Implementing Digital Multispectral 3D Scanning Technology for Rapid Assessment of Hemp (Cannabis sativa L.) Weed Competitive Traits

1
Plant and Environmental Sciences Department, Coastal Research and Education Center, Clemson University, Charleston, SC 29414-5329, USA
2
U.S. Vegetable Laboratory, United States Department of Agriculture-Agricultural Research Service, Charleston, SC 29414-5334, USA
3
School of Plant and Environmental Sciences, Virginia Tech, Blacksburg, VA 24060-0002, USA
4
New York State Agricultural Experiment Station, Cornell AgriTech, Geneva, NY 144546-1371, USA
5
Department of Plant Sciences, North Dakota State University, NDSU Department 7670, Fargo, ND 58108-6050, USA
6
Department of Plant Soils and Agricultural Systems, Southern Illinois University, Carbondale, IL 62901-6509, USA
*
Author to whom correspondence should be addressed.
Remote Sens. 2024, 16(13), 2375; https://doi.org/10.3390/rs16132375
Submission received: 16 April 2024 / Revised: 6 June 2024 / Accepted: 19 June 2024 / Published: 28 June 2024
(This article belongs to the Section Remote Sensing in Agriculture and Vegetation)

Abstract

:
The economic significance of hemp (Cannabis sativa L.) as a source of grain, fiber, and flower is rising steadily. However, due to the lack of registered herbicides effective in hemp cultivation, growers have limited weed management options. Plant height, biomass, and canopy architecture may affect crop–weed competition. Greenhouse experiments conducted at the joint Clemson University Coastal Research and Education Center and USDA-ARS research facility at Charleston, SC, USA used 27 hemp varieties, grown under controlled temperature and light conditions. Weekly plant scans using a digital multispectral phenotyping system, integrated with machine learning algorithms of the PlantEye F500 instrument, (Phenospex, Heerlen, Netherlands) captured high-resolution 3D models and spectral data of the plants. Manual and scanner-based measurements were validated and analyzed using statistical methods to assess plant growth and morphology. This study included validation tests showing a significant correlation (p < 0.001) between digital and manual measurements (R2 = 0.89 for biomass, R2 = 0.94 for height), indicating high precision. The use of 3D multispectral scanning significantly reduces the time-intensive nature of manual measurements, allowing for a more efficient assessment of morphological traits. These findings suggest that digital phenotyping can enhance integrated weed management strategies and improve hemp crop productivity by facilitating the selection of competitive hemp varieties.

Graphical Abstract

1. Introduction

Hemp (Cannabis sativa L.), an annual herb in the Cannabaceae family, is distinct from other plants that are also referred to as “hemp,” such as Musa textilis (Manila hemp, abaca), Agave sisalana (sisal hemp), Hibiscus cannabinus (kenaf), and Crotalaria juncea (sunn hemp), due to its unique botanical characteristics and applications [1,2]. Hemp is valued for its diverse uses, with more than 50,000 products derived from its stems, flowers, and seeds [3,4,5,6]. Historically, hemp was cultivated for the strength of its fiber, making it an excellent candidate for paper, rope, and canvas production. Hemp can also be manufactured into cloth, animal bedding, composite wood products, insulation, carpeting, plastics, stucco and mortar, and fiberglass alternatives in the aviation and automotive industries. Seeds can be processed into hemp oil and seed cake, which can be used in the production of animal feed, personal hygiene products, and technical goods like oil paints and printing inks. All the aforementioned uses are derived from one of three types of industrial hemp in production: fiber, grain, or flower. In practice, hemp is rarely grown exclusively as a grain crop; rather so-called “dual purpose” hemp varieties are used to produce fiber and flower/grain from a single crop/production system [5].
The demand for hemp derived products has created an economic opportunity for United States (US) growers. A recent congressional report estimated US hemp product sales at $700 million per annum [4], with a tremendous opportunity for growth predicted [6]. Cannabis criminalization under the 1970 Controlled Substances Act (CSA) prevented US farmers from legally growing the crop until 2018, when the Farm Bill formally declared industrial hemp distinct from marijuana [7]. The prior US prohibition against Cannabis, along with criminalizing the growing of the crop, also banned research on best agronomic practices in hemp, including the development of recommendations for the control of competing vegetation. Cannabis’ long legal history has resulted in a significant knowledge gap with respect to integrated weed management (IWM), hindering growers’ abilities to maximize crop yields.
Weeds are problematic in all types of hemp production, and weed control is needed to prevent crop failure, maximize yield potential, increase harvestability, and reduce habitat for other pests such as insects and pathogens [8,9,10]. Research on hemp in coastal South Carolina, USA indicated that failing to control weeds can significantly reduce flower bud yield. The study identified a critical weed-free period of 2 to 4 weeks following transplanting as crucial for maximizing hemp yield. [11]. Plant size and architecture of the crop canopy are important characteristics that influence the critical weed-free period (CWFP) [12]. Therefore, there is a need to evaluate hemp varieties exhibiting different types of growth with respect to size and branching habits, which can identify their ability to compete against weeds in multiple weed infestation scenarios.
The determination of which plant traits contribute to the weed-competitiveness of a crop is often not readily apparent; in most instances, it is likely that a combination of various attributes are involved. In general, crops that exhibit rapid development and that effectively reduce the quality and quantity of light within the crop canopy tend to possess a higher level of competitiveness [13,14]. Other characteristics that have been observed to influence the weed-competitive ability of crop plants include rapid germination and emergence, rapid accumulation of biomass, leaf area index, leaf angle, and light penetration [15,16].
Most traditional phenotyping technologies are labor intensive, subjective, time consuming and destructive to plants. Therefore, high-throughput plant phenotyping (HTPP) using a non-destructive image-based machine vision is progressing rapidly. Machine vision-based plant phenotyping can estimate single plant traits or crop canopy for thousands of plants in the field. Hence, adoption of HTPP is an efficient strategy to accelerate the understanding of crop plant traits relating to competitiveness. Specifically, HTPP enables testing of large numbers of plant morphological parameters in a timely and cost-efficient manner and generates knowledge that can guide subsequent field trials.
The purpose of this study was to comparatively assess the accuracy of determining morphological traits of selected hemp varieties with different growth habits by traditional methods and by digital phenotyping. The study aimed to provide a non-destructive, high-throughput method for measuring morphological traits that can inform integrated weed management strategies. This study utilized a digital multispectral phenotyping system equipped with PlantEyeF500 (PE) 3D scanner (Phenospex, Heerlen, Netherlands) to evaluate several phenotypic traits related to hemp plant growth. The associations between plant phenotypic characteristics collected by the PE scanner and manual measurements may provide a simple selection criterion for more competitive hemp varieties. The PE platform used in this research serves as a contemporary phenotyping sensor. However, its appropriateness for specific crop species and experimental circumstances needs to be thoroughly examined. This study was designed to rigorously assess the initial growth responses of a diverse set of hemp varieties, with the overarching goal of screening a broader population for potential weed competitiveness. The critical weed-free period, a pivotal early stage in crop development when the absence of weeds is essential for optimal growth, was a focal point of our investigation. The experiment aimed to be concluded before surpassing this crucial phase, ensuring that the findings would provide valuable insights into the selection of hemp varieties best equipped to maintain weed-free conditions during this vital period. This knowledge can serve as a basis for the development of tailored strategies for effective weed management in hemp cultivation.

2. Materials and Methods

2.1. Plant Material and Growth Conditions

Greenhouse experiments were conducted at the Clemson University Coastal Research and Education Center greenhouse in Charleston, South Carolina (32.7941593, −80.0677777, altitude 4.26 m). The seeds of 27 hemp varieties were sown in square pots with a volume of 1.76 L (Greenhouse Megastore, Danville, IL, USA) that were filled with potting mix (Metro-mix 830 natural and organic, Sungro, Bellevue, WA, USA). The greenhouse trial followed a randomized complete block design (RCBD) with three replicates of each variety, ensuring random placement to avoid variability in greenhouse conditions. Pots were watered once per day, while fertilizers with an N-P-K ratio of 10-10-10 applied every 2 weeks at a rate of approximately 8–10 g per plant during each application, ensuring consistent hydration and nutrient supply for optimal growth. The average maximum/minimum or day/night temperatures were set to 26/22 +/−2 °C in greenhouse. The experimental conditions included an 18-h photoperiod with LED light (400–500 nm) and 6 h of darkness. The experiments were conducted twice, with trial 1 initiated on 15 March 2022, and trial 2 initiated on 21 September 2022.

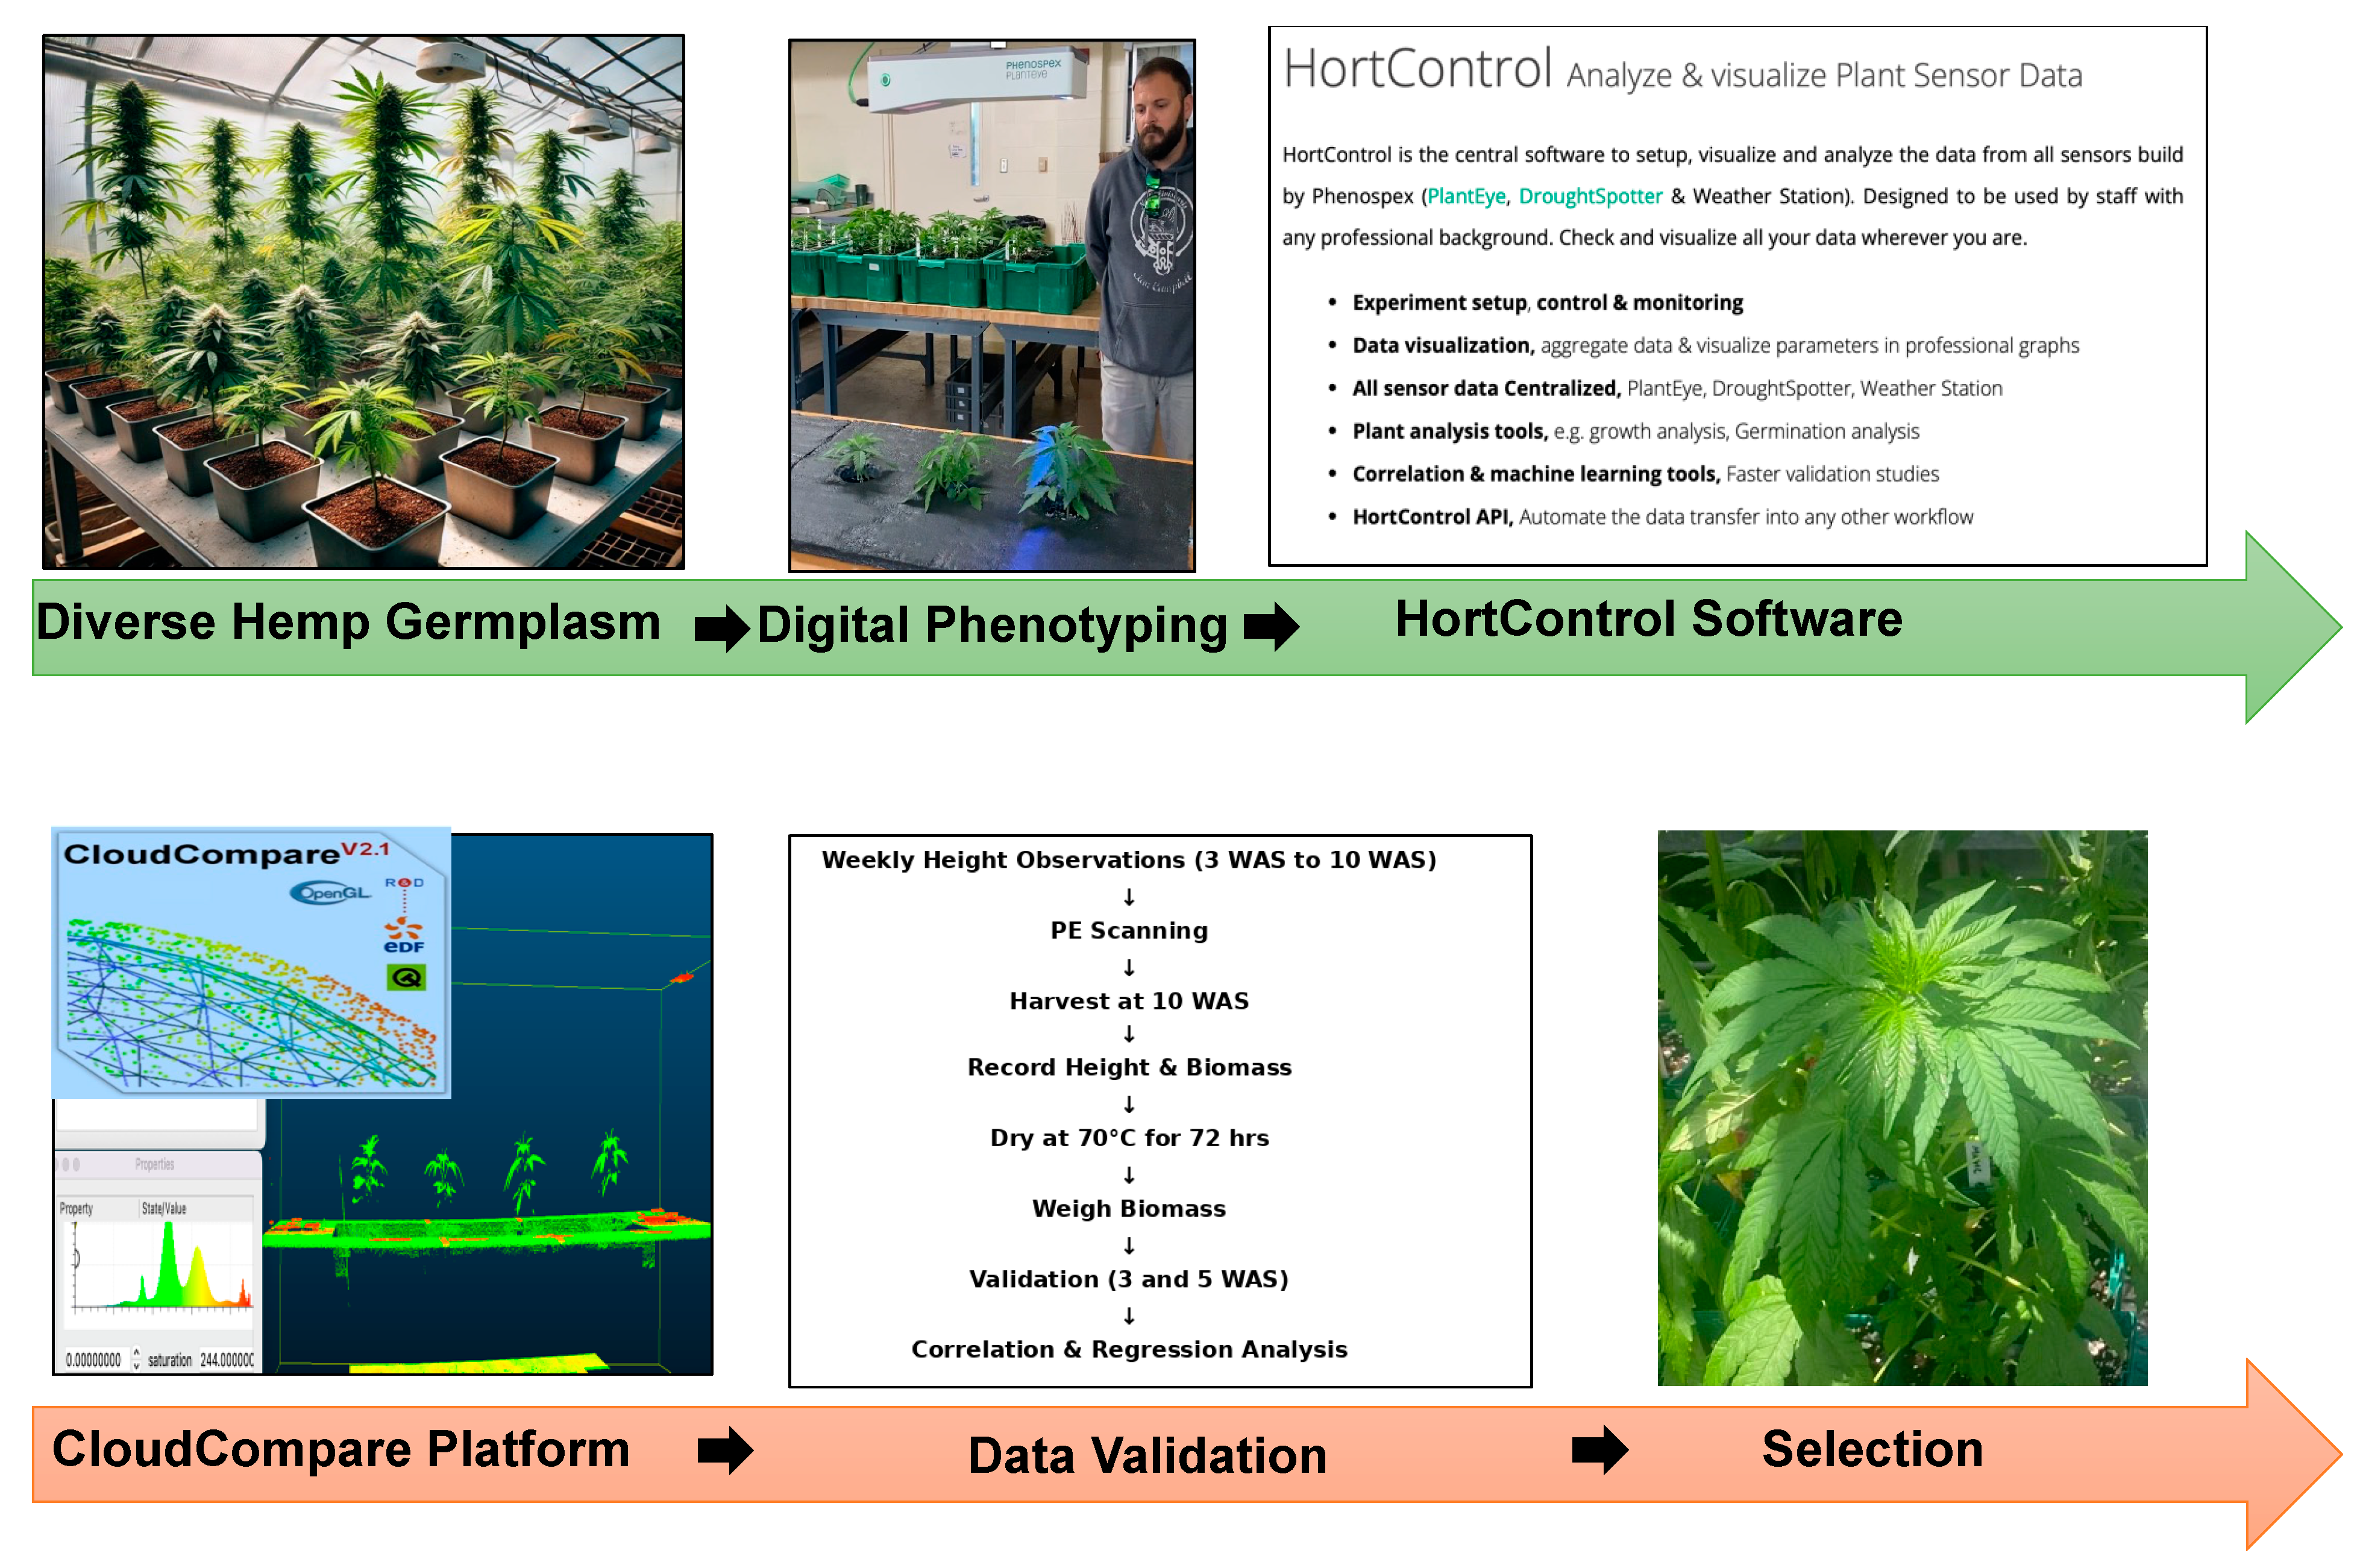
2.2. Experimental Setup and Hemp Plants Scanning

Twenty-seven hemp varieties, including floral, fiber, and dual-purpose types, were included in a greenhouse trial as outlined in Table 1. During the experiment, pots arranged on tables in fixed positions were randomly allocated to their initial positions once and remained stationary throughout the trial, except for scanning procedures. After scanning, pots were replaced to their original fixed positions, ensuring consistency in spatial arrangement across scans. Hemp plants were scanned using a digital multispectral phenotyping system equipped with one PE scanner at weekly intervals for six weeks beginning three weeks after planting and when plants were approximately 9 cm tall. Experimental apparatus was designed to place four plants for each entry randomly and subjected to PE scanning to measure morphological characteristics (Figure 1 and Figure 2). All plants were systematically placed at the center of the scanned surface during each scan. The PE scanner incorporated a 7-channel multispectral camera (between 400 and 900 nm). This novel hardware-based sensor fusion concept enables the conveyance of spectral information for every plant data point in the x-, y-, and z-axes with high resolution.
The PE scanner used in this study was pre-mounted on a mobile gantry, traveling along the y-axis. (Figure 1). Pots were placed on flat-top surfaces beneath the scanner mount, and the scanner was then moved along the y-axis over the plants (Figure 1). With the scan width adjusted to 65 cm, the scanner was mounted 100 cm above the pot’s rim. A 25 cm tall metal barcode distinguished the start and end of each scan. Barcodes could be positioned between each plant for discrete measurement or on either side of a group of containers for averaged results. Before the initial scan, each pot was labeled, placed on the tables, and scanned in the same position and orientation at each time point. The PE scanner captured a 3D model of each plant. This scanner, when moving along the bench with plants, repeatedly passes a laser beam in the direction perpendicular to the movement, captures the light scattered by the objects, and constructs a 3D model of the objects using triangulation. The plants were scanned weekly for six consecutive weeks between 3 and 10 weeks after seeding (WAS). However, data are presented in detail focusing on the 3 and 10 WAS; these specific intervals were chosen to align with essential growth phases, early vegetative development and the beginning of the reproductive stage, respectively.

2.3. Description of Remote Sensing Approach Using PlantEye

Data Collection: In this study, the PE sensor, mounted on a movable gantry system, was employed to scan hemp plants at weekly intervals. This setup enabled the capture of high-resolution spatial and spectral data across multiple spectral bands, including red (660 nm), green (550 nm), blue (450 nm), and near-infrared (800 nm). The high-resolution data collected by the PlantEye sensor facilitated detailed 3D reconstruction and spectral analysis of the plants, providing precise measurements of plant traits.
Data Preprocessing: To ensure the accuracy and reliability of the captured data, several preprocessing steps were undertaken. Adjustments were made for geometric and radiometric calibration to correct any spatial distortions and ensure accurate reflectance values. Noise reduction techniques, such as Gaussian and median filtering, were applied to remove environmental noise and enhance the quality of the captured data. Data normalization procedures were implemented to standardize the spectral data across different measurement sessions, ensuring consistency and comparability. Segmentation algorithms were used to differentiate plant material from the background, isolating the plant data for accurate trait analysis.
Data Analysis: Advanced algorithms and techniques were employed to analyze the preprocessed data, extracting meaningful insights into plant health and growth. Detailed 3D models of the plants were generated, enabling precise measurements of plant height, canopy structure, and leaf area. Spectral data was used to calculate vegetation indices such as the normalized difference vegetation index (NDVI) and green vegetation index (GVI), which are critical for assessing plant health and vigor. Time-series analysis tracked changes in plant traits over time, providing insights into growth patterns. Machine learning algorithms were used to develop predictive models for phenotypic traits. Regression models predicted plant height and biomass, while classification algorithms differentiated plant varieties.
Sensor Specifications: The PlantEye sensor has several key specifications that make it suitable for detailed remote sensing applications. The sensor provides millimeter-level precision for detailed 3D reconstruction of plant structures. It captures data in multiple spectral bands in the visible and near-infrared ranges, facilitating comprehensive spectral analysis. The sensor performs high-frequency scans, capturing dynamic changes in plant traits, and its wide field of view enables the capture of data from large areas or multiple plants simultaneously.

2.4. PE Data Collection, HortControl, and CloudCompare Software

The PE scanner, combined with HortControl (version 3.8) software measured plant height, 3D leaf area, projected leaf area, digital biomass, leaf inclination, leaf area index, light penetration depth, leaf coverage, greenness, and chlorophyll concentrations. Wavelength data combined with spectral indices, including normalized digital vegetation index (NDVI), enhanced vegetation index (EVI), and photochemical reflectance index (PRI), among others. HortControl software also generates 3D point cloud data in PLY (polygon file format) files, capturing plant structures.
CloudCompare (version 2.6.1) software allows for exploration, analysis, and visualization of PLY files, as well as providing additional details. This data allows researchers to analyze crop structure, health, and growth patterns, optimize resource allocation, assess plant traits, monitor environmental changes, and develop autonomous farming systems. CloudCompare was utilized as a tool to verify and analyze PE scanned plants retrospectively. By importing PE generated point cloud data in PLY format, CloudCompare facilitated comprehensive visualization, quality assessment, precise measurements, comparison with reference data, annotation, and seamless exportation of results. This enabled a thorough examination of plant morphology, validation of scanning accuracy, and meticulous documentation of observations. The workflow diagram for all the steps in sequence is provided in Figure 2.

2.5. Manual Observations, Destructive Harvesting, and Data Validation

Manual observations of plant height were conducted on a weekly basis, starting from 3 WAS until 10 WAS. These observations were conducted concurrently with PE scanning. At 10 WAS, all plants were harvested destructively, marking the end of the experiment. Aboveground height and biomass of plants were recorded. For aboveground biomass, plants were clipped, and oven dried in a general protocol oven (Heratherm, Thermo Scientific, Waltham, MA, USA) at 70 °C for 72 h and weighed.
Multiple validation experiments were conducted for morphological characteristics (biomass and plant height). For validation, the manually measured and PE scanner height data taken 3 and 5 WAS were utilized and presented in the paper. Validation used linear regression, with the y-axis being the manually measured heights and the x-axis being the PE scanner height from Equation (1). The linear regression analysis of PE scanner estimated plant height vs. manually measured plant height showed the following relationships:
y = 0.1908 + 0.0975x
where y is the plant height taken manually, and x is the PE scanner’s estimated plant height.

2.6. Statistical Analysis

Comparisons were made by correlation analysis between PE scanner and manually measured traits. The PE scanner derived and manually measured heights and biomass were used for correlation and linear regression analysis in JMP Pro 17.0 (SAS Institute Inc., Cary, NC, USA) to determine the relationship between derived height (y) with measured height (x). The PE height values from the 3 and 5 WAS were used for validation of the methods. The PE derived height and manually measured height for two time periods were subjected to the two-tailed t-test to test the null hypothesis that the difference between measured and derived height was zero. All data were examined for normal distribution with the Shapiro–Wilk and Anderson–Darling tests. Data were log-transformed when necessary to satisfy the assumptions of normality and variance. The transformed data were used for statistical interpretation, but the back-transformed data were presented. Data were pooled for both trials because there was no treatment by trial interaction. Individual treatment differences were examined using Fisher’s protected least significant difference (LSD) multiple comparisons test and GraphPad Prism v9.0 (GraphPad Software, La Jolla, CA, USA) was used for statistical analysis and graphical interpretation.

3. Results

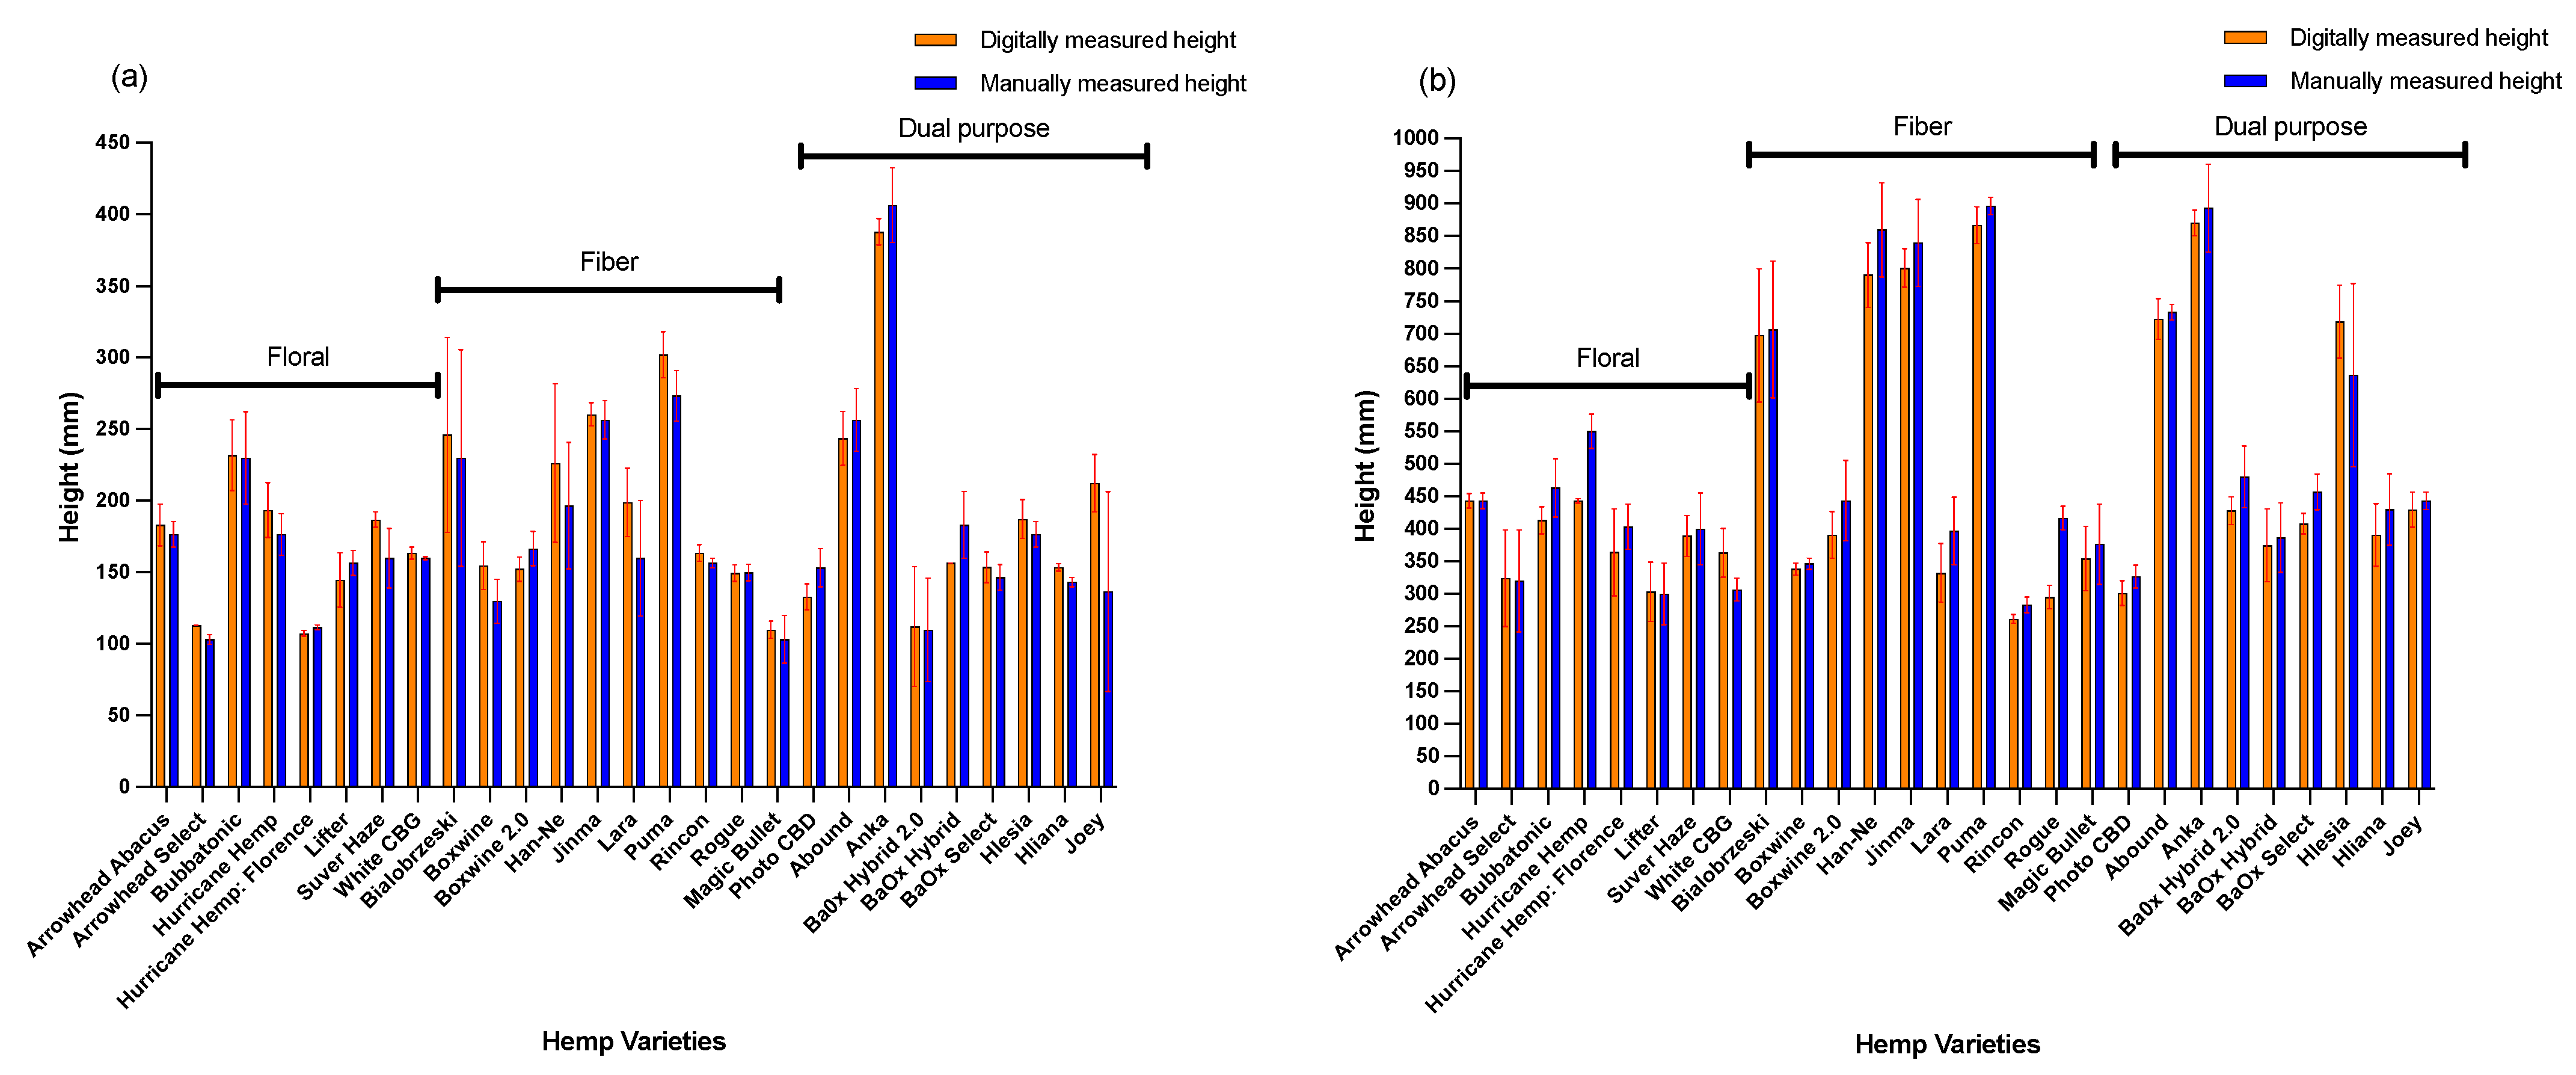
3.1. Digital Height Estimation

The PE scanner estimated the plant’s height from the top of the pot to the top of the plant. At 3 weeks after seeding (WAS), manually measured plant heights ranged from 10.0 to 40.0 cm, while the PE scanner estimated heights ranged from 9.6 to 35.8 cm (Figure 3). The average discrepancy between the PE estimated and manually measured heights was 0.26 cm. This slight difference was not statistically significant (p > 0.01) and could be attributed to the natural bending of the plant tip during scanning, which was held straight during manual measurements. The results of the two-tailed t-test confirmed no significant difference between the heights estimated by the PE scanner and the manually measured heights (n = 81, p = 0.731) (Figure 4). Overall, a highly significant positive correlation was observed between manually measured plant height and digitally PE scanner estimated height at 3 WAS and 10 WAS (Table 2 and Table 3).
At 3 weeks after seeding (WAS), among floral hemp varieties, Bubbatonic and Hurricane Hemp were the tallest, with average heights of approximately 232 mm and 193 mm, respectively. In contrast, Arrowhead Select and Hurricane Hemp: Florence were observed with shorter digital heights of 113 mm and 107 mm, respectively. In the fiber hemp type, Bialobrzeski, Jinma, and Puma displayed tallest digital heights with average of 246 mm, 260 mm, and 300 mm respectively, indicating their potential suitability for fiber production. Dual-purpose hemp varieties displayed a wide range of digital heights, approximately from 96 mm to 358 mm. Among dual-purpose hemp varieties, Anka demonstrated the tallest stature, with average digital height of approximately 358 mm, while Magic Bullet observed as the shortest variety with 96 mm height. Similar trends were followed when the data was taken at 10 WAS. Across all hemp types, visually represented in grouped graphs (Figure 3a,b), demonstrated a high degree of consistency between digital and manual height measurements. Fiber varieties tend to exhibit stronger growth in height over time compared to floral and dual-purpose types between the 3 WAS and 10 WAS. These findings underscore the substantial variability in hemp plant heights across different varieties and highlight the importance of selecting cultivars suited to specific agricultural objectives. Taller varieties may hold promise for fiber production, while shorter ones might find utility in floral yield or dual-purpose cultivation contexts.

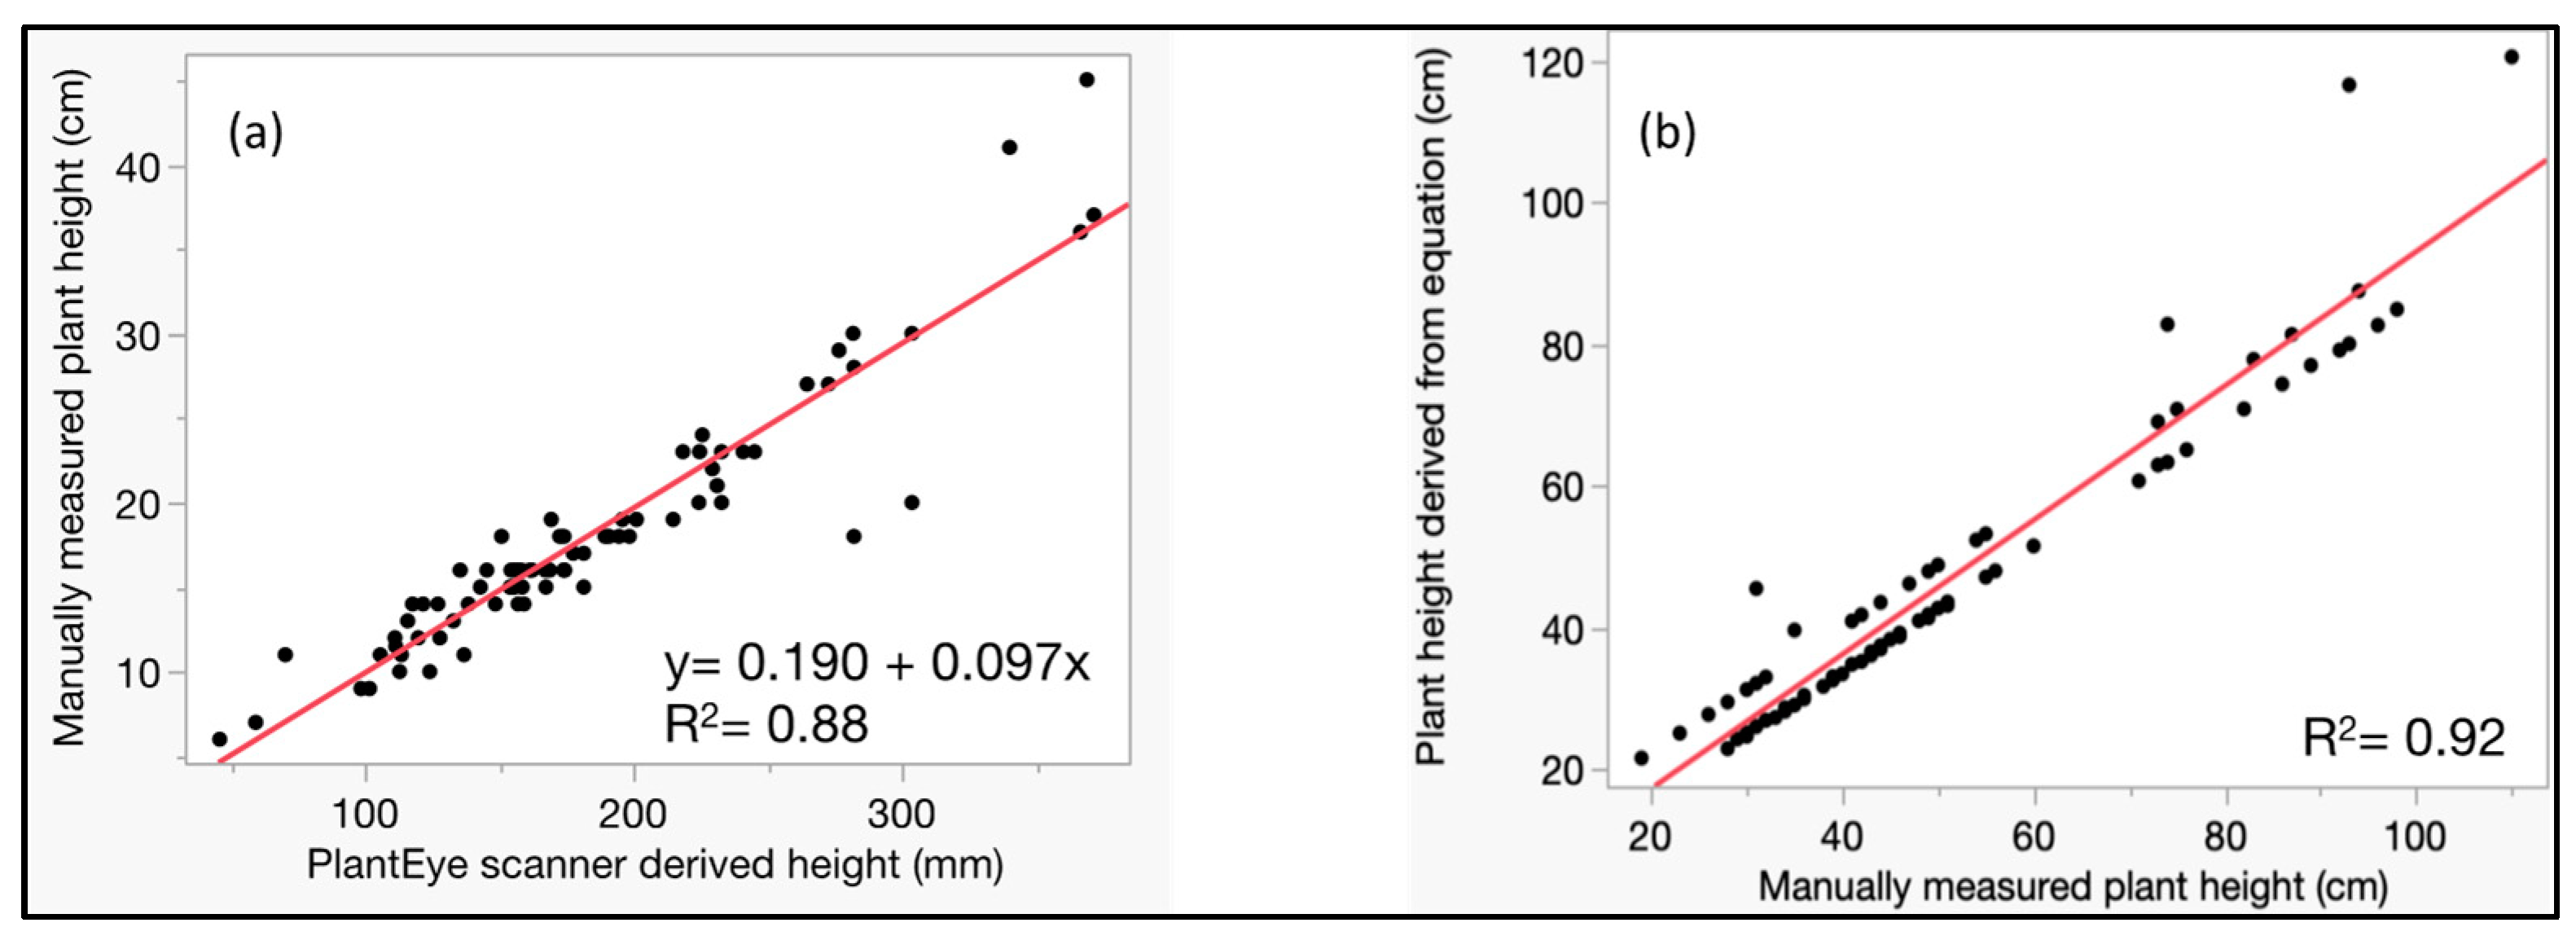
3.2. Method Validation of Digital Plant Height Estimation Techniques

To assess the reliability of the PE scanner in determining plant height, comparative analysis was conducted against standard manual measurement technique. The scatter plot in Figure 5a demonstrates the linear correlation between the manually measured plant heights (y-axis) and the heights derived from the PE scanner (x-axis) at 3 WAS. The best-fit line, represented by equation 1 (y = 0.190 + 0.097x), indicates a positive linear relationship with a coefficient of determination (R2) of 0.88. This high R2 value implies that the PE scanner-derived measurements can accurately predict the manually measured plant height. However, it is important to note that 88% of the variation in height was accounted for in this correlation analysis considering all data points (n = 81, R2 = 0.88) at 3 WAS (Figure 5a). Few pots were observed with non-uniform growth, potentially attributable to factors such as inadequate germination. These pots exhibited the greatest deviation from the regression line. Upon exclusion of above-stated pots from the analysis, the remaining pots exhibiting complete canopy cover demonstrated improved correlation between PE scanner-derived estimations and manual measurements (n = 75, R2 = 0.946).
Figure 5b shows the correlation between manually measured plant heights at 5 WAS and the predicted heights derived from a regression equation 1 (y = 0.190 + 0.097x). The derived heights are plotted on the y-axis, while the manually measured heights are displayed on the x-axis. The resulting R2 value of 0.92 suggests a strong correlation, indicating that the regression equation provides a highly reliable method for predicting plant height from manual measurements.

3.3. Leaf Area Index (LAI), Leaf Angle (LA), and Light Penetration Depth (LPD)

3.3.1. Leaf Area Index (LAI)

Weeds impede the development of new crop plants by shading and competing for soil nutrients and growing space. The leaf area index (LAI) is an important parameter for defining canopy structure, light use efficiency, and in predicting primary production. LAI is a dimensionless quantity, which represents the total one-sided area of leaf surface (m2) per unit ground surface area (m2) (Table 4 and Table 5). In this study, LAI follows a near-linear relationship with digital biomass and height. Wide variations of LAI were observed among the varieties, with the LAI of ‘Han-Ne’ (0.140) being about four times higher than that of ‘Joey’ (0.033). Generally, ‘Anka’, ‘Bialobrzeski’, ‘Bubbatonic’, and ‘Han-Ne’ had the greatest LAI, followed by ‘Hurricane Hemp’, ‘Hlesia’, and ‘Puma’ with the least LAI.
Among all varieties, floral hemp, cultivated primarily for its flowers/buds, showed a range in LAI values, indicating differences in leaf density and canopy structure. For example, at 3 WAS, ‘Bubbatonic’ exhibited a relatively high LAI of 0.135, suggesting a dense canopy beneficial for capturing light efficiently at the early vegetative stage. By 10 WAS, ‘Hurricane Hemp’ showed a significant increase in LAI, pointing towards sustained leaf area development conducive to supporting floral production. Fiber hemp types are grown for their stalks and used in textiles and construction materials. These varieties tend to prioritize vertical growth, which was reflected in their LAI measurements. ‘Han-Ne’ had the highest LAI at 3 WAS (0.140), indicating robust early growth conducive to fiber production. By 10 WAS, ‘Bialobrzeski’ and ‘Jinma’ showed substantial LAI values, which could correlate with a denser canopy, potentially improving photosynthetic efficiency crucial for biomass accumulation necessary for fiber yield. Dual-purpose hemp varieties are versatile and used for both fiber and floral production. These types showed a significant range in LAI values at 3 and 10 WAS, reflecting their varied use. For instance, ‘Anka’ showcased a dramatic increase in LAI by 10 WAS (0.192), the highest among dual-purpose varieties, signifying its potential for fiber and flower production due to its dense canopy. Conversely, ‘Magic Bullet’ and ‘Photo CBD’ had lower LAI values at 3 WAS, which could affect their early vegetative development and overall productivity. The observed LAI values across the different hemp types reveal intrinsic growth strategies and potential productivity outcomes based on their intended use. Floral varieties emphasize dense canopies early to support flower development, fiber types focus on vertical growth and leaf area to boost stalk biomass, and dual-purpose varieties balance these traits to support both ends.

3.3.2. Leaf Angle (LA)

Leaf angle (LA) is a crucial trait in plant morphology, reflecting how leaves orient themselves in relation to the plant’s stem. It affects the plant’s ability to capture light, influencing photosynthesis, and can impact overall plant health and productivity. Leaf angle of all hemp varieties ranged from 43° to 55° (Table 4 and Table 5). Among all varieties, Abound, Arrowhead Abacus, Arrowhead Select, Ba0x Hybrid 2.0, BaOx Hybrid, BaOx Select, Bialobrzeski, Boxwine, Boxwine 2.0, Bubbatonic, Hlesia, Hliana, Hurricane Hemp, Lifter, Magic Bullet, Rincon, and White CBG had the significantly greatest leaf angle (>51°), whereas Joey, Lara, and Han-Ne had the least leaf angle (43–49°). Among different hemp types, floral type generally displayed leaf angles ranging from about 51° to 55° at 3 WAS, indicating a moderately upright orientation. At 10 WAS, the leaf angles remained consistent. Fiber varieties showed a broader range of leaf angles, from 45° to 56° at 3 WAS. Dual-purpose varieties exhibited leaf angles that were generally in line with those of floral and fiber types, showing a blend of characteristics.

3.3.3. Light Penetration Depth (LPD)

The light penetration depth (LPD) refers to the extent to which the laser scanner can penetrate through the plant’s canopy. Consequently, plants with a high-density canopy will demonstrate a correspondingly low numerical value. The laser’s ability to penetrate the canopy at its maximum depth is determined by analyzing the histogram along the z-axis, which is similar to the calculation of height. The LPD values were significantly correlated (R2 > 0.60, p < 0.001) with digital biomass, digital plant height, and manual plant height (Table 2 and Table 3). In general, tall varieties had a high LPD value, which indicates low plant density. The lower-height plant had a greater density and lower LPD values (Table 4 and Table 5).
Significant differences in LPD across hemp varieties at critical growth stages, 3 and 10 WAS, were revealed in the study, indicating the dynamic nature of canopy development and its influence on agronomic outcomes. At 3 WAS, LPD values ranged from as low as 34.74 mm in the “Magic Bullet” (Dual purpose) variety, reflecting a denser canopy, to as high as 308.98 mm in the “Anka” (Dual purpose) variety, suggesting a more open canopy that could potentially enhance under-canopy light availability and influence subsequent growth stages. By 10 WAS, the LPD exhibited a notable increase, with “Joey” (Dual purpose) showing a substantial rise to 421.87 mm. In comparison, “Hlesia” (Dual purpose) reached 241.52 mm, demonstrating variability in canopy architecture evolution over time. These quantitative findings underscore the impact of genetic variation on canopy structure, with LPD ranging from 34.74 mm to 421.87 mm across the observed growth stages, highlighting the importance of variety selection in optimizing light distribution for improved photosynthetic efficiency and yield. Such insights are critical for developing tailored agronomic practices, such as weed management, that leverage canopy architecture dynamics to maximize crop productivity.

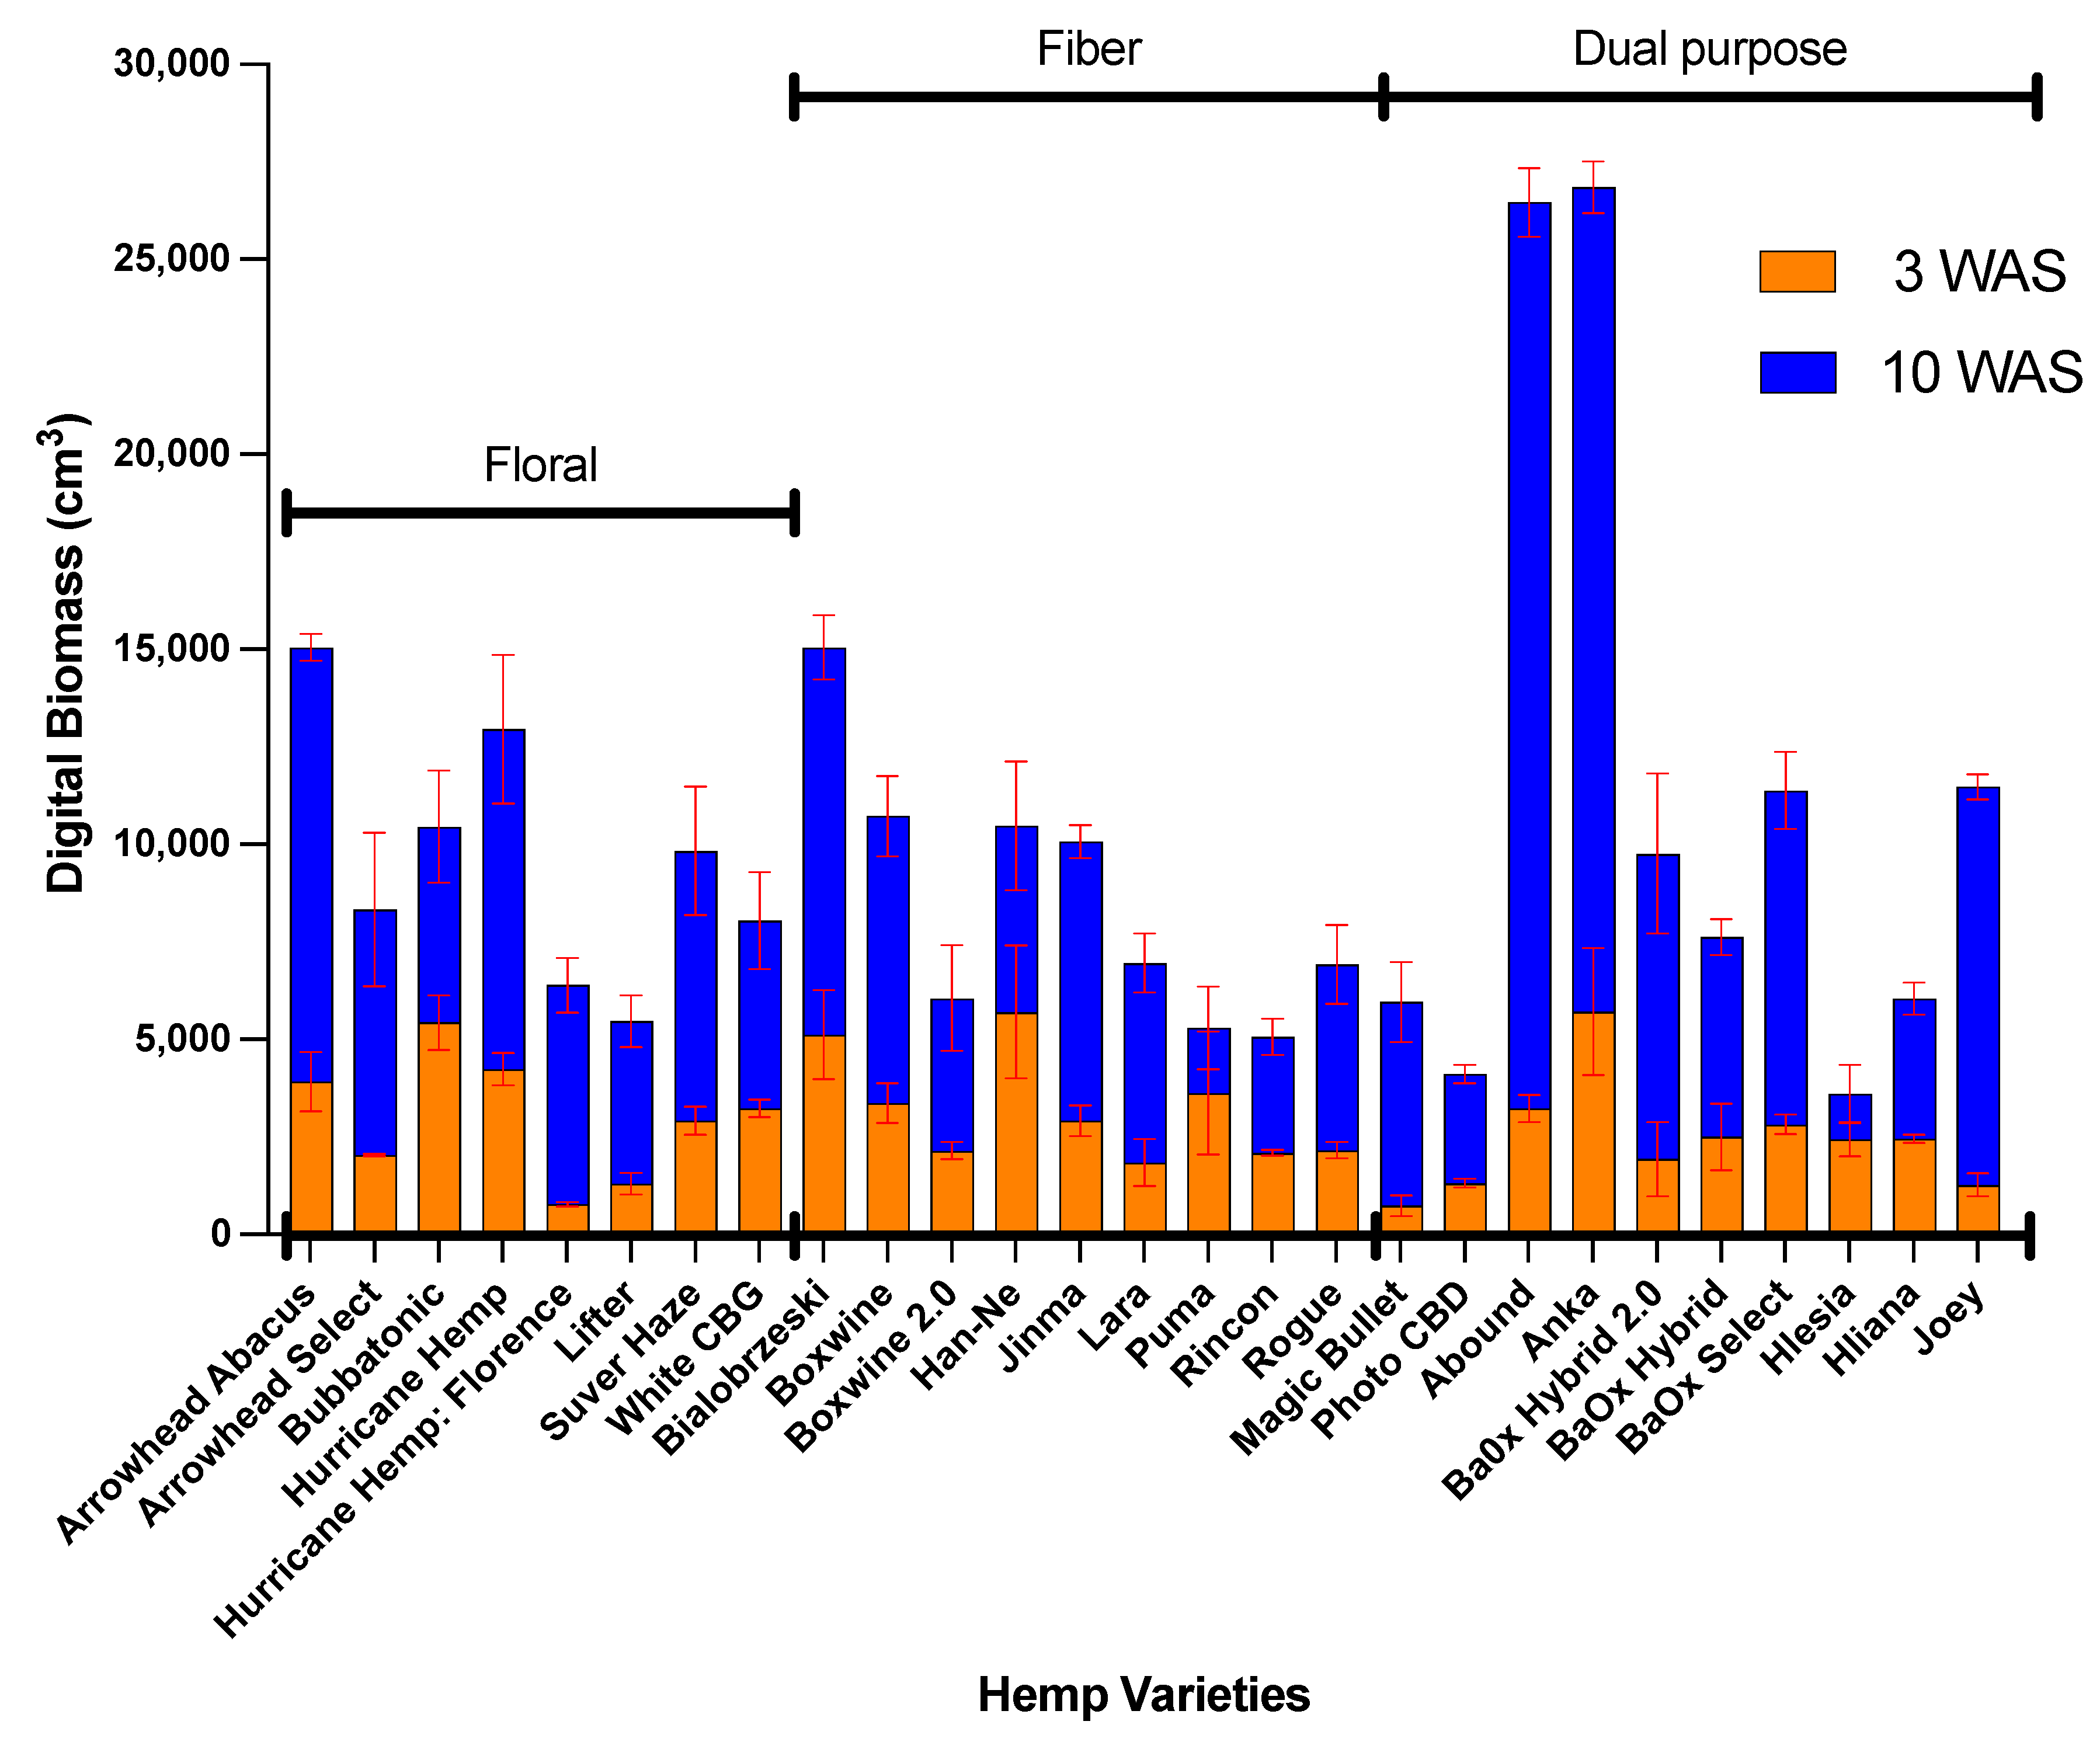
3.4. Digital Biomass

The plants’ digital biomass was recorded in mm3 values by a PE scanner, which represents the volume of the canopy, not of the plant. The method used for determining a plant’s digital biomass involves multiplying its height by its three-dimensional leaf area. Digital biomass values were highly correlated with digital height, leaf area index, light penetration depth, and manual plant height (p < 0.001) (Table 2 and Table 3). Significant correlation (p < 0.001) between digital biomass and manually measured biomass (R2 = 0.89) as well between digital height and manually measured height (R2 = 0.94) observed 10 WAS, indicated a high precision and usefulness of 3D multispectral scanning in measuring morphological traits. (Table 2). In the trial runs, various PE parameters showed a consistently highly significant correlation (R2 > 0.7; p < 0.001) with manual/destructive biomass measurements. Similar correlations (R2 > 0.8) in biomass recorded for various species and growth conditions have been observed [17,18].
This study presents a comprehensive analysis of digital biomass growth in hemp varieties (floral, fiber, and dual-purpose) measured at 3 and 10 WAS (Figure 6). Notably, dual-purpose varieties demonstrated remarkable growth efficiency, with “Abound” showcasing a significant increase in digital biomass to 23,227 cm3 at 10 WAS, signifying its superior adaptability and growth potential. In contrast, leading fiber and floral varieties, “Bialobrzeski” and “Hurricane Hemp,” recorded biomass accumulations of 9932 cm3 and 8712 cm3, respectively, indicating significant but comparatively lower growth capabilities. The contrast in growth trajectories among the varieties underscores the importance of strategic variety selection based on cultivation objectives. Weed competitiveness in hemp is multifaceted, encompassing rapid early growth to establish dominance, dense canopy formation to suppress weed emergence, and the ability to sustain growth vigor in the presence of competitive pressure.
Overall, digital biomass data reported that dual-purpose varieties, particularly “Abound” and “Anka,” showed remarkable growth acceleration, significantly outpacing both floral and fiber varieties by the later growth stage. This suggests that dual-purpose varieties may have a higher overall growth efficiency, weed competitiveness, and potential yield, making them valuable for both fiber and floral yields, and potentially offering greater flexibility and economic returns for growers.

4. Discussion

Certain characteristics have been observed to have an impact on the competitive ability of crops such as rapid germination and emergence, rapid biomass accumulation, leaf area index, leaf angle, and light penetration. In this study, digital plant biomass, plant height, and plant 3D-leaf area (including leaf area index, leaf angle, and light penetration) were studied because weed competitiveness is often measured by these characteristics [15,16]. The PE scanner used in this research serves as an illustration of a contemporary phenotyping sensor. The utilization of the PE scanner has been documented in various studies to capture images of different plant species. For instance, this technology was used to estimate plant weight and leaf area in contrasting rapeseed genotypes with similar architecture based on linear correlations from one genotype [17]. The same technology was utilized to assess plant canopy traits affecting water use (leaf area, leaf area index, and transpiration) in peanut, cowpea, and pearl millet and found close agreement between scanned and observed leaf area data (R2 between 0.86 and 0.94) [18]. This technology was also used to image salt-stressed wheat plants and found a strong correlation (R2 = 0.86) between PE-measured leaf area and manually measured leaf area [19]. In another research study significant correlations (R2 = 0.87) between the actual fresh plant mass and digital biomass of different tomato cultivars were observed [20]. Similarly, this technology was used for imaging soyabean and found a strong correlation between the PE leaf area and observed leaf area (R2 values ranging between 0.89 and 0.91) [21]. Another study utilized PE for detecting drought and salinity stress in basil plants and found a significant correlation between digital biomass and shoot fresh weight (R2 = 0.90) [22].
The findings in this study are consistent with prior research results [18,21]. These earlier studies also identified a significant relationship between the parameters obtained using scanning techniques and the corresponding parameters seen directly for a range of different crops. While it is true that stronger correlations between the reference and PE technique are observed, it is important to acknowledge the constraints imposed by the age of the plants and their development trajectory, which might result in the overlapping of leaves. As stated in previous research [18], more investigation and data acquisition at several time intervals are necessary to authenticate the findings pertaining to the efficacy of scanner-based technologies in accurately estimating leaf area and digital biomass in large plants. The objective of this study was to assess the first growth responses of a diverse set of hemp varieties in order to screen a wider population to study potential weed competitiveness. The aim was to conclude the experiment before it progressed beyond the key stage of critical weed-free time. Taller fiber hemp varieties, such as Puma, may be suited for higher planting densities due to their dense canopies, aiding in weed suppression. Shorter floral and dual-purpose varieties may require lower planting densities but might contribute to weed control through canopy density. Optimizing planting densities based on variety height may enhance canopy closure, minimize weed competition, and improve overall crop yield.
The analysis presented in this study supports the efficacy of the PE scanner in replicating manual measurement results. The R2 values confirm the high reliability of the PE measurement method. In the study, a strong relationship was identified between digital biomass and manually measured biomass, as well as between digital height and manually measured height. Also, significant correlations existed between all targeted traits except for leaf angle. LAI follows a near-linear relationship with digital biomass and height. Measuring leaf area is typical for crop–weed competition, as shading by either species depends on the relative total leaf area [23]. Crop varieties that rapidly grow and shade the soil surface are more competitive in suppressing weed growth than slow-growing varieties [24]. Also, leaf area can influence plant fitness and photosynthetic potential in intraspecific and interspecific competition since the final biomass yield depends on leaf area [25]. LAI is a better indicator than leaf area for light interception as it is the ratio of one-sided leaf area per ground area. The amount of light that reaches a plant determines a plant’s ability to conduct photosynthesis and, ultimately, produce crop yield. Previous research on sweet potato shows that varieties exhibiting a bunched type of growth habit have less light penetration through the canopy compared to sweet potato varieties that exhibit a traditional vining type, hence are more weed competitive [12,26]. A reduction in light interception by plants due to crowding from neighbors and the importance of this reduction can differ based on the crop stage and crop species.
In this study, the primary focus was on assessing the height and biomass of the selected hemp varieties as key indicators of their growth responses and potential weed competitiveness. While manual measurements of other valuable traits such as LA, LAI, and LPD were not conducted due to their labor-intensive and time-consuming nature, our approach was grounded in practicality. Height and biomass, recognized as a reliable proxy for crop growth and development, provided a pragmatic balance between data depth and measurement feasibility. By prioritizing these metrics, the study efficiently identified significant variations in growth responses among the hemp varieties within the experimental design. Future research could explore automated or semi-automated methods to incorporate a broader range of traits, potentially offering a more comprehensive understanding of hemp’s weed competitiveness and other agronomic characteristics

5. Conclusions

These data suggest that 3D multispectral scanning is a precise and potentially valuable method for evaluating weed-competitive morphological features in hemp and other specialty crops. Moreover, multispectral analyses used in this study are non-destructive, rapid techniques with minimal error and human interference, which have a great potential to optimize hemp cultivar selection to aid in weed management. Crop-competitiveness in the presence of weed species is one of the key factors that determine crop performance. Scientists may obtain critical insights into the dynamics of competition and their effects on crop plants by evaluating key morphological parameters using PE technology. The integration of digital plant phenotyping from controlled environments, such as laboratories or greenhouses, into natural field settings can provide a comprehensive understanding of the morphological, physiological, and functional responses of plant communities. Moreover, investing in similar innovative approaches for assessing and selecting weed competitive traits in crop breeding and agricultural research may be crucial for addressing weed management challenges in crop production.

Author Contributions

Conceptualization, L.S., M.C., M.F., H.H.-V., G.S. and K.G; methodology, G.S., M.C. and P.W.; software, G.S.; validation, G.S., M.C., T.S. and P.W.; formal analysis, G.S.; investigation, G.S.; resources, G.S.; data curation, G.S.; writing—original draft preparation, G.S.; writing—review and editing, L.S., M.C., M.F., H.H.-V., P.W., T.S. and K.G; visualization, M.C.; supervision, M.C., project administration, M.C.; funding acquisition, L.S., M.C., M.F., H.H.-V. and K.G. All authors have read and agreed to the published version of the manuscript.

Funding

This research was funded by USDA-NIFA Crop Protection and Pest Management Competitive Grants Program, grant number 2021-70006-35311.

Data Availability Statement

The raw data supporting the conclusions of this article will be made available by the authors on request.

Acknowledgments

We appreciate the assistance of Tyler Campbell for the experimental set-up.

Conflicts of Interest

The authors declare no conflicts of interest. The funders had no role in the design of the study; in the collection, analyses, or interpretation of data; in the writing of the manuscript; or in the decision to publish the results.

References

  1. Montgomery, B. The bast fibers. In Matthew’s Textile Fibers, 6th ed.; Mausberger, H.R., Ed.; John Wiley and Sons: Hoboken, NJ, USA, 1954; pp. 257–359. [Google Scholar]
  2. Robinson, B.B. Abaca, a cordage fiber. USDA Agricultural Monograph No. 21. 1953. Available online: https://www.nal.usda.gov/collections/special-collections/usda-crop-fiber-research-collection (accessed on 2 February 2024).
  3. Clarke, R.C.; Merlin, M.D. Cannabis domestication, breeding history, present-day genetic diversity, and future prospects. Crit. Rev. Plant Sci. 2016, 35, 293–327. [Google Scholar] [CrossRef]
  4. Johnson, R. Hemp as an Agricultural Commodity; Congressional Research Service Report 7-57000 RL32725; Congressional Research Service: Washington, DC, USA, 2017.
  5. Fike, J. Industrial hemp: Renewed opportunities for an ancient crop. Crit. Rev. Plant Sci. 2016, 35, 406–424. [Google Scholar] [CrossRef]
  6. Schluttenhofer, C.; Yual, L. Challenges towards revitalizing hemp: A multifaceted crop. Trends Plant Sci. 2017, 22, 917–929. [Google Scholar] [CrossRef] [PubMed]
  7. H.R.2—An act to Provide for the Reform and Continuation of Agricultural and Other Programs of the Department of Agriculture through Fiscal Year 2023, and for Other Purposes. Agriculture Improvement Act of 2018. Available online: https://www.congress.gov/bill/115th-congress/house-bill/2/text?format=txt%26overview=closed (accessed on 20 February 2024).
  8. Amaducci, S.; Scordia, D.; Liu, F.; Zhang, Q.; Guo, H.; Testa, G.; Cosentino, S. Key cultivation techniques for hemp in Europe and China. Ind. Crops Prod. 2015, 68, 2–16. [Google Scholar] [CrossRef]
  9. Hooks, P.J. Production of Industrial Hemp in Kentucky. Master’s Thesis, Murray State University, Murray, KY, USA, 2018. [Google Scholar]
  10. Tang, K.; Struik, P.; Yin, X.; Thouminot, C.; Bjelková, M.; Stramkale, V.; Amaducci, S. Comparing hemp (Cannabis sativa L.) varieties for dual-purpose production under contrasting environments. Ind. Crops Prod. 2016, 87, 33–44. [Google Scholar] [CrossRef]
  11. Cutulle, M.; Ward, B.; Campbell, H.T.; and Horry, M. Varieties and Weed-Free Duration is Important for Hemp Bud Yield in Coastal South Carolina. Clemson (SC): Clemson Cooperative Extension, Land-Grant Press by Clemson Extension; 2020 Jun. LGP 1074. Available online: https://lgpress.clemson.edu/publication/varieties-and-weed-free-duration-is-important-for-hemp-bud-yield-in-coastal-south-carolina/ (accessed on 21 February 2024).
  12. Harrison, H.F., Jr.; Jackson, D.M. Response of two sweet potato varieties to weed interference. Crop Prot. 2011, 20, 1291–1296. [Google Scholar] [CrossRef]
  13. Seavers, G.P.; Wright, K.J. Crop canopy development and structure influence weed suppression. Weed Res. 1999, 39, 319–328. [Google Scholar] [CrossRef]
  14. Ramesh, K.; Rao, A.; Chauhan, B.S. Role of crop competition in managing weeds in rice, wheat, and maize in India: A review. Crop Prot. 2017, 95, 14–21. [Google Scholar] [CrossRef]
  15. Saito, K.; Azoma, K.; Rodenburg, J. Plant characteristics associated with weed competitiveness of rice under upland and lowland conditions in West Africa. Field Crops Res. 2010, 116, 308–317. [Google Scholar] [CrossRef]
  16. Sardana, V.; Mahajan, G.; Jabran, K.; Chauhan, B.S. Role of competition in managing weeds: An introduction to the special issue. Crop Prot. 2017, 95, 1–7. [Google Scholar] [CrossRef]
  17. Kjær, K.H.; Ottosen, C.-O. 3D Laser triangulation for plant phenotyping in challenging environments. Sensors 2015, 15, 13533–13547. [Google Scholar] [CrossRef] [PubMed]
  18. Vadez, V.; Kholová, J.; Hummel, G.; Zhokhavets, U.; Gupta, S.K.; Hash, C.T. LeasyScan: A novel concept combining 3D imaging and lysimetry for high-throughput phenotyping of traits controlling plant water budget. J. Exp. Bot. 2015, 66, 5581–5593. [Google Scholar] [CrossRef] [PubMed]
  19. Maphosa, L.; Thoday-Kennedy, E.; Vakani, J.; Phelan, A.; Badenhorst, P.; Slater, A.; Spangenberg, G.; Kant, S. Phenotyping wheat under salt stress conditions using a 3D laser scanner. Isr. J. Plant Sci. 2017, 64, 55–62. [Google Scholar] [CrossRef]
  20. Laxman, R.H.; Hemamalini, P.; Bhatt, R.M.; Sadashiva, A.T. Non-invasive quantification of tomato (Solanum lycopersicum L.) plant biomass through digital imaging using phenomics platform. Indian J. Plant Physiol. 2018, 23, 369–375. [Google Scholar] [CrossRef]
  21. Manavalan, L.P.; Cui, I.; Ambrose, K.V.; Panjwani, S.; DeLong, S.; Mleczko, M.; Spetsieris, K. Systematic approach to validate and implement digital phenotyping tool for soybean: A case study with PlantEye. Plant Phenome J. 2021, 4, e20025. [Google Scholar] [CrossRef]
  22. Lazarević, B.; Šatović, Z.; Nimac, A.; Vidak, M.; Gunjača, J.; Politeo, O.; Carović-Stanko, K. Application of Phenotyping Methods in Detection of Drought and Salinity Stress in Basil (Ocimum basilicum L.). Front. Plant Sci. 2021, 12, 629441. [Google Scholar] [CrossRef] [PubMed]
  23. Jha, P.; Kumar, V.; Godara, R.K.; Chauhan, B.S. Weed management using crop competition in the United States: A review. Crop Prot. 2017, 95, 31–37. [Google Scholar] [CrossRef]
  24. Holt, J.S. Plant Responses to Light: A Potential Tool for Weed Management. Weed Sci. 1995, 43, 474–482. [Google Scholar] [CrossRef]
  25. Poorter, H.; Niklas, K.J.; Reich, P.B.; Oleksyn, J.; Poot, P.; Mommer, L. Biomass allocation to leaves, stems and roots: Meta-analyses of interspecific variation and environmental control. New Phytol. 2012, 193, 30–50. [Google Scholar] [CrossRef] [PubMed]
  26. Wadl, P.A.; Campbell, H.T.; Rutter, W.B.; Williams, L.H.; Murphey, V.; Culbreath, J.; Cutulle, M. A sustainable approach for weed and insect management in sweetpotato: Breeding for weed and insect tolerant/resistant clones. Weed Technol. 2023, 37, 60–66. [Google Scholar] [CrossRef]
Figure 1. (a) Illustration of the Phenospex PlantEye3D triangulation scanner. The red lines represent the width and projection of the laser line, while the blue lines represent the projection and width of the camera. The green line/area indicates the crop stand. (b) The setup displays the moving position of the positioning system, with the 3D triangulation scanner securely mounted at designated location. (c) The enlarged image of Phenospex PlantEye3D F500 scanner.
Remotesensing 16 02375 g001
Figure 2. Workflow diagram for experimental steps in sequence.
Remotesensing 16 02375 g002
Figure 3. Comparison of digital and manual height of the different types of hemp varieties (Floral, fiber and dual purpose) taken 3 WAS (a) and 10 WAS (b).
Remotesensing 16 02375 g003
Figure 4. Distribution of PlantEye scanner-derived and manually measured hemp plant height of all data points (n = 81). To obtain the distribution curves, a two-tailed t-test was run on the PlantEye-derived and manually measured heights. The red line shows the mean height.
Remotesensing 16 02375 g004
Figure 5. (a) Relationship between manually measured and PlantEye scanner-derived hemp plant height of all data points (n = 81). The relationship was derived by simple linear regression with manually measured height on the y-axis and PlantEye scanner derived height on the y-axis. (b) Relationship between manually measured plant height and derived height from regression equation at 5 WAS. The derived height from regression equation is on the y-axis and manually measured height is on the x-axis.
Remotesensing 16 02375 g005
Figure 6. Digital biomass of the 27 hemp varieties taken 3 and 10 WAS (week after seeding).
Remotesensing 16 02375 g006
Table 1. Hemp varieties (Cannabis sativa L.) categorized based on their primary usage types: floral, fiber, and dual-purpose (both floral and fiber production).
VarietiesType (Fiber, Floral or Dual Purpose)
Arrowhead AbacusFloral
Arrowhead SelectFloral
BubbatonicFloral
Hurricane HempFloral
Hurricane Hemp: FlorenceFloral
LifterFloral
Suver HazeFloral
White CBGFloral
BialobrzeskiFiber
BoxwineFiber
Boxwine 2.0Fiber
Han-NeFiber
JinmaFiber
LaraFiber
PumaFiber
RinconFiber
RogueFiber
Magic BulletDual-purpose
Photo CBDDual-purpose
AboundDual Purpose
AnkaDual Purpose
Ba0x Hybrid 2.0Dual purpose
BaOx HybridDual purpose
BaOx SelectDual purpose
HlesiaDual purpose
HlianaDual Purpose
JoeyDual Purpose
Table 2. Correlation coefficients of morphological parameters of hemp varieties scanned after 3 weeks of seeding.
Digital
Biomass
Digital HeightLeaf AngleLeaf Area IndexLight PenetrationManual Plant Height
Digital biomass1.00
Digital height0.72 *1.00
Leaf angle0.04−0.191.00
Leaf area index0.77 *0.270.251.00
Light penetration depth0.61 *0.71 *0.010.441.00
Manual plant height0.59 *0.90 *−0.050.190.68 *1.00
Values are presented as correlation coefficients, r, at 95% confidence level. * Represents significance (p < 0.05).
Table 3. Correlation coefficients of morphological parameters of hemp plants scanned 10 WAS (week after seeding).
Digital BiomassDigital HeightLeaf AngleLeaf Area IndexLight Penetration
Depth
Manual Plant
Height
Fresh
Biomass
Digital biomass1.00
Digital height0.68 *1.00
Leaf angle0.39−0.061.00
Leaf area index0.74 *−0.270.471.00
Light penetration depth0.64 *0.79 *−0.13−0.111.00
Manual plant height0.150.94 *−0.180.310.52 *1.00
Fresh biomass 0.89 *0.69 *0.080.67 *0.62 *−0.021.00
Values are presented as correlation coefficients, r, at 95% confidence level. * Represents significance (p < 0.05).
Table 4. Morphological traits of the hemp varieties scanned with Phenospex PlantEye scanner 3 weeks after seeding.
VarietiesType
(Fiber, Floral
or Dual Purpose)
Digital
Biomass (cm3)
Digital Height (mm)Leaf Angle (°)Leaf Area Index Light Penetration Depth (mm)Manual Plant Height (cm)
Arrowhead AbacusFloral3915 abc183 bcde54 ab0.123 abcd153.13 bc17.67 bcde
Arrowhead SelectFloral2035 abc113 de53 ab0.1046 abcdef104.88 bc10.33 f
BubbatonicFloral5436 ab232 abcde55 a0.135 ab185.69 abc23.00 bc
Hurricane HempFloral4235 abc193 bcde51 abc0.1283 abc185.41 abc17.67 bcde
Hurricane Hemp: FlorenceFloral777 c107 e51 abc0.042 ef42.27 c11.17 ef
LifterFloral1303 bc144 cde52 abc0.051 def49.93 c15.67 cde
Suver HazeFloral2912 abc166 bcde51 abc0.101 abcdef160.57 abc16.00 cde
White CBGFloral3231 abc163 cde53 ab0.114 abcde158.17 abc16.00 cde
BialobrzeskiFiber5121 ab246 abc56 a0.125 abcd232.87 ab23.00 bc
BoxwineFiber3372 abc154 cde55 a0.126 abc132.45 bc13.00 ef
Boxwine 2.0Fiber2143 abc152 cde51 abc0.081 abcdef68.72 c16.67 cde
Han-NeFiber5693 a226 abcde45 bc0.140 a110.28 bc19.67 bcde
JinmaFiber2910 abc260 abc48 abc0.065 bcdef128.33 bc25.67 b
LaraFiber1840 abc165 bcde47 abc0.070 abcdef163.16 abc16.00 cde
PumaFiber3625 abc225 ab51 abc0.079 abcdef140.44 bc23.67 b
RinconFiber2092 abc163 cde55 a0.074 abcdef104.24 bc15.67 cde
RogueFiber2155 abc149 cde49 abc0.084 abcdef124.3 bc15.00 de
Magic BulletDual purpose739 c96 e52 abc0.041 ef34.74 c10.33 f
Photo CBDDual purpose1314 bc133 cde51 abc0.057 cdef53.25 c15.33 cde
AboundDual purpose3232 abc243 abcd54 ab0.077 abcdef120.54 bc25.67 b
AnkaDual purpose5713 a358 a51 abc0.094 abcdef308.98 a40.67 a
Ba0x Hybrid 2.0Dual purpose1938 abc112 de53 ab0.0863 abcdef74.37 c11.00 f
BaOx HybridDual purpose2498 abc177 cde55 a0.078 abcdef65.25 c18.33 bcde
BaOx SelectDual purpose2815 abc153 cde51 abc0.106 abcdef139.09 bc14.67 de
HlesiaDual purpose2443 abc187 bcde52 abc0.075 abcdef182.38 abc17.67 bcde
HlianaDual purpose2446 abc153 cde53 ab0.0923 abcdef130.71 bc14.33 ef
JoeyDual purpose1273 bc212 bcde43 c0.033 f88.17 bc13.67 ef
Letters within each cell indicate statistically significant differences (p < 0.05) based on the least significant difference (LSD) test.
Table 5. Morphological traits of the hemp varieties scanned with Phenospex PlantEye scanner 10 weeks after seeding.
VarietiesType (Fiber, Floral or Dual Purpose)Digital Biomass (cm3)Digital Height (mm)Leaf Angle (°)Leaf Area Index Light Penetration Depth (mm)Manual Plant Height (cm)
Arrowhead AbacusFloral11,141 abc443 d44 ab0.112 ab419.76 a44.33 cdef
Arrowhead SelectFloral6296 abc324 de49 a0.088 ab198.93 bc32.00 ef
BubbatonicFloral5017 abc413 de46 a0.055 ab318.06 abc46.33 cdef
Hurricane HempFloral8712 abc443 d48 a0.088 ab430.99 a55.00 bcdef
Hurricane Hemp: FlorenceFloral5618 abc364 de46 ab0.073 ab350.00 abc40.33 def
LifterFloral4159 abc303 de47 a0.061 ab254.06 abc30.00 f
Suver HazeFloral6916 abc389 de43 ab0.077 ab384.76 abc40.00 def
White CBGFloral4815 abc363 de47 a0.058 ab346.30 abc30.67 f
BialobrzeskiFiber9932 abc698 c46 ab0.231 a259.01 abc70.67 abcd
BoxwineFiber7352 abc338 de51 a0.097 ab279.93 abc34.67 ef
Boxwine 2.0Fiber3912 abc391 de45 ab0.046 ab260.03 abc44.33 cdef
Han-NeFiber4788 abc701 bc45 ab0.161 ab187.41 c96.00 a
JinmaFiber7163 bc801 abc42 ab0.051 ab252.02 abc84.00 ab
LaraFiber5113 abc332 de47 a0.068 ab328.64 abc39.67 def
PumaFiber1675 c867 ab34 b0.021 b382.37 abc91.67 a
RinconFiber2969 bc261 e48 a0.051 ab251.36 abc28.33 f
RogueFiber4767 abc295 de45 ab0.071 ab291.88 abc41.67 cdef
Magic BulletDual purpose5220 abc354 de49 a0.065 ab322.78 abc37.67 ef
Photo CBDDual purpose2800 c301 de46 ab0.042 ab201.65 bc32.67 ef
AboundDual purpose23,227 a723 abc45 ab0.186 ab374.64 abc73.33 abc
AnkaDual purpose21,139 ab871 a44 ab0.192 ab292.15 abc89.33 a
BaOX HybridDual purpose7820 abc428 de46 a0.081 ab410.51 ab48.00 cdef
BaOX Hybrid 2.0Dual purpose5122 abc375 de46 ab0.066 ab302.25 abc38.67 def
BaOX SelectDual purpose8566 abc408 de47 a0.093 ab401.60 ab45.67 cdef
HlesiaDual purpose1158 c819 abc44 ab0.013 b241.52 abc63.67 abcde
HlianaDual purpose3599 bc391 de47 a0.043 ab239.57 abc43.00 cdef
JoeyDual purpose10,207 abc430 d49 a0.106 ab421.87 a44.33 cdef
Letters within each cell indicate statistically significant differences (p < 0.05) based on the least significant difference (LSD) test.
Disclaimer/Publisher’s Note: The statements, opinions and data contained in all publications are solely those of the individual author(s) and contributor(s) and not of MDPI and/or the editor(s). MDPI and/or the editor(s) disclaim responsibility for any injury to people or property resulting from any ideas, methods, instructions or products referred to in the content.

