Article

Dust Events over the Urmia Lake Basin, NW Iran, in 2009–2022 and Their Potential Sources

by
Abbas Ranjbar Saadat Abadi
1,
Karim Abdukhakimovich Shukurov
2,
Nasim Hossein Hamzeh
3,
Dimitris G. Kaskaoutis
4,*,
Christian Opp
5,
Lyudmila Mihailovna Shukurova
2 and
Zahra Ghasabi
1
1
Department of Meteorology, Atmospheric Science & Meteorological Research Center (ASMERC), Tehran 14977-16385, Iran
2
A.M. Obukhov Institute of Atmospheric Physics, Russian Academy of Sciences, 119017 Moscow, Russia
3
Department Meteorology, Air and Climate Technology Company (ACTC), Tehran 15996-16313, Iran
4
Department of Chemical Engineering, University of Western Macedonia, 50100 Kozani, Greece
5
Department of Geography, Philipps-Universität Marburg, 35037 Marburg, Germany
*
Author to whom correspondence should be addressed.
Remote Sens. 2024, 16(13), 2384; https://doi.org/10.3390/rs16132384
Submission received: 17 May 2024 / Revised: 24 June 2024 / Accepted: 26 June 2024 / Published: 28 June 2024

Abstract

:
Nowadays, dried lake beds constitute the largest source of saline dust storms, with serious environmental and health issues in the surrounding areas. In this study, we examined the spatial–temporal distribution of monthly and annual dust events of varying intensity (dust in suspension, blowing dust, dust storms) in the vicinity of the desiccated Urmia Lake in northwestern (NW) Iran, based on horizontal visibility data during 2009–2022. Dust in suspension, blowing dust and dust storm events exhibited different monthly patterns, with higher frequencies between March and October, especially in the southern and eastern parts of the Urmia Basin. Furthermore, the intra-annual variations in aerosol optical depth at 500 nm (AOD550) and Ångström exponent at 412/470 nm (AE) were investigated using Terra/Aqua MODIS (Moderate Resolution Imaging Spectroradiometer) data over the Urmia Lake Basin (36–39°N, 44–47°E). Monthly distributions of potential coarse aerosol (AE < 1) sources affecting the lower troposphere over the Urmia Basin were reconstructed, synergizing Terra/Aqua MODIS AOD550 for AE < 1 values and HYSPLIT_4 backward trajectories. The reconstructed monthly patterns of the potential sources were compared with the monthly spatial distribution of Terra MODIS AOD550 in the Middle East and Central Asia (20–70°E, 20–50°N). The results showed that deserts in the Middle East and the Aral–Caspian arid region (ACAR) mostly contribute to dust aerosol load over the Urmia Lake region, exhibiting higher frequency in spring and early summer. Local dust sources from dried lake beds further contribute to the dust AOD, especially in the western part of the Urmia Basin during March and April. The modeling (DREAM8-NMME-MACC) results revealed high concentrations of near-surface dust concentrations, which may have health effects on the local population, while distant sources from the Middle East are the main controlling factors to aerosol loading over the Urmia Basin.

1. Introduction

Dust storms are one of the most important natural hazards that affect many atmospheric processes [1,2], plants, animals and ecosystems [3], as well as social–economic life and human health [4,5,6,7]. Dust particles are the heaviest particles by mass in the atmosphere [8], and via inter-relations with solar radiation (direct effect) and clouds (indirect effect), they affect climate and weather patterns at large scales [9,10], as well as meteorological phenomena at mesoscales and microscales [11]. The impacted areas by dust events present high variability ranging from less than 1 km to more than 1000 km, depending on their intensity, traveling distance, atmospheric circulation patterns and thermodynamic processes in the atmosphere [12,13,14]. Dust particles raised from deserts in Africa may travel several thousands of kilometers downwind and reach the east coast of Asia [15,16], Central Europe or southern and northern America [17,18]. However, areas in the proximity of deserts are more affected by dust emissions compared to distant areas from dust sources [19].
The Middle East is the second largest dust source in the world, contributing about 15–20% to global dust emissions [20,21,22]. The dust storms over the region are mainly divided into three categories: the convective, Shamal and frontal dust storms [23,24,25,26,27,28,29]. Shamal dust storms, associated with northwestern wind, mainly occur in summer and rarely in the cold season [20,23]. On the contrary, frontal dust storms that are grouped into pre-frontal and post-frontal types happen mostly in the cold season over the Middle East [24,30]. In addition, some convective dust storms of local scales occur too. The Haboob, a mesoscale dust storm, lasts for a few hours and mostly reduces horizontal visibility to less than 100 m at local scales [31].
The dust sources in the world have large diversity in their areas, physical characteristics, mineralogy, chemical composition and consequently, in their atmospheric and health impacts [8,26]. At the global scale, vast sandy deserts are the largest dust sources [8], while dried lake beds are the second most active source [32,33,34]. Furthermore, glaciers [35], abandoned agricultural lands [36], stony deserts [37], rivers and floodplains [38,39] could episodically emit dust, thus affecting local-to-regional scales. Although sandy deserts are recognized as the main source of dust emissions, nowadays, dried lake beds are an important source for dust storms, especially saline dust storms [32,33,34,40]. The main reasons for the dried or desiccated lakes in the continent’s interior along the dust belt region are related to anthropogenic factors such as building dams and the overexploitation of water for agriculture and potable purposes [41], while the second influencing factor is climate change [42,43]. During the last two decades, several lakes turned into dry lake beds in Central Asia and the Middle East such as the Aral Sea [44,45,46,47,48], the Urmia Lake [49,50,51,52,53] in NW Iran, the Bakhtegan Lake [54,55,56] and the Jazmurian Lake in southern Iran [57,58].
The Urmia Lake in NW Iran is one of the largest desiccated lakes in the Middle East that turned into an active dust source during the last two decades [33,34,49,50]. Several studies have investigated the different atmospheric, climatic, topographic or anthropogenic parameters that were directly or indirectly related to the sharp reduction in the water levels and the desiccation of the lake [50,51,52,53,59,60,61,62,63]. Studies showed that anthropogenic factors are the main reasons for the water loss of the lake, while factors related directly to climate change (i.e., meteorological variables) played a secondary role [60,64]. Among all human-made factors, the construction of more than 50 dams for agricultural irrigation purposes during the past few decades over permanent and seasonal rivers that flow into the lake has been recognized as the main reason for the sharp decrease in the water level of the lake [65]. The decreasing water level, especially in the southern parts of the lake, and saline dust particles raised from this area caused health problems in people living in the Urmia Basin, especially in Tabriz City located in the NE downwind direction of the lake [33], due to dominant southwesterlies during dust storms [32,33,66].
Although several previous studies have investigated the variability in dust events over the Urmia Lake by means of meteorological data and remote sensing observations [34,52,67,68], the current work provides a long-term analysis (2009–2022) of dust events according to their intensity from several sites in the Urmia Basin, along with AOD550 spatio-temporal evolution and HYSPLIT_4 model back-trajectories. This study also aims to identify the main sources that contribute to dust aerosols in the lower troposphere over the Urmia Basin and to differentiate between local and distant sources. Furthermore, model (DREAM8-NMME-CAMS) simulations were utilized for the assessment of the surface concentrations of suspended particulates in the Urmia Basin. This analysis provides essential knowledge about the contribution of local (due to the lake’s desiccation) and distant sources to the increasing dust loading over the region. Dried lake beds contribute to the worsening of air quality and increase in dust loading over the neighboring regions; however, other distant sources may also be responsible for long-term changes in dust activity, which also need to be evaluated. To the best of our knowledge, this is the first time that a study has examined the long-term contribution of dust sources in the Middle East and Central Asia to dust aerosols over the Urmia Basin.

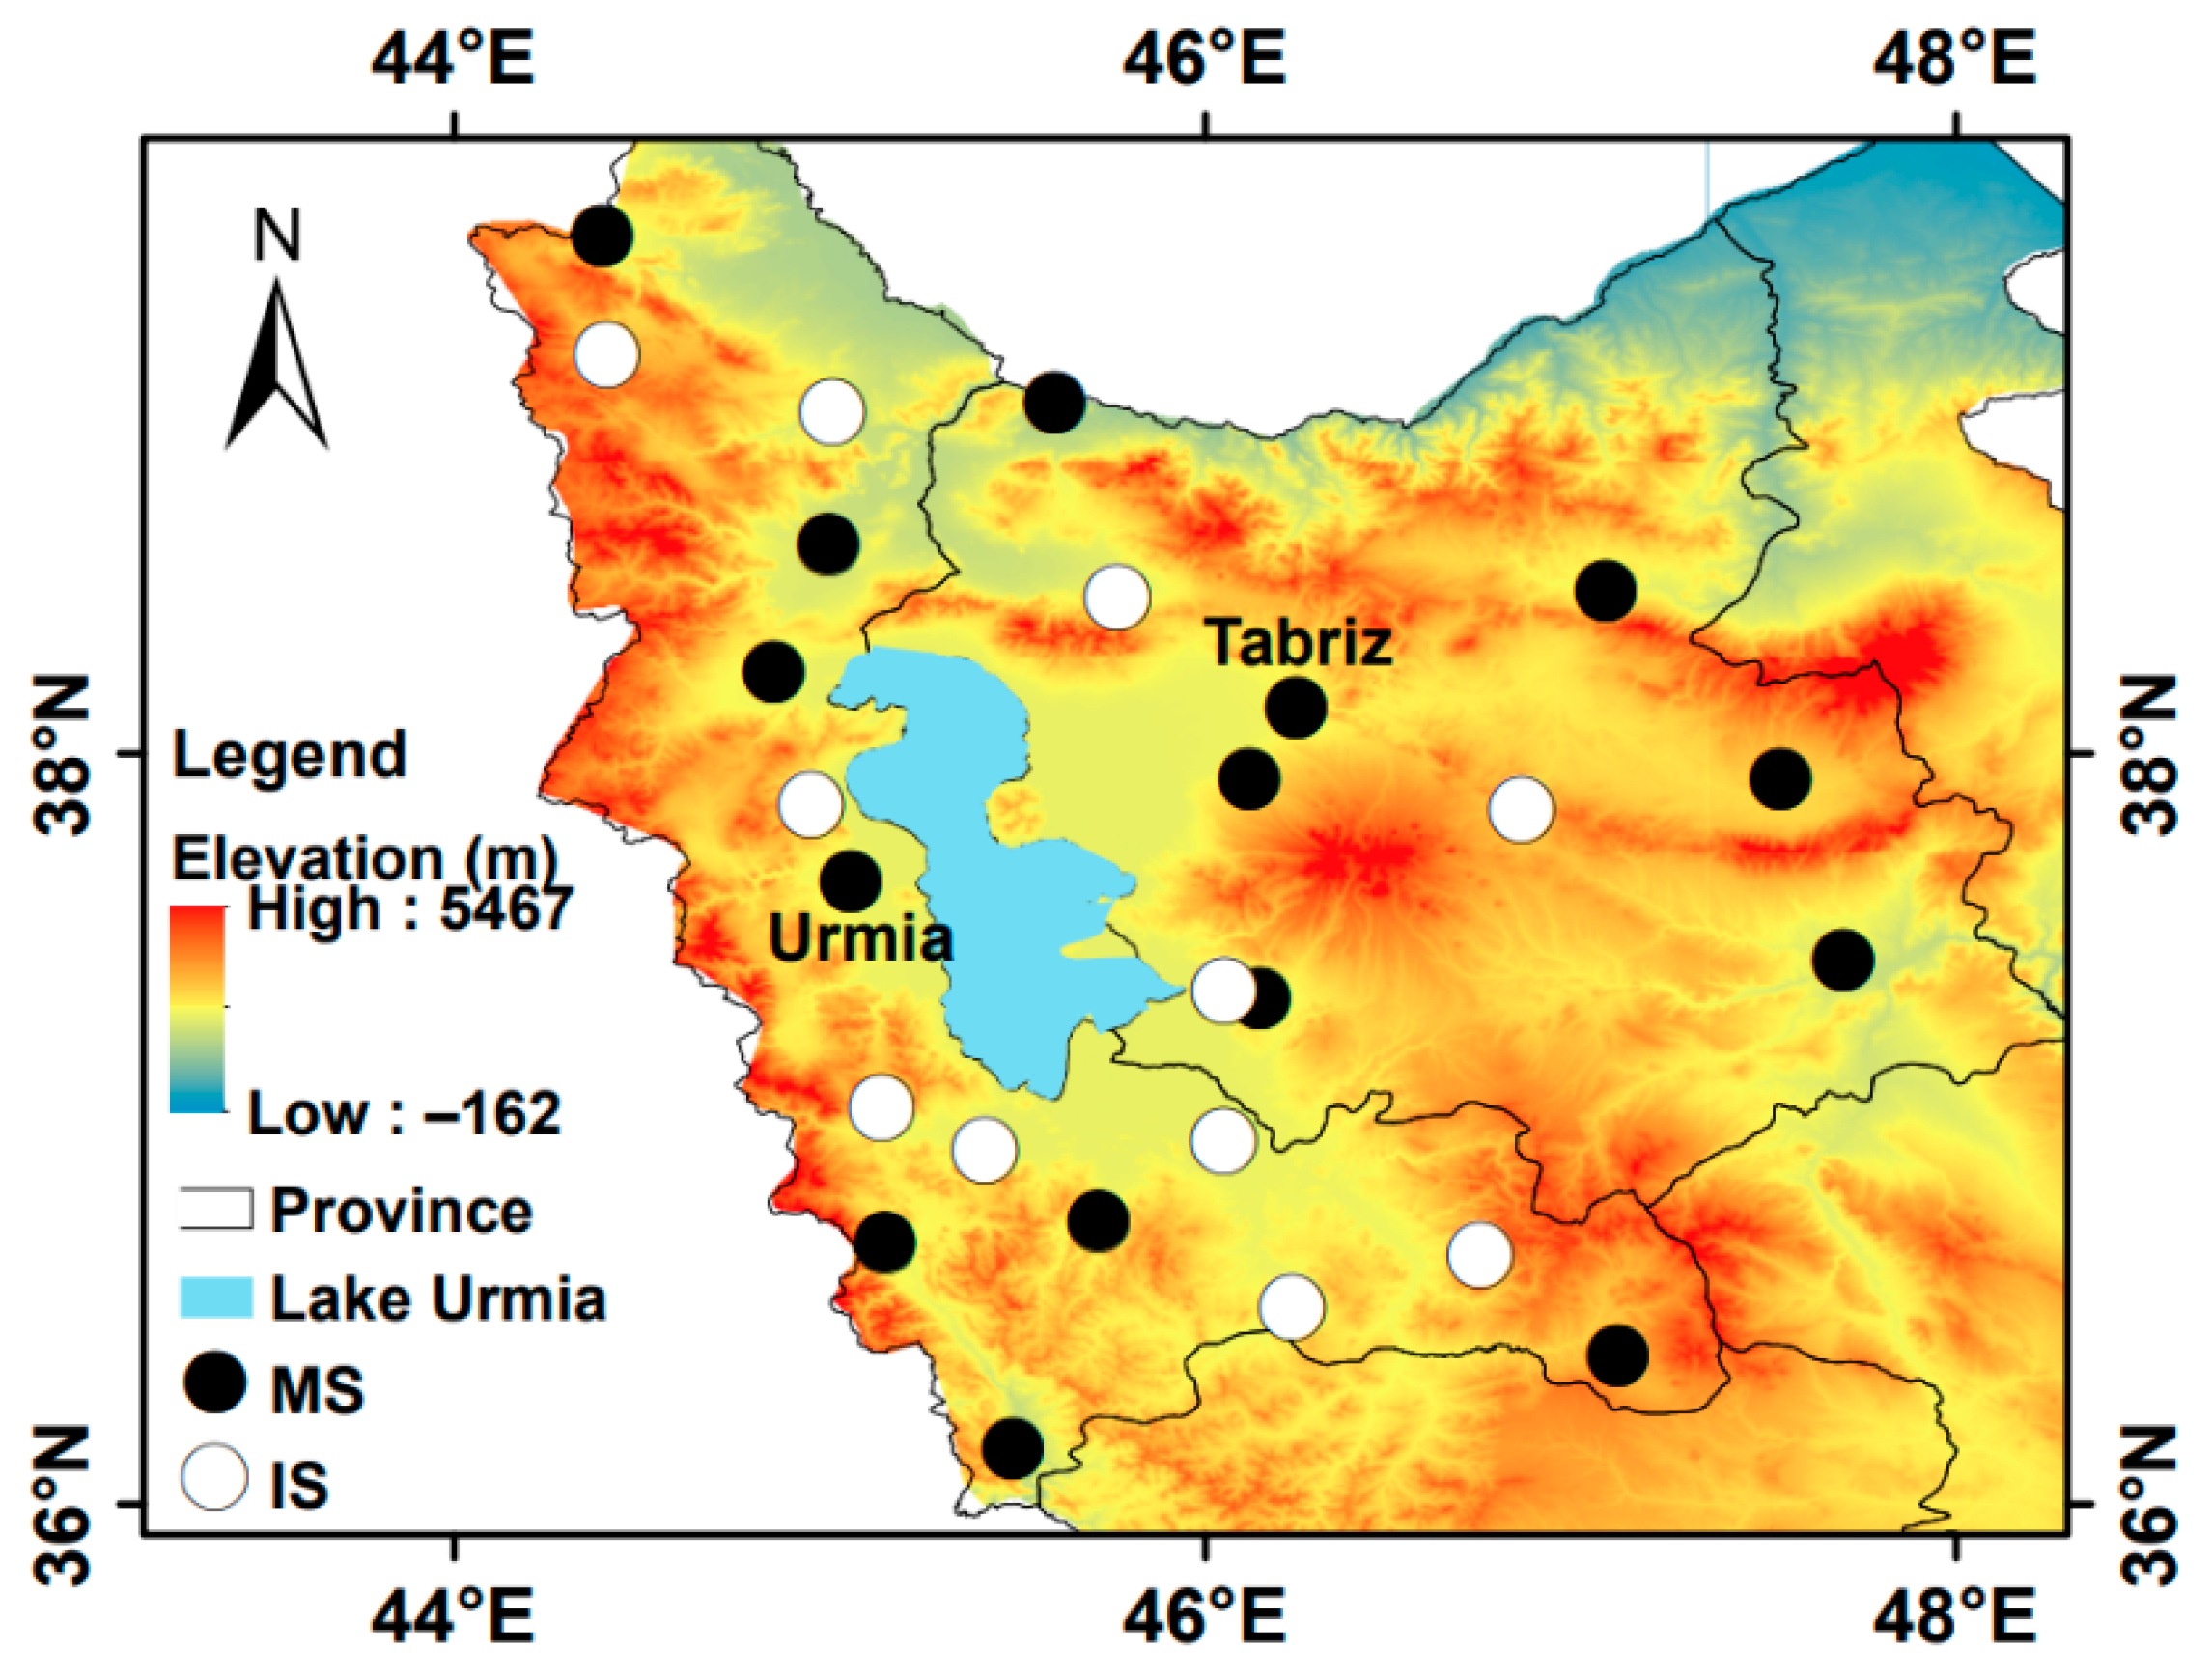
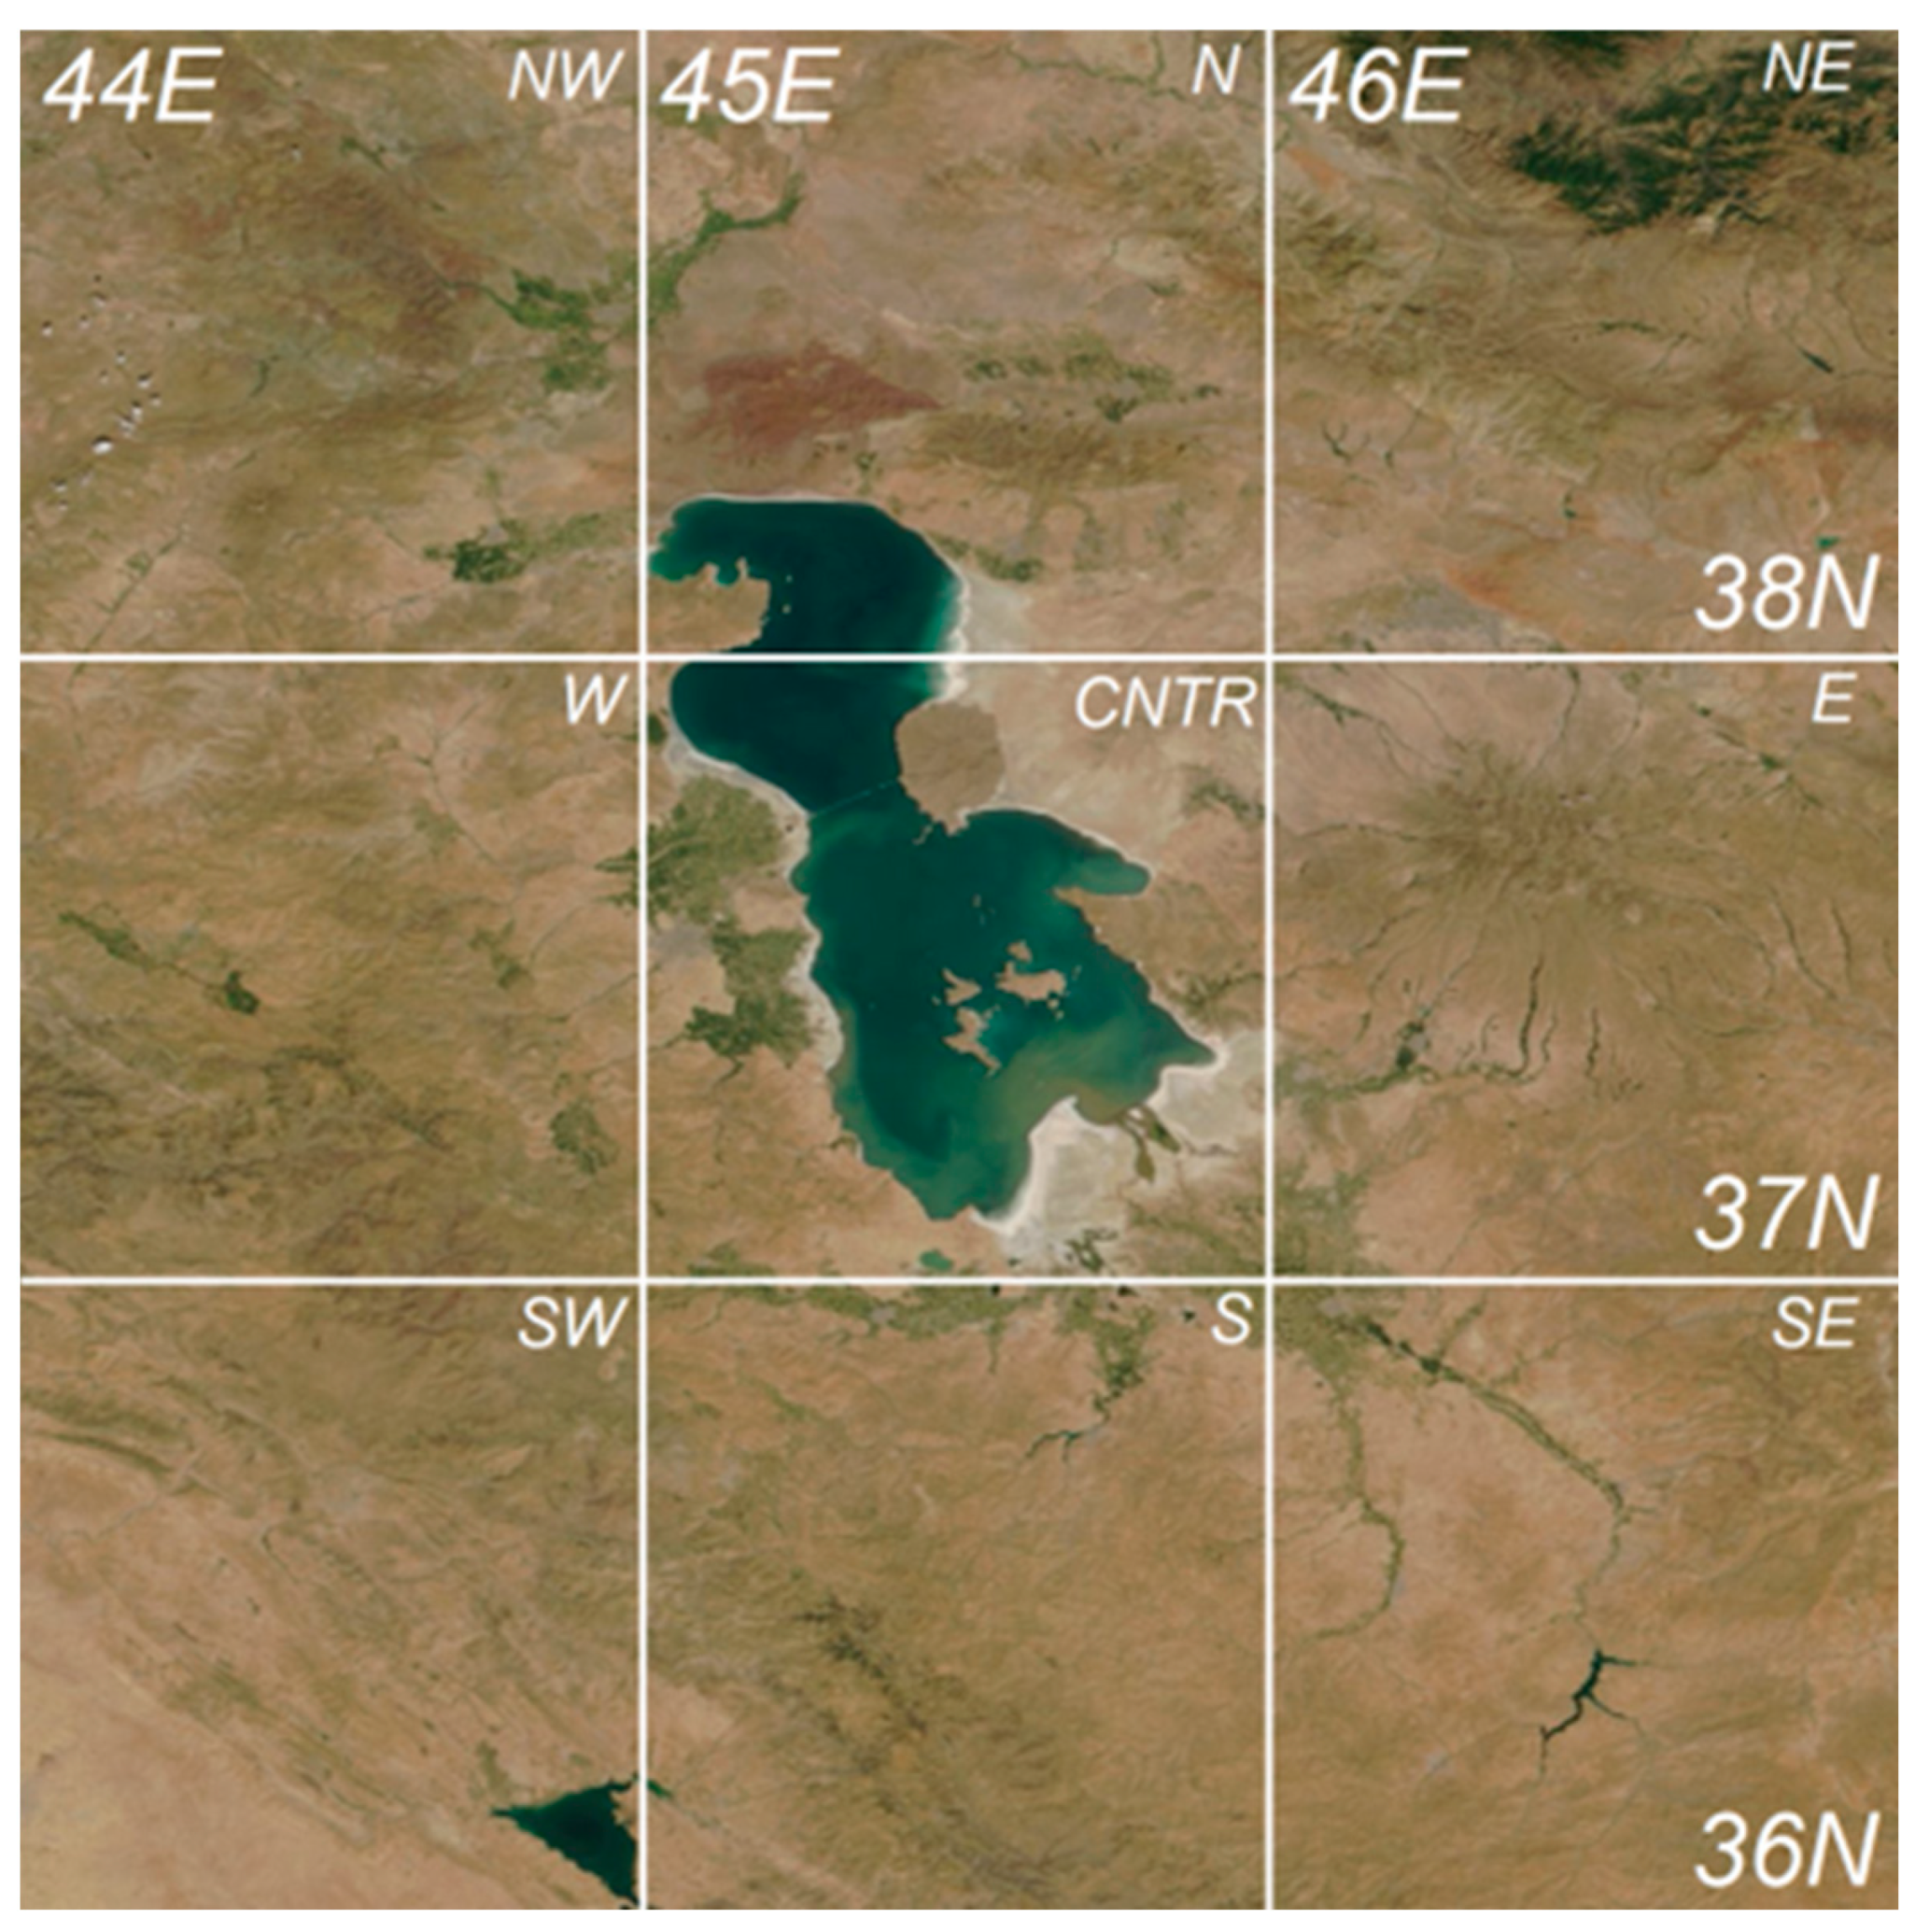
2. Study Area and Dust Storms

The study area is the Urmia Lake Basin located in NW Iran between two Iranian provinces, East and West Azerbaijan [36–39.6°N, 44.5–48°E] (Figure 1). The lake is one of the largest saline lakes in the world and the largest one in the Middle East [69]. Unfortunately, most Iranian lakes lost their water bodies during the last two decades, and the same disaster happened in the Urmia Lake, too. Figure 1 also shows the locations of 26 weather stations around the Urmia Lake that were used in the current analysis. Among them, meteorological data were also taken in Tabriz and Urmia cities, which are industrial urban centers with around 1.7 and 1 million inhabitants, respectively. Although Urmia City is nearer to the Urmia Lake (at ~30 km), Tabriz City suffers more from the lake’s saline dust because of the dominant southwest wind regime [33,34,70]. Meteorological conditions, topography characteristics and dust aerosol properties over the Urmia Basin can be found in a series of previous studies [66,67,71,72].

3. Dataset and Methodology

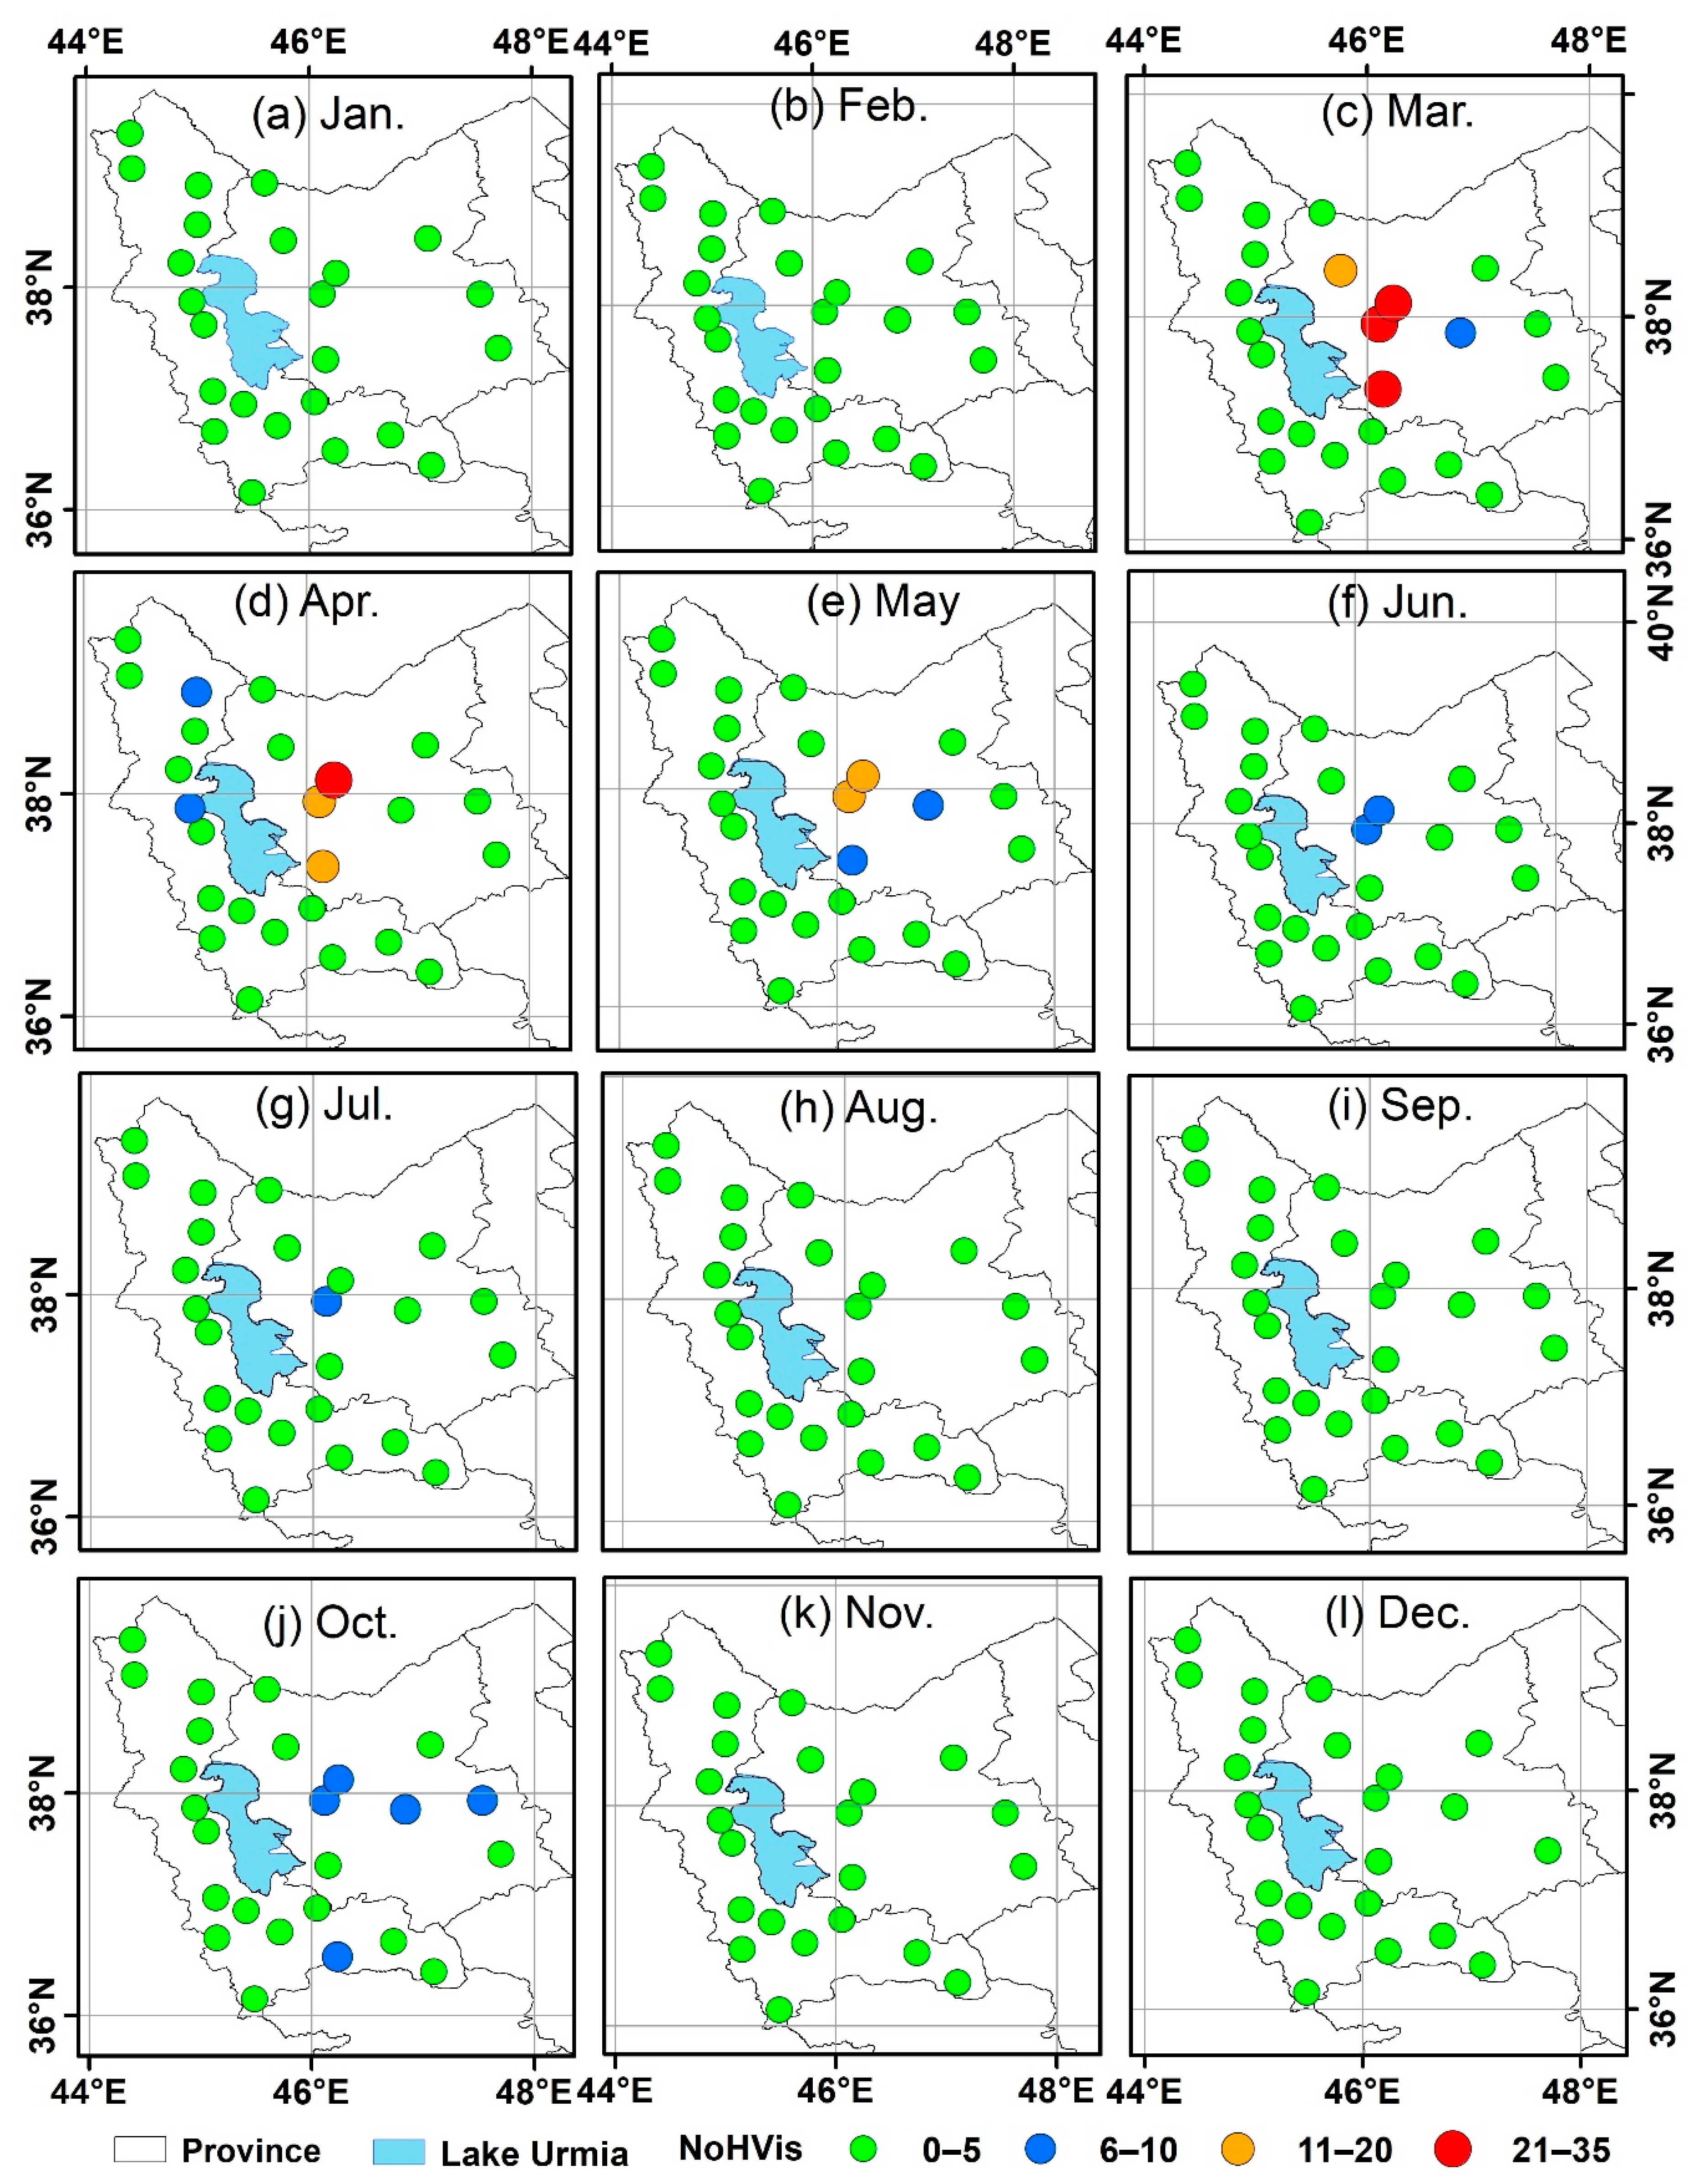
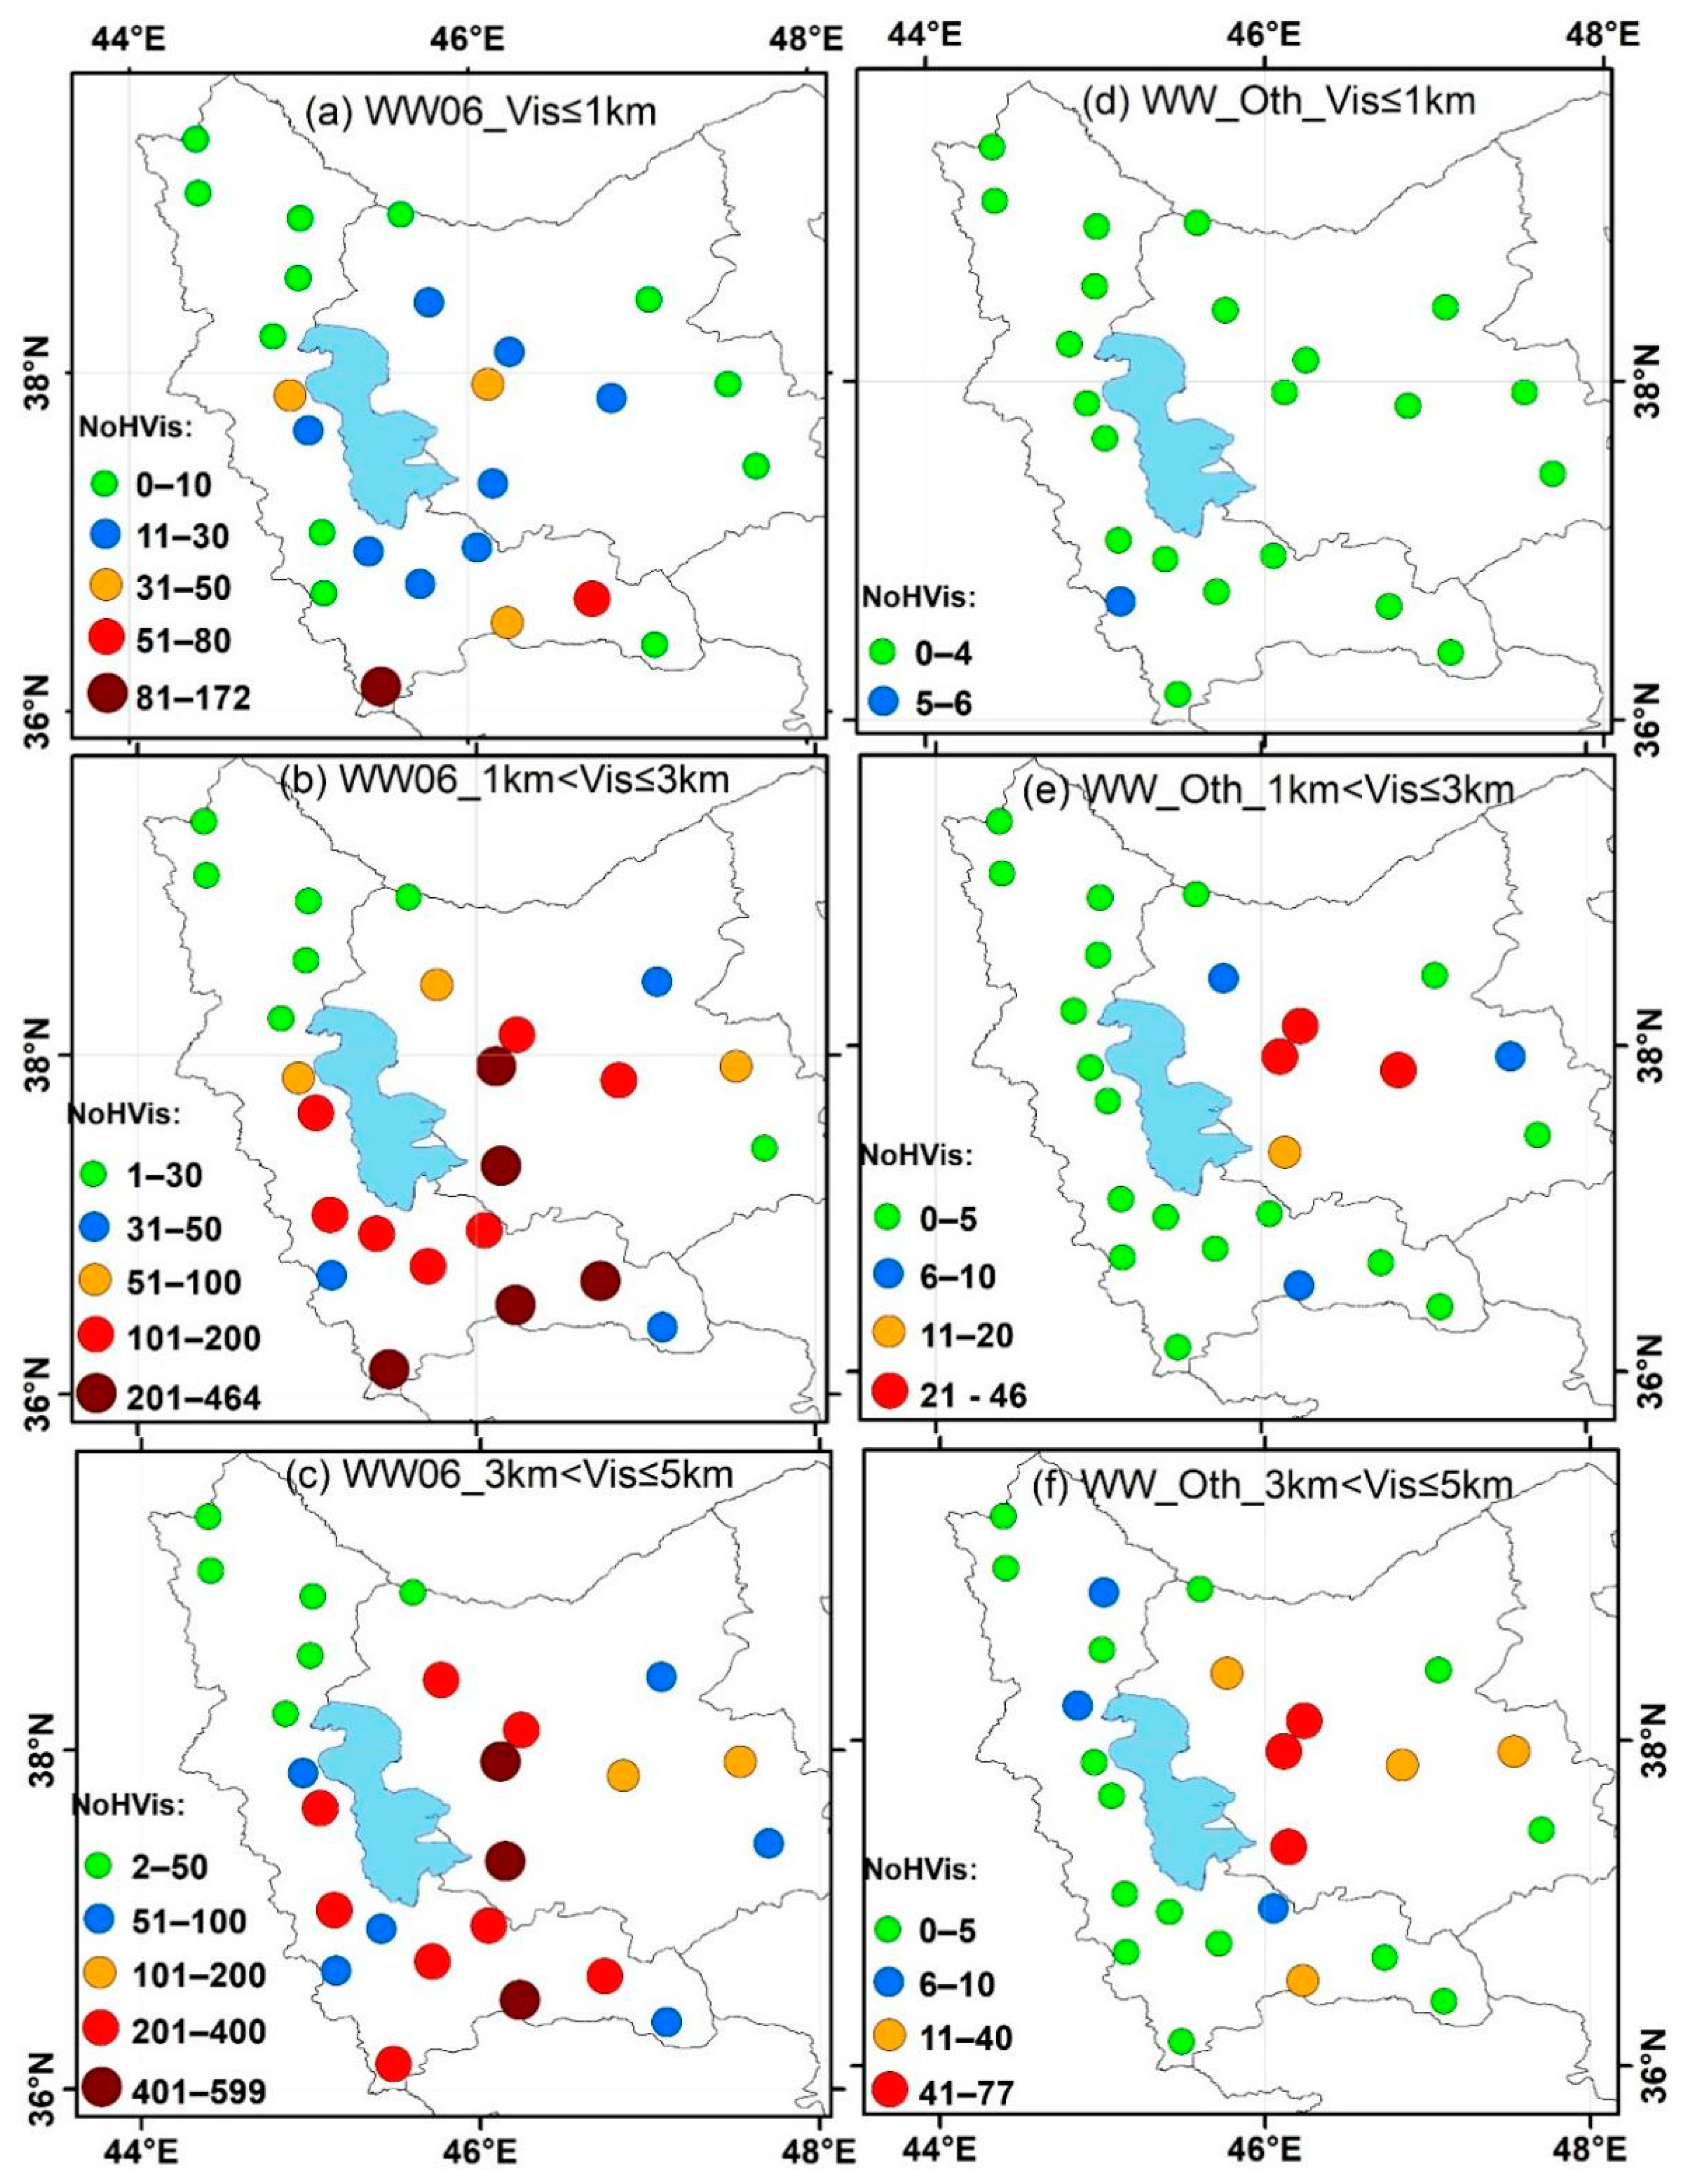
3.1. The Spatial–Temporal Distribution of Dust Events at the Synoptic Stations

In this study, we utilized the meteorological data of reduced horizontal visibility to analyze the occurrence of various dust phenomena (see Table 1) at the synoptic weather stations around the Urmia Lake. The data cover the period from 2009 to 2022, allowing for the determination of the contributing dust sources. Initially, all the synoptic weather stations in this region were analyzed, and those with better data filing were selected (in total 26 stations) (see Figure 1). Among the selected stations, 15 are designated as main synoptic stations (MS), maintaining visibility monitoring 8 times per day (from 00 UTC to 21 UTC). The remaining 11 stations are supplementary intermediate stations (IS), where visibility data are provided 5 times per day (from 03 UTC to 15 UTC). The horizontal visibility data and the weather codes selected at the meteorological stations were used for the identification of dust events, which were divided in two main categories:
  • The events related to widespread suspended dust (WSD) in the air, represented by the reported events with weather code 06 (WW06). This widespread dust originated from other sources far from the lake.
  • Other dust events typically accompanied by strong or gusty winds, referred to as blowing dust and sand storms (BDSS) (codes 07 and 30–35), that mainly represent dust events originated from the lake and/or nearby areas.
Based on the present weather reports from the synoptic stations, we computed the monthly number of dust events in the study area [30,72]. Subsequently, we examined the spatial–temporal distribution of dust events with varying intensities, based on the reduced horizontal visibility caused by these events. In this respect, we analyzed the frequency of events for each dust classification, taking into account the range of horizontal visibility. However, due to the low frequencies observed, we focused on analyzing and displaying the number of events rather than the frequency. Four classifications were selected based on Horizontal Visibility Ranges (HVRs): severe events (HVR ≤ 1 km), moderate-intensity events (1 km < HVR ≤ 3 km), weak events (3 km < HVR ≤ 5 km) and very weak events (5 km < HVR ≤ 10 km) [30].
To ensure the comparability of the number of dust events across the region, the reported dust hours from the supplementary synoptic stations were adjusted. To account for the difference in the number of observed dusty hours, the reported dust events from the supplementary stations were multiplied by a factor of 8/5. This adjustment allowed for the data from all 26 synoptic stations to be assimilated and analyzed together, providing a more comprehensive assessment of the dust events in the region. The standardized dataset facilitated the examination of the spatial and temporal distribution of both suspended and blowing dust events in the Urmia Lake region. By applying this adjustment factor, the possible uncertainties in the determination of the dusty hours between the stations with 5 and 8 observations per day were minimized. The temporal-averaging of the dust hours on the monthly and annual scales further reduced the impact of these observational differences, ensuring a more consistent analysis of the regional dust dynamics.
Additionally, the severity and characteristics of the dust events were assigned with codes based on the guidelines provided by the World Meteorological Organization (WMO). These codes, which include 11 categories, allow for descriptions for events accompanied by wind or other specific conditions [30,72]. Code 06 corresponds to the first category of dust events, while other codes (BDSS) represent the second category. Detailed information about these codes is presented in Table 1.
To evaluate the pollution potential caused by dust storms and their overall impact on public health, high-quality information is essential. However, due to the limited availability of quality-assured data on suspended particulate matter (PM) in this area, numerical prediction model outputs have been used to assess the standard indicators of near-surface suspended particles.
In this study, the DREAM8-NMME-CAMS model products from the Sand and Dust Storm Warning Advisory and Assessment System (SDS-WAS, Barcelona), affiliated with the World Meteorological Organization, were utilized to investigate the pollution potential caused by dust storms (available at https://dust.aemet.es; accessed on 5 March 2024). The characteristics of this model are detailed in Table 2.
For the study area, 3-hourly dust surface concentration data were obtained from the SDS-WAS archive for approximately 340 towns and villages, covering the period from 1 January 2012 to 29 January 2023. The model forecasts for the first 36 h of the dust surface concentration (DSC) were used, with the initial 9 h designated as spin-up. The forecast values from 12, 15, 18 and so on up to 36 h were averaged and extracted as the daily dust surface concentration (DSC) for each grid point. Subsequently, the daily time series of DSC (µg/m3) during this period, resulting in 3965 data points per time series, was calculated.
These time series were then arranged in descending order based on the daily concentration values, and the 80th, 90th and 95th percentiles and the maximum values were determined for each location. The daily concentrations corresponding to these percentiles were also compared against the range of daily PM10 concentrations (Table 3), regarding the classes of the air quality index (AQI). This comparison enabled an assessment of the pollution potential from dust storm impacts, as well as an approximation of the associated health concerns, based on the AQI values in the Urmia Basin (Table 3).

3.2. Terra/Aqua MODIS Aerosol Optical Depth and Ångström Exponent Data

Dust storms originate from an arid surface prone to dust emissions, and then, they propagate in the atmospheric boundary layer, while convection spans dust throughout the lower troposphere. Therefore, near-surface data, like the HVR, cannot reflect the presence of dust in the upper layers of the troposphere. To compensate for this lack, satellite data were also used in this study.
For nine adjacent cells of 1° × 1° (111 km × 89 km; latitude × longitude; see Figure 2) covering the Urmia Lake region, the time series of the daily aerosol optical depth at 550 nm (AOD550) and Ångström exponent at 412/470 nm (AE) were obtained from NASA/CNES Terra/Aqua satellites (MODIS instrument) in 2009–2022. The central (CNTR-cell) and northern (N-cell) cells cover the whole Urmia Lake, so they were excluded from statistical and trajectory analysis (although evaluative graphs were drawn for the cells), due to larger uncertainty in the retrievals of MODIS aerosol products over areas of high and variable surface albedo [75]. The city of Tabriz (the capital of East Azerbaijan Province) is located in the southwestern part of the northeastern (NE) cell, while the city of Urmia (the capital of West Azerbaijan Province) is located in the western part of the CNTR-cell.
Using the NASA Giovanni visualization tool [76] (https://earth.gsfc.nasa.gov/ocean/data/giovanni; accessed on 10 March 2024), the data series of the daily Terra and Aqua MODIS Deep Blue (MOD08_D3 v6.1 and MYD08_D v6.1 products) AOD550 and AE in 2009–2022 were extracted for each cell. The Deep Blue algorithm was selected as the most appropriate for investigations over bright surfaces (deserts, salted sands, etc.). The DB algorithm uses a constant land mask, so if the 1° × 1° cell includes some part of a drying water body, while in other seasons it is covered by water, then the surface reflectance becomes higher and the AOD may be overestimated. At the same time, the increased reflectance in cases of dried lake beds may significantly affect the AE values, since the salt reflectance is spectrally neutral like the reflectance of very large particles, so this low AE could be falsely attributed to a dust storm [76,77]. Furthermore, the MODIS time series were used as weights in the backward trajectories during the reconstruction of potential sources of aerosols in the Urmia Lake region.

3.3. Assessment of Coarse Aerosol Contribution to Aerosol Load over Urmia Lake

The Ångström exponent (AE) describes the spectral dependence of aerosol optical depth [77]:
AE = l n ( A O D 1 ) l n ( A O D 2 )   l n   ( λ 1 ) l n ( λ 2 ) ,
where A O D 1 and A O D 2 are aerosol optical depths at wavelength λ 1 and λ 2 , respectively. The AE is basically a quantitative indicator and inversely proportional to the size of the aerosol particles, so lower AE values (usually below 0.5) are associated with a higher fraction of coarse-mode particles (size of >1 μm), which are characteristic of desert dust [78,79,80].
In this study, cases with significant dust presence over the Urmia Basin were determined as those with AE < 1 from the MODIS time series. On these dusty days, backward trajectories were used in order to identify the potential sources that may contribute to the dust presence. It should be noted here that this approach is subjected to some uncertainties, since there is no AE threshold for the dust particles and secondly, because sea salt aerosol also exhibits a similar AE range with dust [80,81,82]. However, studies over the Middle East revealed a clear predominance of dust in coarse-mode particles, especially in the continental interiors, while in the case of Urmia Lake, sea salt particles from the lake’s surface may also contribute to the AE values, thus increasing the uncertainty in dust identification. Furthermore, sea salt over this region may also be theoretically reached from long distances like the Mediterranean, Black and Caspian seas [24].

3.4. Lagrangian Backward Trajectory Modeling

Five-day air mass backward trajectories were modeled using the NOAA HYSPLIT_4 (HYbrid Single Particle Lagrangian Integrated Trajectory; accessed on 10 March 2024) model [83,84], with NCEP/NCAR (National Center for Environmental Prediction/National Center for Atmospheric Research) Reanalysis gridded meteorological data [85,86] for the seven cells (excluding CNTR- and C-cells) surrounding the Urmia Lake (see Figure 1). The backward trajectories started (finished in real time) at the center of each of the cells at UTC 07:00 and UTC 10:00 (close to the overpass time of Terra and Aqua satellites, respectively; local solar time is UTC +03:00) at altitudes of 1.6, 1.9, 2.2, 2.5, 2.8, 3.1, 3.4, 3.7, 4.0, 4.3, 4.6 and 4.9 km amsl, which were selected by considering the following reasons. Since the average elevation of the Urmia Basin is about 1.5 km amsl, the first altitudes of 1.6, 1.9 and 2.2 km amsl (100, 400 and 700 m agl) characterize the atmospheric boundary layer (ABL) over the region, while the other heights were chosen by taking into account the seasonal vertical distributions of aerosols. As shown in Abadi et al. [24], most aerosols over the Urmia Lake region are contained in 1.5, 2.5, 3.5 and 1.5 km above the surface level in winter, spring, summer and autumn, respectively. So, the altitude of the trajectories less than 3 km amsl was used for winter and autumn, ≤4 km amsl for spring and ≤5 km amsl for summer.
Using the Concentration Weighted Trajectory (CWT; [87]) method, the spatial distributions of the regional contribution to the AOD550 over each grid cell in the Urmia Basin were reconstructed in this study. The CWT method is used widely to localize distant sources of atmospheric impurities, including aerosols [88,89,90,91,92,93]. In this study, the daily AOD550 values for AE < 1 over the grid cells were used as the weights of the backward trajectories. Since the localization of the sources of coarse aerosol emissions was of primary interest in this study, only the sections of the trajectories that propagate within the ABL over remote areas were taken into account. Based on the spatial distributions of all seven cells, the average potential sources were determined, which characterize the coarse aerosol transport to the Urmia Lake region.
The spatial distribution of AOD550 by Terra (or Aqua) MODIS data could be used for the qualitative validation of the contribution of distant sources, because it can be expected that an area with higher AOD550 has the potential to contribute more to the dust AOD over the Urmia Basin. However, precipitation events over the region (although very rare) may modulate the contribution of each area to dust AOD over the Urmia Basin.

4. Results and Discussion

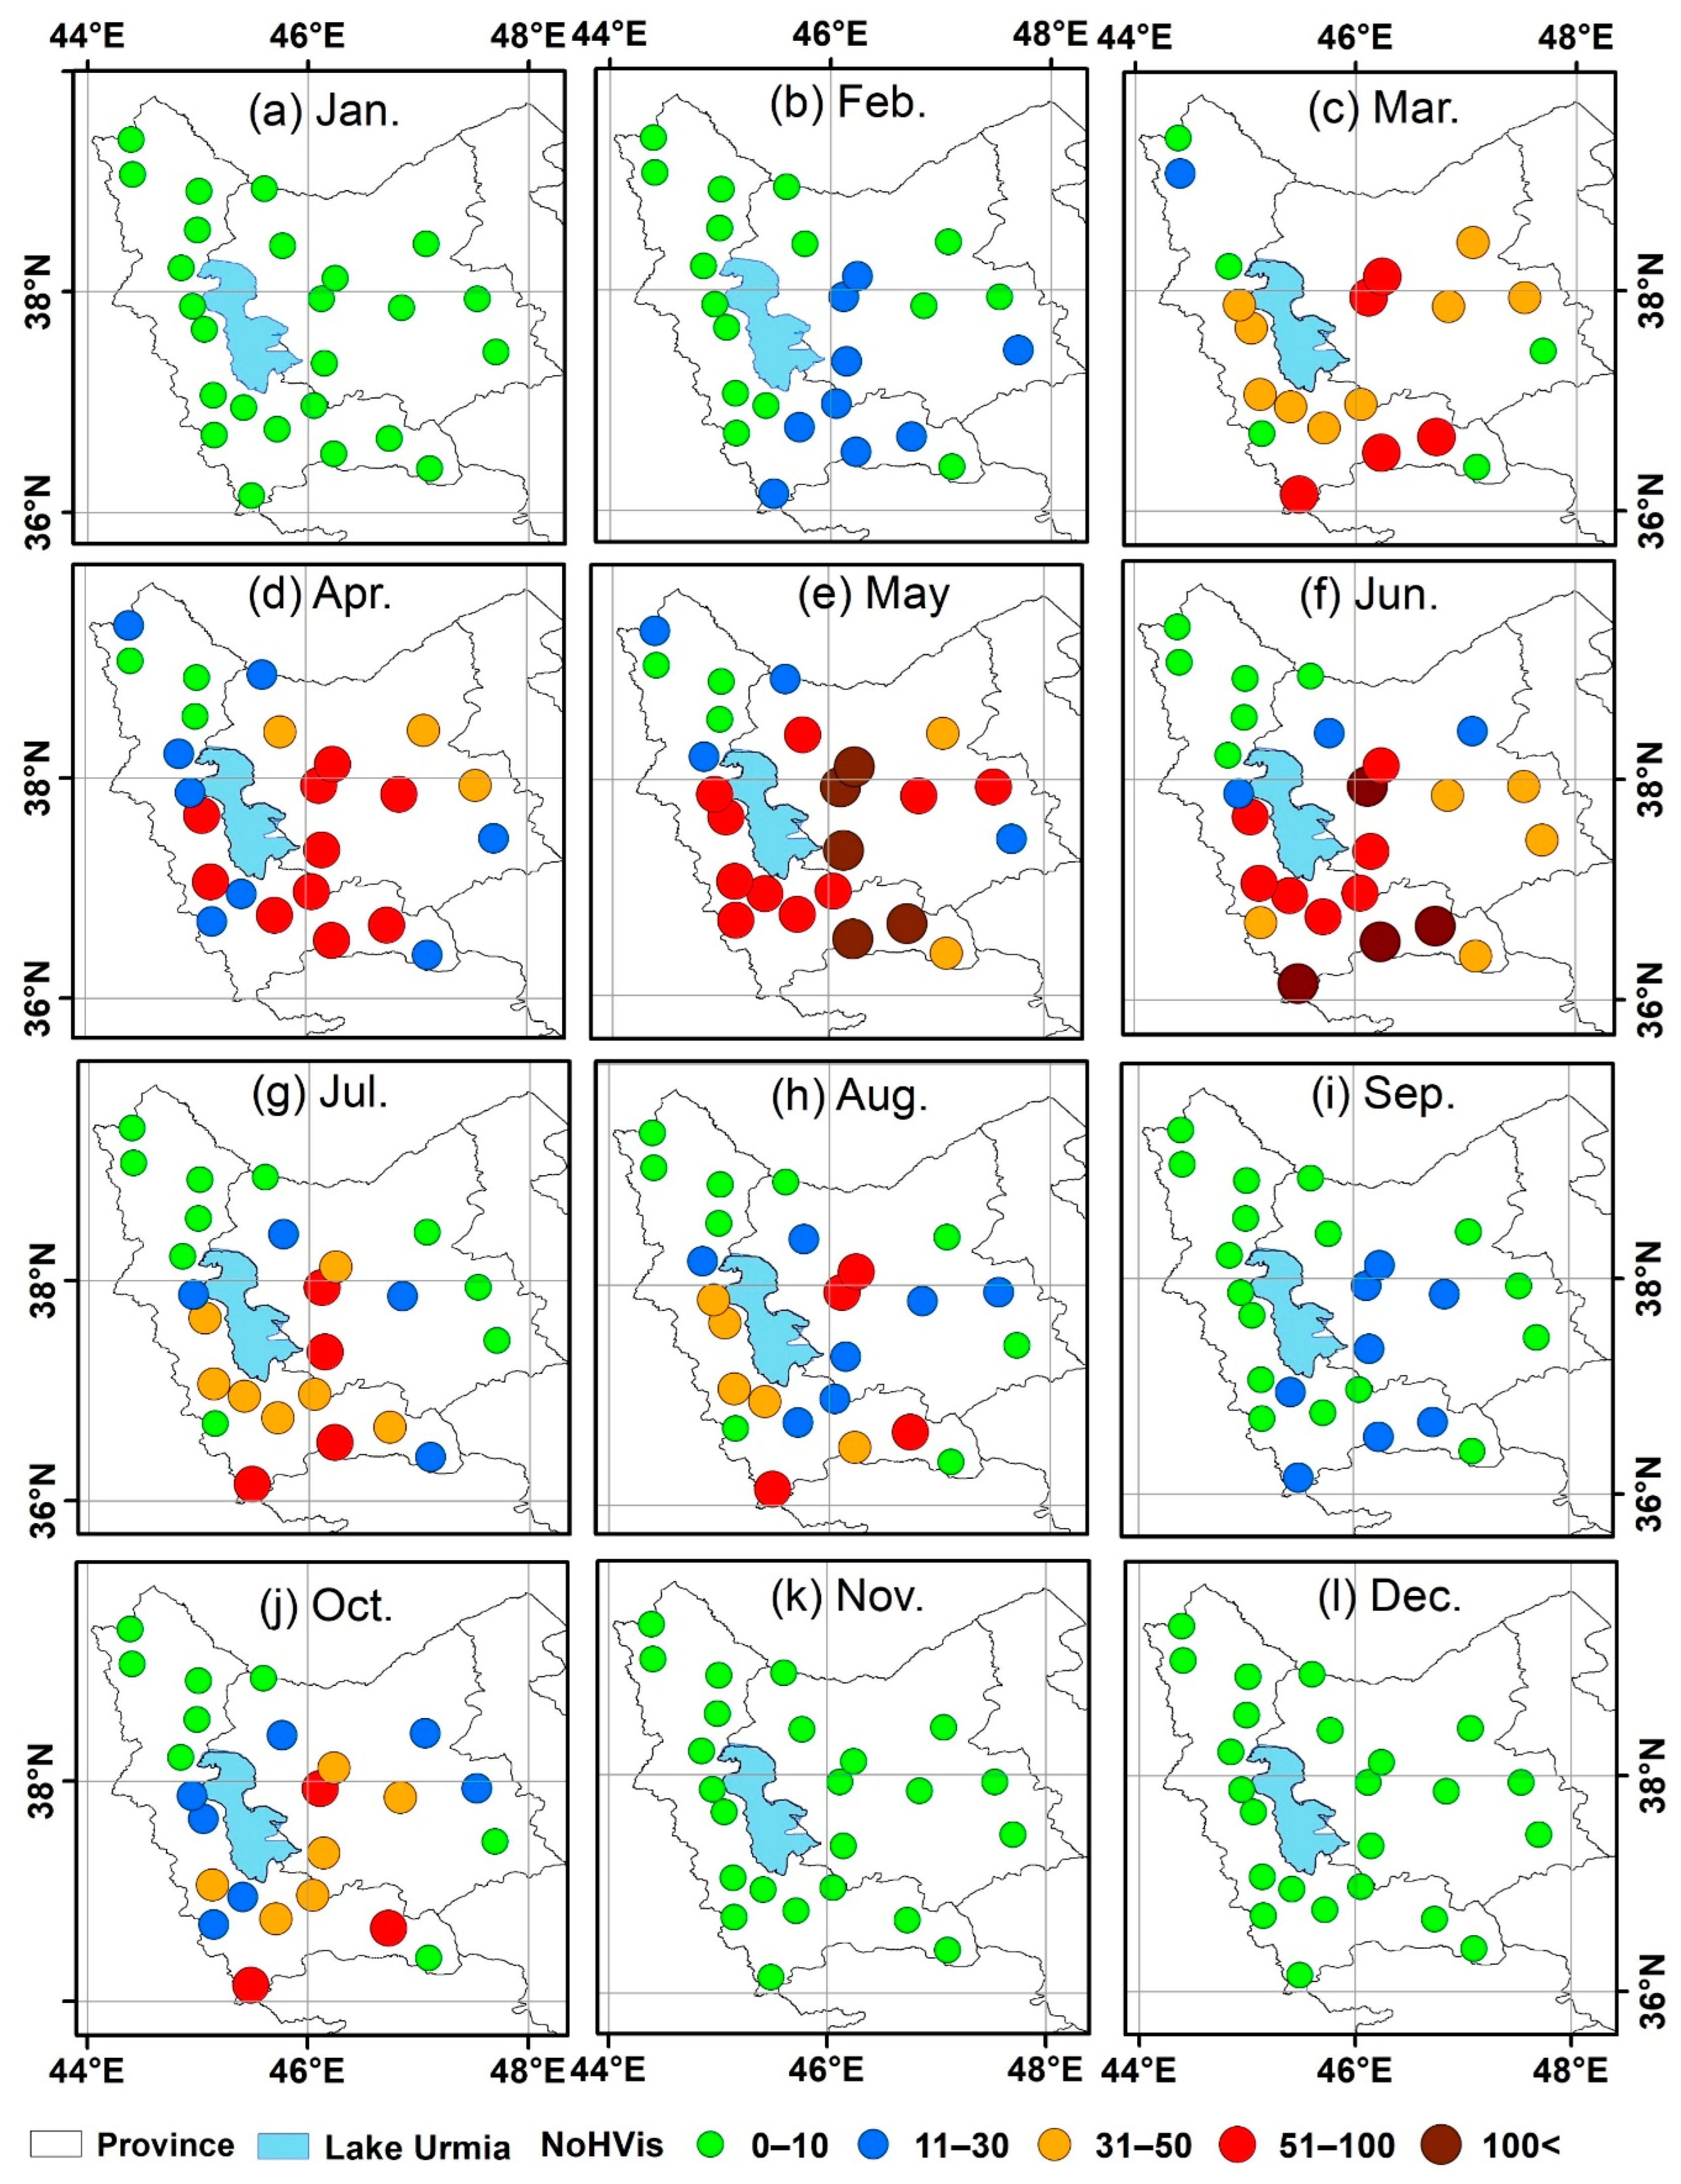
4.1. Spatio-Temporal Distributions of Dust Events

The dust events in the Urmia Basin were investigated by evaluating the spatial–temporal evolution of reduced horizontal visibility caused by WSD and BDSS. The range of visibility between the stations varied significantly, from a few meters in areas with high PM concentrations to over 10 km in areas with background conditions, also depending on the dust event and season. The PM concentrations are mostly attributed to airborne dust transported over the measuring stations from local, regional and/or distant sources, while the contribution of other sources like urban/anthropogenic pollution is limited in urban environments like Tabriz and Urmia city [49,94,95]. As mentioned above, four classifications of the dust events were considered based on the HVR, (i) HVR ≤ 1 (severe events) km, 1 km < HVR ≤ 3 km (moderate events), 3 km < HVR ≤ 5 km (weak events) and 5 km < HVR ≤ 10 km (very weak events).
Figure 3 and Figure 4 show the number of monthly dust events with horizontal visibility less than or equal to 5 km for WSD and BDSS, respectively. It was observed that the occurrence of airborne WSD (code 06), associated with low wind speeds in the observation site and dust emissions from distant sources, was less than 10 events in November, December and January. This finding could be explained by sufficient soil moisture due to precipitation during this season that prevents dust emissions and transport [34,70]. Furthermore, dusty air masses from southern arid regions are likely to be rainy washout before reaching the Urmia Basin, while the dust activity is at its minimum over the Middle East during the winter season [81,86,88].
From February onward, the number of dust events increased, while WSD events in the order of 51–100 are the usual scenario from April to June (Figure 3). May and June are recognized as the dustiest months regarding WSD events, which also exhibit a distinct spatial pattern with higher frequencies in the southwest and western regions of the Urmia Lake. This indicates a possible contribution of dried lake beds in suspended dust over these stations due to dominant southwesterlies in this season [34,70]. On the contrary, the NW part of the Urmia Basin, which is a mostly mountainous area, exhibits the lowest frequency of WSD events. The number of dust incidents decreased from July onward, with a relative increase in October.
Figure 4 illustrates the number of monthly occurrences of BDSS leading to a reduction in horizontal visibility to less than 5 km. According to Table 1, these dust events may be of various intensity, since several weather codes are included, although their frequency is significantly lower than that of WSD. Therefore, most months present a low number of BDSS occurrences (less than six cases). The maximum number of incidents during the studied period was reported in March and April, with slightly less frequency in May. The eastern part of the Urmia Basin exhibited the highest number of episodes (up to 48 cases) in March, which suggests a notable contribution of local sources, i.e., dried lake beds in the eastern and southern shores of the lake [96,97]. It is worth noting that medium-scale convective storms, which typically occur in the spring season, appear to play a significant role in generating strong winds associated with dust events in the region [34,70].
In October, the number of BDSS events in the eastern sector of Urmia Lake increased. This increase can be attributed to factors including (i) land surface conditions, (ii) increase in wind speed and topographic features. The drying of the soil surface due to the cessation of agricultural activities, such as the plowing and irrigation of fields, can lead to an increased availability of fine dust particles on the land surface, contributing to the increase in local blowing dust events. The combination of these factors—the changes in land surface conditions, seasonal weather patterns and the local topographic influences—likely led to the observed increase in the number of local blowing dust events in the eastern sector of Urmia Lake in October.
Figure 5 illustrates the total number of occurrences of WSD and BDSS with different intensities (three classes) during the study period. The left column represents the total occurrences of airborne WSD, while the right column refers to BDSS. Figure 5a,b show that the number of severe dust events (HVR ≤ 1 km) classified under the WSD was significantly higher compared to BDSS events, which were relatively few (up to six events). Notably, the majority of WSD events was observed at stations far from the lake, along a line stretching from southwest to northeast. These dust events are not generated in the proximity of the stations or in their immediate surroundings and are not accompanied by strong winds. It appears that intense dust events generated in the Iraqi plains sometimes enter this area through southwesterlies [89,98]. Depending on the regional topography, i.e., the direction of valleys and mountain ranges, as well as the position and altitude of the stations, downstream areas are affected by these dust events with varying intensities. The effect of the local topography is reflected by the significant spatial heterogeneity in dust storm events between the stations in the Urmia Basin.
For medium-intensity events (1 km < HVR ≤ 3 km), there is a substantial increase in the number of WSD cases around the lake (Figure 5b), except its northern part, while BDSS (1 km < HVR ≤ 3 km) occurrence is also higher in the eastern part of the Urmia Basin. Severe events of WSD are much lower, but they generally exhibit a similar spatial pattern, with higher frequency at stations located south and east of the lake, while severe BDSS are very few (0–4 events at nearly all the stations) (Figure 5a,b). Similar patterns also exist for events with weak intensity (3 km < HVR ≤ 5 km), which, however, exhibit much higher frequencies (Figure 5c,d).
The number of dust events indicates that as the intensity increases, their frequency decreases, with the same feature observed in all previous studies in the Middle East [30,71]. This is because intense dust storms require specific meteorological conditions for their occurrence, while weak-to-moderate dust episodes over the arid/desert environment of the Middle East is a common scenario. Specifically, the total number of severe, moderate and weak dust events classified under WSD is 550, 2832 and 4498, respectively. For the BDSS dust type, 48, 155 and 339 events were reported during the study period for the same dust classes. Although widespread dust suspended in the air occurs more frequently than dust storms in this region, the occurrence of storms suggests that the dried areas of the Urmia Lake have the potential to emit large amounts of dust [97,99]. However, these arid, dried conditions have not progressed to the degree such that severe dust storms may frequently impact the region.
The spatial distribution shown in Figure 5 indicates that WSD was predominant in the southern, eastern and western parts of the Urmia Basin, while BDSS occurred more frequently in the eastern and southeastern parts of the region. Considering that these events are commonly observed between March and May, it seems that winds generated by mesoscale convective systems in the spring season, particularly during periods with low precipitation, play a crucial role in the presence of blowing dust over the Urmia Basin [53]. Moreover, the number of moderate-to-intense (HVR ≤ 5 km) and weak dust events (5 km < HVR ≤ 10 km) decreased as we move away from the Urmia Lake. This finding suggests the involvement of the dried lake in local dust emissions, potentially influenced by favorable meteorological conditions [53,99,100].
The current findings provide valuable insights into the spatial and temporal distribution of dust events in the Urmia Lake region covering a long period. Understanding the seasonal patterns and intensity of these events is crucial for developing effective mitigation strategies and assessing their impact on air quality and human health. Further research may focus on investigating the specific sources and mechanisms driving dust emissions in the region, as well as the long-term trends and potential climate change implications.

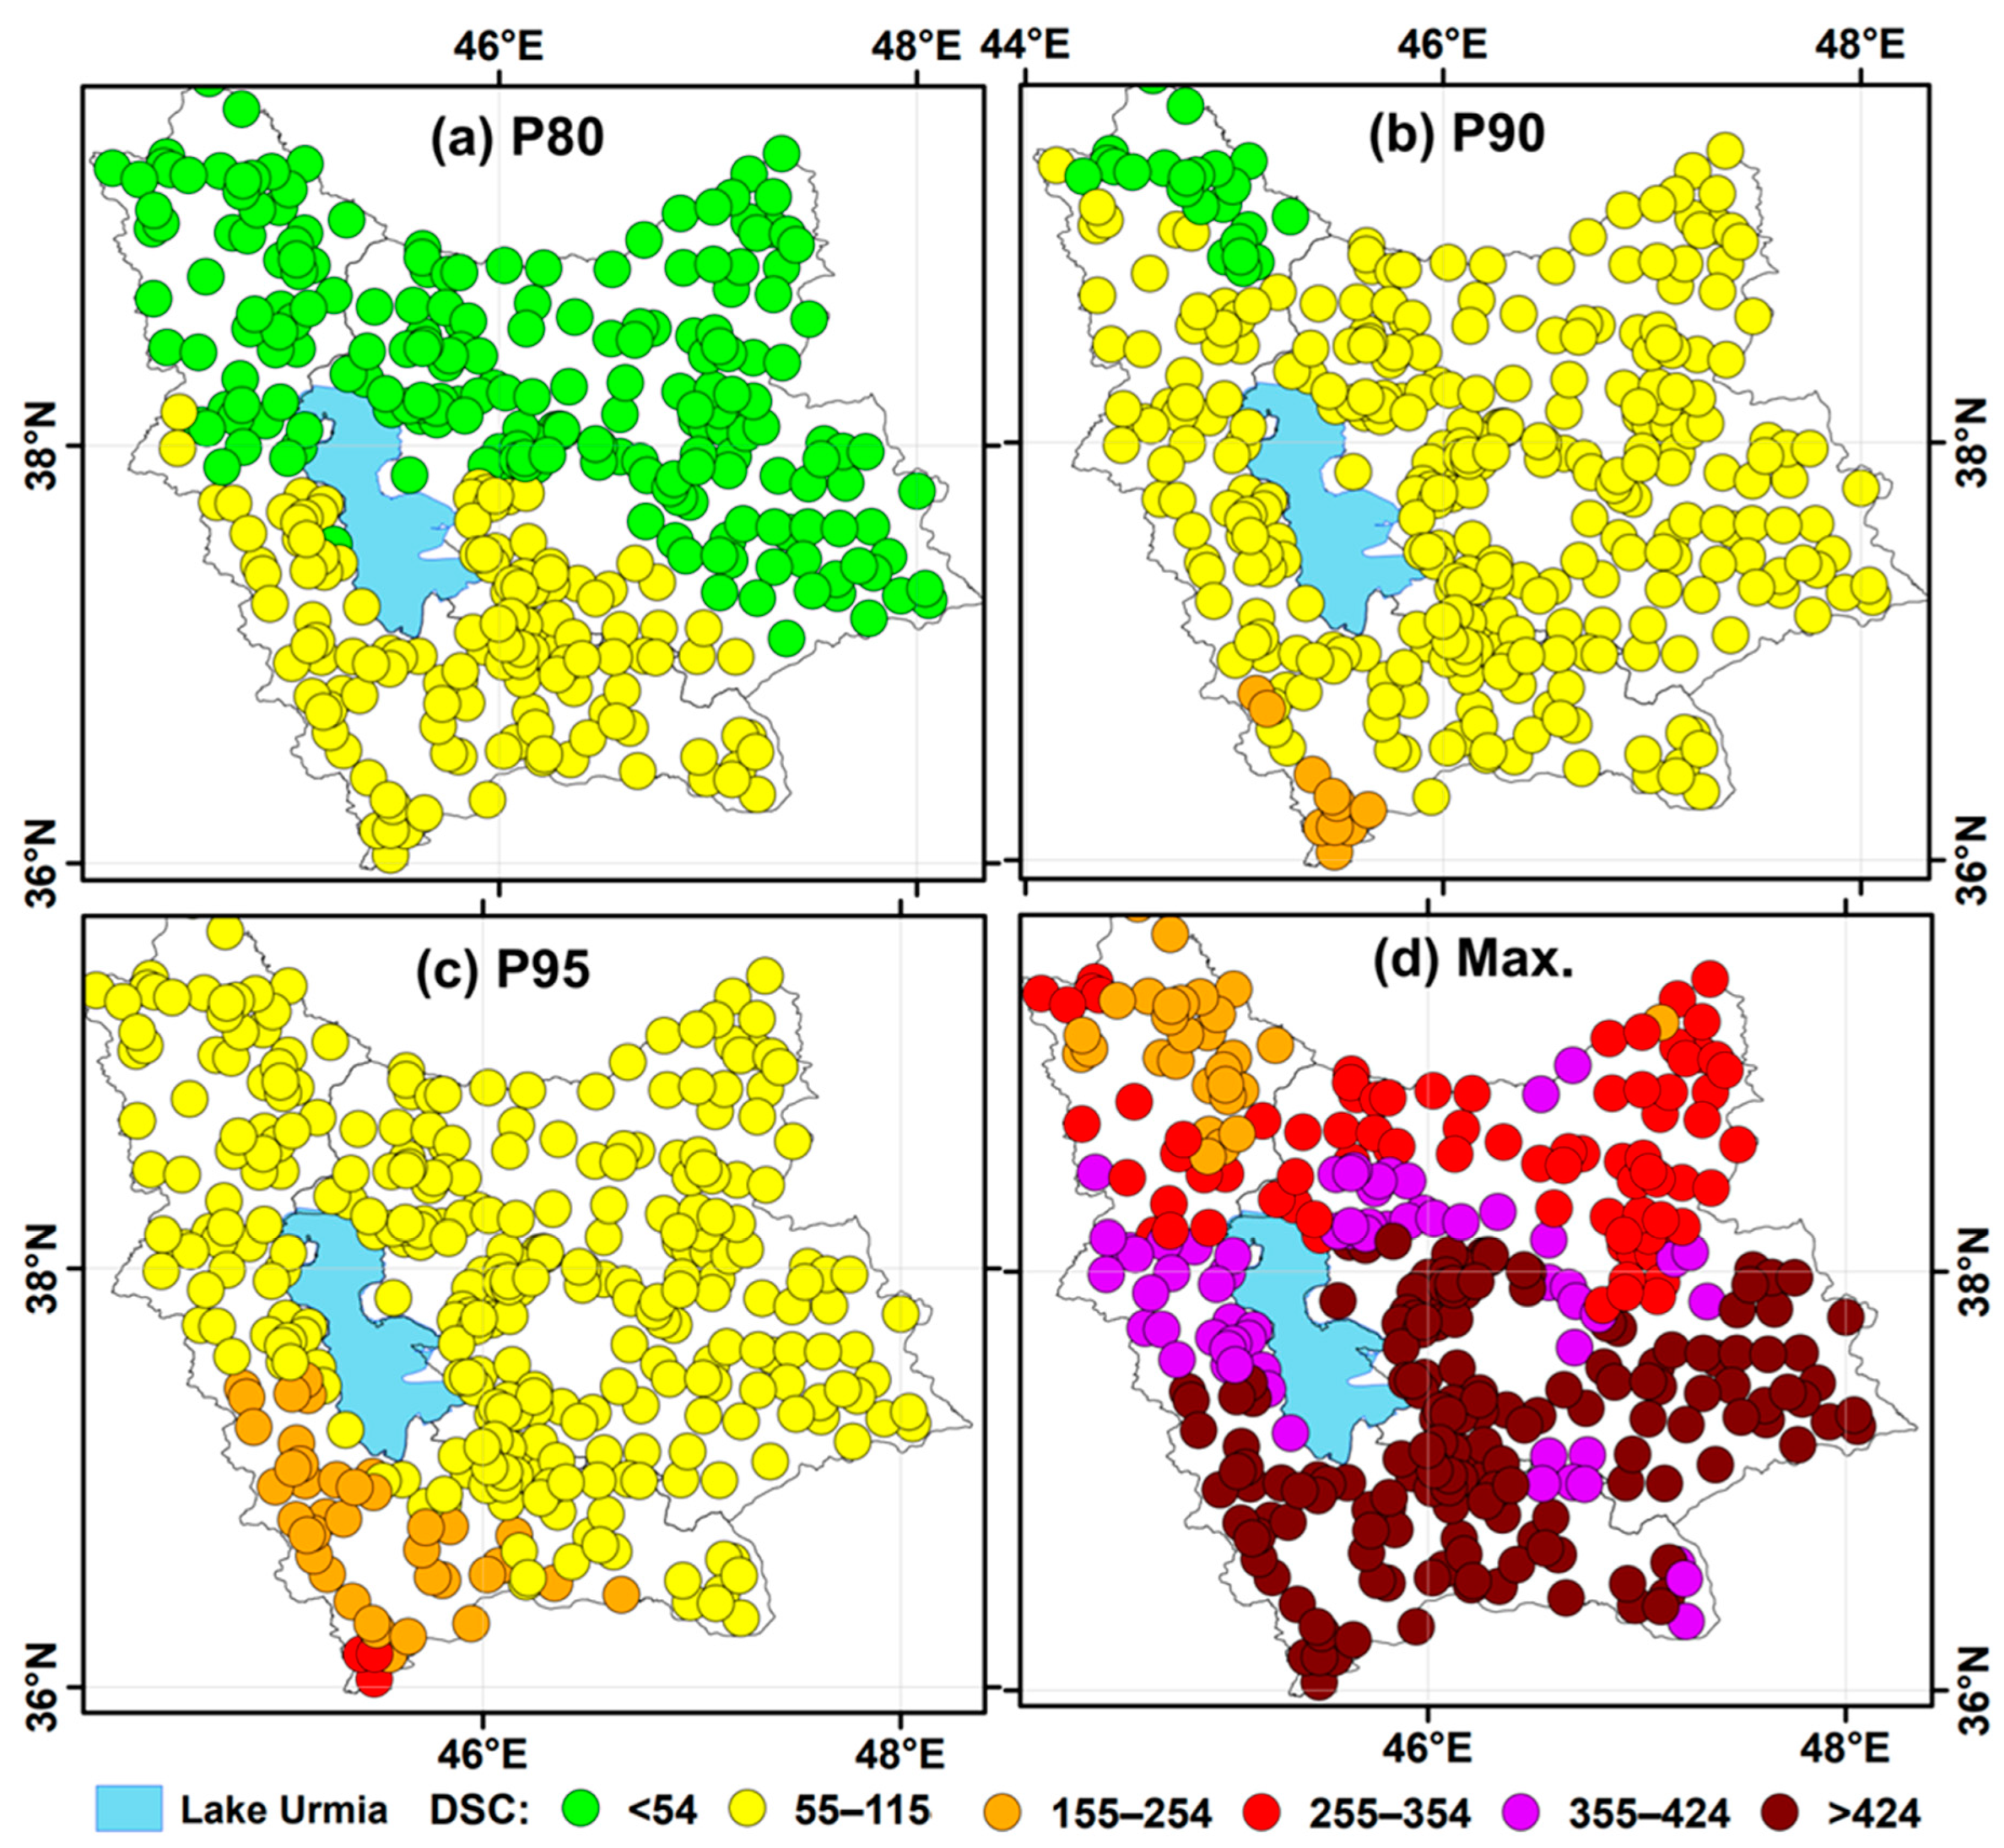
4.2. Potential Pollution in the Urmia Basin through the Modeled AQI

This section analyzes DREAM8-NMME-MACC model simulations of near-surface dust concentrations and evaluates them according to AQI classes and potential health effects. The DREAM8-NMME-MACC products were taken from the SDS-WAS (Sand and Dust Storm Warning Advisory and Assessment System) modeling prediction system due to the lack of suitable measured data in the Urmia Basin. However, the uncertainty of the model outputs has not been directly investigated in this study. Nevertheless, according to previous studies, the DREAM8-NMME-MACC model has shown promising performance compared to other operational models in predicting dust concentrations [101]. However, the model generally underestimated the dust concentrations, except for high-concentration cases (values greater than ~0.3 gm−2), where the DREAM8-NMME-MACC model adequately predicted the concentration values, while other models tended to underestimate [100].
In a previous evaluation study, Karami et al. [102] assessed nine operational dust models in forecasting different types of dust events in the Middle East. They found that the outputs of the NASA-GEOS and DREAM8-MACC models were closer to satellite and AERONET observations in most cases and also exhibited the highest correlation coefficients (R2 = 0.78) in AOD predictions. Although the uncertainty of the DREAM8-NMME-MACC model has not been directly investigated in the current study, the existing literature suggests that this model has shown promising performance in predicting dust concentrations, particularly for high-concentration cases.
Figure 6 displays the 80th, 90th and 95th percentiles, as well as the maximum dust surface concentrations (DSCs), as predicted by the DREAM8-NMME-CAMS model for urban and rural areas in the Urmia Lake region. It is important to note that these values represent the surface concentrations of suspended dust particles for eight transport size bins (0.1–10 µm). Therefore, they provide an overview of the potential pollution caused by desert dust rather than specific PM10 values. To assess air quality conditions, the average values of the considered suspended particle concentrations were associated with the air quality index (AQI) classes based on PM10 (Table 3).
Figure 6a indicates that in 80% of the DSCs, the health concern associated with dust pollution in the area was classified as good, especially in the northern part of the studied area, suggesting a low pollution potential. Meanwhile, the level of health concern was moderate in the southern part of the region. Approximately 20% of the study period exhibited semi-healthy air quality conditions in the southern half of the study area (Figure 6a). The 90th percentile of DSC reveals that almost all areas around Lake Urmia experienced a moderate level of health concern (Figure 6b). Only a small part in the southwest region experienced unhealthy air conditions for sensitive groups, likely influenced by dust originating from the Iraqi deserts [88].
The analysis of the 95th percentile shows that the air quality was classified as moderate for the entire region, with the southwest area experiencing unhealthy air conditions (Figure 6c). The values of the daily maximum dust surface concentrations indicate that in most of the stations around Lake Urmia (Figure 6d), the level of health concern transitioned from unhealthy in the northern part to very unhealthy and hazardous air conditions in the southern and eastern parts of the lake (Figure 6d), suggesting that these areas were most affected by severe dust events.
The current findings contribute to the understanding of the pollution potential and air quality conditions influenced by desert dust in the region. Overall, the analysis of the surface concentration of suspended particles suggests that the area around the Urmia Lake is susceptible to desert dust pollution. The southern parts of the Urmia Lake, in particular, consistently experience poor air quality conditions, reaching unhealthy and very unhealthy levels. This indicates the potential impact of dust emissions from distant sources.

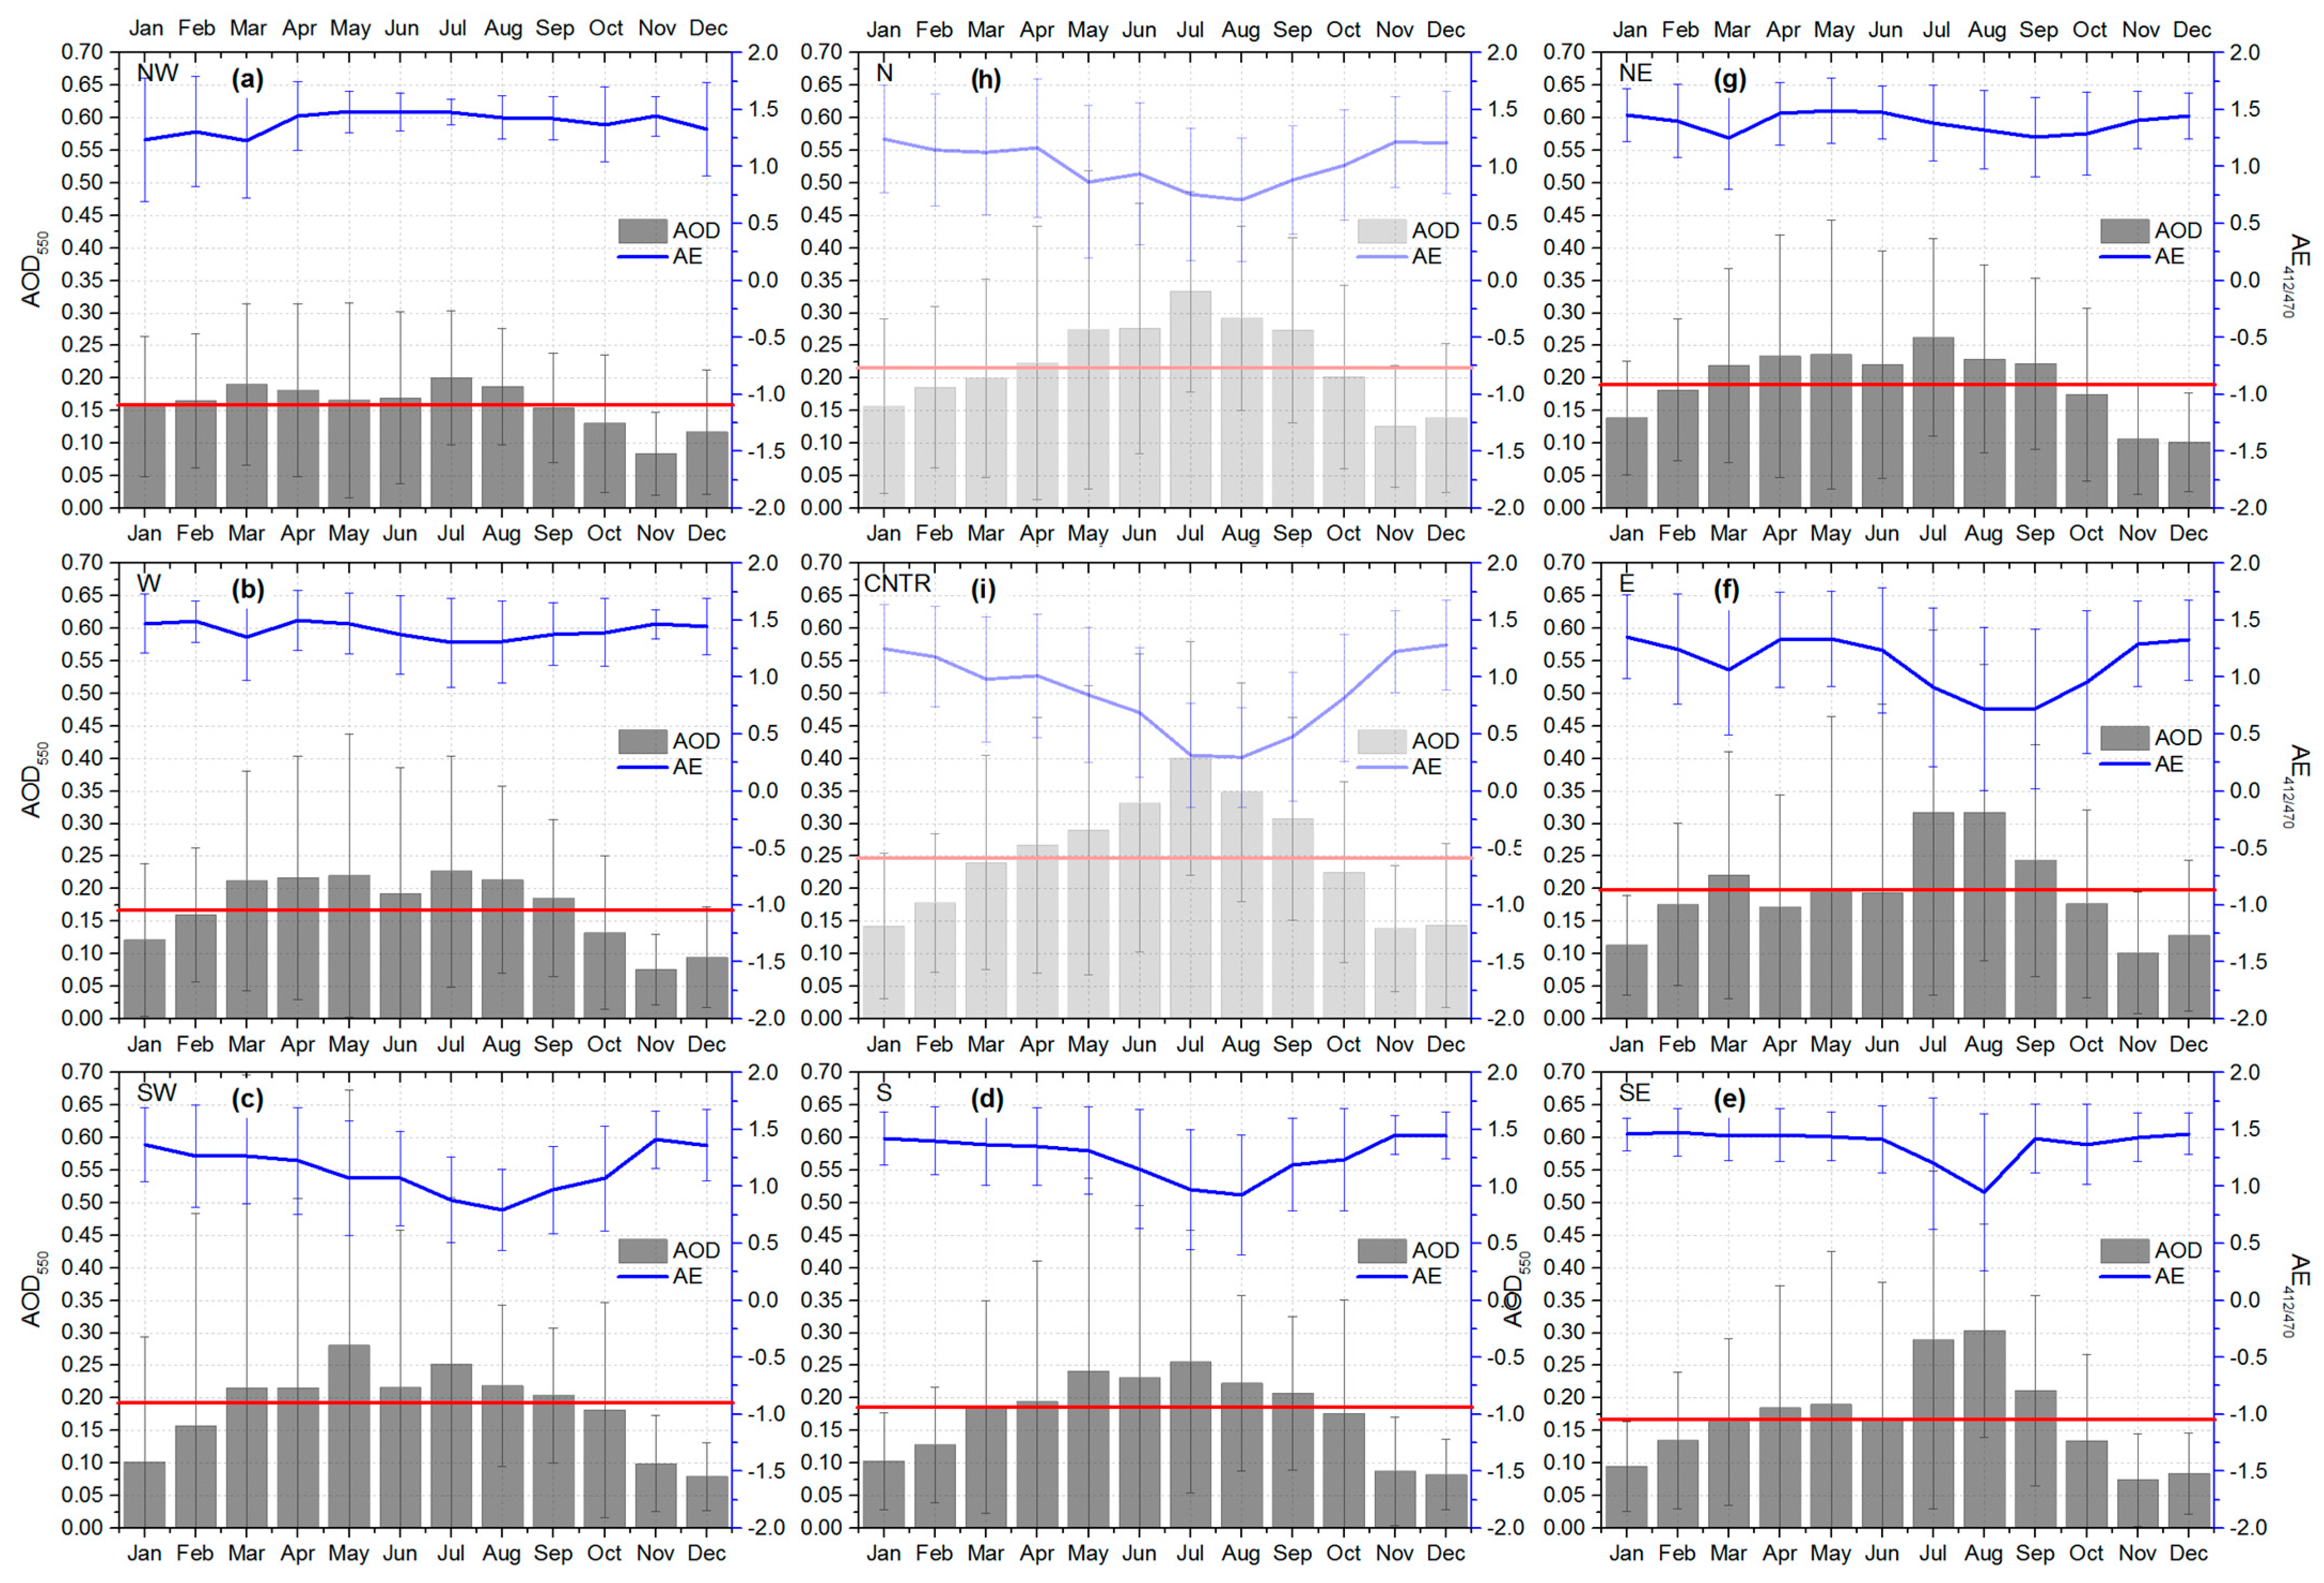
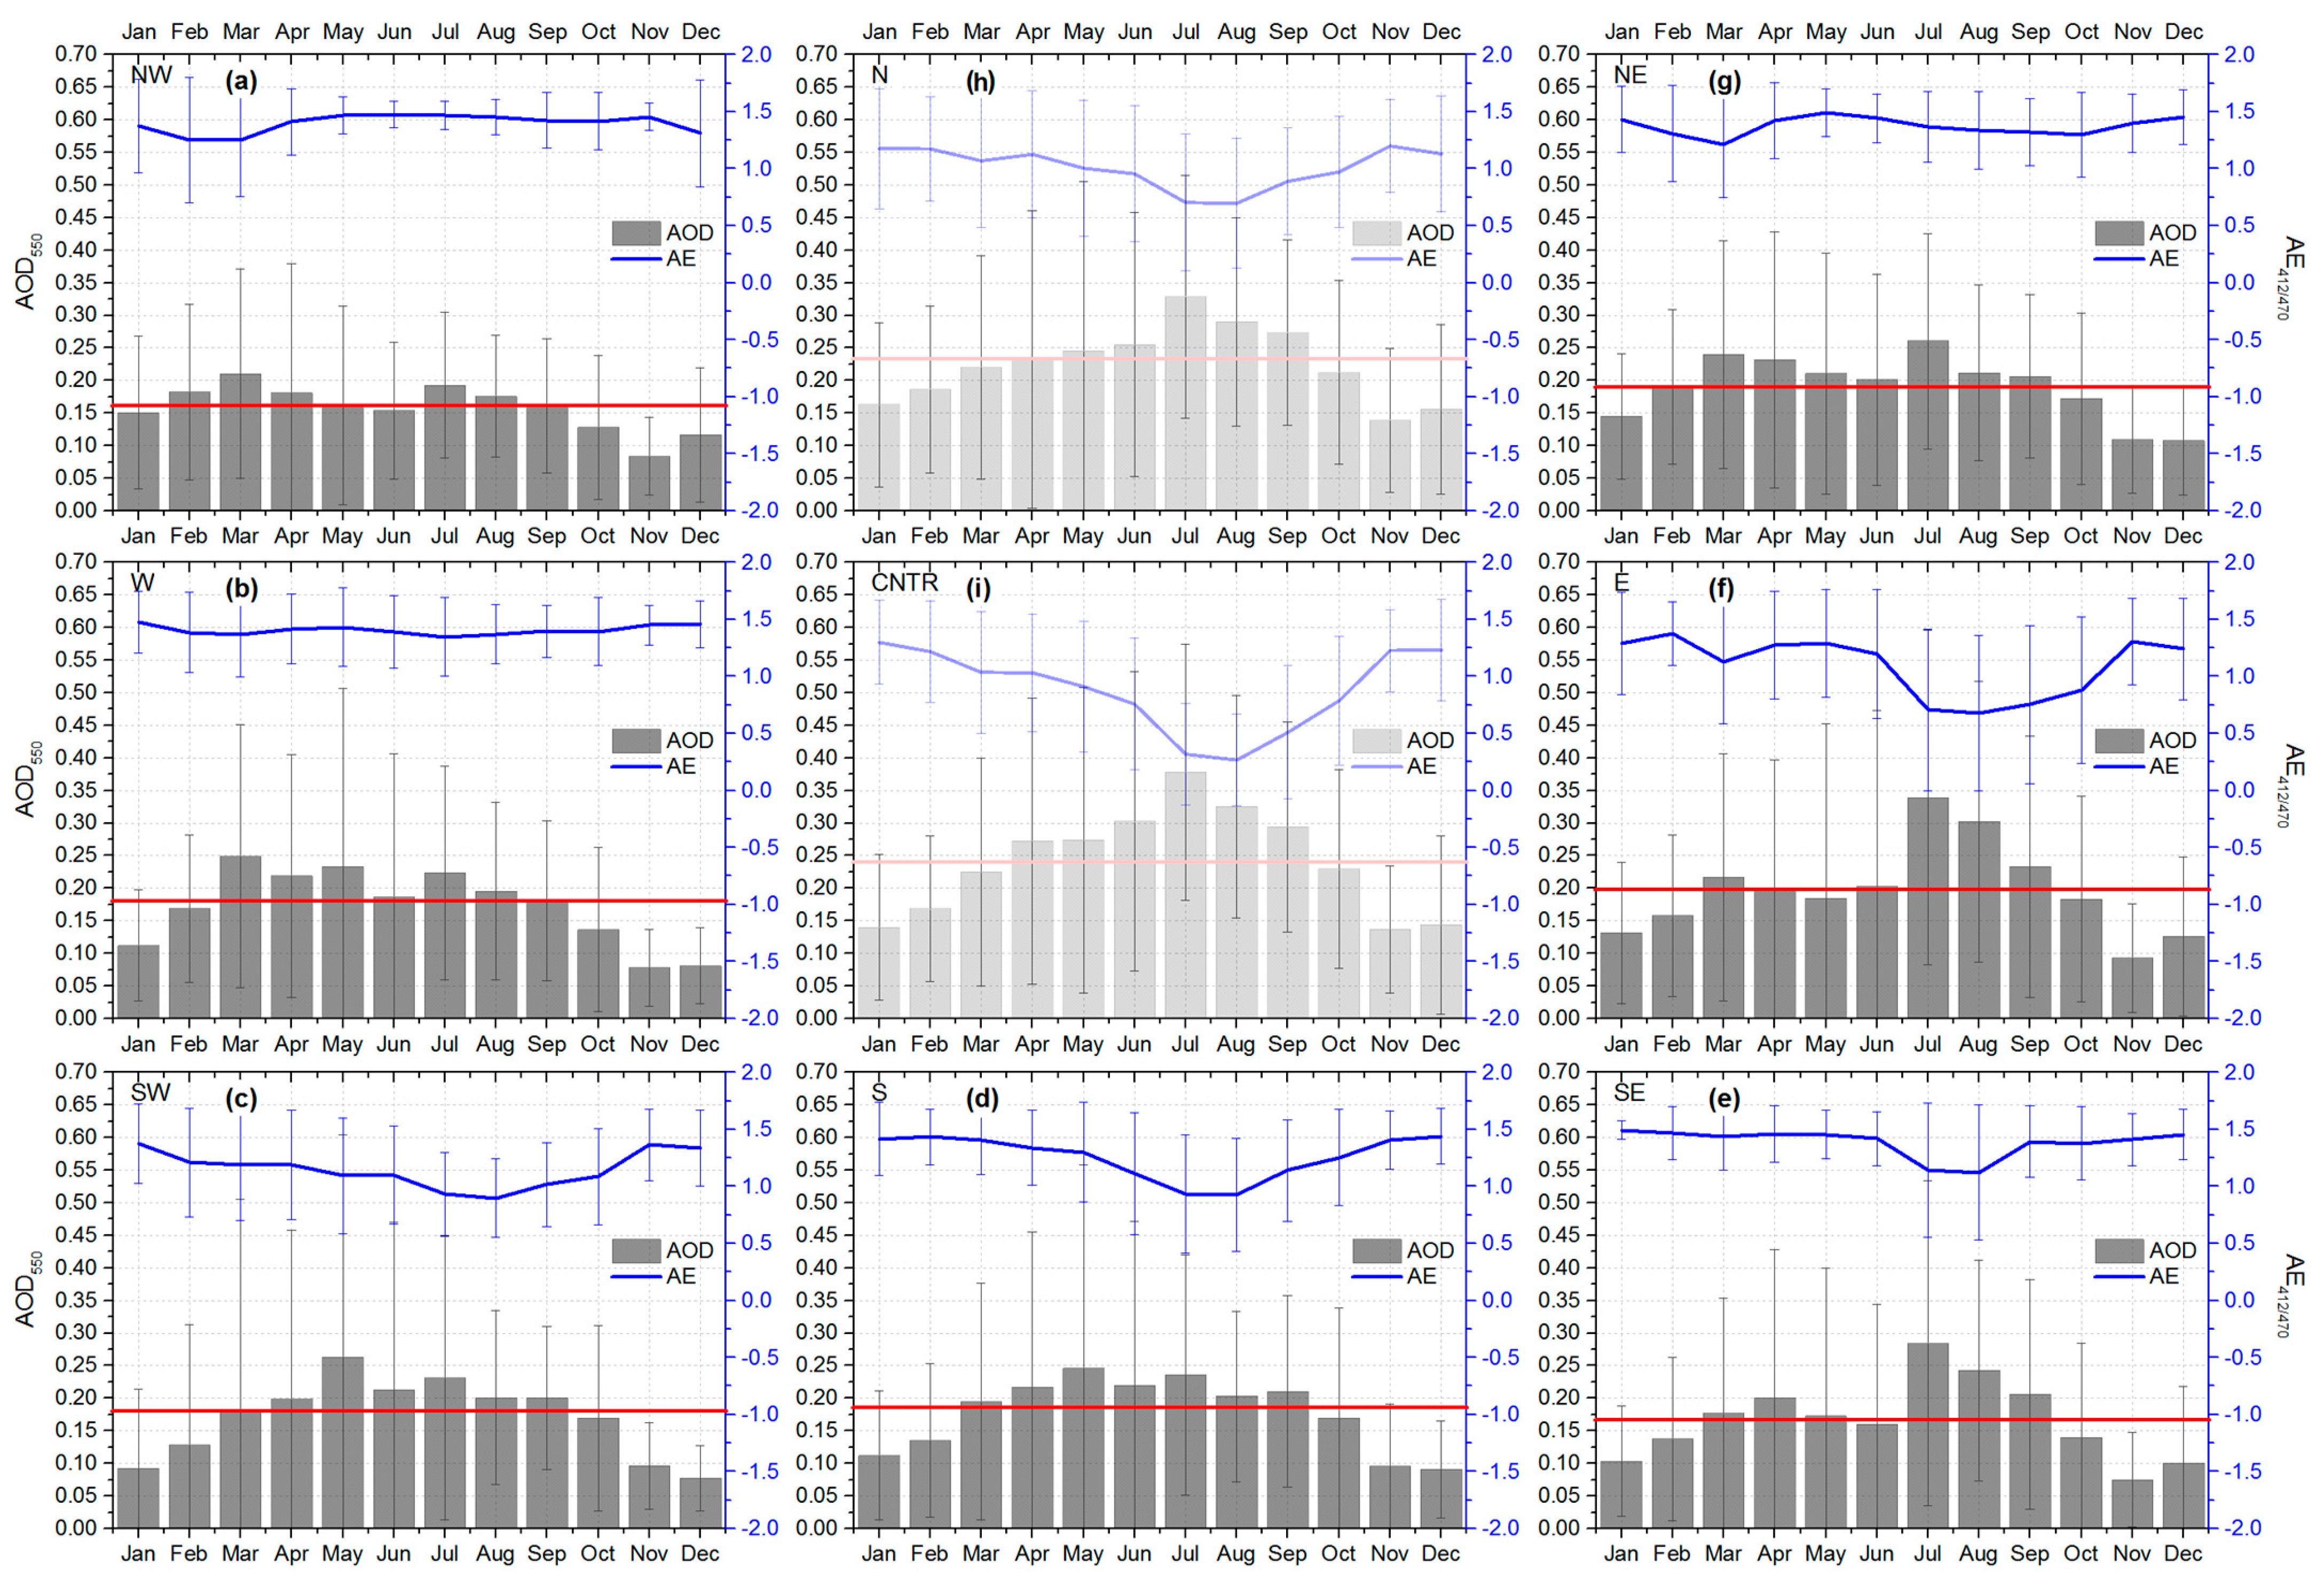
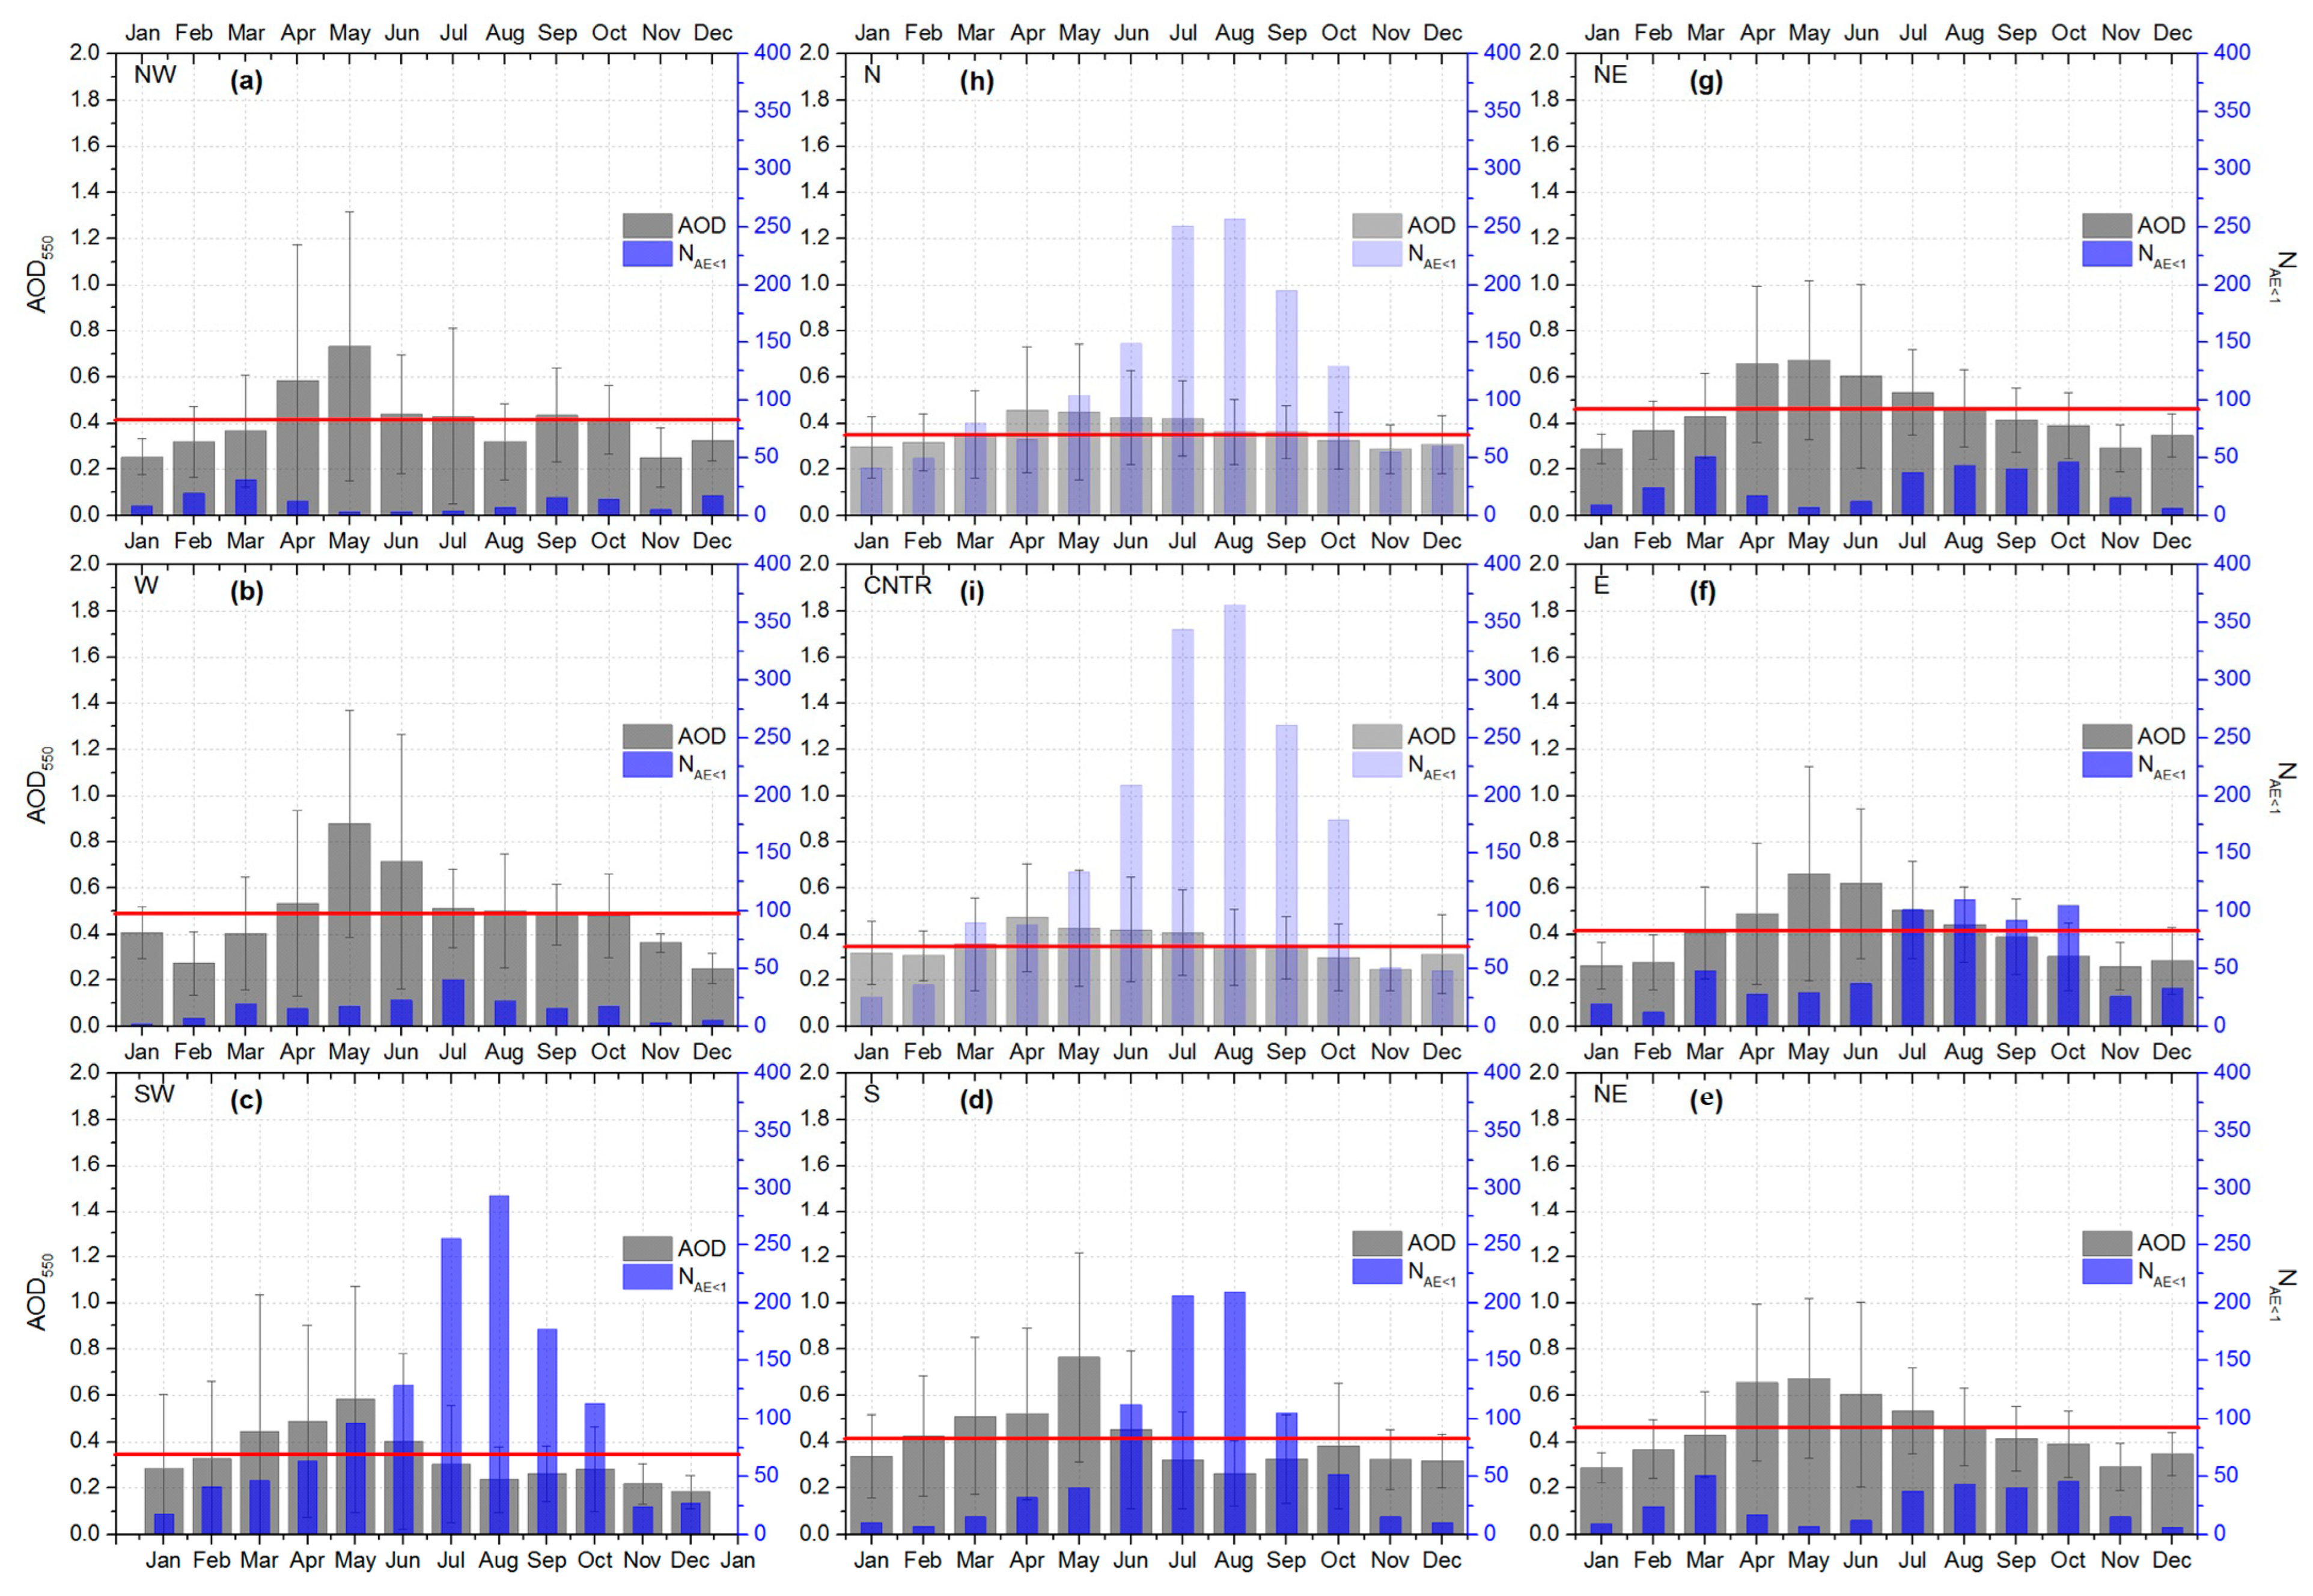
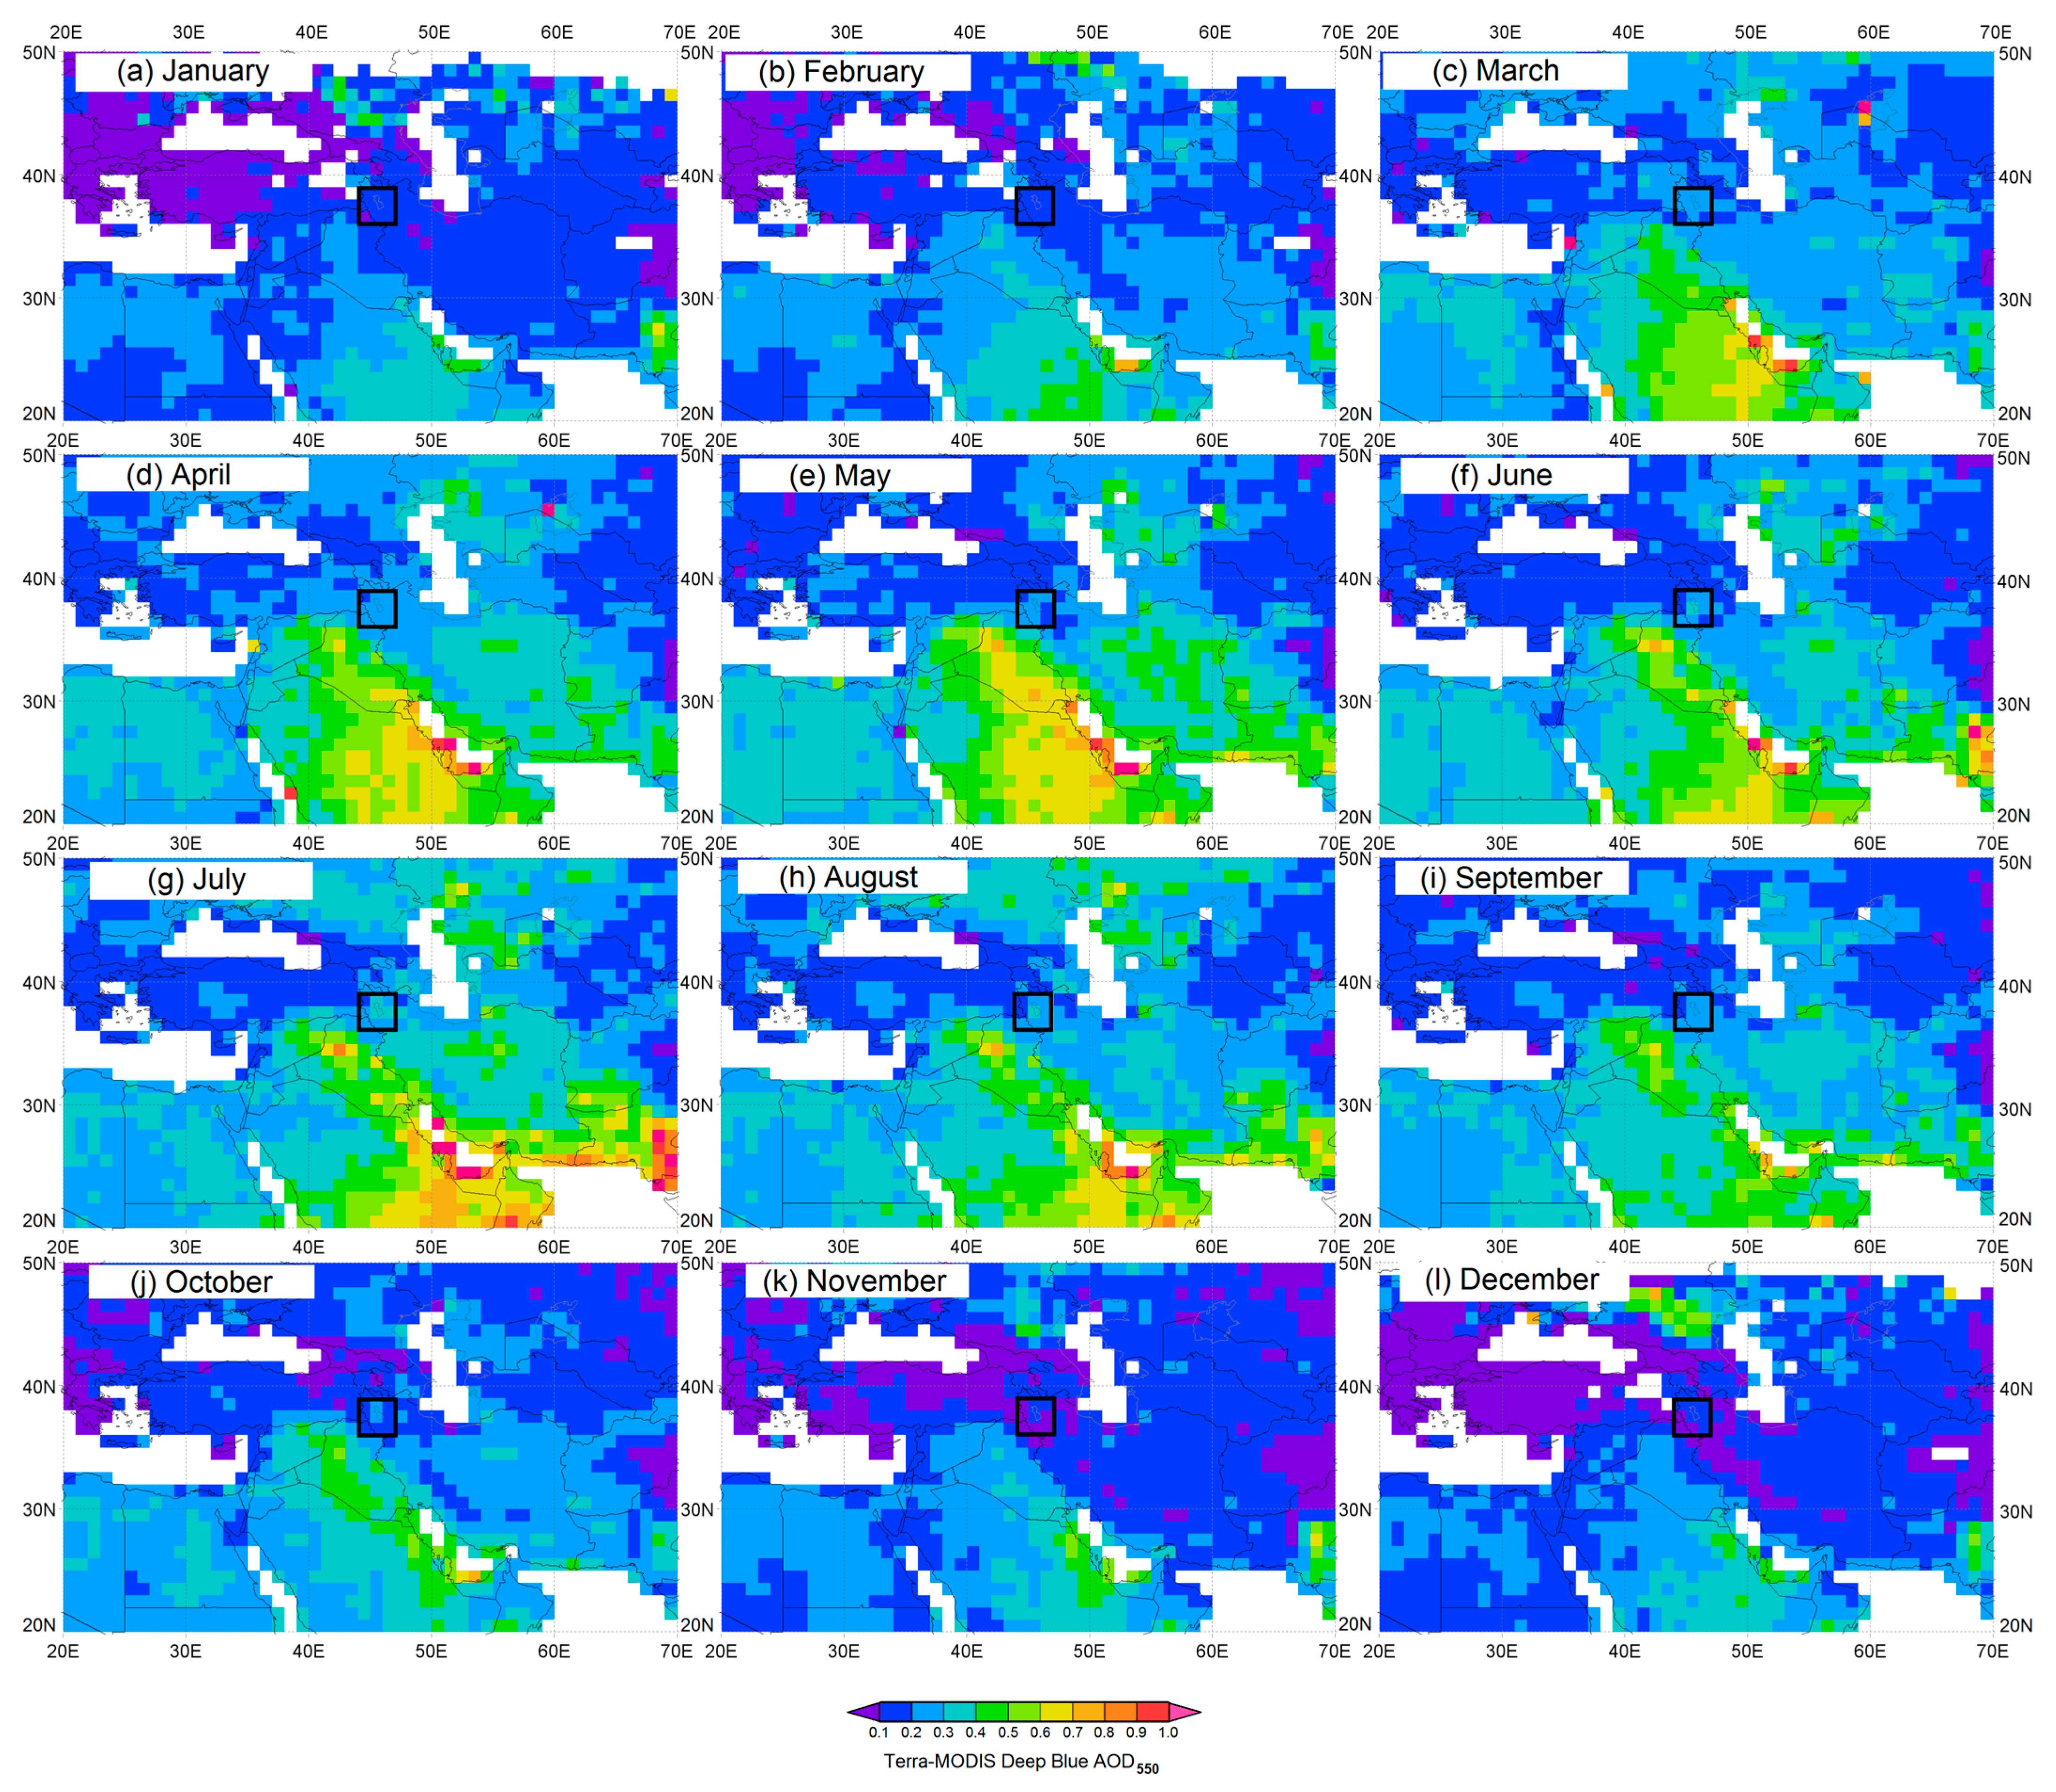
4.3. Intra-Annual Variations in AOD550 and the Ångström Exponent over the Region

Figure 7 shows the monthly mean variations in the AOD550 values (bars) and the Ångström exponent (AE) (blue lines) over the grid cells in the Urmia Basin during 2009–2022. All the cells, except S and SW, are characterized by bimodal AOD550 patterns with wide spring and summer modes and maxima in March/April and July. In the SW- and S-cells, the distributions are unimodal with a single broad spring–summer mode, which may be due to the relatively greater (among others) proximity of these cells to active sources of dust aerosols in Syria–Iraq and in deserts in the Arabian Peninsula. In all the east cells, there is a remarkable increase in AOD550 in July, which is not seen in the western cells. Therefore, it is speculated that in the summer months, the effect of the desiccated lake on the aerosol loading in the eastern Urmia Basin may be significant, as can be seen from the mean AOD550 values of 0.25–0.3 in July. The current analysis of the AOD variability at various pixels around Urmia Lake reveals different patterns between western and eastern cells, thus underlying a local effect on dust variability, which are the sources in dried lake beds.
Based on the pattern of the intra-annual AE variation, the cells can be divided into two groups. In the first group (NW, W and NE), the AE exhibits nearly constant values (~1.3) with marginal monthly variability, while the AE slightly decreases in March. In the second group (SW-, S- and SE-cells), the AE exhibited a distinct minimum (0.9–1.0) during the summer months, indicating a larger contribution of dust aerosols. Since the region is under the dominance of southwesterlies [71,72,99], the decrease in the AE values in summer in the southern parts of the Urmia Basin suggests the influence of coarse-mode aerosols from distant sources in the south/southwest sector. The last cell (E) apparently occupies an intermediate position between the groups, because its AE variation exhibits a rather bimodal pattern, suggesting enhanced dust impact in March and in summer. The respective AOD550 and AE patterns from Aqua MODIS data (see Figure A1 in Appendix A) were in great similarity to the Terra ones, thus resulting in common findings regarding the effects of distant and local sources in dust AOD over the Urmia Basin.
Since a low AE is characteristic of coarse particles (size > 1 μm) [81], it is concluded that in March and from July to September (depending on the cell), the fraction of coarse particles over the Urmia Basin increases. As summer is the hottest and driest season in this semi-arid region, the underlying surface may become a major source of dust, and on the other hand, the increased dust content over the Urmia Lake region may also be attributed to long-range dust transport from other regions in the dust belt. The March minimum of the AE, which occurs during a season with relatively moist soil, can be associated with both long-range dust transport and seasonal field works in the farmlands around the lake [34].
Note that the patterns of intra-annual variations in AOD550 and the AE for the CNTR-cell and N-cell (Figure 7h,i) are very close to each other, exhibiting the minimum AE and maximum AOD550 in summer (April–July). The July AE minimum values in CNTR- and N-cells are the lowest (~0.3 and ~0.7) among all cells, while the AOD550 is maximized in June-September, especially in the CNTR-cell. This supports the evidence that during summer, dust emissions from the salty dried beds of the lake are increased. Salt emissions that originated at the CNTR-cell may also affect the AE values, as well as those in E-cells due to dominant westerlies
Figure 8 shows the average monthly AOD550 values for cases of AE < 1 (thus related to AOD from coarse-mode particles only) and the monthly total number of these cases, NAE<1, in 2009–2022. The important findings revealed from this analysis are as follows: firstly, the maximum AOD550 values over all cells are observed in March–June (with peaks in April–May), and secondly, the maximum NAE<1 in almost all cells (except NW) occurs in July–September, indicating a shift of 2–3 months. A similar annual pattern was observed from the Aqua MODIS data (see Figure A2 in Appendix A). Therefore, it could be concluded that the most frequent events with AE < 1 in July–September are associated, on average, with lower aerosol loading over the Urmia Lake region. In addition, less frequent but higher intensity dust events (higher AOD values) occur in April–June. The maximum coarse-mode AOD550 in April-June is in good agreement with the maximum number of observations of non-local dust events (WW06) with HVR < 5 km (see Figure 3). At the same time, the maximum NAE<1 in July–September does not lead to an increased frequency of WW06 events at weather stations in the region (see Figure 3). The group of maxima NAE<1 in July–August is more pronounced in cells SW, CNTR, N, S and, partly, in E, which is in good agreement with the dominant synoptic southwestern air transport. On the other hand, the increase in NAE<1 during the warmest and driest season of July–September, especially over the CNTR- and N-cells that cover the dried beds of the Urmia Lake, reflects an increase in the influence of the local sources of coarse aerosols (salty dust) emitted by the dried lake playas, which, however, are not so intense that they exceed the impact of dust events linked with long-range transport in March-June. Therefore, the frequency of BDSS dust events with HVR < 5 km over the region is low in July–September (see Figure 4).

4.4. The Potential Sources of Coarse Aerosol Events over the Urmia Lake Region

For all the days with Terra/Aqua MODIS AE < 1 and for the seven cells around the Urmia Lake (the CNTR- and N-cells were excluded to avoid the localization of the potential sources of coarse aerosols), a total of 48,296 five-day backward trajectories were modeled via HYSPLIT, covering the period 2009–2022. From all trajectories, 19%, 23%, 30% and 28% belong to winter, spring, summer and autumn, respectively. Figure 9 shows the monthly average regional contribution to Terra/Aqua MODIS coarse-mode AOD550 over the Urmia Lake region by applying the CWT approach, while Figure 10 represents the average monthly Terra MODIS Deep Blue AOD550 distributions for the area 20–50°N, 20–70°E. The monthly distributions of AOD550 based on Terra MODIS Deep Blue/Dark Target combined data are shown in Appendix A (Figure A3), providing AODs over oceanic regions.
During the cold period (November-February), when the dust activity over the Middle East and Central Asian deserts is minimal (see Figure 9 and Figure 10) and the regional ABL height is minimal too, the potential sources that may contribute to dust AOD over the Urmia Basin are spanned mostly over north and east Iraq (regional sources). In this period, the average regional contribution to coarse aerosol AOD550 events over the Urmia Basin does not exceed 0.34 for the entire transport area that corresponds to a mean AOD550 of 0.35 in the area of potential sources (see Figure 10).
In spring, the maximum contribution to AOD550 over the Urmia Lake region is related to air masses coming from the ABL over the Syrian Desert and North Arabian Desert, exhibiting AODs up to 0.9 (Figure 9c–e), while the mean MODIS AOD550 over these areas is around 0.75–0.8 (Figure 10c–e). This difference is attributed to the fact that only the dustiest air masses reach Urmia Lake region and contribute to dust AOD, while Figure 10 shows the spatial distribution of the monthly mean AOD550.
In June, coarse aerosols affecting the Urmia region continue to originate from the ABL over the Syrian and Arabian deserts, as well as from regions located in Central Asia, namely the Aral–Caspian arid region (ACAR) and the surrounding Karakum and Kyzylkum deserts [103,104,105]. As shown by [106,107,108,109], NW Iran is most affected by dust storms from the ACAR during summertime. The contributions to dust AOD from the Syrian and Arabian deserts, as well as the ACAR, are generally above 0.9, reflecting thick dusty air masses traveling over the Urmia Basin from these areas.
In July-September, the potential sources of coarse dust aerosols over Urmia still span from the north of the Arabian Peninsula to the ACAR, but the mean contributions of these arid regions do not exceed 0.48, while the mean AOD550s over these areas are in the range of 0.4–0.7 (Figure 10g–i). This could be explained by the interfering impact of local sources that provide rather moderate but frequent coarse AOD550 (see Figure 8 and Figure A2) that likely lead to a decrease in the mean weight of the trajectories and to the underestimation of the contributions of distant potential sources. Note also that in July and August, some dust events over the Urmia Lake region could be related to air transport from south Russian steppe regions (see Figure 9g,h). In a previous study [110], it was found that dust that originated in the Middle East could traverse the Urmia Lake and finally reach over Russian regions in Siberia. So, it seems that the dust exchange between Iran and Russia is not a one-way process.
October is the last month of the year that northeastern potential sources may contribute significantly to dust AOD550 over the Urmia Lake region (Figure 9j). In this month, the highest AOD550 contribution (up to 0.45) is related to Syrian–Iraqi and Arabian Deserts and an arid area near the northeast shore of the Caspian Sea. Iraqi plains and the east corridor of the Arabian Peninsula also presented the highest AODs in this month (Figure 10j), which may affect the atmospheric conditions over NW Iran.

5. Conclusions

This study provided a comprehensive analysis of dust events of different intensities and their distribution in the Urmia Lake region, NW Iran. This study identified 550 intense, 2832 moderate and 4498 weak dust events from 2009 to 2022. The occurrence of widespread suspended dust was the highest from March to October, with a peak from April to June. Blowing dust and sand storms were the most prevalent in March and April, particularly in the eastern part of the lake. The distribution of dust events showed that intense widespread suspended dust was more common in the southern parts of the lake, while events of moderate and weak intensity were more frequent around the lake and in the eastern part. Blowing dust storms accounted for 48, 155 and 339 incidents (intense, moderate and weak), respectively, highlighting their occurrence in the eastern and southeastern regions. Model simulations revealed poor air quality conditions in the southern parts of the Urmia Lake, attributed mostly to dust emissions from distant sources.
The analysis of the aerosol optical depth (AOD550) and Ångström exponent (AE) from Aqua/Terra MODIS data in the Urmia Lake region showed that the frequency (number of days) with coarse aerosols (AE < 1) was the maximum from July to September, and these events were more frequent in the southern and eastern parts of the Urmia Basin. At the same time, the monthly coarse aerosol AOD550 was maximized in March–June with peak values in April–May. More specifically, two dust AOD regimes characterize the Urmia Lake region: (i) the first with rare but high AOD550 cases in March–June and (ii) the second with frequent but relatively lower AOD550 in July–September.
The analysis of the spatial distribution of the potential sources for coarse aerosols was performed based on Aqua/Terra MODIS AOD550 at AE < 1 and 5-day backward trajectories. The results showed that in March-May, long-range dust transport from the atmospheric boundary layer (ABL) over the Syrian and Arabian deserts affected the Urmia Basin. In June, besides these sources, the dust aerosol load was also linked with the Aral–Caspian arid region (ACAR), including the Aralkum Desert. In July–October, long-range dust transport from the ABL over the Middle East deserts and the ACAR continues. On the other hand, during summer, part of the dust loading over the Urmia Basin is caused by emissions from local sources, including the dry bottom of the lake itself. The monthly potential source patterns were confirmed by the corresponding monthly average spatial distributions of Terra MODIS AOD550 in the Middle East and Central Asia. The modeling of backward trajectories for dust aerosol events over the Lake Urmia region allowed us to reconstruct monthly potential source distributions using the Concentrated Weighted Trajectory method. Obviously, this is a universal technique that can be applied to localize potential sources of dust in other regions over the globe and to differentiate between local and distant dust sources.
The influence of emissions from the dried bottom of the Urmia Lake on the AOD, AE and horizontal visibility is still insufficiently studied. For further improvement in the current knowledge, studies with a higher spatial resolution (up to 1 km) of satellite data should be performed, while the identification of dust and salt emissions from the lake’s dry bottom should be examined by field experiments and satellite CALIOP data. This study showed that apart from the enhanced contribution of local sources due to the lake’s desiccation, the most dust loading over the Urmia Basin reflects the regional dust activity over the Middle East region and mostly originates from distant sources.
The current results highlighted the need for specific strategies to mitigate desert dust pollution in the Urmia Basin. Monitoring and controlling dust emissions, implementing air quality management strategies and raising awareness among the local population can help improve air quality and protect human health in the region. Such analysis can be applied to other arid regions in the world that face similar issues related to the dryness of lakes, river beds and the associated increase in dust activity that could be hazardous for the local population.

Author Contributions

Conceptualization, N.H.H., A.R.S.A. and K.A.S.; methodology, K.A.S., N.H.H., L.M.S. and Z.G.; software, K.A.S.; validation, N.H.H., K.A.S., C.O. and A.R.S.A.; formal analysis, K.A.S., A.R.S.A., N.H.H. and L.M.S.; investigation, L.M.S. and Z.G.; resources, N.H.H., K.A.S. and Z.G.; data curation, N.H.H. and A.R.S.A.; writing—original draft preparation, K.A.S. and N.H.H.; writing—review and editing, D.G.K., K.A.S. and C.O.; visualization, N.H.H., A.R.S.A. and K.A.S.; supervision, A.R.S.A., D.G.K. and C.O. All authors have read and agreed to the published version of the manuscript.

Funding

The analysis of satellite data and reconstruction of potential sources were funded by the Russian Foundation for Basic Research, grant number 20-55-56028, and the Iran National Science Foundation with grant number 99003984 accessed on 26 June 2024 and 20 February 2024, respectively. Open Access funding was provided by the Open Access Publishing Fund of the Philipps-Universitaet Marburg with support of the Deutsche Forschungsgemeinschaft accessed on 26 June 2024 (DFG, German Research Foundation).

Data Availability Statement

The datasets supporting the reported results are as follows: MODIS via Giovanni (https://giovanni.gsfc.nasa.gov/giovanni/, accessed on 16 May 2024).

Acknowledgments

We are thankful for the MODIS retrievals used in this study via the Giovanni visualization tool https://giovanni.gsfc.nasa.gov/giovanni/, accessed on 16 May 2024)).

Conflicts of Interest

Author Nasim Hossein Hamzeh was employed by the company Air and Climate Technology Company (ACTC). The remaining authors declare that the research was conducted in the absence of any commercial or financial relationships that could be construed as a potential conflict of interest.

Appendix A

Figure A1. Intra-annual variations in the monthly average Ångström exponent (lines) and the monthly average AOD550 (bars) over the following cells in 2009–2021 by Aqua MODIS data. (a) NW-cell. (b) W-cell. (c) SW-cell. (d) S-cell. (e) SE-cell. (f) E-cell. (g) NE-cell. (h) N-cell (evaluative graph). (i) CNTR-cell (evaluative graph). Blue and red (light pink for N and CNTR cells) lines indicate, respectively, the annual mean Ångström exponent and AOD550 values in 2009–2022.
Remotesensing 16 02384 g0a1
Figure A2. Intra-annual variations in the monthly average AOD550 (gray bars) and monthly total number of coarse aerosol (Ångström exponent < 1) events N (blue bars) in 2009–2022 by Aqua MODIS data. (a) NW-cell. (b) W-cell. (c) SW-cell. (d) S-cell. (e) SE-cell. (f) E-cell. (g) NE-cell. (h) N-cell (evaluative graph). (i) CNTR-cell (evaluative graph). Red (and light pink for N and CNTR cells) lines represent the mean annual AOD550 averaged by coarse aerosol events.
Remotesensing 16 02384 g0a2
Figure A3. The spatial distributions of the monthly mean Terra-MODIS AOD550 (Combined Deep Blue/Dark Target) during 2009–2022. The Urmia Lake region is marked with a black rectangle. The spatial resolution is 1° × 1°.
Remotesensing 16 02384 g0a3

References

  1. Toon, O.B.; Pollack, J.B.; Ackerman, T.P.; Turco, R.P.; McKay, C.P.; Liu, M.S. Evolution of an impact-generated dust cloud and its effects on the atmosphere. In Book Geological Implications of Impacts of Large Asteroids and Comets on the Earth; Silver, L.T., Schultz, P.H., Eds.; Geological Society of America: Boulder, CO, USA, 1982; pp. 187–200. [Google Scholar]
  2. Field, J.P.; Belnap, J.; Breshears, D.D.; Neff, J.C.; Okin, G.S.; Whicker, J.J.; Painter, T.H.; Ravi, S.; Reheis, M.C.; Reynolds, R.L. The ecology of dust. Front. Ecol. Environ. 2010, 8, 423–430. [Google Scholar] [CrossRef]
  3. Schepanski, K. Transport of mineral dust and its impact on climate. Geosciences 2018, 8, 151. [Google Scholar] [CrossRef]
  4. Bennion, P.; Hubbard, R.; O’Hara, S.; Wiggs, G.; Wegerdt, J.; Lewis, S.; Small, I.; van der Meer, J.; Upshur, R.; Médecins san Frontières. The impact of airborne dust on respiratory health in children living in the Aral Sea region. Int. J. Epidemiol. 2007, 36, 1103–1110. [Google Scholar] [CrossRef] [PubMed]
  5. Karshieva, D.R.; Nazarova, F.A.; Tolibova, Z.H. Atmospheric dust and its effects on human health. Int. Multidiscip. Res. J. 2021, 11, 1168–1172. [Google Scholar] [CrossRef]
  6. Li, X.; Fan, G. On strain localization of aeolian sand in true triaxial apparatus. Acta Geotechnol. 2024, 19, 3115–3128. [Google Scholar] [CrossRef]
  7. Aghababaeian, H.; Ostadtaghizadeh, A.; Ardalan, A.; Asgary, A.; Akbary, M.; Yekaninejad, M.S.; Stephens, C. Global health impacts of dust storms: A systematic review. Environ. Health Insights 2021, 15, 11786302211018390. [Google Scholar] [CrossRef]
  8. Goudie, A.S.; Middleton, N.J. Desert Dust in the Global System; Springer Science & Business Media: Berlin/Heidelberg, Germany, 2006. [Google Scholar]
  9. Dayan, U.; Ziv, B.; Shoob, T.; Enzel, Y. Suspended dust over southeastern Mediterranean and its relation to atmospheric circulations. Int. J. Climatol. 2008, 28, 915–924. [Google Scholar] [CrossRef]
  10. Yang, Y.Q.; Hou, Q.; Zhou, C.H.; Liu, H.L.; Wang, Y.Q.; Niu, T. Sand/dust storm processes in Northeast Asia and associated large-scale circulations. Atmos. Chem. Phys. 2008, 8, 25–33. [Google Scholar] [CrossRef]
  11. Spiga, A.; Forget, F. A new model to simulate the Martian mesoscale and microscale atmospheric circulation: Validation and first results. J. Geophys. Res. Planets 2009, 114, 114–140. [Google Scholar] [CrossRef]
  12. Engelstaedter, S.; Tegen, I.; Washington, R. North African dust emissions and transport. Earth-Sci. Rev. 2006, 79, 73–100. [Google Scholar] [CrossRef]
  13. Tositti, L.; Brattich, E.; Cassardo, C.; Morozzi, P.; Bracci, A.; Marinoni, A.; Di Sabatino, S.; Porcù, F.; Zappi, A. Development and evolution of an anomalous Asian dust event across Europe in March 2020. Atmos. Chem. Phys. 2022, 22, 4047–4073. [Google Scholar] [CrossRef]
  14. Prospero, J.M.; Lamb, P.J. African droughts and dust transport to the Caribbean: Climate change implications. Science 2003, 302, 1024–1027. [Google Scholar] [CrossRef]
  15. Tanaka, T.Y.; Kurosaki, Y.; Chiba, M.; Matsumura, T.; Nagai, T.; Yamazaki, A.; Uchiyama, A.; Tsunematsu, N.; Kai, K. Possible transcontinental dust transport from North Africa and the Middle East to East Asia. Atmos. Environ. 2005, 39, 3901–3909. [Google Scholar] [CrossRef]
  16. Sugimoto, N.; Jin, Y.; Shimizu, A.; Nishizawa, T.; Yumimoto, K. Transport of Mineral Dust from Africa and Middle East to East Asia Observed with the Lidar Network (AD-Net). Sola 2019, 15, 257–261. [Google Scholar] [CrossRef]
  17. Prospero, J.M.; Collard, F.X.; Molinié, J.; Jeannot, A. Characterizing the annual cycle of African dust transport to the Caribbean Basin and South America and its impact on the environment and air quality. Glob. Biogeochem. Cycles 2014, 28, 757–773. [Google Scholar] [CrossRef]
  18. Szczepanik, D.M.; Ortiz-Amezcua, P.; Heese, B.; D’Amico, G.; Stachlewska, I.S. First Ever Observations of Mineral Dust in Wintertime over Warsaw, Poland. Remote Sens. 2022, 14, 3788. [Google Scholar] [CrossRef]
  19. Sotoudeheian, S.; Salim, R.; Arhami, M. Impact of Middle Eastern dust sources on PM10 in Iran: Highlighting the impact of Tigris-Euphrates basin sources and Lake Urmia desiccation. J. Geophys. Res. Atmos. 2016, 121, 14–18. [Google Scholar] [CrossRef]
  20. Gandham, H.; Dasari, H.P.; Langodan, S.; Karumuri, R.K.; Hoteit, I. Major changes in extreme dust events dynamics over the Arabian Peninsula during 2003–2017 driven by atmospheric conditions. J. Geophys. Res. 2020, 125, e2020JD032931. [Google Scholar] [CrossRef]
  21. Mohammadpour, K.; Sciortino, M.; Saligheh, M.; Raziei, T.; Boloorani, A.D. Spatiotemporal regionalization of atmospheric dust based on multivariate analysis of MACC model over Iran. Atmos. Res. 2020, 249, 105322. [Google Scholar] [CrossRef]
  22. Shao, Y.; Wyrwoll, K.H.; Chappell, A.; Huang, J.; Lin, Z.; McTainsh, G.H.; Mikami, M.; Tanaka, T.Y.; Wang, X.; Yoon, S. Dust cycle: An emerging core theme in Earth system science. Aeol. Res. 2011, 2, 181–204. [Google Scholar] [CrossRef]
  23. Hamidi, M.; Kavianpour, M.R.; Shao, Y. Synoptic analysis of dust storms in the Middle East. Asia Pac. J. Atmos. Sci. 2013, 49, 279–286. [Google Scholar] [CrossRef]
  24. Abadi, A.R.S.; Hamzeh, N.H.; Chel Gee Ooi, M.; Kong, S.S.-K.; Opp, C. Investigation of Two Severe Shamal Dust Storms and the Highest Dust Frequencies in the South and Southwest of Iran. Atmosphere 2022, 13, 1990. [Google Scholar] [CrossRef]
  25. Francis, D.B.K.; Flamant, C.; Chaboureau, J.P.; Banks, J.; Cuesta, J.; Brindley, H.; Oolman, L. Dust emission and transport over Iraq associated with the summer Shamal winds. Aeolian Res. 2017, 24, 15–31. [Google Scholar] [CrossRef]
  26. Hamzeh, N.H.; Karami, S.; Kaskaoutis, D.G.; Tegen, I.; Moradi, M.; Opp, C. Atmospheric dynamics and numerical simulations of six frontal dust storms in the Middle East region. Atmosphere 2021, 12, 125. [Google Scholar] [CrossRef]
  27. Karami, S.; Hamzeh, N.H.; Abadi, A.R.S.; Madhavan, B.L. Investigation of a severe frontal dust storm over the Persian Gulf in February 2020 by CAMS model. Arab. J. Geosci. 2021, 14, 2041. [Google Scholar] [CrossRef]
  28. Karami, S.; Hamzeh, N.H.; Alam, K.; Ranjbar, A. The study of a rare frontal dust storm with snow and rain fall: Model results and ground measurements. J. Atmos. Sol.-Terr. Phys. 2020, 197, 105149. [Google Scholar] [CrossRef]
  29. Kaskaoutis, D.G.; Francis, D.; Rashki, A.; Chaboureau, J.P.; Dumka, U.C. Atmospheric dynamics from synoptic to local scale during an intense frontal dust storm over the Sistan Basin in winter 2019. Geosciences 2019, 9, 453. [Google Scholar] [CrossRef]
  30. Hamzeh, N.H.; Kaskaoutis, D.G.; Rashki, A.; Mohammadpour, K. Long-term variability of dust events in southwestern Iran and its relationship with the drought. Atmosphere 2021, 12, 1350. [Google Scholar] [CrossRef]
  31. Miller, S.D.; Kuciauskas, A.P.; Liu, M.; Ji, Q.; Reid, J.S.; Breed, D.W.; Walker, A.L.; Mandoos, A.A. Haboob dust storms of the southern Arabian Peninsula. J. Geophys. Res. Atmos. 2008, 113, D01202. [Google Scholar] [CrossRef]
  32. Abuduwaili, J.; Liu, D.; Wu, G. Saline dust storms and their ecological impacts in arid regions. J. Arid. Land 2010, 2, 144–150. [Google Scholar] [CrossRef]
  33. Hamzeh, N.H.; Ranjbar Saadat Abadi, A.; Ooi, M.C.G.; Habibi, M.; Schöner, W. Analyses of a Lake Dust Source in the Middle East through Models Performance. Remote Sens. 2022, 14, 2145. [Google Scholar] [CrossRef]
  34. Abadi, A.R.S.; Hamzeh, N.H.; Shukurov, K.; Opp, C.; Dumka, U.C. Long-term investigation of aerosols in the Urmia Lake region in the Middle East by ground-based and satellite data in 2000–2021. Remote Sens. 2022, 14, 3827. [Google Scholar] [CrossRef]
  35. Sugden, D.E.; McCulloch, R.D.; Bory, A.J.M.; Hein, A.S. Influence of Patagonian glaciers on Antarctic dust deposition during the last glacial period. Nat. Geosci. 2009, 2, 281–285. [Google Scholar] [CrossRef]
  36. Saxton, K.; Chandler, D.; Stetler, L.; Lamb, B.; Claiborn, C.; Lee, B.H. Wind erosion and fugitive dust fluxes on agricultural lands in the Pacific Northwest. Trans. ASAE 2000, 43, 623. [Google Scholar] [CrossRef]
  37. Zhang, B.; Tsunekawa, A.; Tsubo, M. Contributions of sandy lands and stony deserts to long-distance dust emission in China and Mongolia during 2000–2006. Glob. Planet. Chang. 2008, 60, 487–504. [Google Scholar] [CrossRef]
  38. Shang, Y.; Prins, M.A.; Beets, C.J.; Kaakinen, A.; Lahaye, Y.; Dijkstra, N.; Rits, D.S.; Wang, B.; Zheng, H.; van Balen, R.T. Aeolian dust supply from the Yellow River floodplain to the Pleistocene loess deposits of the Mangshan Plateau, central China: Evidence from zircon U-Pb age spectra. Quat. Sci. Rev. 2018, 182, 131–143. [Google Scholar] [CrossRef]
  39. Al-Hemoud, A.; Al-Dousari, A.; Al-Dashti, H.; Petrov, P.; Al-Saleh, A.; Al-Khafaji, S.; Behbehani, W.; Li, J.; Koutrakis, P. Sand and dust storm trajectories from Iraq Mesopotamian flood plain to Kuwait. Sci. Total Environ. 2020, 710, 136291. [Google Scholar]
  40. Tussupova, K.; Hjorth, P.; Moravej, M. Drying lakes: A review on the applied restoration strategies and health conditions in contiguous Areas. Water 2020, 12, 749. [Google Scholar] [CrossRef]
  41. Ahmady-Birgani, H.; Ravan, P.; Schlosser, J.S.; Cuevas-Robles, A.; AzadiAghdam, M.; Sorooshian, A. On the chemical nature of wet deposition over a major desiccated lake: Case study for Lake Urmia basin. Atmos. Res. 2020, 234, 104762–104774. [Google Scholar] [CrossRef]
  42. Liu, D.; Abuduwaili, J.; Wang, L. Salt dust storm in the Ebinur Lake region: Its 50-year dynamic changes and response to climate changes and human activities. Nat. Haz. 2015, 77, 1069–1080. [Google Scholar] [CrossRef]
  43. Karami, S.; Hamzeh, N.H.; Kaskaoutis, D.G.; Rashki, A.; Alam, K.; Ranjbar, A. Numerical simulations of dust storms originated from dried lakes in central and southwest Asia: The case of Aral Sea and Sistan Basin. Aeolian Res. 2021, 50, 100679. [Google Scholar] [CrossRef]
  44. Opp, C.; Groll, M.; Aslanov, I.; Lotz, T.; Vereshagina, N. Aeolian dust deposition in the southern Aral Sea region (Uzbekistan): Ground-based monitoring results from the LUCA project. Quat. Int. 2017, 429, 86–99. [Google Scholar] [CrossRef]
  45. Xi, X.; Sokolik, I.N. Quantifying the anthropogenic dust emission from agricultural land use and desiccation of the Aral Sea in Central Asia. J. Geophys. Res. Atmos. 2016, 121, 12–270. [Google Scholar] [CrossRef]
  46. Wiggs, G.F.; O’hara, S.L.; Wegerdt, J.; Van Der Meer, J.; Small, I.; Hubbard, R. The dynamics and characteristics of aeolian dust in dryland Central Asia: Possible impacts on human exposure and respiratory health in the Aral Sea basin. Geogr. J. 2003, 169, 142–157. [Google Scholar] [CrossRef]
  47. Anchita Zhupankhan, A.; Khaibullina, Z.; Kabiyev, Y.; Persson, K.M.; Tussupova, K. Health impact of drying Aral Sea: One health and socio-economical approach. Water 2021, 13, 3196. [Google Scholar] [CrossRef]
  48. Chen, Z.; Gao, X.; Lei, J. Dust emission and transport in the Aral Sea region. Geoderma 2022, 428, 116177. [Google Scholar] [CrossRef]
  49. Gholampour, A.; Nabizadeh, R.; Hassanvand, M.S.; Taghipour, H.; Nazmara, S.; Mahvi, A.H. Characterization of saline dust emission resulted from Urmia Lake drying. J. Environ. Health Sci. Eng. 2015, 13, 82. [Google Scholar] [CrossRef]
  50. Boroughani, M.; Hashemi, H.; Hosseini, S.H.; Pourhashemi, S.; Berndtsson, R. Desiccating Lake Urmia: A new dust source of regional importance. IEEE Geosci. Remote Sens. Lett. 2019, 17, 1483–1487. [Google Scholar] [CrossRef]
  51. Ghale, Y.A.G.; Tayanc, M.; Unal, A. Dried bottom of Urmia Lake as a new source of dust in the northwestern Iran: Understanding the impacts on local and regional air quality. Atmos. Environ. 2021, 262, 118635. [Google Scholar] [CrossRef]
  52. Ghomashi, F.; Khalesifard, H.R. Investigation and characterization of atmospheric aerosols over the Urmia Lake using the satellite data and synoptic recordings. Atmos. Pollut. Res. 2020, 11, 2076–2086. [Google Scholar] [CrossRef]
  53. Ravan, P.; Ahmady-Birgani, H.; Solomos, S.; Yassin, M.F.; Abasalinezhad, H. Wet Scavenging in Removing Chemical Compositions and Aerosols: A Case Study over the Lake Urmia. J. Geophys. Res. Atmos. 2022, 127, e2021JD035896. [Google Scholar] [CrossRef]
  54. Karimzadeh, S.; Taghizadeh, M.M. Potential of dust emission resources using small wind tunnel and GIS: Case study of Bakhtegan playa, Iran. Appl. Water Sci. 2019, 9, 174. [Google Scholar] [CrossRef]
  55. Mozafari, M.; Hosseini, Z.; Fijani, E.; Eskandari, R.; Siahpoush, S.; Ghader, F. Effects of climate change and human activity on lake drying in Bakhtegan Basin, southwest Iran. Sustain. Water Resour. Manag. 2022, 8, 109. [Google Scholar] [CrossRef]
  56. Sajedipour, S.; Zarei, H.; Oryan, S. Estimation of environmental water requirements via an ecological approach: A case study of Bakhtegan Lake, Iran. Ecol. Eng. 2017, 100, 246–255. [Google Scholar] [CrossRef]
  57. Soleimani Sardoo, F.; Hosein Hamzeh, N.; Karami, S.; Nateghi, S.; Hashemi Nezhad, M. Emission and transport of dust particles in Jazmourian basin (Case study: Dust storm 24 to 26 November 2016). J. Clim. Res. 2022, 1400, 41–54. [Google Scholar]
  58. Soleimani Sardoo, F.; Karami, S.; Hoseinhamzeh, N. Determining and analyzing the temporal and spatial trend of dust and its effect on vegetation and precipitation (Case study of Jazmourian Basin). Environ. Erosion Res. J. 2021, 11, 64–81. [Google Scholar]
  59. Moghim, S.; Ramezanpoor, R. Characterization of aerosol types over Lake Urmia Basin. In Proceedings of the E3S Web of Conferences, Central Asian DUst Conference (CADUC 2019), Dushanbe, Tajikistan, 8–12 April 2019; Volume 99, p. 01006. [Google Scholar] [CrossRef]
  60. Hassanzadeh, E.; Zarghami, M.; Hassanzadeh, Y. Determining the main factors in declining the Urmia Lake level by using system dynamics modeling. Water Resour. Manag. 2012, 26, 129–145. [Google Scholar] [CrossRef]
  61. Delju, A.H.; Ceylan, A.; Piguet, E.; Rebetez, M. Observed climate variability and change in Urmia Lake Basin, Iran. Theor. Appl. Climatol. 2013, 111, 285–296. [Google Scholar] [CrossRef]
  62. Shadkam, S.; Ludwig, F.; van Oel, P.; Kirmit, Ç.; Kabat, P. Impacts of climate change and water resources development on the declining inflow into Iran’s Urmia Lake. J. Great Lakes Res. 2016, 42, 942–952. [Google Scholar] [CrossRef]
  63. Sattari, M.T.; Mirabbasi, R.; Jarhan, S.; Shaker Sureh, F.; Ahmad, S. Trend and abrupt change analysis in water quality of Urmia Lake in comparison with changes in lake water level. Environ. Monit. Assess. 2020, 192, 623. [Google Scholar] [CrossRef] [PubMed]
  64. Ghalibaf, M.B.; Moussavi, Z. Development and environment in Urmia Lake of Iran. Eur. J. Sustain. Dev. 2014, 3, 219. [Google Scholar]
  65. Soudi, M.; Ahmadi, H.; Yasi, M.; Hamidi, S.A. Sustainable restoration of the Urmia Lake: History, threats, opportunities and challenges. Eur. Water 2017, 60, 341–347. [Google Scholar]
  66. Habibi, M.; Babaeian, I.; Schöner, W. Changing Causes of Drought in the Urmia Lake Basin—Increasing Influence of Evaporation and Disappearing Snow Cover. Water 2021, 13, 3273. [Google Scholar] [CrossRef]
  67. Karami, S.; Hamzeh, N.H.; Noori, F.; Ranjbar, A. Investigation of dust storms in Ilam and the performance analysis of simulation of 6 numerical prediction models at a severe dust storm in west of Iran. J. Air Pollut. Health 2019, 4, 133–147. [Google Scholar] [CrossRef]
  68. Effati, M.; Bahrami, H.A.; Gohardoust, M.; Babaeian, E.; Tuller, M. Application of satellite remote sensing for estimation of dust emission probability in the Urmia Lake Basin in Iran. Soil Sci. Soc. Am. J. 2019, 83, 993–1002. [Google Scholar] [CrossRef]
  69. Balkanlou, K.R.; Müller, B.; Cord, A.F.; Panahi, F.; Malekian, A.; Jafari, M.; Egli, L. Spatiotemporal dynamics of ecosystem services provision in a degraded ecosystem: A systematic assessment in the Urmia Lake basin, Iran. Sci. Total Environ. 2020, 716, 137100. [Google Scholar] [CrossRef]
  70. Golreyhan, F.; Kamran, K.V.; Mokhtari, D.; Rasouli, A.-A. Examining the Effect of Salt Dust Storms of Lake Urmia on Vegetation. J. Hydraul. Struct. 2021, 7, 60–71. [Google Scholar] [CrossRef]
  71. Hamzeh, N.H.; Shukurov, K.; Mohammadpour, K.; Kaskaoutis, D.G.; Saadatabadi, A.R.; Shahabi, H. A comprehensive investigation of the causes of drying and increasing saline dust in the Urmia Lake, northwest Iran, via ground and satellite observations, synoptic analysis and machine learning models. Ecol. Inform. 2023, 78, 102355. [Google Scholar] [CrossRef]
  72. Hamzeh, N.H.; Abadi, A.R.S.; Kaskaoutis, D.G.; Mirzaei, E.; Shukurov, K.A.; Sotiropoulou, R.E.P.; Tagaris, E. The Importance of Wind Simulations Over Dried Lake Beds for Dust Emissions in the Middle East. Atmosphere 2023, 15, 24. [Google Scholar] [CrossRef]
  73. Terradellas, E.; Werner, E.; Basart, B.; Benincasa, F. Model inter-comparison and evaluation of dust forecasts. WMO SDS-WAS Barc. 2022, 47, SDS-WAS-2020-001. Available online: http://sds-was.aemet.es/materials/technical-reports (accessed on 10 February 2024).
  74. Shao, Y.; Raupach, M.R.; Findlater, P.A. Effect of saltation bombardment on the entrainment of dust by wind. J. Geophys. Res. Atmos. 1993, 98, 12719–12726. [Google Scholar] [CrossRef]
  75. U.S. EPA. Particulate Matter (PM) Pollution; U.S. EPA: Washington, DC, USA, 2017. Available online: https://www.epa.gov/pm-pollution/particulate-matter-pm-basics (accessed on 15 December 2019).
  76. Available online: https://giovanni.gsfc.nasa.gov/giovanni (accessed on 12 July 2023).
  77. Hsu, N.C.; Tsay, S.C.; King, M.D.; Herman, J.R. Aerosol properties over bright-reflecting source regions. IEEE Trans. Geosci. Remote Sens. 2004, 42, 557–569. [Google Scholar] [CrossRef]
  78. Hsu, N.C.; Tsay, S.C.; King, M.D.; Herman, J.R. Deep blue retrievals of Asian aerosol properties during ACEAsia. IEEE Trans. Geosci. Remote Sens. 2006, 44, 3180–3195. [Google Scholar] [CrossRef]
  79. Schuster, G.L.; Dubovik, O.; Holben, B.N. Angstrom exponent and bimodal aerosol size distributions. J. Geophys. Res. 2006, 111, D07207. [Google Scholar] [CrossRef]
  80. Ali, M.A.; Nichol, J.E.; Bilal, M.; Qiu, Z.; Mazhar, U.; Wahiduzzaman, M.; Almazroui, M.; Islam, M.N. Classification of aerosols over Saudi Arabia from 2004–2016. Atmos. Environ. 2020, 241, 117785. [Google Scholar]
  81. Klingmüller, K.; Pozzer, A.; Metzger, S.; Stenchikov, G.L.; Lelieveld, J. Aerosol optical depth trend over the Middle East. Atmos. Chem. Phys. 2016, 16, 5063–5073. [Google Scholar] [CrossRef]
  82. Sabetghadam, S.; Alizadeh, O.; Khoshsima, M.; Pierleoni, A. Aerosol properties, trends and classification of key types over the middle-east using satellite-derived atmospheric optical datasets. Atmos. Environ. 2021, 246, 118100. [Google Scholar] [CrossRef]
  83. Draxler, R.R.; Hess, G.D. An overview of the HYSPLIT_4 modelling system for trajectories, dispersion and deposition. Aust. Meteorol. Mag. 1998, 47, 295–308. [Google Scholar]
  84. Stein, A.; Draxler, R.R.; Rolph, G.D.; Stunder, B.J.; Cohen, M.; Ngan, F. NOAA’s HYSPLIT atmospheric transport and dispersion modeling system. Bull. Amer. Meteorol. Soc. 2015, 96, 2059–2077. [Google Scholar] [CrossRef]
  85. Kalnay, E.; Kanamitsu, M.; Kistler, R.; Collins, W.; Deaven, D.; Gandin, L.; Iredell, M.; Saha, S.; White, G.; Woolen, J.; et al. The NCEP/NCAR 40-year reanalysis project. Bull. Am. Meteorol. Soc. 1996, 77, 437–471. [Google Scholar]
  86. Rezazadeh, M.; Irannejad, P.; Shao, Y. Climatology of the Middle East dust events. Aeolian Res. 2013, 10, 103–109. [Google Scholar] [CrossRef]
  87. Dimitriou, K.; Liakakou, E.; Lianou, M.; Psiloglou, B.E.; Kassomenos, P.; Mihalopoulos, N.; Gerasopoulos, E. Implementation of an aggregate index to elucidate the influence of atmospheric synoptic conditions on air quality in Athens, Greece. Air Qual. Atmos. Health 2020, 13, 447–458. [Google Scholar] [CrossRef]
  88. Yu, Y.; Notaro, M.; Kalashnikova, O.V.; Garay, M.J. Climatology of summer Shamal wind in the Middle East. J. Geophys. Res. 2016, 120, 289–305. [Google Scholar] [CrossRef]
  89. Abdi Vishkaee, F.; Flamant, C.; Cuesta, J.; Oolman, L.; Flamant, P.; Khalesifard, H.R. Dust transport over Iraq and northwest Iran associated with winter Shamal: A case study. J. Geophys. Res. 2012, 117, 14. [Google Scholar] [CrossRef]
  90. Rashki, A.; Kaskaoutis, D.G.; Sepehr, A. Statistical evaluation of the dust events at selected stations in southwest Asia: From the Caspian Sea to the Arabian Sea. Catena 2018, 165, 590–603. [Google Scholar] [CrossRef]
  91. Kistler, R.; Kalnay, E.; Collins, W.; Saha, S.; White, G.; Woollen, J.; Chelliah, M.; Ebisuzaki, W.; Kanamitsu, M.; Kousky, V.; et al. The NCEP–NCAR 50-Year Reanalysis: Monthly Means CD-ROM and Documentation. Bull. Am. Meterol. Soc. 2001, 82, 247–268. [Google Scholar] [CrossRef]
  92. Hsu, Y.-K.; Holsen, T.; Hopke, P. Comparison of hybrid receptor models to locate PCB sources in Chicago. Atmos. Environ. 2003, 37, 545–562. [Google Scholar] [CrossRef]
  93. Shukurov, K.A.; Shukurova, L.M. Potential sources of Southern Siberia aerosols by data of AERONET site in Tomsk, Russia. In Proceedings of the SPIE, XXIII International Symposium on Atmospheric and Oceanic Optics: Atmospheric and Oceanic Physics, Atmospheric Physics, Irkutsk, Russia, 3 July 2017; Volume 10466, p. 104663W. [Google Scholar] [CrossRef]
  94. Alizadeh, F.; Hamzehpour, N.; Abasiyan, S.M.A.; Rahmati, M. The wind erodibility in the newly emerged surfaces of Urmia Playa Lake and adjacent agricultural lands and its determining factors. Catena 2020, 194, 104675. [Google Scholar] [CrossRef]
  95. Ahmadi, H.; Argany, M.; Ghanbari, A.; Ahmadi, M. Visualized spatiotemporal data mining in investigation of Urmia Lake drought effects on increasing of PM10 in Tabriz using Space-Time Cube (2004–2019). Sustain. Cities Soc. 2021, 76, 103399. [Google Scholar] [CrossRef]
  96. Hamzehpour, N. Temporal changes in the elemental composition and physicochemical properties of dust from sand sheets of the western Lake Urmia. J. Nat. Environ. 2024, 76, 79–95. [Google Scholar] [CrossRef]
  97. Hamzehpour, N.; Marcolli, C.; Pashai, S.; Klumpp, K.; Peter, T. Measurement report: The Urmia playa as a source of airborne dust and ice-nucleating particles—Part 1: Correlation between soils and airborne samples. Atmos. Chem. Phys. 2022, 22, 14905–14930. [Google Scholar] [CrossRef]
  98. Hassan, M.E.; Fattahi, E.; Habibi, M. Temporal and Spatial Variability of Dust in the Urmia Basin, 1990–2019. Atmosphere 2023, 14, 1761. [Google Scholar] [CrossRef]
  99. Alkhayer, M.; Eghbal, M.K.; Hamzehpour, N. Geomorphic Surfaces of Eastern Lake Urmia Playa and their Influence on Dust Storms. J. Appl. Sci. Environ. Manag. 2019, 23, 1511–1520. [Google Scholar] [CrossRef]
  100. Hassan, E.M.; Fattahi, E.; Habibi, M. Application of a regional climate model on autumn dust events over the Urmia Basin. Atmos. Pollut. Res. 2023, 14, 101904. [Google Scholar] [CrossRef]
  101. Binietoglou, I.; Basart, S.; Alados-Arboledas, L.; Amiridis, V.; Argyrouli, A.; Baars, H.; Baldasano, J.M.; Balis, D.; Belegante, L.; Bravo-Aranda, J.A.; et al. A methodology for investigating dust model performance using synergistic EARLINET/AERONET dust concentration retrievals. Atmos. Meas. Technol. 2015, 8, 3577–3600. [Google Scholar] [CrossRef]
  102. Karami, S.; Kaskaoutis, D.G.; Kashani, S.S.; Rahnama, M.; Rashki, A. Evaluation of nine operational models in forecasting different types of synoptic dust events in the Middle East. Geosciences 2021, 11, 458. [Google Scholar] [CrossRef]
  103. Gholami, H.; Mohammadifar, A.; Malakooti, H.; Esmaeilpour, Y.; Golzari, S.; Mohammadi, F.; Li, Y.; Song, Y.; Kaskaoutis, D.G.; Fitzsimmons, K.E.; et al. Integrated modelling for mapping spatial sources of dust in central Asia—An important dust source in the global atmospheric system. Atmos. Poll. Res. 2021, 12, 101173. [Google Scholar] [CrossRef]
  104. Wang, W.; Samat, A.; Ge, Y.; Ma, L.; Tuheti, A.; Zou, S.; Abuduwaili, J. Quantitative soil wind erosion potential mapping for central asia using the google earth engine platform. Remote Sens. 2020, 12, 3430. [Google Scholar] [CrossRef]
  105. Zhang, X.X.; Claiborn, C.; Lei, J.Q.; Vaughan, J.; Wu, S.X.; Li, S.Y. Aeolian dust in Central Asia: Spatial distribution and temporal variability. Atmos. Environ. 2020, 238, 117734. [Google Scholar] [CrossRef]
  106. Zachary, M.; Lun, Y.; Mwai, Z. Application of PSCF and CWT to Identify Potential Sources of Aerosol Optical Depth in ICIPE Mbita. Open Access Libr. J. 2018, 5, 1–12. [Google Scholar] [CrossRef]
  107. Li, C.; Dai, Z.; Liu, X.; Wu, P. Transport pathways and potential source region contributions of PM2.5 in Weifang: Seasonal variations. Appl. Sci. 2020, 10, 2835. [Google Scholar] [CrossRef]
  108. Shukurov, K.A.; Simonenkov, D.V.; Nevzorov, A.V.; Rashki, A.; Hamzeh, N.H.; Abdullaev, S.F.; Shukurova, L.M.; Chkhetiani, O.G. CALIOP-Based Evaluation of Dust Emissions and Long-Range Transport of the Dust from the Aral−Caspian Arid Region by 3D-Source Potential Impact (3D-SPI) Method. Remote Sens. 2023, 15, 2819. [Google Scholar] [CrossRef]
  109. Delfi, S.; Mosaferi, M.; Sadegh, M.; Maleki, H.S. Investigation of aerosols pollution across the eastern basin of Urmia Lake using satellite remote sensing data and HYSPLIT model. J. Environ. Health Sci. Eng. 2019, 17, 1107–1120. [Google Scholar] [CrossRef]
  110. Hamzeh, N.H.; Abadi, A.R.S.; Shukurov, K.A.; Mhawish, A.; Alam, K.; Opp, C. Simulation and synoptic investigation of a severe dust storm originated from the Urmia Lake in the Middle East. Atmósfera 2024, 38, 531–555. [Google Scholar] [CrossRef]
Figure 1. The topography of the study area and locations of 26 weather stations in the Urmia Basin, NW Iran. Black circles represent the main synoptic stations (MS) with 8 observations per day, while open circles symbolize the intermediate synoptic stations (IS) with 5 observations per day.
Remotesensing 16 02384 g001
Figure 2. A snapshot of the Urmia Lake region (September 2003). The cells of a 1° × 1° size are shown and were used to extract data series of the Terra/Aqua MODIS AOD550 and Ångström exponent from 2009 to 2022. Parts of the dried bottom covered with salt are seen at the east (in N-cell) and southeast (CNTR-cell) boundaries of the lake.
Remotesensing 16 02384 g002
Figure 3. Monthly number of dust events with horizontal visibilities less than or equal to 5 km for widespread suspended dust (code 06) during 2009–2022.
Remotesensing 16 02384 g003
Figure 4. Monthly number of dust events with horizontal visibilities less than or equal to 5 km for blowing dust and dust storms (BDSS, as defined in Table 1) during 2009–2022.
Remotesensing 16 02384 g004
Figure 5. Number of horizontal visibilities reduced due to severe (a,d), moderate (b,e) and weak (c,f) intensity of WSD (WW06) and BDSS (WW_Oth).
Remotesensing 16 02384 g005
Figure 6. The 80th, 90th and 95th percentiles, as well as the maximum DSC ( μ g / m 3 ) values of the surface concentration of suspended particles, predicted by the DREAM8-NMME-MACC model for urban and rural points in the study area, based on the range of changes in the AQI for PM10 (Table 3).
Remotesensing 16 02384 g006
Figure 7. Intra-annual variations in the monthly average Ångström exponent (lines) and AOD550 values (bars) from Terra MODIS over grid cells around the Urmia Basin during 2009–2022. (a) NW-cell. (b) W-cell. (c) SW-cell. (d) S-cell. (e) SE-cell. (f) E-cell. (g) NE-cell. (h) N-cell (evaluative graph). (i). CNTR-cell (evaluative graph). Red and light pink (for N and CNTR cells) lines indicate the annual mean AOD550 in 2009–2022.
Remotesensing 16 02384 g007
Figure 8. Intra-annual variations in the monthly average AOD550 values for the cases of AE < 1 (gray bars) and monthly total number of AE < 1 cases (blue bars) in 2009–2022 by Terra MODIS data. (a) NW-cell. (b) W-cell. (c) SW-cell. (d) S-cell. (e) SE-cell. (f) E-cell. (g) NE-cell. (h) N-cell (evaluative graph). (i) CNTR-cell (evaluative graph). Red lines represent the mean annual AOD550 due to coarse aerosols only.
Remotesensing 16 02384 g008
Figure 9. Monthly mean regional ABL contribution to AOD550 at AE < 1.0 (CWT-AOD550) according to Aqua and Terra MODIS data for the Urmia Lake region (marked with a black rectangle) in 2009–2022: The spatial resolution is 0.5° × 0.5°. Here and after, the Aral Sea is shown in its boundaries of the 1960s.
Remotesensing 16 02384 g009
Figure 10. The spatial distributions of monthly mean Terra MODIS Deep Blue AOD550 during 2009–2022. The Urmia Lake region is marked with a black rectangle. The spatial resolution is 1° × 1°.
Remotesensing 16 02384 g010
Table 1. World Meteorological Organization weather codes related to SDS phenomena (WMO No. 306, 2019).
CategoryWWDust Code Definition
(i): Widespread Suspended Dust (WSD) 06Widespread suspended dust that has not been raised by wind near or at the station, at the observation time.
(ii): Blowing Dust and Sand Storms (BDSS)07Sand or dust that has been raised by wind near or at the station at the observation time, but no well-developed SDS.
08Sand or dust whirl(s) developed at or around the station, at the observation time or during the previous hour.
09Dust storm (DS) or sand storm (SS) that was sighted around the station or at the station during the previous hour.
30–32Slight or moderate DS or SS, visibility less than 1000 m but more than 200 m:
30: has decreased during the previous hour.
31: no considerable change during the previous hour.
32: has begun or has increased during the previous hour.
33–35Severe DS or SS, visibility less than 200 m:
33: has decreased during the previous hour.
34: no considerable change during the previous hour.
35: has begun or has increased during the previous hour.
98Thunderstorm combined with DS or SS at time of observation
Table 2. A description of the regional model (DREAM8-NMME-CAMS) that was used to calculate the surface total suspended particulate ([73]).
InstitutionMeteorological DriverMeteorological Initial FieldsEmission SchemeHorizontal ResolutionVertical ResolutionTransport Size BinsData Assimilation
SEEVCCCNMMEECMWF/IFSUplifting [74]1/3° × 1/3°24 Eta-layers8 bins (0.1–10 µm)Yes (ECMWF dust analysis)
Table 3. Air quality index (AQI) values based on the concentration of PM10 ([75]).
Daily AQI ColorRemotesensing 16 02384 i001Remotesensing 16 02384 i002Remotesensing 16 02384 i003Remotesensing 16 02384 i004Remotesensing 16 02384 i005Remotesensing 16 02384 i006
Level of Health ConcernGoodModerateUnhealthy for Sensitive GroupsUnhealthyVery UnhealthyHazardous
PM10 (µg/m3)0–5455–154155–254255–354355–424>424
AQI0–5051–100101–150151–200201–300>300
Disclaimer/Publisher’s Note: The statements, opinions and data contained in all publications are solely those of the individual author(s) and contributor(s) and not of MDPI and/or the editor(s). MDPI and/or the editor(s) disclaim responsibility for any injury to people or property resulting from any ideas, methods, instructions or products referred to in the content.

