Article

Monitoring Net Primary Productivity of Vegetation and Analyzing Its Drivers in Support of SDG Indicator 15.3.1: A Case Study of Northeast China

by
Yue Qiu
1,2,
Xuesheng Zhao
2,*,
Deqin Fan
2,
Zhoutao Zheng
3,
Yuhan Zhang
2 and
Jinyu Zhang
2
1
Information Technology Research Center, Beijing Academy of Agriculture and Forestry Sciences, Beijing 100097, China
2
College of Geoscience and Surveying Engineering, China University of Mining and Technology (Beijing), Beijing 100083, China
3
Lhasa Plateau Ecosystem Research Station, Key Laboratory of Ecosystem Network Observation and Modeling, Institute of Geographic Sciences and Natural Resources Research, Chinese Academy of Sciences, Beijing 100101, China
*
Author to whom correspondence should be addressed.
Remote Sens. 2024, 16(13), 2455; https://doi.org/10.3390/rs16132455
Submission received: 28 March 2024 / Revised: 9 June 2024 / Accepted: 2 July 2024 / Published: 4 July 2024

Abstract

:
Assessing Sustainable Development Goal (SDG) indicator 15.3.1, which refers to the proportion of degraded land to total land area, and analysing its status and drivers is essential for the development of policies to promote the early achievement of SDG target 15.3 of Land Degradation Neutrality (LDN). In this study, Northeast China was selected as the study area, and the progress of indicator 15.3.1 was assessed based on the perspective of Net Primary Productivity (NPP) calculated by the CASA model. WorldPop population spatial distribution data were used as a proxy for human activities, combined with climate data to calculate the effects of changes in temperature, precipitation and population spatial distribution on vegetation NPP based on the partial correlation coefficient method and the Geodetector method. The results showed that 92.81% of the areas that passed the test of significance showed an increasing trend in vegetation NPP from 2000 to 2020. The vegetation NPP was affected by a combination of temperature, precipitation and population. The effects of temperature and precipitation on spatial differences in NPP for various vegetation types were significantly greater than those of population, but in high-density population zones, the effects of population on spatial differences in NPP were generally greater than those of temperature and precipitation. Precipitation was the main driver for spatial variation in NPP in deciduous broad-leaved forests, cultivated vegetation and thickets, while temperature was the main driver for spatial variation in NPP in evergreen coniferous forests. Generally, the warming and wetting trend in Northeast China contributed to the accumulation of NPP in cultivated vegetation, thickets, steppes and grasslands. The sensitivity of NPP to temperature and precipitation in deciduous broad-leaved and deciduous coniferous forests varied according to geographical location.

1. Introduction

In September 2015, the 193 member states of the United Nations (UN) agreed on Transforming Our World: the 2030 Agenda for Sustainable Development [1] (hereinafter referred to as the 2030 Agenda). The 2030 Agenda includes 17 interlinked SDGs covering the social, economic, and environmental dimensions of sustainable development and aims to guide all UN member states in formulating and implementing policies that are coordinated with the achievement of the SDGs [2]. The 2030 Agenda is a global plan of action for people, planet and prosperity [3]. In order to monitor, measure and report on the progress of all signatories to the 2030 Agenda in realizing the SDGs, the United Nations Inter-Agency and Expert Group on SDG Indicators (IAEG-SDGs) has developed a global indicator framework that consists of 169 targets and 248 indicators related to the SDGs [2]. Quantitative assessment and dynamic monitoring of the implementation status of SDGs is an important measure to promote and implement the 2030 Agenda [4,5].
SDG indicator 15.3.1 refers to the proportion of degraded land to total land area, which can reflect the gap in the achievement of SDG target 15.3–LDN and is an important indicator for assessing the state of sustainable development of terrestrial ecosystems [6,7]. The United Nations Convention to Combat Desertification (UNCCD) proposed to measure land degradation by assessing indicator 15.3.1 in terms of three dimensions: land cover, land productivity and carbon stocks [8]. In this context, land productivity is the NPP, which refers to the amount of organic matter accumulated by green plants per unit of time and per unit of area [9,10]. Vegetation NPP responds quickly to environmental change and can characterise the degradation, health and productivity of the land, reflecting the net effect of changes in ecosystem functioning on the growth of plants and biomass, where a downward trend in vegetation NPP is often a key characteristic of land degradation [11].
SDG indicator 15.3.1 requires not only an assessment of the state of land degradation but also an analysis of the drivers of change so that interventions can be targeted to promote the sustainable use of land resources and the healthy development of ecosystems [12]. Global warming has a significant impact on the NPP of vegetation by directly affecting metabolic processes such as photosynthesis and respiration in plants [13,14,15]. In addition, human activities are a major driver of vegetation NPP. Large-scale, high-density, high-intensity human activities and the resulting global environmental changes in recent decades are continuously affecting terrestrial ecosystem patterns and processes, and human disturbances to terrestrial ecosystems are intensifying [16], which consequently have an increasingly pronounced impact on vegetation NPP changes. On the one hand, humans play a positive role in NPP changes through interventions such as ecological restoration. For example, Lu et al. [17] investigated the changes in ecosystem carbon stocks in regions where ecological restoration projects had been implemented from 2001 to 2010 and found that more than half of the total annual carbon sink in these regions was attributed to the projects. Chen et al. [18] demonstrated that human activities, primarily the conversion of farmland back to forest and the preservation of natural forests, were the primary agents responsible for altering vegetation NPP and exerted a beneficial impact on vegetation growth in the Hengduan Mountains of China. Yang et al. [19] emphasised the key role of ecological restoration programs in Xinjiang, China, between 2001 and 2009 in increasing vegetation NPP. On the other hand, urbanisation, over-exploitation, and overgrazing brought about by humans play a negative role in NPP changes. For instance, human activities caused 69% of the NPP reduction in northwest China in 2001–2010 [20] and the intensified NPP decline in the grasslands of Uzbekistan and Turkmenistan in 1982–2015 [21].
Understanding the impacts of the two main drivers, climate and human activities, on vegetation NPP is essential for the development of policies to facilitate the early implementation of SDG indicator 15.3.1 [22]. There are many methods to quantify the impacts of human activities and climate change on vegetation NPP [23], the main ones being the following. The regression model uses linear regression equations to describe simple relationships between various drivers and changes in vegetation NPP in terrestrial ecosystems but cannot capture complex relationships [24]. The residual trend method aims to assess the influence of human activities on vegetation by calculating the residue obtained from a multiple regression analysis of climate factors and vegetation indicators [25,26]. Obtaining simulation values with high accuracy requires a large amount of data for regression analysis. One widely used method to assess the impact of human activities on NPP in natural ecosystems is by comparing the potential vegetation NPP (which represents NPP without human disturbance) with the actual vegetation NPP (which considers both climate change and human activities) [27,28]. The calculation process requires a large number of parameters in the vegetation growth process, which are difficult to obtain and may increase the uncertainty of the model. These methods indirectly simulate the impact of human activities on vegetation NPP and do not take into account the real human footprint.
SDG indicators are highly correlated with population and spatial attributes, emphasising the impact of people as socio-economic agents on SDG indicators [29]. Population spatial distribution data can quantify the spatial extent of human activities on Earth on a global scale and can be used to measure the environmental, economic and social impacts of human activities, and the spatial distribution and changes in population play an important role in reflecting the characteristics of the distribution of SDGs and their spatial and temporal effects [29]. Here, data on the spatial distribution of the population were used to characterise human activities. The effects of human activities and climate change on the vegetation NPP dimension of indicator 15.3.1 were analysed to characterise and monitor the sustainable progress of the indicator at multiple levels, allowing the indicator or corresponding target to be interpreted in a broader context. WorldPop products utilise a semi-automated dasymetric mapping method to depict the quantity and characteristics of population distribution. These products have found extensive application in various fields [30,31] and offer a direct means to analyse the influence of human activities on vegetation NPP. GeoDetector is a novel statistical method that effectively detects spatial heterogeneity and identifies the driving factors behind it [32]. Unlike traditional statistical methods, GeoDetector can quantitatively assess the coupled influence of multiple factors on geographical phenomena. The reliability of this method has been extensively demonstrated in ecosystem studies [33].
The ecological environment of Northeast China is currently facing great challenges due to climate warming and frequent human activities [34]. Achieving SDG indicator 15.3.1 in this region by 2030 is, therefore, a very challenging task. The purpose of this study is to assess the sustainable development status of indicator 15.3.1 in Northeast China from 2000 to 2020 from the perspective of vegetation NPP, to analyse the vegetation NPP drivers based on the data of the spatial distribution of the population and other multi-source data, and to help the decision makers to formulate a sustainable management programme to further prevent land degradation and to achieve the SDG indicator 15.3.1 at an early date. The overall idea was to integrate NDVI data, meteorological data and vegetation type data and estimate the spatial distribution of vegetation NPP in Northeast China from 2000 to 2020 based on the CASA model. The census-corrected WorldPop data presented the spatial distribution of the population in Northeast China during the same period. Trends in vegetation NPP, temperature, precipitation, and population were calculated separately using linear regression methods. A pixel-by-pixel partial correlation analysis was conducted to explore the directional and spatial characteristics of population and climate effects on vegetation NPP. The GeoDetector approach was utilised to assess the impact of single factors and factor interactions on vegetation NPP, considering vegetation type and population size.

2. Materials and Methods

2.1. Study Area

Northeast China refers to the northeastern part of China, which encompasses Heilongjiang, Jilin, and Liaoning Provinces, as well as Chifeng, Hulunbuir, Tongliao Cities, and Xing’an League in the Inner Mongolia Autonomous Region. This region experiences a temperate continental monsoon climate. The northeast region is surrounded by the Changbai Mountains in the east, the Xiao Hinggan Mountains in the north, and the Da Hinggan Mountains in the west. In the middle and south, it is characterised by the expansive Northeast Plain (Figure 1). In 2020, the resident population of Northeast China was 109,083,887, a decrease of 7,520,463 people compared with 20 years ago. Northeast China exhibits distinct variations in heat and humidity levels, ranging from warm to cold temperate zones in the south-to-north direction and from humid to semi-humid and semi-arid zones in the east-to-west direction. These variations contribute to the formation of diverse vegetation distributions. This region is sensitive to global climate change and has become an important area for the study of global climate change and terrestrial ecosystems [35].

2.2. Dataset and Data Processing

2.2.1. Data for NPP Calculation

  • Remote Sensing Data
The NDVI data required to calculate NPP was the monthly MOD13A3 data from 2000 to 2020 provided by the NASA LAADS DAAC website (http://ladsweb.nascom.nasa.gov) (accessed on 1 July 2024) with a spatial resolution of 1 km. NDVI data were mosaiced, clipped, projected and converted to TIF format on the basis of the MODIS Reprojection Tool (MRT). The NDVI data for January 2000 were absent for Northeast China. Most of the region’s vegetation was in a non-growing state in January. Based on the results of the January 2001 NPP calculations, it was found that the average NPP value for vegetation in the Northeast was 0.0093 gC·m−2·a−1 and that up to 99.3% of the region had a vegetation NPP of 0, which contributed almost nothing to the accumulation of NPP. Considering that the model for calculating NPP requires continuous monthly NDVI data as input, in order to meet this requirement of the model and in conjunction with the situation that the January NDVI data had very little effect on the calculation of vegetation NPP, the NDVI data of the adjacent year—i.e., January 2001—was used to replace the missing data. The NPP estimated results were validated using data obtained from the yearly MOD17A3 data (2000–2020) in the MODIS products. The original 500 m resolution was resampled to 1 km.
  • Meteorological Data
Raw meteorological data were provided by the China Meteorological Data Service Centre (https://data.cma.cn/) (accessed on 1 July 2024). There were monthly mean temperature and total precipitation data from 2000 to 2020 for 122 stations in and near the study area, as well as monthly solar radiation data for 18 stations. The station location is shown in Figure 1b. With the purpose of maintaining the spatial consistency of meteorological and remote sensing data, raster data with a spatial resolution of 1 km were created from the point data recording meteorological information based on ArcGIS 10.2 software using interpolation methods. Because the Kriging interpolation method is able to comprehensively consider the spatial distribution characteristics of the data [36], the Kriging method was prioritised to interpolate the temperature and precipitation data. The number of solar radiation stations was only 18, which did not meet the requirements of the Kriging interpolation method, so the Inverse Distance Weighting (IDW) method was used to interpolate the solar radiation data. All data used the Albers Conical Equal Area Projection with WGS-84 as the datum.
  • Vegetation Type Data
The vegetation type data were obtained from the vegetation map of the People’s Republic of China (1:1,000,000) [37]. After being clipped and recompiled, there were 12 vegetation types in the study area, as follows: deciduous broad-leaved forests, deciduous, coniferous forests, evergreen coniferous forests, mixed coniferous and broad-leaved forests, alpine vegetation, meadows, cultivated vegetation, grasslands, swamps, thickets, steppes and others (Figure 1).

2.2.2. Population Data

Population spatial distribution data (2000–2020) were derived from the WorldPop dataset (https://www.worldpop.org/) (accessed on 11 June 2024), which had been adjusted to UN national population estimates. Each pixel, whose size is 1 km × 1 km, records the number of people in the corresponding pixel. WorldPop population data were based on multi-source information and a semi-automated dasymetric mapping method to spatialise the population. It can well show the heterogeneity of population distribution and has been widely used [30]. County-level population statistical data for 2000, 2010 and 2020 were obtained from the fifth, sixth and seventh national censuses, respectively.

2.3. Methods

2.3.1. NPP Calculation and Validation

A light-use efficiency model called the Carnegie–Ames–Stanford Approach (CASA) model [38,39] was used to calculate vegetation NPP. The model assumes that ecological processes follow a resource balance and that all resources have an equal limiting effect on plant growth, arguing that any resource that acts as a limiting factor for plant growth can be used in the estimation of NPP, which takes into account plants’ natural growth characteristics and non-biological environmental factors (e.g., temperature, soil and water conditions) that have a regulatory effect on plant photosynthesis. The CASA model, by introducing the influence of the classification accuracy of vegetation cover on the NPP estimation, simulates the maximum light energy utilisation of each vegetation type by using the measured NPP data in China to improve the accuracy of the results. The CASA model is simple to operate, and it has the advantage of being suitable for the estimation of NPP on a regional and large scale. NPP estimated by the CASA model is mainly determined by two variables, that is, absorbed photosynthetically active radiation (APAR) and the actual light use efficiency (ε). NPP (gC·m−2·a−1) is calculated as follows:
N P P x , t = A P A R x , t × ε x , t
where APAR (x, t) represents the APAR (MJ·m−2·month−1) of pixel x in month t; ε (x, t) represents the actual light use efficiency (gC·MJ−1) of pixel x in month t. For the detailed solution procedure, refer to Zhu et al. [39].
The reliability of estimated NPP results can be verified by field observed values or indirect methods. The latter was employed to validate the NPP results estimated based on the CASA model because of the large area and complex vegetation types in the study area, where field-observed NPP was difficult to obtain. MOD17A3 products have been widely accepted worldwide and can be used as a reference for estimated NPPs to indirectly evaluate the reliability of those estimated NPPs [40]. From 2000 to 2020, 1000 valid NPP values of MOD17A3 were randomly selected per year in the study area and were compared and analysed with the estimated NPP at the corresponding time and location. The CASA model characteristics and MOD17A3, with some missing values in the study area, determined that MOD17A3 could not be used directly to represent NPP in this study.

2.3.2. Adjustment of the WorldPop Dataset

To make the WorldPop data as accurate as possible to represent the real population distribution in Northeast China, the ratio of county-level statistical population to the sum of the WorldPop population in the corresponding region was used as the adjustment factor to correct each pixel of WorldPop data in the region. The equation is as follows:
P A i , j = P W i , j × P S i j = 1 n P W i , j
where PAi,j is the adjusted population of pixel j in region i and PWi,j is the WorldPop population of pixel j in region i. PSi is the statistical population of region i. For census years 2000, 2010, and 2020, PSi is obtained from census data. For non-census years, the annual population growth rate calculated from the census data can be applied to estimate the PSi for the target year [41]. The population growth rate is calculated as follows:
r i = ln P T 1 i P T 0 i t 1 t 0
where ri is the annual population growth rate of region i, t0 and t1 (t0 = 2000, t1 = 2010 or t0 = 2010, t1 = 2020) are census years. PT0i is the population of region i in census year t0, and PT1i is the population of region i in census year t1. The population estimates for the target year [42] are calculated as follows:
P T X i = P T 0 i × e r i t x t 0
where tx is the target year and greater than t0, PTXi is the population of region i in non-census year tx, and PT0i, ri, and t0 are as defined above.

2.3.3. Trend Analysis

The pixel-based linear regression analysis can reflect the trend of vegetation NPP and other factors in the study area over time [20]. The equation for the linear regression method is as follows:
Y = a × X + b
where X is the independent variable, indicating time, Y is the dependent variable, indicating vegetation NPP, population, temperature or precipitation, and a and b are constants. The a of the regression equation, i.e., the slope, represents the trend of the dependent variable for each pixel during the study period. If a > 0, it means that the dependent variable tends to increase over time; if a < 0, it means that the dependent variable tends to decrease; if a = 0, it means that there is no significant change in the dependent variable. The calculation of a is as follows:
a = n s = 1 n x s y s s = 1 n x s s = 1 n y s n s = 1 n x s 2 s = 1 n x s 2
where xs represents the year, ys is the dependent variable corresponding to year xs, and n is the length of time from 2000 to 2020, whose value is 21.

2.3.4. Partial Correlation Analysis

Three factors, including temperature, precipitation and population, were discussed in this paper to influence the NPP of vegetation in Northeast China. To analyse the correlation between one of the three factors and vegetation NPP, a second-order partial correlation analysis [43] was employed, which can exclude the disturbance of the other two factors. The correlation coefficient and the first-order partial correlation coefficient need to be calculated in sequence prior to calculating the second-order partial correlation coefficient. The correlation coefficient is calculated as follows:
R xy = k = 1 n x k x ¯ y k y ¯ k = 1 n x k x ¯ 2 k = 1 n y k y ¯ 2
where Rxy is the correlation coefficient of variables x and y, variable x is temperature, precipitation or population, variable y is vegetation NPP, xk is the value of variable x in year k, yk is the value of variable y in year k, x ¯ and y ¯ are the mean values of variables x and y, respectively, and k is the sample size (k = 21). The first-order partial correlation coefficient is calculated as follows:
R x y , z = R x y R x z R y z 1 R x z 2 1 R y z 2
where Rxy,z denotes the first-order partial correlation coefficient, which is the correlation between variables x and y after excluding the effect of variable z. Rxy, Rxz, and Ryz denote the correlation coefficients of variables x and y, variables x and z, and variables y and z, respectively. The second-order partial correlation coefficient is calculated as follows:
R x y , z w = R x y , z R x w , z R y w , z 1 R x w , z 2 1 R y w , z 2
where Rxy,zw denotes the second-order partial correlation coefficient, which is the correlation between variable x and variable y after excluding the effects of variables z and w. Rxy,z, Rxw,z, and Ryw,z denote the first-order partial correlation coefficients between variables x and y, variables x and w, and variables y and w, respectively.

2.3.5. Geographical Detector

The GeoDetector is a statistical method for detecting spatial heterogeneity as well as revealing driving forces [32]. GeoDetector functions include factor detection, interaction detection, risk detection, and ecological detection. Factor detection detects how much of the spatial variation in NPP is explained by the factor temperature, precipitation or population, as measured by the q value, whose expression is as follows:
q = 1 h = 1 L N h σ h 2 N σ 2
where h = 1, …, L is the strata of the factor. Nh and N are the number of units in strata h and the whole area, respectively, and σ h 2 and σ 2 are the variances of the factor in strata h and the whole area, respectively. The value of q belongs to [0, 1], whose larger value indicates the greater spatial heterogeneity of the factor. Temperature, precipitation and population variables were classified by the natural break method.
Interaction detection identifies interactions among different factors. Risk detection and ecological detection are used to test the results of factor detection and interaction detection, respectively. There is a website (http://geodetector.cn/) (accessed on 20 June 2024) detailing the GeoDetector.

3. Results

3.1. NPP Validation and Its Spatio-Temporal Distribution and Changes

3.1.1. Validation of NPP Results

Figure 2 shows the results of the linear regression analysis between the MOD17A3 NPP values randomly sampled and the estimated NPP from the CASA-based model. It can be seen that the two types of NPP values were clustered around the 1:1 line, and there was a significant linear relationship between them (p < 0.001, R2 = 0.48). The mean relative error was 21.21%. The estimated NPP was close to the studies of Yan et al. [44] and Mao et al. [45] in numerical range and spatial distribution. In general, the NPP calculated based on the CASA model met the requirements of the subsequent experiments.

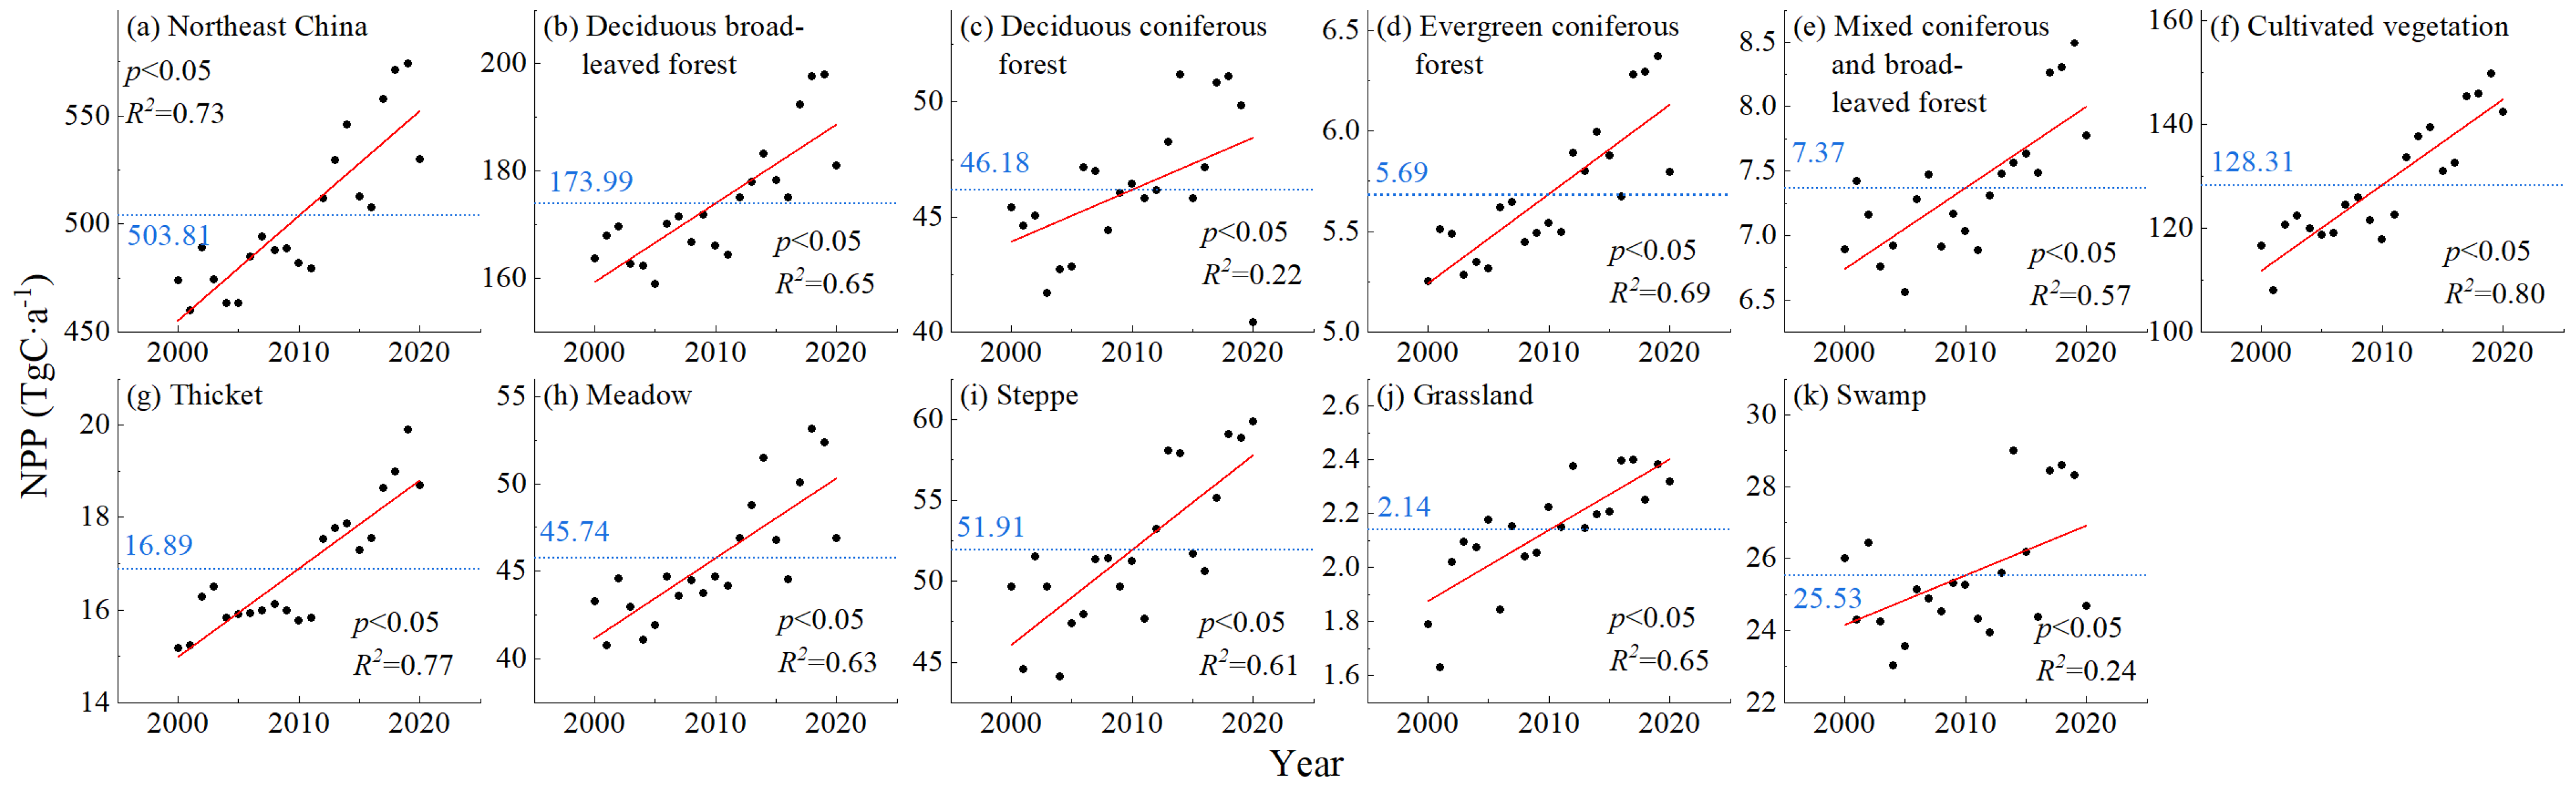
3.1.2. Distribution and Changes of NPP by Vegetation Type

The annual total NPP and its trend for various vegetation types in Northeast China from 2000 to 2020 are shown in Figure 3. Alpine vegetation was extremely scarce, and its distribution only accounted for 0.01% of the area of the study area and the “other” category was mainly non-vegetation areas, so they were not counted here and in subsequent analyses. The average value of the annual total NPP in Northeast China for the years 2000–2020 was 503.81 TgC·a−1 (1 TgC = 1012 gC) (Figure 3a). The annual total NPP showed a significant increasing trend (p < 0.05), with the annual total NPP for the years 2000–2011 all smaller than the mean and the annual total NPP for the years 2012–2020 all larger than the mean. From Figure 3b–k, it can be seen that the mean values of the annual total NPP for each vegetation type were, in descending order, 173.99 TgC·a−1 (deciduous broad-leaved forest), 128.31 TgC·a−1 (cultivated vegetation), 51.91 TgC·a−1 (steppe), 46.18 TgC·a−1 (deciduous, coniferous forest), 45.74 TgC·a−1 (meadow), 25.53 TgC·a−1 (swamp vegetation), 16.89 TgC·a−1 (thicket), 7.37 TgC·a−1 (mixed coniferous and broad-leaved forest), 5.69 TgC·a−1 (evergreen coniferous forest), and 2.14 TgC·a−1 (grassland). The percentages of the area of each vegetation in the study area were, in ascending order, 28.96% (cultivated vegetation), 25.49% (deciduous broad-leaved forest), 12.89% (steppe), 10.22% (meadow), 9.37% (deciduous coniferous forest), 4.46% (thicket), 4.35% (swamp vegetation), 1.50% (evergreen coniferous forest), 1.38% (mixed coniferous and broad-leaved forest) and 0.42% (grassland). The rankings of the area percentage of each vegetation type were similar to the rankings of the mean of their annual total NPP. During 2000–2020, there were significant increases (p < 0.05) in the annual total NPP of deciduous broad-leaved forests, deciduous, coniferous forests, evergreen coniferous forests, mixed coniferous and broad-leaved forests, cultivated vegetation, thickets, meadows, steppes, grasslands and swamp vegetation. From the NPP perspective of the various vegetation types, indicator 15.3.1 in the study area generally showed a favourable development trend.

3.1.3. Spatial-Temporal Distribution and Changes of NPP at the Pixel Scale

The distribution of the mean NPP of vegetation in Northeast China from 2000 to 2020 at the pixel scale was shown in Figure 4a, which was homogeneous with the distribution of vegetation types, topography and other factors. The regions exhibiting high mean NPP values, ranging from 500 to 900 gC·m−2·a−1, were primarily populated by deciduous broad-leaved forests. These regions, situated within the mid-temperate humid zone, benefit from a monsoonal climate that ensures ample water and heat conditions conducive to vegetation growth. The medium mean NPP values ranged from 300 to 500 gC·m−2·a−1. There were many types of vegetation in this area, including evergreen coniferous forests, deciduous, coniferous forests, mixed coniferous and broad-leaved forests, cultivated vegetation, swamp vegetation, meadows and grasslands. Notably, coniferous forests in the same study area exhibited lower productivity compared to broadleaf forests, attributed to their shorter growing period and smaller leaf size (Mao et al., 2014). The low-value area of mean NPP, ranging from 0 to 300 gC·m−2·a−1, was characterised by vegetation types primarily consisting of steppes and thickets. This region was situated within a semi-humid to semi-arid climate zone, experiencing low precipitation levels, which were not favourable for vegetation growth.
The trend of vegetation NPP in Northeast China, spanning from 2000 to 2020, is illustrated in Figure 4b. There were 63.53% of the areas that exhibited statistically significant changes (p < 0.05) primarily located in the eastern Xiao Hinggan Mountains, the Northeast Plain and the Changbai Mountains (Figure A1 in Appendix A). In these regions, the NPP of 7.19% of the vegetation showed a non-change or decreasing trend, and this vegetation was mainly cultivated vegetation distributed in the southern Changbai Mountains and deciduous, coniferous forests distributed in the northwestern part of the Da Hinggan Mountains. The NPP of 92.81% of the vegetation showed an increasing trend, among which 58.78% of the vegetation had an increase in NPP of 0–100 gC·m−2 within 21 years, including a variety of vegetation types mainly distributed in the Xiao Hinggan Mountains, Da Hinggan Mountains, Hulunbuir Plateau and the western Changbai Mountains; 34.03% of the vegetation experienced NPP increase of more than 100 gC·m−2, and their types were mainly cultivated vegetation distributed in the Northeast Plain and deciduous broadleaf forests in the eastern Changbai Mountains. From the perspective of NPP at the pixel scale, 7.19% of the areas that passed the test of significance showed no change or land degradation, which indicated that there were serious challenges to the achievement of target 15.3.1 in these regions, while 92.81% of the areas showed an improvement in the land situation, which indicated that indicator 15.3.1 made progress.

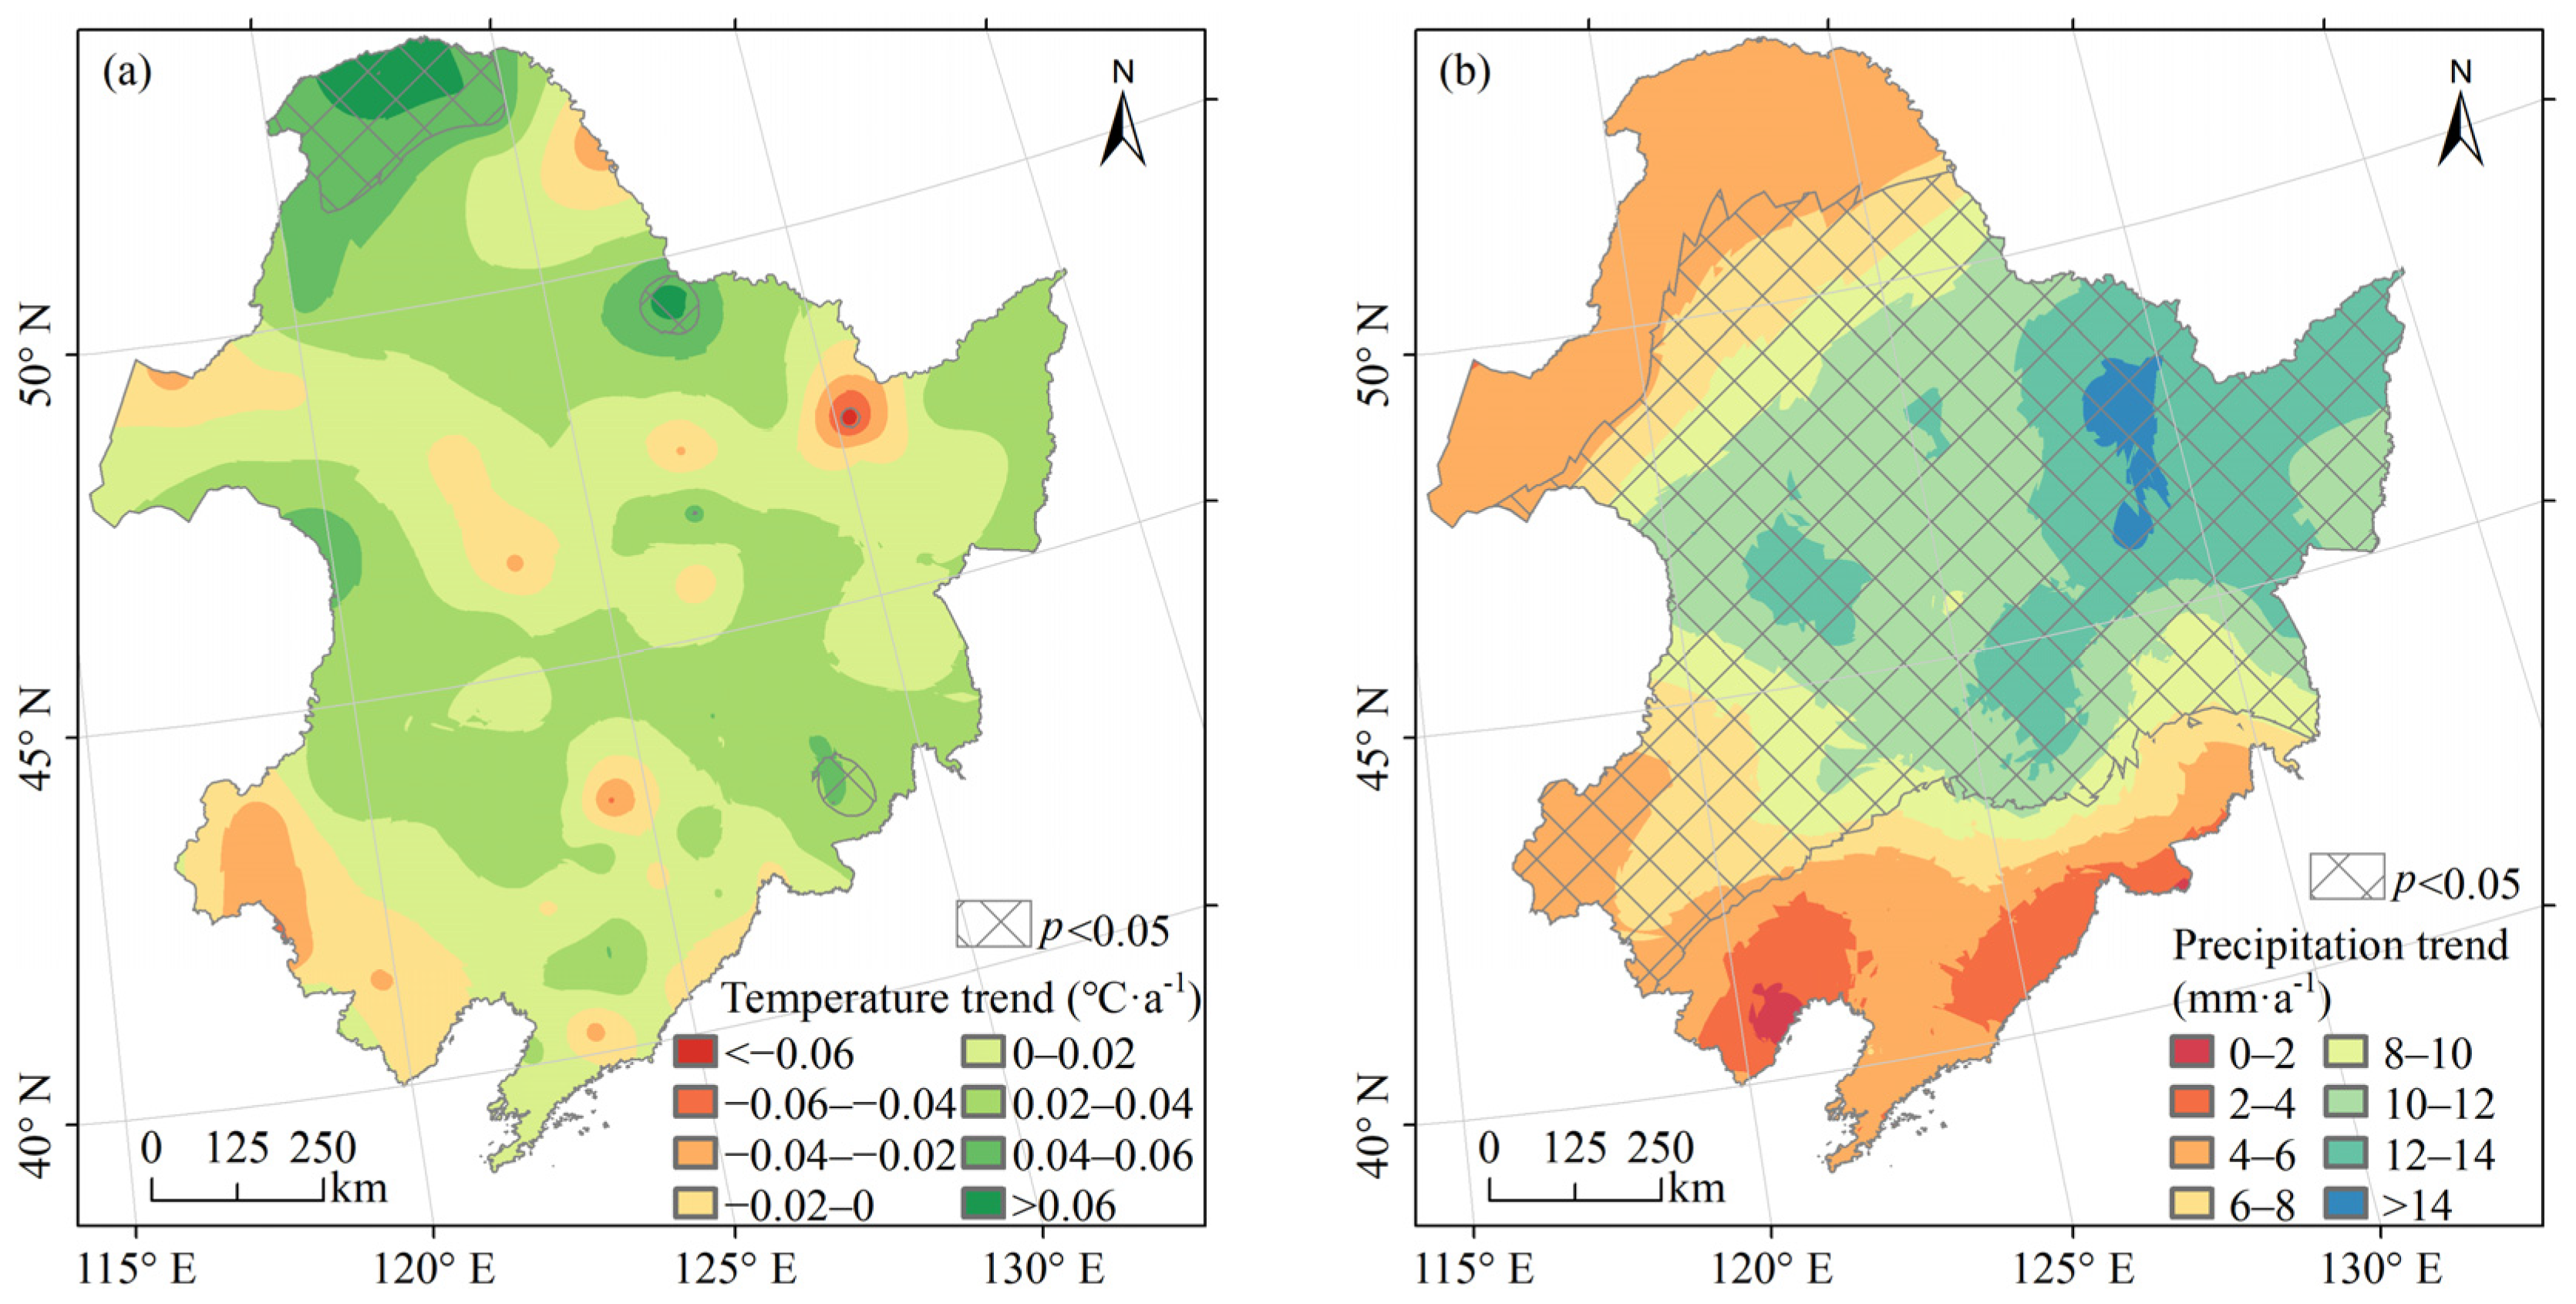
3.2. Changes in Temperature and Precipitation

As shown in Figure 5a, 84.98% of the area showed an increasing trend in annual mean temperature from 2000 to 2020. The annual mean temperature increased significantly (p < 0.05), exceeding 0.04 °C a−1 in the northern Da Hinggan Mountains and northwestern Xiao Hinggan Mountains. The areas where the annual mean temperature tended to decrease were scattered with the characteristic of “point-centered and decreasing outward”. The annual precipitation in Northeast China from 2000 to 2020 showed an increasing trend (Figure 5b), with 69.99% of the area passing the significance test (p < 0.05). Precipitation in the south and north of Northeast China increased slowly between 0 and 8 mm·a−1; in the central part, it increased rapidly, greater than 8 mm·a−1. In general, the climate of Northeast China trended towards warming and wetting from 2000 to 2020.

3.3. Spatial Distribution and Changes of Population

Figure 6a shows the spatial distribution of the population of Northeast China in 2020, with the population in the pixel ranging from 0 to 120,885. To visualise the differences in population distribution, the population values were divided into six groups with the use of the geometrical interval method. The population was sparsely distributed in the Hulunbuir Plateau, the Xiao Hinggan Mountains, the Da Hinggan Mountains and the northern Changbai Mountains, while it was densely distributed in the central plains. With the Landsat 8 imagery of 2020, it was found that the land type corresponding to the high-value area of 1209–120,885 was the buildings where the cities were located. The areas marked as rectangles in Figure 6a were used as examples to show the corresponding Landsat 8 imagery. Population counts decreased outward from point-like centres clustered with high values.
Figure 6b shows the distribution of population trends in Northeast China from 2000 to 2020. Given the large range of values, the standard deviation method was used to categorise the population change values into seven groups to visualise the population trend; 66.74% of the areas met the significance test (p < 0.05) (Figure A2). The population of 92.91% of the areas changed slightly within 21 years, with values ranging from −160 to 148. The areas with large population growth were mainly located in the large cities in Northeast China with high resource concentration, which were the four cities marked in Figure 6b, namely, Harbin, Changchun, Shenyang and Dalian. The areas with a large population decline were mainly small and medium-sized cities. The trend of population change was consistent with the study of Li et al. [46].

3.4. The Impact of Climate and Population Spatial Distribution Changes on Vegetation NPP

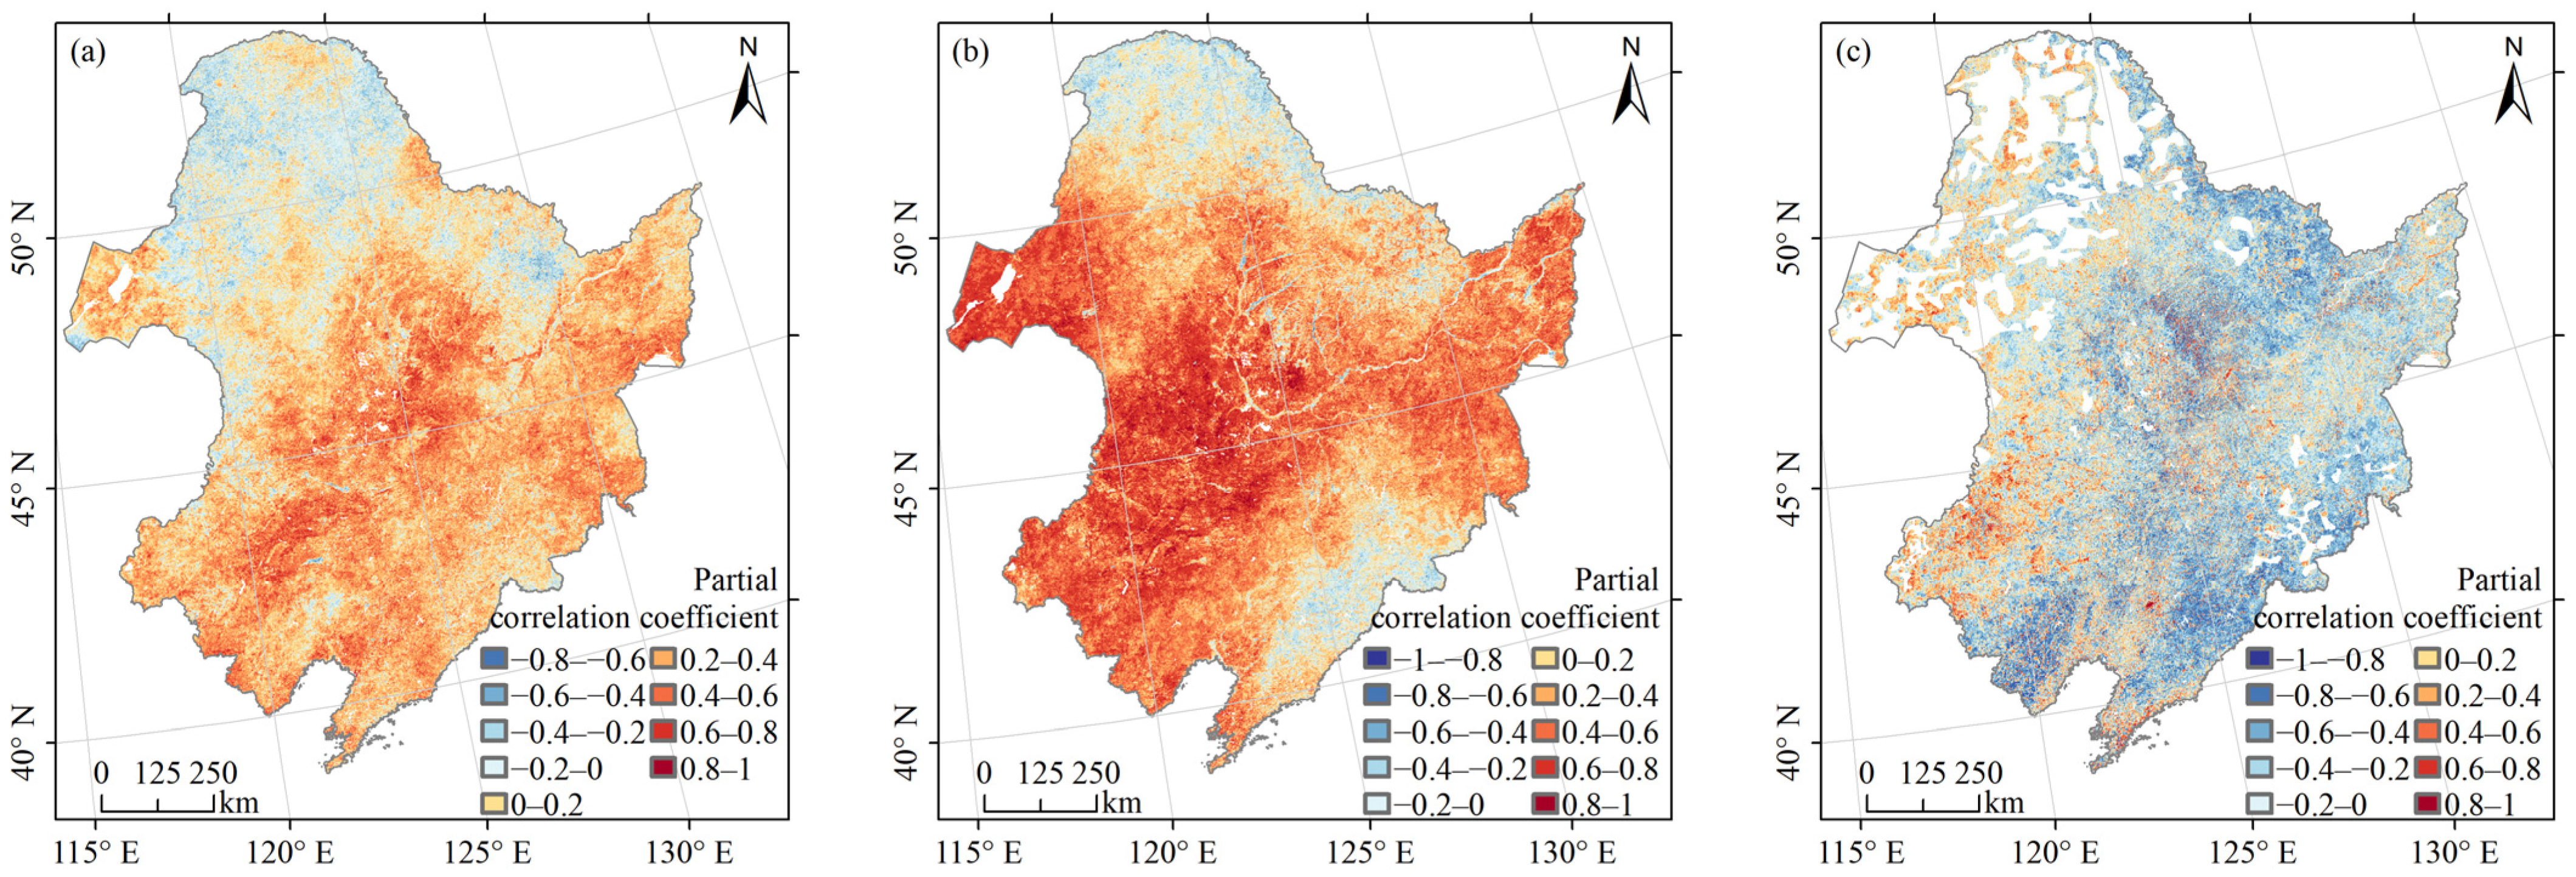
3.4.1. The Impact of Climate and Population Spatial Distribution Changes on Vegetation NPP at the Pixel Scale

Vegetation NPP’s correlation with temperature, precipitation, and population in Northeast China from 2000 to 2020 was analysed at the pixel level using partial correlation analysis. The findings are displayed in Figure 7a. Figure 7a illustrates the partial correlation coefficients between vegetation NPP and temperature, which varied from −0.78 to 0.90. Approximately 23.96% of the regions underwent significance testing (p < 0.05) and were primarily located in the Hulunbuir Plateau, Northeast Plain, and Changbai Mountains (Figure A3a). A negative correlation between vegetation NPP and temperature was found in 24.93% of the areas, among which 24.12% had partial correlation coefficients between −0.4 and 0. These vegetations were mainly deciduous, coniferous forests located in the northeast and northwest of the Da Hinggan Mountains, grasslands in the western part of the Da Hinggan Mountains, and deciduous broad-leaved forests in the eastern part of the Da Hinggan Mountains and the eastern part of the Xiao Hinggan Mountains. A positive correlation between vegetation NPP and temperature was found in 74.83% of the areas, among which 57.09% of the areas had partial correlation coefficients between 0 and 0.4. These were cultivated vegetation, mixed coniferous and broad-leaved forests, thickets, steppes, grasslands, swamps (in the southern Da Hinggan Mountains), deciduous broad-leaved forests (in the Changbai Mountains, northwestern Xiao Hinggan Mountains and southern Da Hinggan Mountains), evergreen coniferous forests (in the Changbai Mountains), deciduous coniferous forests (in the southern and northern Da Hinggan Mountains). Another 17.74% of the regions had partial correlation coefficients greater than 0.4, which were mainly cultivated vegetation, deciduous broad-leaved forests (in the northern Changbai Mountains), and steppes (in the western part of the Northeast Plain and the Hulunbuir Plateau).
Figure 7b displays the partial correlation coefficients between vegetation NPP and precipitation, showing a wide range of values from −0.88 to 0.95. The significance test (p < 0.05) revealed that 52.09% of the areas exhibited significant correlations, particularly in regions like the Hulunbeier Plateau, the Northeast Plain, and the northern Changbai Mountains (Figure A3b). Among the areas that passed the test, 15.57% showed a negative correlation between vegetation NPP and precipitation, with 14.85% falling within partial correlation coefficients ranging from −0.4 to 0. These areas were primarily characterised by deciduous broad-leaved forests (in the southern Changbai Mountains and the eastern and northwestern Xiao Hinggan Mountains), meadows (in the northern Da Hinggan Mountains), evergreen coniferous forests (in the northern Da Hinggan Mountains) and deciduous coniferous forests (in the northern Da Hinggan Mountains). On the contrary, 84.29% of the areas displayed a positive correlation between vegetation NPP and precipitation, with 38.09% falling within partial correlation coefficients ranging from 0 to 0.4. Additionally, 46.20% of the areas showed partial correlation coefficients greater than 0.4, with vegetation types including cultivated vegetation (in the western part of the Northeast Plain and the southern and northern parts of the Changbai Mountains), deciduous broad-leaved forests (in the western part of the Northeast Plain and the southern and northern parts of the Changbai Mountains), thickets (in the southern part of the Northeast Plain), grasslands (in the southern part of the Northeast Plain), deciduous, coniferous forests (in the southern part of the Da Hinggan Mountains) and steppes.
In Figure 7c, partial correlation coefficients were shown for the relationship between vegetation NPP and population, with values ranging from −0.97 to 0.97. The significance test (p < 0.05) was passed by 30.43% of the regions, predominantly in the Xiao Hinggan Mountains, Northeast Plain, and Changbai Mountains (Figure A3c). Since some areas have been without population distribution for 21 years, the partial correlation analysis results were null, corresponding to the blank area of the study area. There were 59.26% of the areas where vegetation NPP was negatively correlated with population, among which 38.33% of the areas had partial correlation coefficients between −0.4 and 0, with scattered distribution. Another 20.93% of the areas with partial correlation coefficients less than −0.4 were mainly distributed in the southern and northern parts of the Northeast Plain, the Xiao Hinggan Mountains and the southern Changbai Mountains. In addition, there were 26.94% of the areas where vegetation NPP was positively correlated with population, with 22.27% of the areas having partial correlation coefficients between 0 and 0.4 and 4.67% of the areas exceeding 0.4, mainly in the southwestern part of the Northeast Plain.
Generally, the trend of climate warming and wetting in Northeast China from 2000 to 2020 contributed to the accumulation of NPP in cultivated vegetation, thickets, steppes and grasslands. The response of NPP to temperature and precipitation in deciduous broad-leaved and deciduous, coniferous forests varied according to geographical location during 2000–2020. From Figure 7a and Figure A3a, with the rise in temperature, NPP increased significantly for the deciduous broad-leaved forests in the Changbai Mountain and Northeast Plain, whereas there was no significant change in NPP in deciduous coniferous forests in the Da Hinggan Mountains. From Figure 7b and Figure A3b, as precipitation increased, the NPP of deciduous broad-leaved forests in the Da Hinggan Mountains, northern and southern Changbai Mountains, and the Northeast Plain increased significantly, while the NPP of deciduous, coniferous forests in the northern Da Hinggan Mountains and the deciduous broad-leaved forests in the central Changbai Mountains did not change significantly. The areas with rapid population growth and those with rapid population decline, which were represented as point-like clusters in Figure 6b, both showed an increasing trend in vegetation NPP.

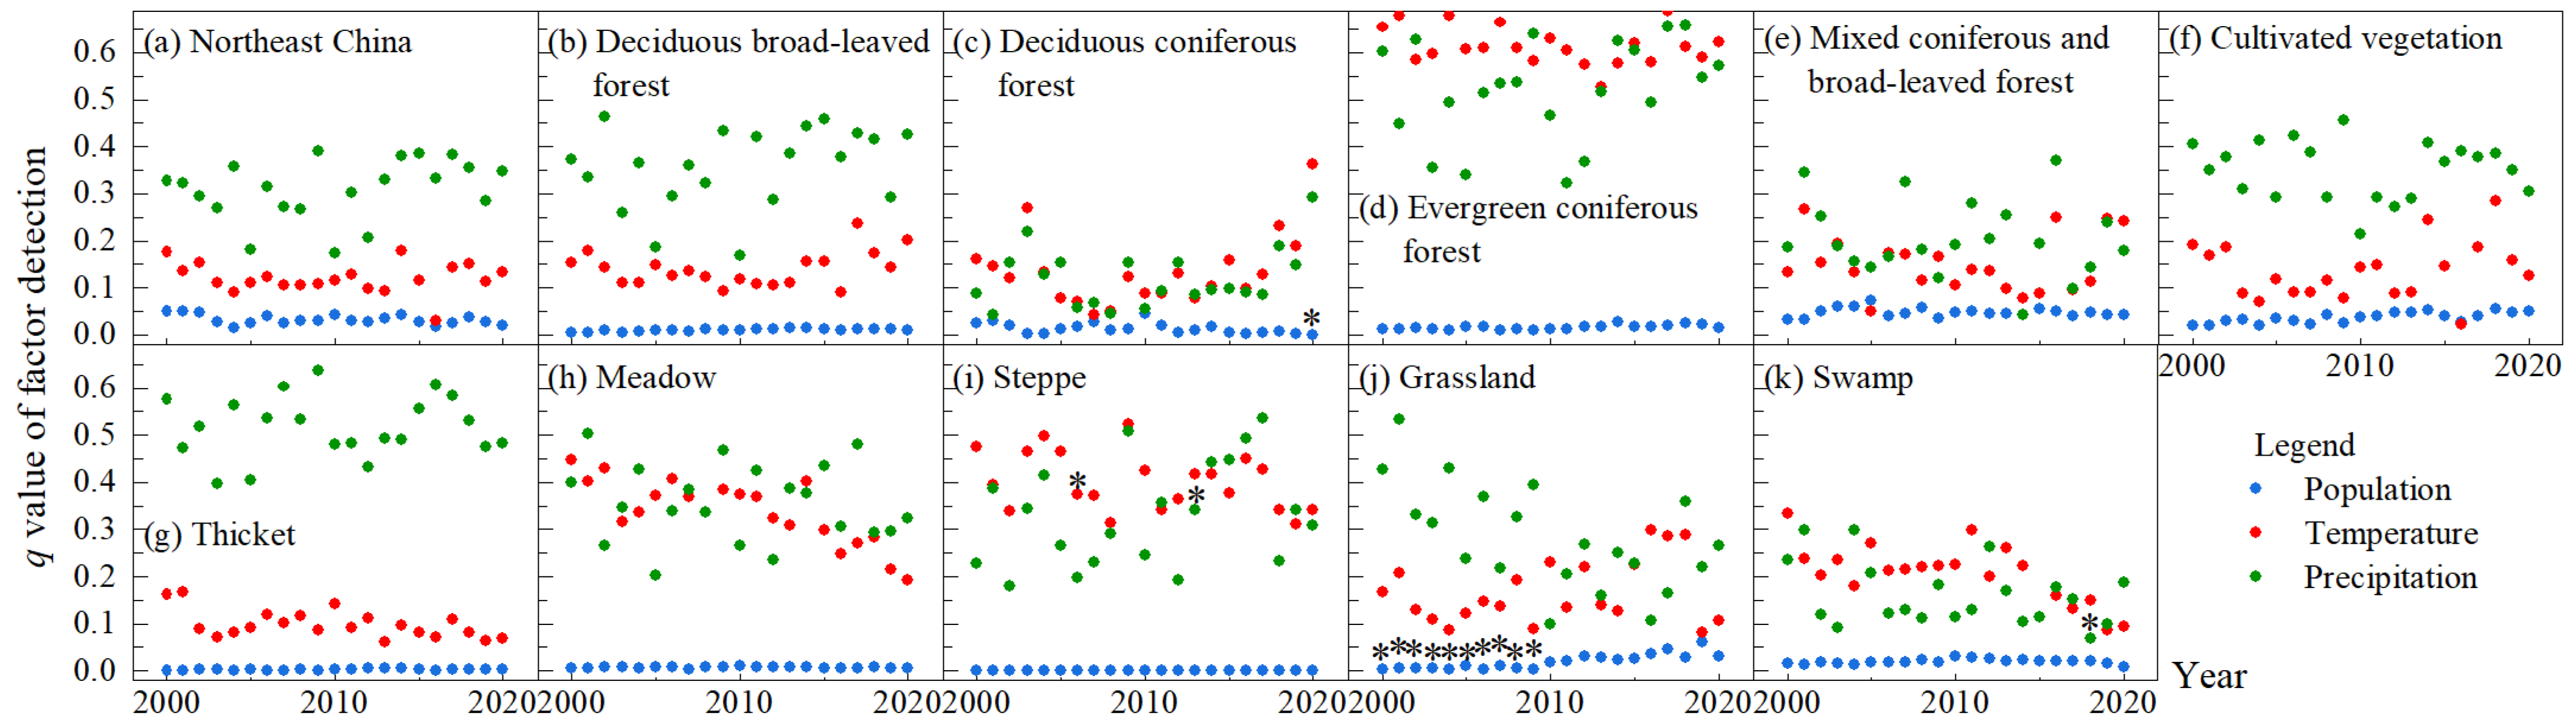
3.4.2. The Degree of Climate and Population Influence on NPP by Vegetation Type

The factor detection method of the GeoDetector was employed to detect the extent to which temperature, precipitation, and population, respectively, explained the spatial differences of vegetation NPP in Northeast China from 2000 to 2020. The q value measured the degree of influence of the factor, with larger q values indicating a stronger influence of the factor on vegetation NPP. The q values for precipitation in Northeast China from 2000 to 2020 ranged from 0.17 to 0.39, for temperature from 0.03 to 0.18, and for population from 0.01 to 0.05 (Figure 8a). The q values of the factors for each year were ranked, in descending order, as precipitation, temperature, and population, indicating that precipitation had the greatest influence on the spatial differences in vegetation NPP in Northeast China, followed by temperature and the smallest population. Figure 8b–k shows the q values of the factor detections of temperature, precipitation and population for the different vegetation types. For deciduous broadleaf forests, cultivated vegetation and thickets in Northeast China, precipitation had the greatest effect on their spatial variation in NPP, followed by temperature and population last. For evergreen coniferous forests, temperature was then the strongest effect of spatial differences in NPP, with precipitation slightly second and population the weakest. For deciduous, coniferous forests, mixed coniferous and broad-leaved forests, meadows, steppes, grasslands and swamps, the dominant factor of spatial differences in NPP changed irregularly over time between temperature and precipitation. The effect of population on the spatial differences in NPP across vegetation types was considerably lower than that of temperature and precipitation factors.
The interaction detection method of the GeoDetector was applied to detect the extent to which any two factors collaboratively among temperature, precipitation and population explained the spatial differences in vegetation NPP in Northeast China from 2000 to 2020. The results were also measured by q values. As shown in Figure 9, the interaction types were bi-factor enhancement and nonlinear enhancement, which indicated that the interaction of any two factors increased the influence on the NPP of Northeast China and each vegetation type, that is, the vegetation NPP was influenced by both climate and population together, rather than a single factor. From 2000 to 2020, for Northeast China and its vegetation types, the q value of the interaction of precipitation and temperature ranked top for each year. In Northeast China, deciduous broad-leaved forests, cultivated vegetation, and thickets ranked second in terms of q value for the interaction of population and precipitation and third in terms of q value for the interaction of population and temperature. Conversely, for evergreen coniferous forests, the q value of the population-temperature interaction ranked second, and the q value of the population-precipitation interaction ranked third. For deciduous, coniferous forests, mixed coniferous and broad-leaved forests, meadows, steppes, grasslands and swamps, the q value for population-precipitation interaction and population-temperature interaction changed irregularly between the second and third ranks. The results revealed that climatic factors had a greater impact on the spatial differences of NPP in Northeast China and its vegetation types than the population from 2000 to 2020.

3.4.3. The Degree of Climate and Population Influence on NPP by Population Size

As seen in Figure 6a, the spatial distribution of the population in Northeast China was uneven. The natural break method was used here to classify the mean population of Northeast China from 2000 to 2020 into three categories, namely, low-density population zone, medium-density population zone, and high-density population zone (Figure A4). The extent to which temperature, precipitation, and population, respectively, explained the spatial differences in NPP by population size in Northeast China from 2000 to 2020 was analysed. As can be seen in Figure 10, in the low and medium density zones, the q values of the population were between 0.01 and 0.05 during 2000–2020, much smaller than the q values of temperature and precipitation due to the low disturbance of the population to the environment. The q values of the factors for each year were precipitation, temperature, and population in descending order, which indicated that precipitation had the strongest effect on the spatial variation of vegetation NPP in low and medium-density zones, followed by temperature and the weakest population. In the high-density population zone, the overall order of q values from 2000 to 2020 was population, precipitation, and temperature in descending order, i.e., population had the strongest effect on NPP spatial differences, precipitation was slightly followed by precipitation, and temperature was the weakest.
The extent to which any two factors collaboratively among temperature, precipitation and population explained the spatial differences in vegetation NPP by population size from 2000 to 2020 was analysed. Similarly, the interaction types were bi-factor enhancement and nonlinear enhancement (Figure 11), again suggesting that vegetation NPP was affected by a combination of climate and population. In the low-density zone, in each year from 2000 to 2020, the q value of the interaction between precipitation and temperature ranked first, the q value of the interaction between population and precipitation ranked second, and the q value of the interaction between population and temperature ranked third. In the medium-density zone, the q values for the interaction of temperature and precipitation were similar to those for the interaction of population and precipitation, both being greater than the q values for the interaction of population and temperature. In the high-density zone, the q-values of temperature-precipitation interaction, temperature-population interaction, and precipitation-population interaction were not much different, with the q-values of population-precipitation interaction being slightly higher than those of temperature-precipitation interaction and population-temperature interaction.

4. Discussion

4.1. Uncertainties in Methods and Data

The aim of this study was to assess the sustainability status of indicator 15.3.1 in Northeast China from 2000 to 2020 from the perspective of vegetation NPP and to analyse the impacts of climate change and human activities on vegetation NPP based on data on the spatial distribution of the population and other multi-source data. Here, the vegetation NPP was calculated in Northeast China based on the CASA model, and the WorldPop data were introduced to characterise the spatial distribution and characteristics of the population in Northeast China. Partial correlation analysis was performed pixel-by-pixel to explore the directionality and spatial characteristics of population and climate effects on vegetation NPP. The GeoDetector method was employed to detect the magnitude of influence of single factors and factor interactions on vegetation NPP by vegetation type and population size. Data interpolation, the accuracy of the vegetation type map, resampling, and the model’s inherent characteristics may bring uncertainty to the results, and the possible sources of uncertainty are discussed below.
MODIS NPP products have been demonstrated to be used as a reference against estimated NPP results to reflect the reliability of the latter [47]. We used this product to indirectly evaluate the accuracy of the NPP results calculated based on the CASA model and found a significant linear relationship between the two. As can be seen from Figure 2, the linear regression equation (i.e., the red line) between the estimated NPP and MODIS NPP did not deviate much from the 1:1 line, and the MODIS NPP at the same time and location was greater than the estimated NPP in the low-value region of the estimated NPP, while in the high-value region, it was less than the estimated NPP. It is well known that MODIS NPP has the problem of underestimating NPP in high-productivity areas and overestimating NPP in low-productivity areas [48]. In addition, other NPP results for vegetation simulated in the Northeast based on the CASA model were analysed, which have been previously evaluated for error through measured data. Mao et al. [45] compared the forest NPP of Northeast China calculated based on MODIS NDVI, AVHRR NDVI and CASA model at 8 km spatial resolution for 1982–2010 with the sampled data, and the results showed that the mean relative error was 18.97%, i.e., the accuracy of estimating forest NPP in Northeast China using CASA model was 81.03%. Zhu et al. [35] used the 1982–2000 vegetation NPP at 8 km spatial resolution calculated based on the AVHRR NDVI and the CASA model in the Northeast China transect for comparison with observed data and showed that the mean relative error was 4.7%. The results calculated using the CASA model were better than those of the Miami and Thorthwaite models. Zhang and Zhou [49] compared the actual NPP data collected from 33 stations within the Northeast China transect with the NPP data simulated by the CASA model and showed that there was a correlation between the two at the significance level (R2 = 0.53, p < 0.001, n = 33). Their results validated the feasibility of the CASA model for estimating vegetation NPP in Northeast China. The results of the NPP estimated in this study were similar to their results in terms of mathematical characteristics and spatial distribution. Therefore, we believed that the vegetation NPP of Northeast China from 2000 to 2020 based on the CASA model simulation was available for subsequent experiments. Certainly, there are the Thornthwaite Memorial model, synthetic model, and other models that can also be used to estimate vegetation NPP, but the CASA model is the most popular and widely used method to estimate vegetation NPP due to its simple operation, easy access to input data and reliability [40]. It should be noted that the interpolation of meteorological data, the source of NDVI data, the accuracy of vegetation types, and the size of spatial resolution will inevitably bring uncertainty to the model [50].
Launched in October 2013, the WorldPop project aims to provide Central America, South America, Africa and Asia with a high-resolution, open-access spatial demographic dataset to address the development and health challenges brought about by rapid population growth [31]. The project proposed a new semi-automated dasymetric mapping approach to expressing the spatial distribution of population [51], which is capable of flexibly integrating geospatial data and generating pixel predictions (i.e., weighting layers) of population density at a specified spatial resolution using a random forest model. Then, the population statistical data were dasymetrically assigned to the pixels according to the weighting layer. Not only did the dataset calculated based on this method have more accuracy than the existing GPW and GRUMP population datasets, but it also could better show the heterogeneity of population spatial distribution [51]. We used census data to adjust the WorldPop dataset to essentially redistribute the population based on the weighting layer as well, making the results close to the true population distribution in the Northeast. In the process of population spatialisation, there is uncertainty in the selection of input data, the expression scale of population disaggregation results and the determination of the population weighting scheme, and the uncertainty may propagate unhindered to the final results [52]. Recently, new data such as three-dimensional building information and volunteered geographic information have been used to spatialise the population, and these methods have richer details of the spatial distribution of the population than the WorldPop product [53]. Nevertheless, WorldPop products are suitable data for quantifying the impact of population change on vegetation NPP at medium resolution due to their long time series advantage and ease of access.
The GeoDetector protects against multicollinearity, and if an independent variable has a significant effect on a dependent variable, then the spatial distribution of the independent and dependent variables should have similarity [54]. GeoDetector as an effective method for driver and factor analysis has been demonstrated many times [55]. The independent variables in the GeoDetector must be type variables and need to classify the temperature, precipitation and population data. Currently, there is a lack of research on the effect of the selection of classification methods on the results. Here, the natural break method was used since it makes the difference between the categories as large as possible and is a common method of classification. Geographically weighted regression (GWR) is also a common method to analyse the factors influencing spatial heterogeneity [56]. Between the GeoDetector and GWR, the former was chosen for its advantage of being able to avoid the problem of multicollinearity and to analyse the interaction among variables [32].

4.2. Effect of Climate and Population Changes on Vegetation NPP

Climate change and human activities are two important drivers of vegetation NPP [57]. Based on the interaction detection method of GeoDetector, it was found that the vegetation NPP in Northeast China was affected by the combined effect of temperature, precipitation and population. According to the report on the assessment of regional climate change in Northeast China [58], from 1961 to 2017, the annual average temperature in the Northeast region increased significantly, and the number of days and intensity of precipitation decreased and increased, respectively. This was consistent with the conclusions of our calculated trends of temperature and precipitation changes in the Northeast region for 2000–2020. Most regional vegetation NPP was positively correlated with temperature and precipitation, which was in line with the findings of Li et al. [34].
Of the three, temperature, precipitation and population, precipitation was the dominant factor driving changes in NPP in deciduous broad-leaved forests, cultivated vegetation and thickets. This agrees with the results of Fang et al. [59]. At the pixel scale, NPP was found to increase significantly (p < 0.05) with increasing precipitation for thickets located in the Northeast Plain, deciduous broad-leaved forests located in the Northeast Plain, southern and northern Changbai Mountains, and southern Da Hinggan Mountains, and cultivated vegetation. The main type of cultivated vegetation in Northeast China is dryland, so vegetation growth is, to some extent, significantly influenced by precipitation. The deciduous broad-leaved forest and thickets, both located in the central part of Changbai Mountain, did not change significantly spatially with increasing precipitation (p > 0.05). From Figure 1a, it can be seen that these areas were mainly located in higher-altitude mountains, and it was possible that the sensitivity of NPP to precipitation decreased with increasing altitude [60]. At the pixel scale, most of the vegetation in the Da Hinggan Mountains and Xiao Hinggan Mountains showed an increasing trend in NPP, but the partial correlation coefficient with precipitation was not significant (p > 0.05), probably because the temperature in this area was low and the increase in precipitation would lead to more clouds, thus reducing incident radiation, which consequently would weaken photosynthesis and affect the growth of vegetation [45].
Temperature was the dominant factor driving NPP changes in evergreen coniferous forests, and the increase in temperature contributed to their NPP accumulation. For deciduous, coniferous forests, mixed coniferous and broad-leaved forests, meadows, steppes, grasslands and swamps, the dominant factor for the difference in NPP varied irregularly over time between temperature and precipitation. Differences in forest sensitivity to precipitation and temperature may derive from soil [61]. At the pixel scale, steppe NPP increased with increasing precipitation, but its response to temperature varied depending on geographic location. Steppes located in the Northeast Plain and the western part of the Hulunbuir Plateau showed a significant increase in NPP with increasing temperature (p < 0.05), while steppes in other locations showed no significant change (p > 0.05). The reason for the difference in temperature sensitivity of steppe NPP may be the different feedback mechanisms of temperature on plant growth. On the one hand, rising temperature can accelerate photosynthetic rate, improve water use efficiency, and extend the growing season [62]. On the other hand, it can increase respiration and speed up evapotranspiration, leading to soil water stress [63].
As seen in Figure 7c, the effect of population spatial distribution on vegetation NPP showed spatial heterogeneity. The results of interaction detection evidenced that population change played a role in the spatial difference of NPP in various vegetation types, and its effect was obviously weaker than that of temperature and precipitation. However, in high-density population zones, the effects of population on spatial differences in NPP were generally greater than those of temperature and precipitation. The results demonstrated the feasibility of assessing progress on indicator 15.3.1 and its drivers from a vegetation NPP perspective based on data on the spatial distribution of the population.
By using the 1 km spatial resolution land use data (https://www.resdc.cn/) (accessed on 10 June 2024) for 2000, 2010 and 2020 derived from the Resource and Environment Science and Data Center, the land-use transfer map was developed, which can clearly express the land composition in different periods and the transfer relationship between different land-use types, as shown in Figure 12. The changes in each land use type between 2000 and 2010 were not obvious. During 2010–2020, mainly grassland, cultivated land and forest land were transferred to each other. Urban and rural, industrial, mining and residential land was gradually expanded, and these mainly occurred in large cities such as Harbin and Changchun. These areas attracted more population, but the resulting frequent disturbance of human activities caused land degradation and a decreasing trend of vegetation NPP. The long-term lack of economic development momentum in Northeast China led to a continuous expansion of population outflow, which mainly occurred in small and medium-sized cities and rural areas. The decrease in population in these areas reduced the pressure on vegetation growth and had a significant positive effect on the accumulation of vegetation NPP. In addition, since the implementation of the “Strategy of Revitalizing the Old Industrial Base”, Northeast China has changed its over-dependence on resource-based industries and reduced pollution and damage to the environment. The government had implemented policies to support the development of agriculture and animal husbandry, ecological protection of the environment, and land restoration, which had significantly improved the agricultural and animal husbandry production environment. These measures have contributed to the ecological restoration and the growth of vegetation NPP.
Unbelievably, the areas with higher population growth that showed point-like clusters in Figure 6b, i.e., the major urban areas in the Northeast, also showed an increasing trend in vegetation NPP. To further investigate this phenomenon, the monthly NDVI changes during the peak vegetation growth period (April–September) in Northeast China from 2000 to 2020 were analysed. The results showed that the NDVI in these areas mainly tended to increase between April and September (Figure A5), which indicated that the increase of the NPP in the areas with a high population was mainly due to good growth, while the population growth did not lead to a decrease in their NPP. Zhang et al. [64] also found that vegetation growth was enhanced within these areas, i.e., there was a broad positive effect of the urban environment on vegetation growth. Therefore, this indirect vegetation growth enhancement may offset, to some extent, the loss of vegetation NPP due to the pressure on vegetation from the increased urban population [26]. Enhanced vegetation growth may be the effect of urban ecological restoration and greening enhancement [65].
In the future, temperatures will continue to rise in Northeast China, and the risk of heavy rainfall, flooding and high temperature disasters will increase [58], and the sensitivity of vegetation growth to temperature and precipitation may decrease [66]. In addition, the strategy of revitalising the old industrial base in Northeast China is being implemented, and the economy and population of the Northeast region will change in the future [67,68]. There is a two-way interaction between humans and nature; on the one hand, the urbanization process brought by human plays a negative role in NPP changes, and on the other hand, human plays a positive role in NPP changes through ecological restoration and other interventions. In future work, it is important to explore the subjective role of human beings in ecological change and to explore the potential of population spatial distribution data in monitoring and evaluating SDG indicators in order to reverse the negative impacts of future population changes and continued warming of the climate on the ecological environment.

5. Conclusions

The aim of this study was to assess the sustainability status of indicator 15.3.1 in Northeast China between 2000 and 2020 from the perspective of vegetation NPP and to analyse its drivers based on data on the spatial distribution of the population and other multi-source data. Based on the CASA model, the spatial distribution of vegetation NPP was estimated by combining NDVI data, meteorological data and vegetation type data, and indicator 15.3.1 was analysed in terms of the type and pixel scales of NPP. An attempt was made to introduce the WorldPop population spatial distribution data as a proxy for human activities to investigate the impacts of two major factors, climate change and human activities, on the vegetation NPP dimension of Indicator 15.3.1. Partial correlation analysis was performed pixel-by-pixel to explore the directionality and spatial characteristics of population and climate effects on vegetation NPP. The GeoDetector approach was applied to detect the magnitude of single factor and factor interaction on vegetation NPP by vegetation type and population size. The main conclusions of this study are as follows:
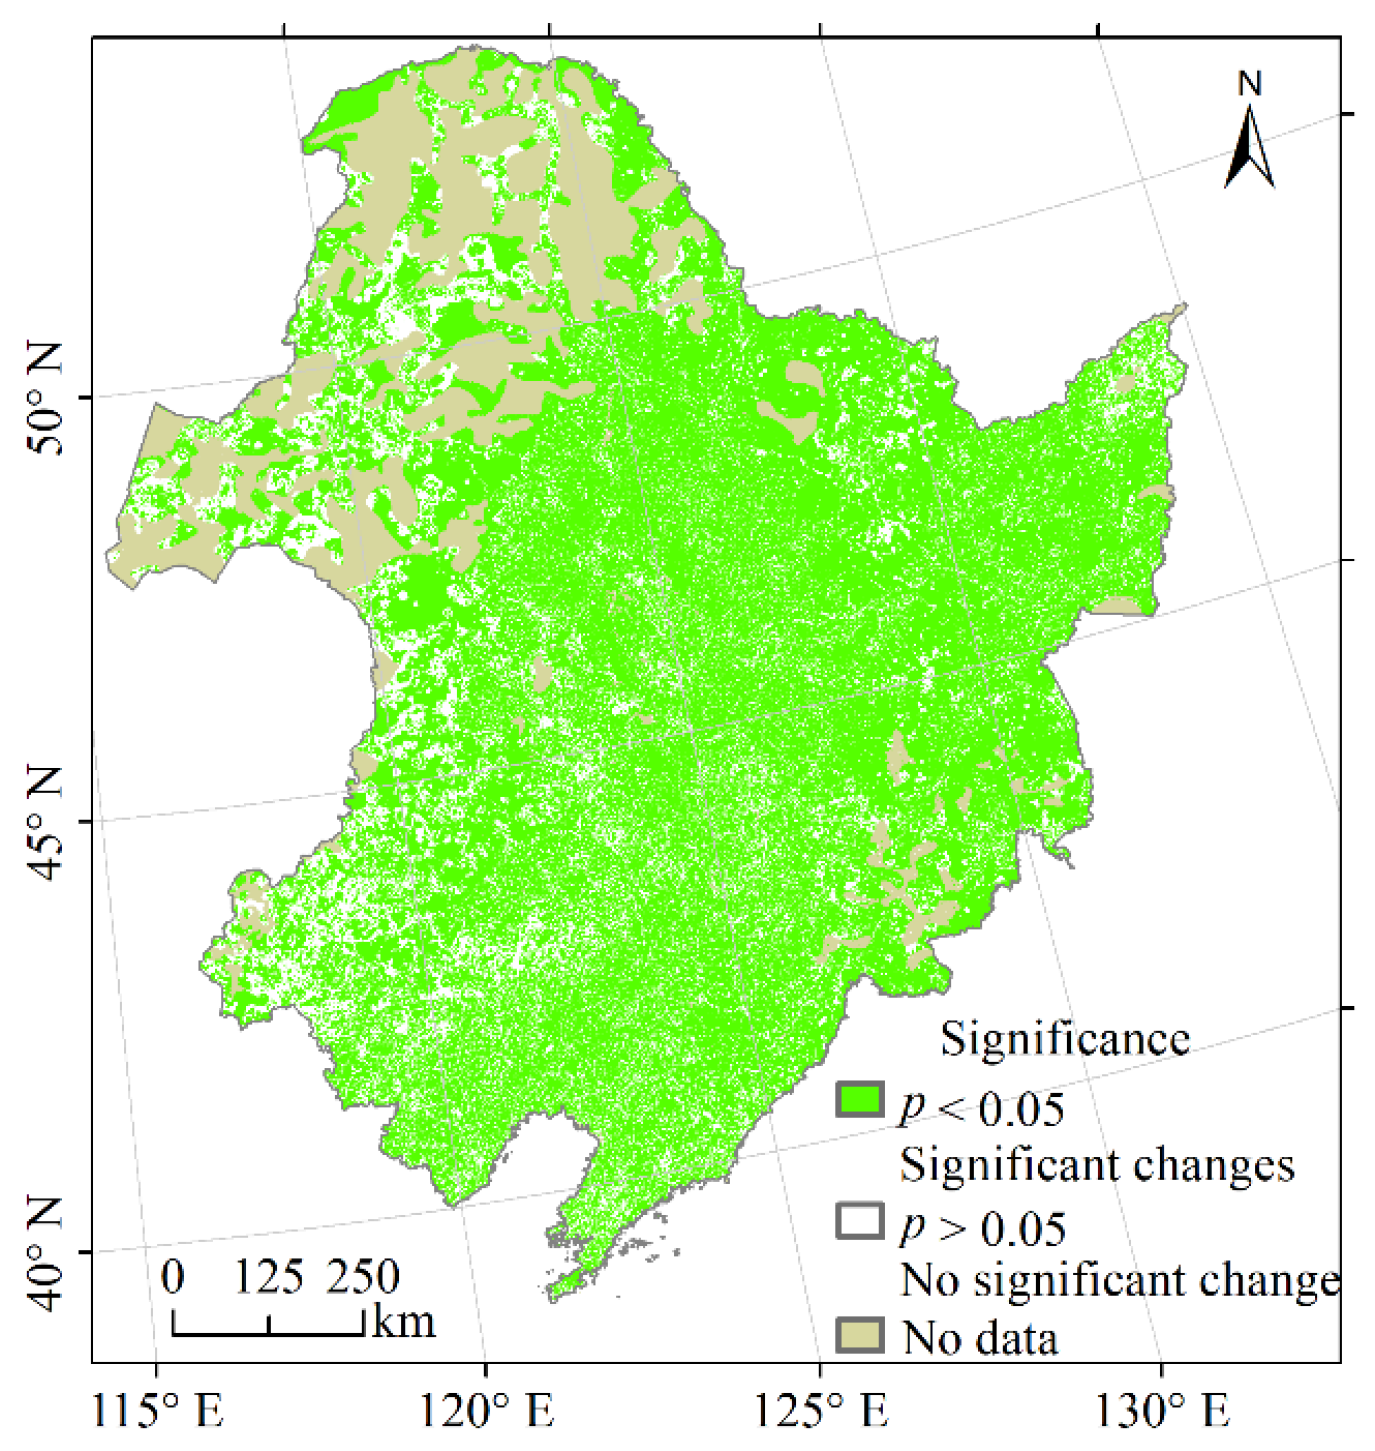
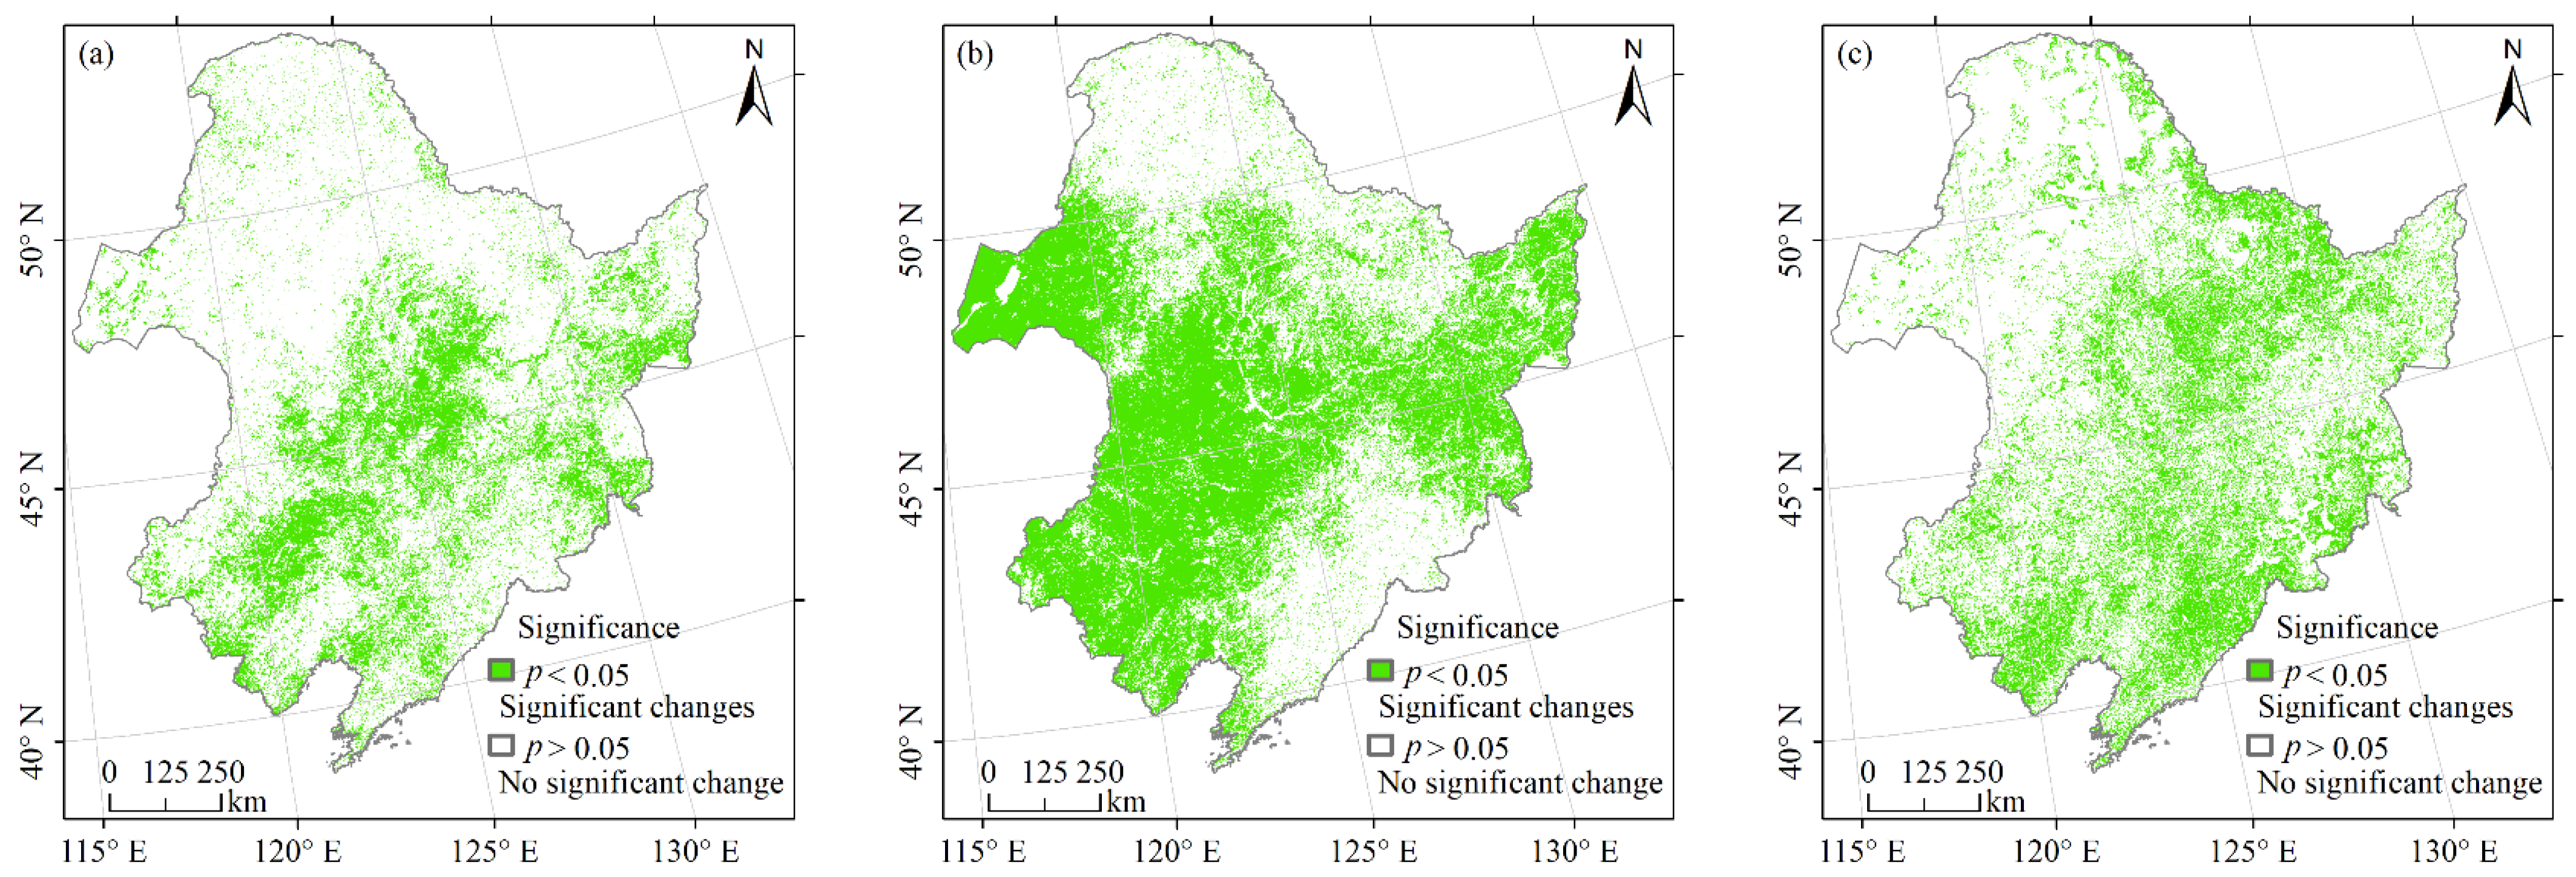
  • From the perspective of NPP of various vegetation types, indicator 15.3.1 in the study area generally showed a favourable development from 2000 to 2020. From the perspective of NPP at the pixel scale, 7.19% of the areas that passed the test of significance showed no change or land degradation, which indicated that there were serious challenges to the achievement of target 15.3.1 in these regions, while 92.81% of the areas showed an improvement in the land situation, which indicated that indicator 15.3.1 made progress;
  • The vegetation NPP in Northeast China in 2000–2020 was affected by the combined effects of temperature, precipitation and population. The effect of population spatial distribution on vegetation NPP showed spatial heterogeneity. It was feasible to use data on the spatial distribution of the population to mine the drivers of indicator 15.3.1 from a vegetation NPP perspective;
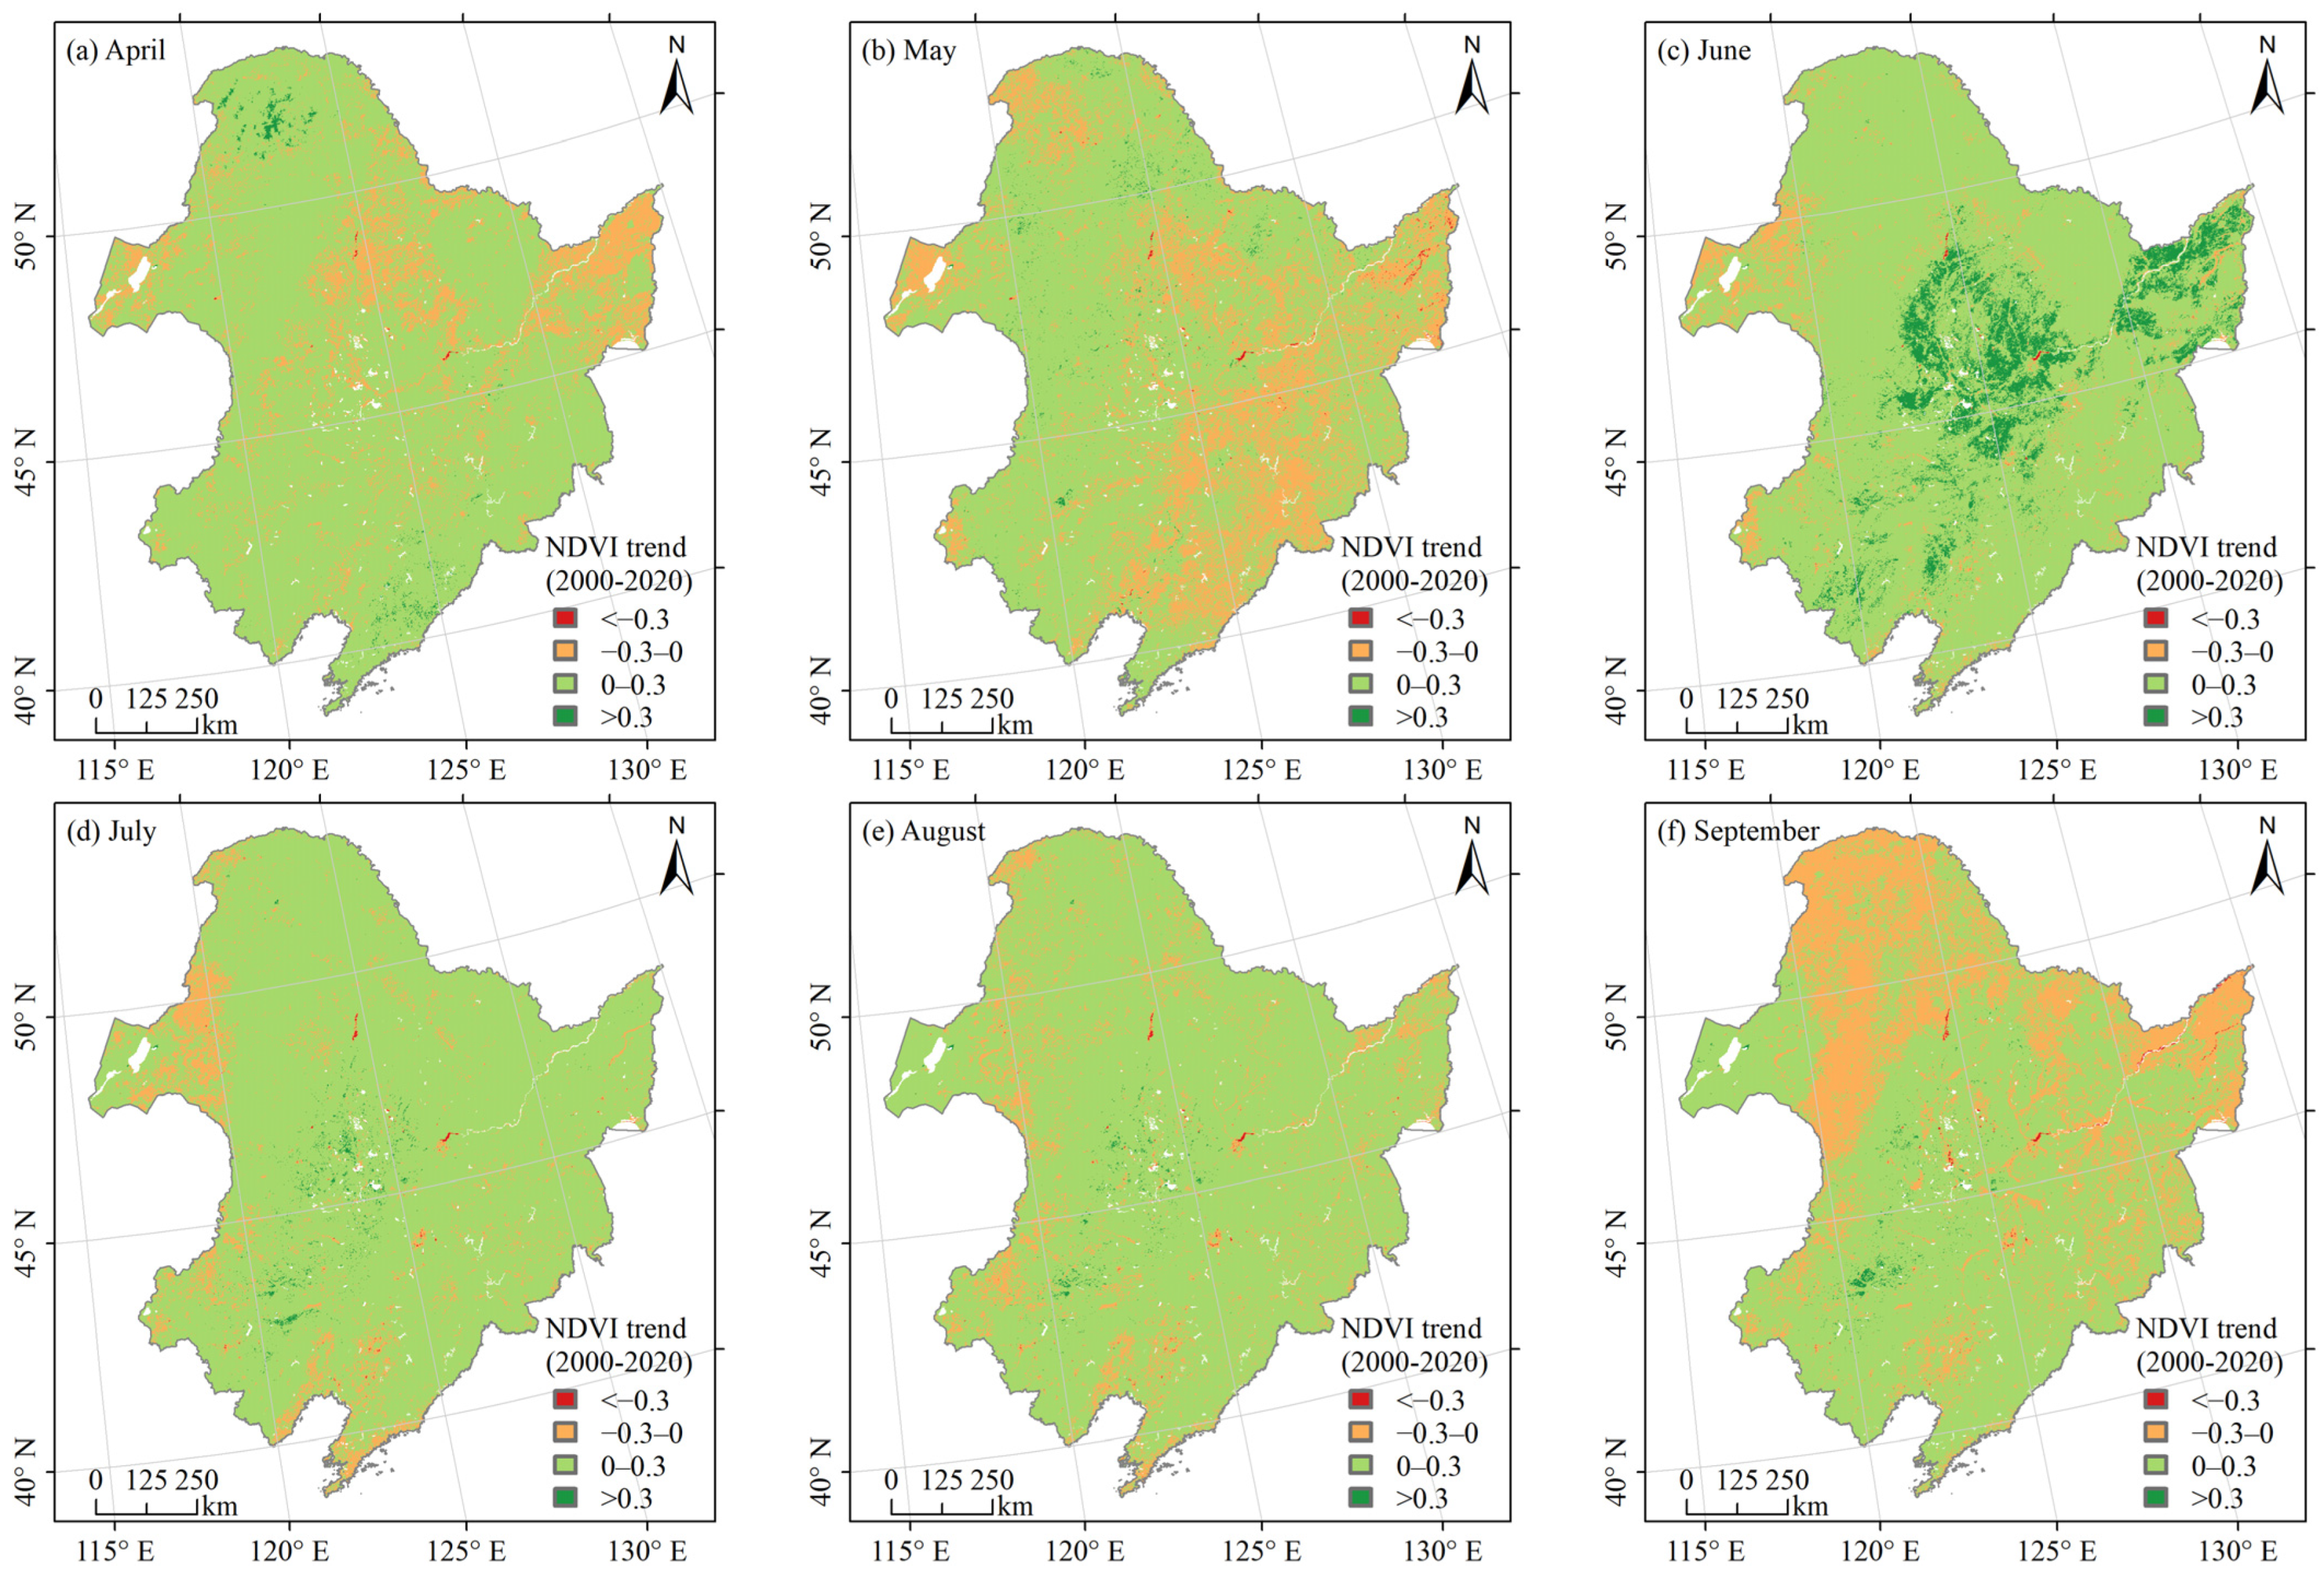
  • The warming and wetting trend in Northeast China from 2000 to 2020 contributed to the accumulation of NPP in cultivated vegetation, thickets, steppes and grasslands. The response of NPP to temperature and precipitation in deciduous broad-leaved and deciduous coniferous forests varied according to geographical location;
  • The vegetation NPP showed an increasing trend in both areas with higher population growth and areas with higher population decreases, and the former was likely the result of enhanced vegetation growth offsetting the loss of vegetation NPP due to larger population growth.
By using a combination of population spatial distribution data, temperature data, precipitation data and vegetation NPP data, the results of the assessment of indicator 15.3.1 can be analysed in depth and in a comprehensive manner. This method not only took into account the socio-economic factors centred on population but also revealed the comprehensive impacts of other potential factors on land degradation. Taking vegetation NPP as an important entry point and optimising and improving the assessment method of the indicator with the help of population, climate and other ancillary data can not only improve the accuracy of the indicator assessment but also provide valuable references and inspiration for the calculation of more land degradation-related SDGs indicators in the future. The main factors driving changes in vegetation NPP, i.e., temperature and precipitation, were considered here. In future studies, the effect of CO2, soil moisture, solar radiation, effective precipitation, and other factors on vegetation NPP could be considered for inclusion in the workflow [69].
In future work, it is important to explore in depth the relationship between population growth and vegetation NPP increase in urban areas, to examine the subjective role of human beings in ecological change, and to explore the potential of population spatial distribution data in monitoring and assessing SDG indicator 15.3.1, in order to reverse the negative impacts of future population changes and continued warming of the climate on the ecological environment. Need to consider the lag effect of climatic and human factors on vegetation NPP.

Author Contributions

Data curation, Z.Z., Y.Z. and J.Z.; writing–original draft, Y.Q.; writing–review and editing, X.Z. and D.F. All authors have read and agreed to the published version of the manuscript.

Funding

This research was funded by the National Natural Science Foundation of China (grant number 41930650, grant number 42371412).

Data Availability Statement

The raw data supporting the conclusions of this article will be made available by the authors upon request.

Acknowledgments

We thank anonymous reviewers and the editor for their insightful comments that further improved our manuscript.

Conflicts of Interest

The authors declare no conflicts of interest.

Appendix A

Figure A1. Significance of vegetation NPP trend in Northeast China from 2000 to 2020.
Remotesensing 16 02455 g0a1
Figure A2. Significance of population trend in Northeast China from 2000 to 2020.
Remotesensing 16 02455 g0a2
Figure A3. Significance of partial correlation coefficients between vegetation NPP and temperature (a), precipitation (b) and population (c).
Remotesensing 16 02455 g0a3
Figure A4. Classification of population mean in Northeast China for 2000–2020.
Remotesensing 16 02455 g0a4
Figure A5. NDVI change in April (a), May (b), June (c), July (d), August (e) and September (f) in Northeast China from 2000 to 2020.
Remotesensing 16 02455 g0a5

References

  1. United Nations. Transforming Our World: The 2030 Agenda for Sustainable Development; United Nations: New York, NY, USA, 2015. [Google Scholar]
  2. United Nations. Global Indicator Framework for the Sustainable Development Goals and Targets of the 2030 Agenda for Sustainable Development; United Nations: New York, NY, USA, 2023. [Google Scholar]
  3. Colglazier, W. Sustainable development agenda: 2030. Science 2015, 349, 1048–1050. [Google Scholar] [CrossRef] [PubMed]
  4. Chen, J.; Li, Z. Chinese pilot project tracks progress towards SDGs. Nature 2018, 563, 184. [Google Scholar] [CrossRef]
  5. Huan, Y.; Liang, T.; Li, H.; Zhang, C. A systematic method for assessing progress of achieving sustainable development goals: A case study of 15 countries. Sci. Total Environ. 2021, 752, 141875. [Google Scholar] [CrossRef]
  6. Jiang, L.; Bao, A.; Jiapaer, G.; Liu, R.; Yuan, Y.; Yu, T. Monitoring land degradation and assessing its drivers to support sustainable development goal 15.3 in Central Asia. Sci. Total Environ. 2022, 807, 150868. [Google Scholar] [CrossRef] [PubMed]
  7. Markos, A.; Sims, N.; Giuliani, G. Beyond the SDG 15.3.1 Good Practice Guidance 1.0 using the Google Earth Engine platform: Developing a self-adjusting algorithm to detect significant changes in water use efficiency and net primary production. Big Earth Data 2023, 7, 59–80. [Google Scholar] [CrossRef]
  8. Sims, N.C.; Newnham, G.J.; England, J.R.; Guerschman, J.; Cox, S.J.D.; Roxburgh, S.H.; Viscarra Rossel, R.A.; Fritz, S.; Wheeler, I. Good Practice Guidance. SDG Indicator 15.3.1, Proportion of Land That Is Degraded over Total Land Area. Version 2.0; United Nations Convention to Combat Desertification: Bonn, Germany, 2021. [Google Scholar]
  9. Field, C.B.; Behrenfeld, M.J.; Randerson, J.T.; Falkowski, P. Primary production of the biosphere: Integrating terrestrial and oceanic components. Science 1998, 281, 237–240. [Google Scholar] [CrossRef]
  10. Piao, S.; He, Y.; Wang, X.; Chen, F. Estimation of China’s terrestrial ecosystem carbon sink: Methods, progress and prospects. Sci. China Earth Sci. 2022, 65, 641–651. [Google Scholar] [CrossRef]
  11. Wang, T.; Giuliani, G.; Lehmann, A.; Jiang, Y.; Shao, X.; Li, L.; Zhao, H. Supporting SDG 15, life on land: Identifying the main drivers of land degradation in Honghe Prefecture, China, between 2005 and 2015. ISPRS Int. J. Geo-Inf. 2020, 9, 710. [Google Scholar] [CrossRef]
  12. Prince, S.D. Challenges for remote sensing of the Sustainable Development Goal SDG 15.3.1 productivity indicator. Remote Sens. Environ. 2019, 234, 111428. [Google Scholar] [CrossRef]
  13. Chu, C.; Bartlett, M.; Wang, Y.; He, F.; Weiner, J.; Chave, J.; Sack, L. Does climate directly influence NPP globally? Glob. Chang. Biol. 2016, 22, 12–24. [Google Scholar] [CrossRef]
  14. Kamali, A.; Khosravi, M.; Hamidianpour, M. Spatial–temporal analysis of net primary production (NPP) and its relationship with climatic factors in Iran. Environ. Monit. Assess. 2020, 192, 718. [Google Scholar] [CrossRef] [PubMed]
  15. Hao, L.; Wang, S.; Cui, X.; Zhai, Y. Spatiotemporal dynamics of vegetation net primary productivity and its response to climate change in Inner Mongolia from 2002 to 2019. Sustainability 2021, 13, 13310. [Google Scholar] [CrossRef]
  16. Overpeck, J.T.; Breshears, D.D. The growing challenge of vegetation change. Science 2021, 372, 786–787. [Google Scholar] [CrossRef] [PubMed]
  17. Lu, F.; Hu, H.; Sun, W.; Zhu, J.; Liu, G.; Zhou, W.; Zhang, Q.; Shi, P.; Liu, X.; Wu, X.; et al. Effects of national ecological restoration projects on carbon sequestration in China from 2001 to 2010. Proc. Natl. Acad. Sci. USA 2018, 115, 4039–4044. [Google Scholar] [CrossRef]
  18. Chen, T.; Peng, L.; Liu, S.; Wang, Q. Spatio-temporal pattern of net primary productivity in Hengduan Mountains area, China: Impacts of climate change and human activities. Chin. Geogr. Sci. 2017, 27, 948–962. [Google Scholar] [CrossRef]
  19. Yang, H.; Mu, S.; Li, J. Effects of ecological restoration projects on land use and land cover change and its influences on territorial NPP in Xinjiang, China. Catena 2014, 115, 85–95. [Google Scholar] [CrossRef]
  20. Zhou, W.; Gang, C.; Zhou, F.; Li, J.; Dong, X.; Zhao, C. Quantitative assessment of the individual contribution of climate and human factors to desertification in northwest China using net primary productivity as an indicator. Ecol. Indic. 2015, 48, 560–569. [Google Scholar] [CrossRef]
  21. Chen, T.; Bao, A.; Jiapaer, G.; Guo, H.; Zheng, G.; Jiang, L.; Chang, C.; Tuerhanjiang, L. Disentangling the relative impacts of climate change and human activities on arid and semiarid grasslands in Central Asia during 1982–2015. Sci. Total Environ. 2019, 653, 1311–1325. [Google Scholar] [CrossRef] [PubMed]
  22. Hu, Y.; Wang, C.; Yu, X.; Yin, S. Evaluating Trends of Land Productivity Change and Their Causes in the Han River Basin, China: In Support of SDG Indicator 15.3.1. Sustainability 2021, 13, 13664. [Google Scholar] [CrossRef]
  23. Bejagam, V.; Sharma, A. Impact of climatic changes and anthropogenic activities on ecosystem net primary productivity in India during 2001–2019. Ecol. Inform. 2022, 70, 101732. [Google Scholar] [CrossRef]
  24. Liu, H.; Jiao, F.; Yin, J.; Li, T.; Gong, H.; Wang, Z.; Lin, Z. Nonlinear relationship of vegetation greening with nature and human factors and its forecast—A case study of Southwest China. Ecol. Indic. 2020, 111, 106009. [Google Scholar] [CrossRef]
  25. Qi, X.; Jia, J.; Liu, H.; Lin, Z. Relative importance of climate change and human activities for vegetation changes on China’s silk road economic belt over multiple timescales. Catena 2019, 180, 224–237. [Google Scholar] [CrossRef]
  26. Ge, W.; Deng, L.; Wang, F.; Han, J. Quantifying the contributions of human activities and climate change to vegetation net primary productivity dynamics in China from 2001 to 2016. Sci. Total Environ. 2021, 773, 145648. [Google Scholar] [CrossRef] [PubMed]
  27. Teng, M.; Zeng, L.; Hu, W.; Wang, P.; Yan, Z.; He, W.; Zhang, Y.; Huang, Z.; Xiao, W. The impacts of climate changes and human activities on net primary productivity vary across an ecotone zone in Northwest China. Sci. Total Environ. 2020, 714, 136691. [Google Scholar] [CrossRef] [PubMed]
  28. Yin, L.; Dai, E.; Zheng, D.; Wang, Y.; Ma, L.; Tong, M. What drives the vegetation dynamics in the Hengduan Mountain region, southwest China: Climate change or human activity? Ecol. Indic. 2020, 112, 106013. [Google Scholar] [CrossRef]
  29. Qiu, Y.; Zhao, X.; Fan, D.; Li, S.; Zhao, Y. Disaggregating population data for assessing progress of SDGs: Methods and applications. Int. J. Digit. Earth 2022, 15, 2–29. [Google Scholar] [CrossRef]
  30. Lloyd, C.T.; Sorichetta, A.; Tatem, A.J. High resolution global gridded data for use in population studies. Sci. Data 2017, 4, 170001. [Google Scholar] [CrossRef] [PubMed]
  31. Tatem, A.J. WorldPop, open data for spatial demography. Sci. Data 2017, 4, 170004. [Google Scholar] [CrossRef] [PubMed]
  32. Wang, J.; Zhang, T.; Fu, B. A measure of spatial stratified heterogeneity. Ecol. Indic. 2016, 67, 250–256. [Google Scholar] [CrossRef]
  33. Wang, Y.; Zhang, Z.; Chen, X. Quantifying influences of natural and anthropogenic factors on vegetation changes based on geodetector: A case study in the Poyang Lake Basin, China. Remote Sens. 2021, 13, 5081. [Google Scholar] [CrossRef]
  34. Li, H.; Zhang, H.; Li, Q.; Zhao, J.; Guo, X.; Ying, H.; Deng, G.; Rihan, W.; Wang, S. Vegetation productivity dynamics in response to climate change and human activities under different topography and land cover in Northeast China. Remote Sens. 2021, 13, 975. [Google Scholar] [CrossRef]
  35. Zhu, W.; Pan, Y.; Liu, X.; Wang, A. Spatio-temporal distribution of net primary productivity along the Northeast China Transect and its response to climatic change. J. For. Res. 2006, 17, 93–98. [Google Scholar] [CrossRef]
  36. Workneh, H.T.; Chen, X.; Ma, Y.; Bayable, E.; Dash, A. Comparison of IDW, Kriging and orographic based linear interpolations of rainfall in six rainfall regimes of Ethiopia. J. Hydrol. Reg. Stud. 2024, 52, 101696. [Google Scholar] [CrossRef]
  37. Zhang, X.S. Vegetation Map of the People’s Republic of China (1:1 000 000); Geology Press: Beijing, China, 2007. [Google Scholar]
  38. Potter, C.S.; Randerson, J.T.; Field, C.B.; Matson, P.A.; Vitousek, P.M.; Mooney, H.A.; Klooster, S.A. Terrestrial ecosystem production: A process model based on global satellite and surface data. Glob. Biogeochem. Cycles 1993, 7, 811–841. [Google Scholar] [CrossRef]
  39. Zhu, W.; Pan, Y.; Zhang, J. Estimation of net primary productivity of Chinese terrestrial vegetation based on remote sensing. Chin. J. Plant Ecol. 2007, 31, 413–424. [Google Scholar]
  40. Sun, J.; Yue, Y.; Niu, H. Evaluation of NPP using three models compared with MODIS-NPP data over China. PLoS ONE 2021, 16, e252149. [Google Scholar] [CrossRef] [PubMed]
  41. Center for International Earth Science Information Network (CIESIN), Columbia University. Documentation for the Gridded Population of the World, Version 4 (GPWv4), Revision 11 Data Sets; NASA Socioeconomic Data and Applications Center (SEDAC): Palisades, NY, USA, 2018. [Google Scholar]
  42. Hathout, D. Modeling population growth: Exponential and hyperbolic modeling. Appl. Math. 2013, 4, 299–304. [Google Scholar] [CrossRef]
  43. Li, Y.; Qin, Y. The response of net primary production to climate change: A case study in the 400 mm annual precipitation fluctuation zone in China. Int. J. Environ. Res. Public Health 2019, 16, 1497. [Google Scholar] [CrossRef] [PubMed]
  44. Yan, M.; Xue, M.; Zhang, L.; Tian, X.; Chen, B.; Dong, Y. A decade’s change in vegetation productivity and its response to climate change over Northeast China. Plants 2021, 10, 821. [Google Scholar] [CrossRef] [PubMed]
  45. Mao, D.; Wang, Z.; Wu, C.; Song, K.; Ren, C. Examining forest net primary productivity dynamics and driving forces in northeastern China during 1982–2010. Chin. Geogr. Sci. 2014, 24, 631–646. [Google Scholar] [CrossRef]
  46. Li, T.; Wang, W.; Deng, L. Analysis of urbanization, industrialization and population agglomeration in Northeast China based on PVAR model. Popul. J. 2018, 40, 75–85. [Google Scholar] [CrossRef]
  47. Jiao, W.; Chen, Y.; Li, W.; Zhu, C.; Li, Z. Estimation of net primary productivity and its driving factors in the Ili River Valley, China. J. Arid Land 2018, 10, 781–793. [Google Scholar] [CrossRef]
  48. Turner, D.P.; Ritts, W.D.; Cohen, W.B.; Gower, S.T.; Running, S.W.; Zhao, M.; Costa, M.H.; Kirschbaum, A.A.; Ham, J.M.; Saleska, S.R.; et al. Evaluation of MODIS NPP and GPP products across multiple biomes. Remote Sens. Environ. 2006, 102, 282–292. [Google Scholar] [CrossRef]
  49. Zhang, F.; Zhou, G. Spatial-temporal variations in net primary productivity along Northeast China transect (NECT) from 1982 to 1999. Chin. J. Plant Ecol. 2008, 32, 798–809. [Google Scholar] [CrossRef]
  50. Liang, W.; Yang, Y.; Fan, D.; Guan, H.; Zhang, T.; Long, D.; Zhou, Y.; Bai, D. Analysis of spatial and temporal patterns of net primary production and their climate controls in China from 1982 to 2010. Agric. For. Meteorol. 2015, 204, 22–36. [Google Scholar] [CrossRef]
  51. Stevens, F.R.; Gaughan, A.E.; Linard, C.; Tatem, A.J. Disaggregating census data for population mapping using random forests with remotely-sensed and ancillary data. PLoS ONE 2015, 10, e107042. [Google Scholar] [CrossRef] [PubMed]
  52. Nagle, N.N.; Buttenfield, B.P.; Leyk, S.; Spielman, S. Dasymetric modeling and uncertainty. Ann. Assoc. Am. Geogr. 2014, 104, 80–95. [Google Scholar] [CrossRef] [PubMed]
  53. Wang, S.; Tian, Y.; Zhou, Y.; Liu, W.; Lin, C. Fine-Scale Population Estimation by 3D Reconstruction of Urban Residential Buildings. Sensors 2016, 16, 1755. [Google Scholar] [CrossRef] [PubMed]
  54. Wang, J.; Hu, Y. Environmental health risk detection with GeogDetector. Environ. Modell. Softw. 2012, 33, 114–115. [Google Scholar] [CrossRef]
  55. Wang, X.; Sun, Y.; Guo, H.; Wang, H. Analysis of soil heavy metal Hg pollution source based on GeoDetector. Pol. J. Environ. Stud. 2022, 31, 347–355. [Google Scholar] [CrossRef]
  56. Wheeler, D.C.; Páez, A. Geographically weighted regression. In Handbook of Applied Spatial Analysis: Software Tools, Methods and Applications; Fischer, M.M., Getis, A., Eds.; Springer: Berlin/Heidelberg, Germany, 2010; pp. 461–486. [Google Scholar]
  57. Guo, B.; Han, B.; Yang, F.; Chen, S.; Liu, Y.; Yang, W. Determining the contributions of climate change and human activities to the vegetation NPP dynamics in the Qinghai-Tibet Plateau, China, from 2000 to 2015. Environ. Monit. Assess. 2020, 192, 663. [Google Scholar] [CrossRef]
  58. Committee for the Compilation of the Northeast Regional Climate Change Assessment Report (2020). Northeast Regional Climate Change Assessment Report: Summary for Policymakers 2020; China Meteorological Press: Beijing, China, 2021. [Google Scholar]
  59. Fang, J.; Piao, S.; Zhou, L.; He, J.; Wei, F.; Myneni, R.B.; Tucker, C.J.; Tan, K. Precipitation patterns alter growth of temperate vegetation. Geophys. Res. Lett. 2005, 32, L21411. [Google Scholar] [CrossRef]
  60. Munson, S.M.; Bunting, E.L.; Bradford, J.B.; Butterfield, B.J.; Gremer, J.R. Plant production responses to precipitation differ along an elevation gradient and are enhanced under extremes. Ecosystems 2019, 22, 699–708. [Google Scholar] [CrossRef]
  61. Peng, S.; Piao, S.; Wang, T.; Sun, J.; Shen, Z. Temperature sensitivity of soil respiration in different ecosystems in China. Soil Biol. Biochem. 2009, 41, 1008–1014. [Google Scholar] [CrossRef]
  62. Liu, Q.; Fu, Y.H.; Zhu, Z.; Liu, Y.; Liu, Z.; Huang, M.; Janssens, I.A.; Piao, S. Delayed autumn phenology in the Northern Hemisphere is related to change in both climate and spring phenology. Glob. Chang. Biol. 2016, 22, 3702–3711. [Google Scholar] [CrossRef] [PubMed]
  63. Wu, X.; Liu, H.; Li, X.; Piao, S.; Ciais, P.; Guo, W.; Yin, Y.; Poulter, B.; Peng, C.; Viovy, N.; et al. Higher temperature variability reduces temperature sensitivity of vegetation growth in Northern Hemisphere. Geophys. Res. Lett. 2017, 44, 6173–6181. [Google Scholar] [CrossRef]
  64. Zhang, L.; Yang, L.; Zohner, C.M.; Crowther, T.W.; Li, M.; Shen, F.; Guo, M.; Qin, J.; Yao, L.; Zhou, C. Direct and indirect impacts of urbanization on vegetation growth across the world’s cities. Sci. Adv. 2022, 8, o95. [Google Scholar] [CrossRef] [PubMed]
  65. Huang, B.; Lu, F.; Wang, X.; Wu, X.; Zhang, L.; Ouyang, Z. Ecological restoration and rising CO2 enhance carbon sink, counteracting climate change in northeastern China. Environ. Res. Lett. 2021, 17, 014002. [Google Scholar] [CrossRef]
  66. Tang, Z.; Ma, J.; Peng, H.; Wang, S.; Wei, J. Spatiotemporal changes of vegetation and their responses to temperature and precipitation in upper Shiyang river basin. Adv. Space Res. 2017, 60, 969–979. [Google Scholar] [CrossRef]
  67. Chen, Y.; Mei, L. Quantitative analysis of population distribution and influencing factors of resource-based cities in Northeast China. Sci. Geogr. Sin. 2018, 38, 402–409. [Google Scholar] [CrossRef]
  68. You, H.; Yang, J.; Xue, B.; Xiao, X.; Xia, J.; Jin, C.; Li, X. Spatial evolution of population change in Northeast China during 1992–2018. Sci. Total Environ. 2021, 776, 146023. [Google Scholar] [CrossRef]
  69. Luo, Z.; Wu, W.; Yu, X.; Song, Q.; Yang, J.; Wu, J.; Zhang, H. Variation of net primary production and its correlation with climate change and anthropogenic activities over the Tibetan Plateau. Remote Sens. 2018, 10, 1352. [Google Scholar] [CrossRef]
Figure 1. Location, vegetation types and elevation (a) of the study area. (b) The location of the meteorological station.
Remotesensing 16 02455 g001
Figure 2. Comparison of estimated NPP with MOD17A3 NPP.
Remotesensing 16 02455 g002
Figure 3. Trends in annual total NPP by vegetation type from 2000 to 2020 in Northeast China. The mean value of the annual total NPP is marked with a blue dotted line, and its trend is marked with a red line.
Remotesensing 16 02455 g003
Figure 4. Mean values and trends of vegetation NPP in Northeast China between 2000 and 2020 at the pixel scale. (a) Distribution of the mean NPP; (b) distribution of the NPP trend.
Remotesensing 16 02455 g004
Figure 5. Changes in annual mean temperature and annual precipitation in Northeast China from 2000 to 2020. (a) shows the trend of annual mean temperature; (b) shows the trend of annual precipitation.
Remotesensing 16 02455 g005
Figure 6. Spatial distribution of the population of Northeast China in 2020 (a) and population changes during 2000–2020 (b).
Remotesensing 16 02455 g006
Figure 7. Partial correlation coefficients between vegetation NPP and temperature (a), precipitation (b) and population (c).
Remotesensing 16 02455 g007
Figure 8. The q values of factor detection from 2000 to 2020 by vegetation type. The * marked above the symbol indicated that the value was not significantly different (p > 0.05).
Remotesensing 16 02455 g008
Figure 9. The q values of interaction detection from 2000 to 2020 by vegetation type. The * marked above the symbol indicated that the value was not significantly different (p > 0.05). Tem, pre and pop represent temperature, precipitation and population, respectively, and ∩ indicates the interaction.
Remotesensing 16 02455 g009
Figure 10. The q values of factor detection from 2000 to 2020 by population size.
Remotesensing 16 02455 g010
Figure 11. The q values of interaction detection from 2000 to 2020 by population size.
Remotesensing 16 02455 g011
Figure 12. Land use transfer in Northeast China, 2000–2020.
Remotesensing 16 02455 g012
Disclaimer/Publisher’s Note: The statements, opinions and data contained in all publications are solely those of the individual author(s) and contributor(s) and not of MDPI and/or the editor(s). MDPI and/or the editor(s) disclaim responsibility for any injury to people or property resulting from any ideas, methods, instructions or products referred to in the content.

