Abstract
Estimation of actual evapotranspiration (ETa) based on reference evapotranspiration (ETo) and the crop coefficient (Kc) remains one of the most widely used ETa estimation approaches. However, its application in non-agricultural and natural environments has been limited, largely due to the lack of well-established Kc coefficients in these environments. Alternate Kc estimation approaches have thus been proposed in such instances, with techniques based on the use of leaf area index (LAI) estimates being quite popular. In this study, we utilised satellite-derived estimates of LAI acquired through the Google Earth Engine geospatial cloud computing platform and machine learning to quantify the water use of a commercial forest plantation situated within the eastern region of South Africa. Various machine learning-based models were trained and evaluated to predict Kc as a function of LAI, with the Kc estimates derived from the best-performing model then being used in conjunction with in situ measurements of ETo to estimate ETa. The ET estimates were then evaluated through comparisons against in situ measurements. An ensemble machine learning model showed the best performance, yielding RMSE and R2 values of 0.05 and 0.68, respectively, when compared against measured Kc. Comparisons between estimated and measured ETa yielded RMSE and R2 values of 0.51 mm d−1 and 0.90, respectively. These results were quite promising and further demonstrate the potential of geospatial cloud computing and machine learning-based approaches to provide a robust and efficient means of handling large volumes of data so that they can be optimally utilised to assist planning and management decisions.
1. Introduction
Commercial afforestation activities in South Africa have been shown to have a major impact on available water resources, specifically stream flow, and are thus highly regulated, with water use licenses being required for their growth [1,2,3]. A decision support tool used to guide and inform the issuing of these licenses utilises outputs from a hydrological model, which when configured, is only able to represent the vegetation characteristics of a select few forestry species. However, with the forestry industry presently using a far larger number of species, clones and hybrids to meet existing timber demands, there is a pressing need to update this tool so that water use licenses are issued in accordance with the hydrological impacts of a particular commercial plantation species, clone or hybrid [4].
Evapotranspiration (ET) is a key variable in hydrological models as it plays a prominent role in the hydrological cycle and energy balance. Subsequently, the accurate quantification of ET is crucial to effectively utilise hydrological models to guide water resources management decisions [5,6,7,8,9]. Several field-based and remote sensing techniques exist that can potentially provide fairly accurate long-term estimates of ET. However, the Food and Agricultural Organization method (FAO56), which uses daily reference evapotranspiration values and monthly crop coefficients (Kc), remains one of the most well-established and extensively utilised approaches for the estimation of ET and thus is used in many hydrological models [8,10,11,12]. This is due to its relative ease of application, strong physical conceptualisation and universal applicability [13].
Reference evapotranspiration represents the ET of a hypothetical reference surface resembling grass (ETo) or alfalfa (ETr) and is computed from meteorological data. The Kc encompasses all the biophysical characteristics of a particular crop and is used as a multiplying factor to relate ETo or ETr to the potential ET rate of the crop [11,14]. Kc values for agricultural crops are well defined and an extensive list of these has been developed and provided by Allen et al. [14]. More recently, Pereira et al. [11] reviewed various studies that provided crop coefficients based on the FAO56 approach to (a) update those originally published by Allen et al. [14], and (b) provide values for several new crops.
Although the FAO56 method has been widely utilised to estimate the ET of many agricultural crops [11,15,16], there has been relatively limited application of this approach for non-agricultural and natural environments [7,17,18,19]. This can be attributed to the lack of well-established crop coefficients for these land-use land-cover classes (LULC) due to limited field-based measurements in these environments [7,15]. Furthermore, these Kc values may not adequately represent spatio–temporal variations or regional-specific growing conditions [15,20]. While this does limit the application of the FAO56 method to estimate ET in non-agricultural and natural environments, Allen et al. [14] outline procedures that can be implemented to derive Kc as a function of variables that directly influence it, such as the fraction of ground cover, soil characteristics, plant height and leaf area index [7,21].
According to Beeri et al. [22], the versatile nature of leaf area index (LAI) has contributed to a growing interest in its use, with several studies demonstrating its potential in estimating Kc and vegetation water use [7,23,24,25,26,27,28,29,30]. LAI is defined as the one-sided (green) leaf area per unit ground surface area [31]. Leaf area plays an important role in regulating the stomatal response to meteorological conditions, as the leaves provide a surface from which vegetation–atmospheric exchanges take place through processes such as photosynthesis, transpiration and respiration [27,32]. Since leaf area plays a major role in driving plant water consumption [27,33], the ability to accurately quantify LAI across space and time can facilitate the improved estimation of water use in non-agricultural and natural environments using the FAO56 method.
LAI data can be acquired through the use of optical in situ instrumentation, direct sampling, LiDaR technology and remote sensing [32,34,35]. However, the use of remote sensing methods is often preferred, as it provides a pragmatic approach to acquiring spatially and temporally explicit LAI data across large geographic extents [36,37]. Over the past decade, numerous global satellite-derived LAI data products have been made available, including the development of several methods to process satellite Earth observation (SEO) data to estimate LAI at various spatial and temporal resolutions [36,37,38].
Furthermore, advances in geospatial cloud computing platforms such as Google Earth Engine (GEE) and the development of user-friendly machine learning programming packages have facilitated the seamless generation of long-term time-series data by providing a more powerful and efficient means of collecting, processing and storing SEO data for a range of applications with those relating to water resources and forestry featuring quite prominently [27,32,39,40].
Since the FAO56 Kc-ETo approach for ET estimation is still extensively utilised, it is vital to have well-defined Kc values that adequately represent a particular LULC class, so that vegetation water consumption can be more accurately estimated using this approach.
Considering the potential of utilising satellite-derived estimates of LAI for the estimation of Kc in non-agricultural and natural environments and the relatively limited research on the use of LAI in concert with machine learning-based approaches to derive spatially and temporally representative Kc estimates in these environments, in this study, we aimed to exploit the capabilities of GEE and machine learning techniques to derive Kc estimates for a commercial forest in the eastern region of South Africa (SA). The specific objectives of this study were to (i) derive Kc as a function of LAI using machine learning, (ii) use these Kc values to estimate ET and, finally, compare these estimates against in situ measurements of ET to evaluate their potential in providing accurate water use data, which in turn can facilitate improved water resources management decisions.
2. Materials and Methods
2.1. Study Area
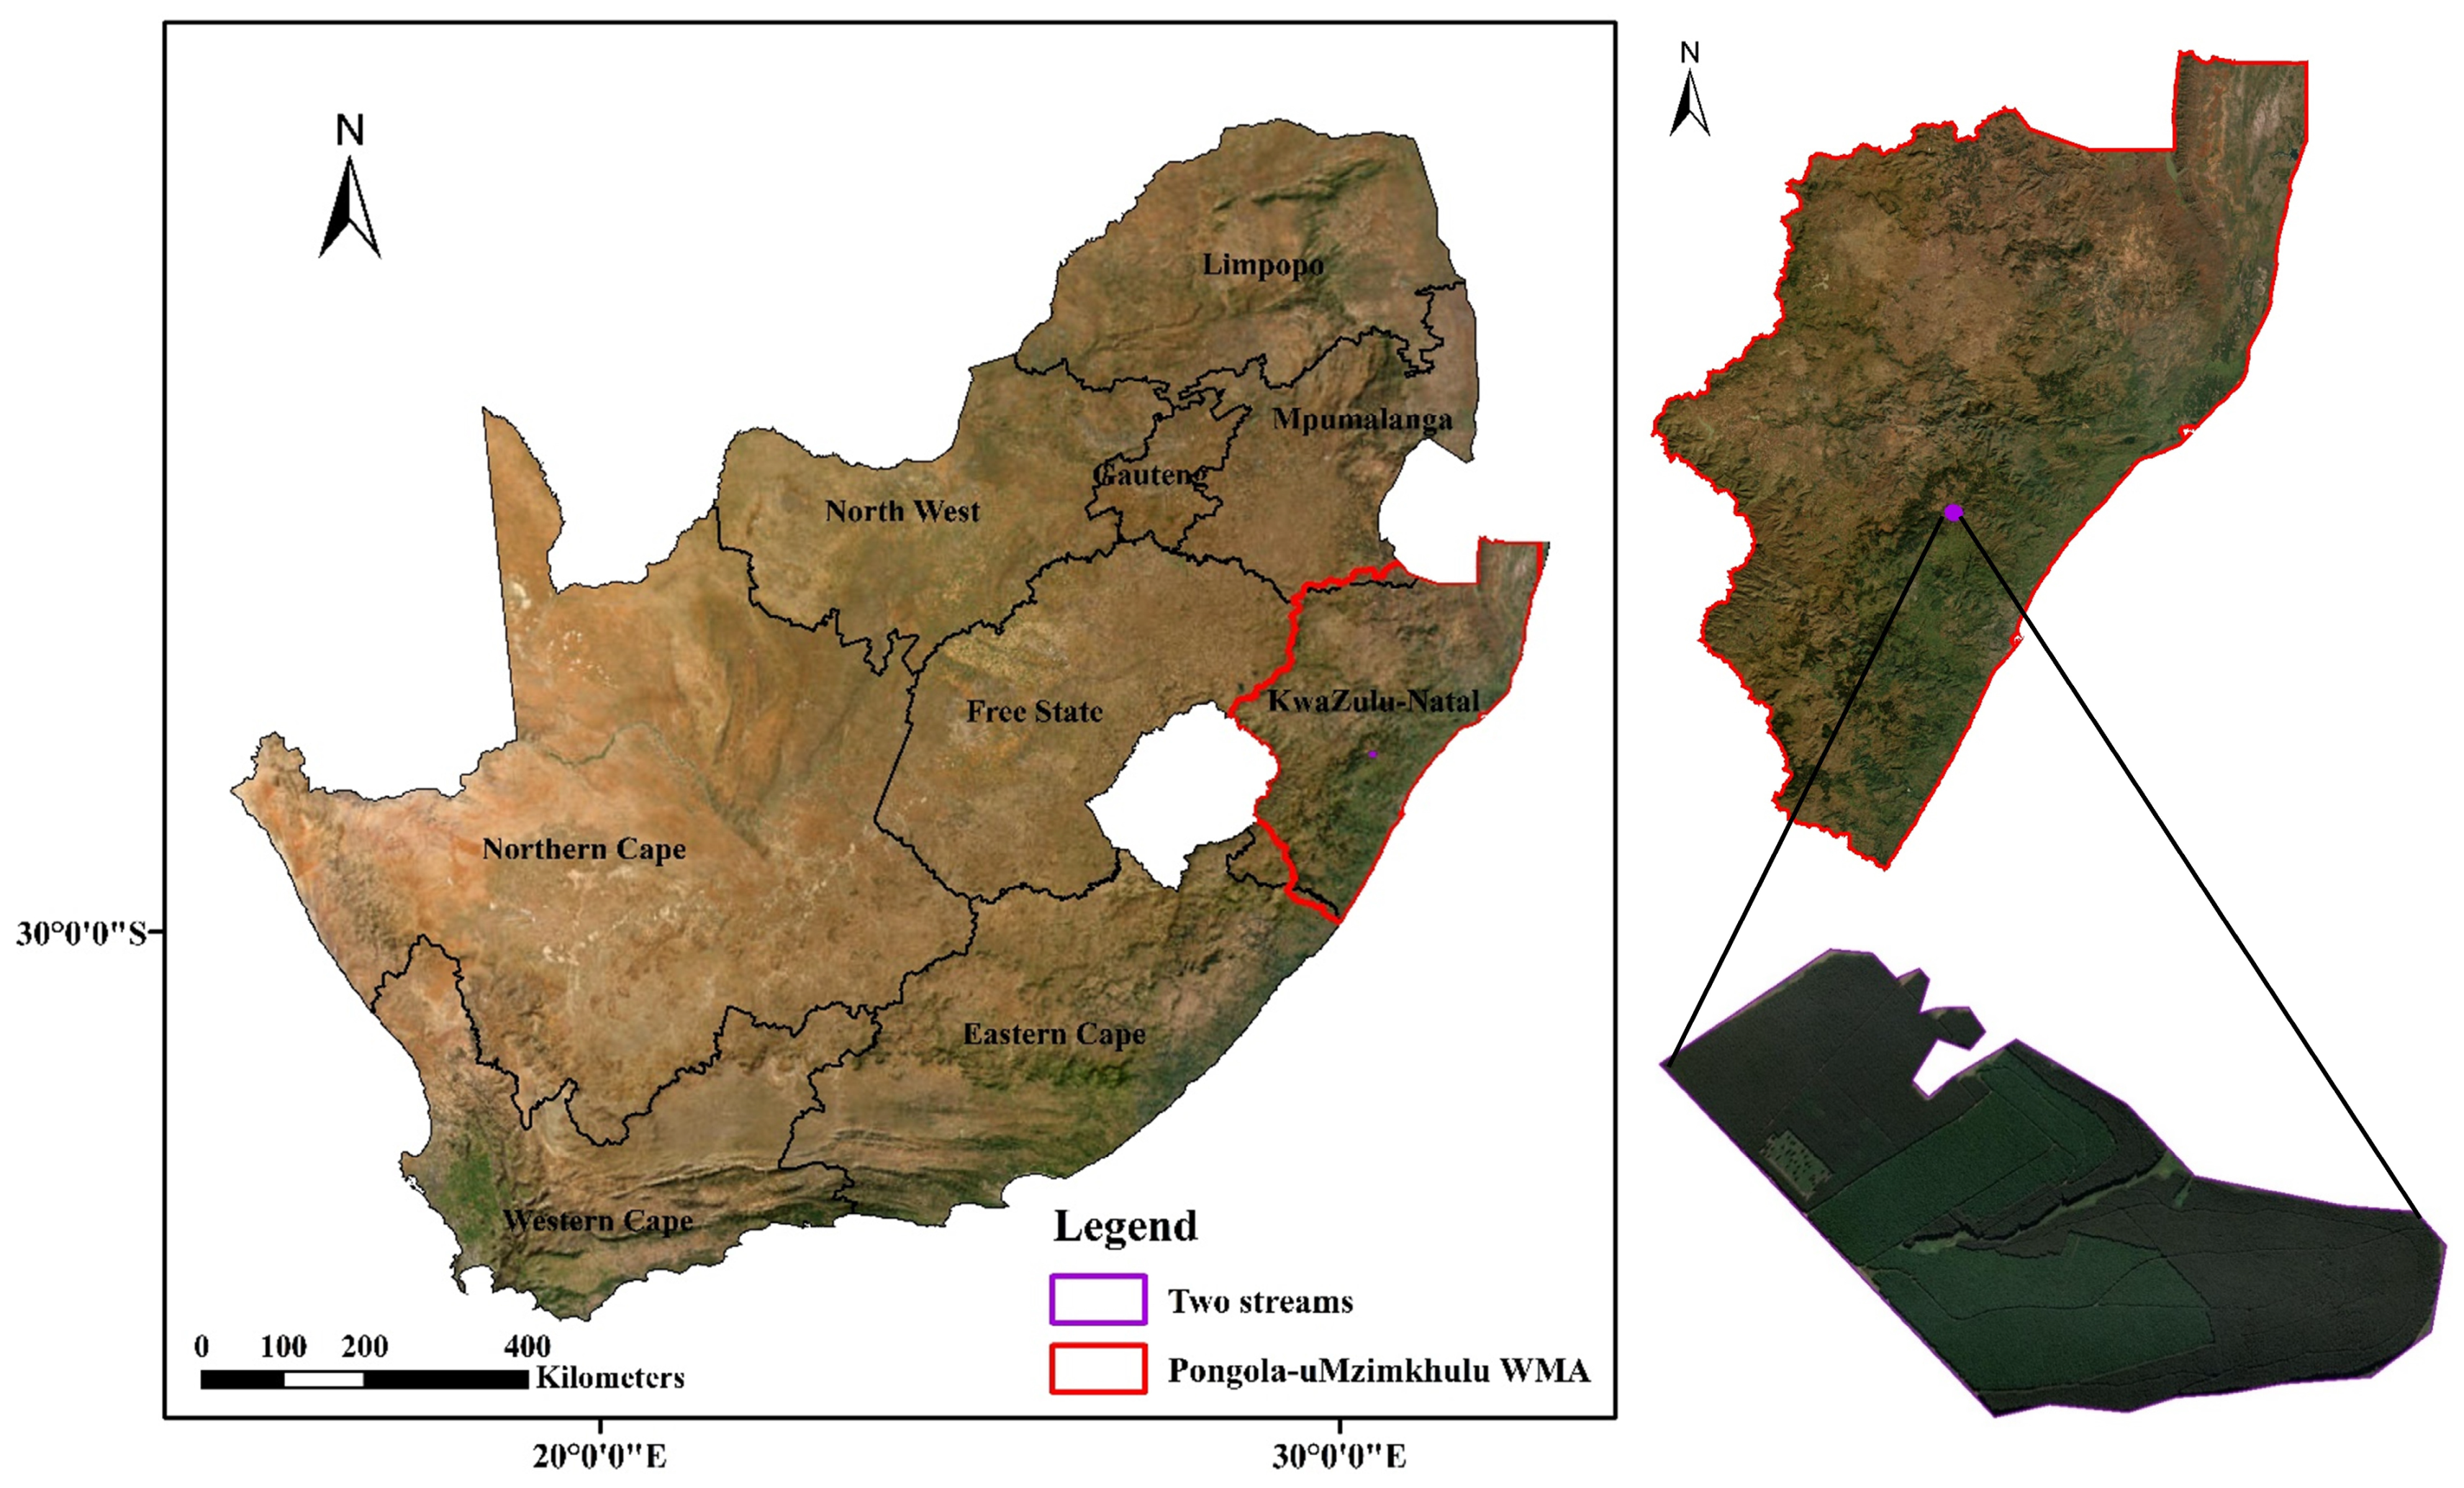
The study site is situated within the Two Streams Research Catchment, which is located approximately 70 km northeast of the city of Pietermaritzburg within the KwaZulu-Natal province (KZN) of SA (Figure 1). This catchment is among the most extensively studied forested catchments in SA, with more than two decades of detailed hydro-meteorological observational data [41]. The altitude across the catchment ranges from 1060 to 1110 m a.s.l. The study area experiences a warm sub-tropical climate with hot, humid summers and cooler, dry winters. Mean annual precipitation is approximately 778 mm and the majority of rain occurs during the summer. However, heavy mist is also a significant source of moisture within the catchment. Furthermore, the study area experiences moderate occurrences of hail, frost and drought [41,42]. The Two Streams Catchment lies within the Pongola-uMzimkhulu Water Management Area (WMA), which is a major contributor to KZN’s water resources. Water resources management within this WMA is fairly complex due to the high local demand for water resources and international obligations that should be factored into management decisions to ensure the equitable and sustainable use and supply of this critical resource [43,44]. With commercial forestry featuring quite prominently in this region due to favourable growing conditions [41], the ability to accurately estimate the water use of these forests and to quantify their hydrological impacts on downstream water availability forms a crucial component of effective water resources management in this region.

Figure 1.
Geographic location of the Two Streams Catchment, within the Pongola-uMzimkhulu WMA and KwaZulu-Natal province of South Africa. An aerial view of the Two Streams Catchment with the study site delineated in purple is provided in the bottom right insert (imagery in the maps have been sourced from Esri, Maxar, GeoEye, Earthstar Geographics, CNES/Airbus DS, USDA, USGS, AeroGRID, IGN and the GIS User Community).
2.2. Data Collection and Processing
Estimating Kc as a function of satellite-derived LAI estimates was dependent on first deriving Kc from in situ measurements of ET and ETo to account for vegetation characteristics and weather conditions [13]. Meteorological data such as solar radiation, ambient air temperature, relative humidity, rainfall, wind speed and direction were acquired from an automatic weather station located within the study area. This dataset was then used to determine daily ETo using the FAO56 ETo method.
Additional sensors measured the (i) components of the shortened energy balance, and (ii) the ET of Acacia mearnsii stands using the Scintillometry and Eddy Covariance (EC) methods. Further details regarding the instrumentation setup within the study catchment are provided by Clulow et al. [45], Everson et al. [46] and Kaptein et al. [47]. Kc is traditionally defined and determined as follows:
where PET represents the potential ET rate under optimal conditions. However, several studies [15,16,20,48,49,50,51] have estimated Kc through the use of actual ET (ETa) instead of potential ET to derive KCact values that are potentially able to account for localised and rainfed conditions, as well as the impact of stress during growth, as shown in Equation (2):
Monthly totals of ETa and ETo were generated by summing and aggregating the daily ETa and ETo, respectively, for each and every month across the entire in situ measurement period (17 March 2007–24 October 2013). These monthly totals were then used as inputs to Equation (2) to create a monthly time series of KCact for Acacia mearnsii. Satellite-based LAI estimates were acquired from the freely available MODIS LAI product since it is one of the most widely used and extensively validated satellite-based LAI products [31,52,53]. The GEE platform was used to access and process the MODIS LAI product image collection (MCD15A3H V6 level 4, 500 m spatial and 4-day temporal resolution). This image collection was filtered to select images (n = 609) within the region of interest corresponding to the in situ measurement period. The data collection period was constrained to 2007–2013 due to the in situ measurements required to implement the proposed methodology only being available during this period. The mean LAI value for the study site within each selected image was determined and these values were then exported as a time series of comma-separated values (CSV). The 4-day MODIS LAI estimates were then summarised by averaging the LAI values (one value per month) in a given month to create a time series of monthly values that were consistent with the KCact dataset.
The KCact estimation model was developed using regression analyses to derive a relationship between the monthly KCact and MODIS LAI time series. It should be noted that for instances where the monthly KCact time-series values exceeded 1.3, it was capped at 1.3. According to Allen et al. [5], Kc values derived using the grass reference surface should not exceed 1.2–1.3 in humid and sub-humid environments. The classification and regression training (Caret) [54] and caretEnsemble [55] packages available as add-ins to the R statistical software package (version 4.40) were used to develop and test the models. Several of the most frequently used machine learning algorithms that represent an eclectic mix of both simple and complex approaches were selected for application. These included the (i) generalised linear model (GLM), (ii) decision tree (CART), (iii) k nearest neighbour (kNN), (iv) random forest (RF) and (v) support vector machine (SVM).
Additionally, an ensemble machine learning model (EMLM) was developed by stacking these base algorithms and combining their predictions using a RF approach. Due to the relatively small size of the monthly time-series datasets (n = 80), the data were not randomly split into a training and validation subset. Instead, we used a k-fold cross-validation approach similar to Hirigoyen et al. [56] to train and validate the models.
Although the data collection period spanned several months and years, the temporal resolution of the datasets differed. MODIS LAI possessed a 4-day temporal resolution and the in situ data possessed a daily temporal resolution. The training data to be used in the machine learning algorithms requires the predictor and target variable datasets to be of the same size. Subsequently, it was decided that each of these datasets should be aggregated into a monthly time step so that we fulfil the aforementioned criteria. Furthermore, the aggregation of the data to a monthly time step and producing a monthly time series of KCact facilitates the estimation of the daily ET, as it was assumed that the predicted KCact remains constant within a given month and year. Therefore, these values can be used in conjunction with the daily ETo to estimate daily ETa using Equation (2).
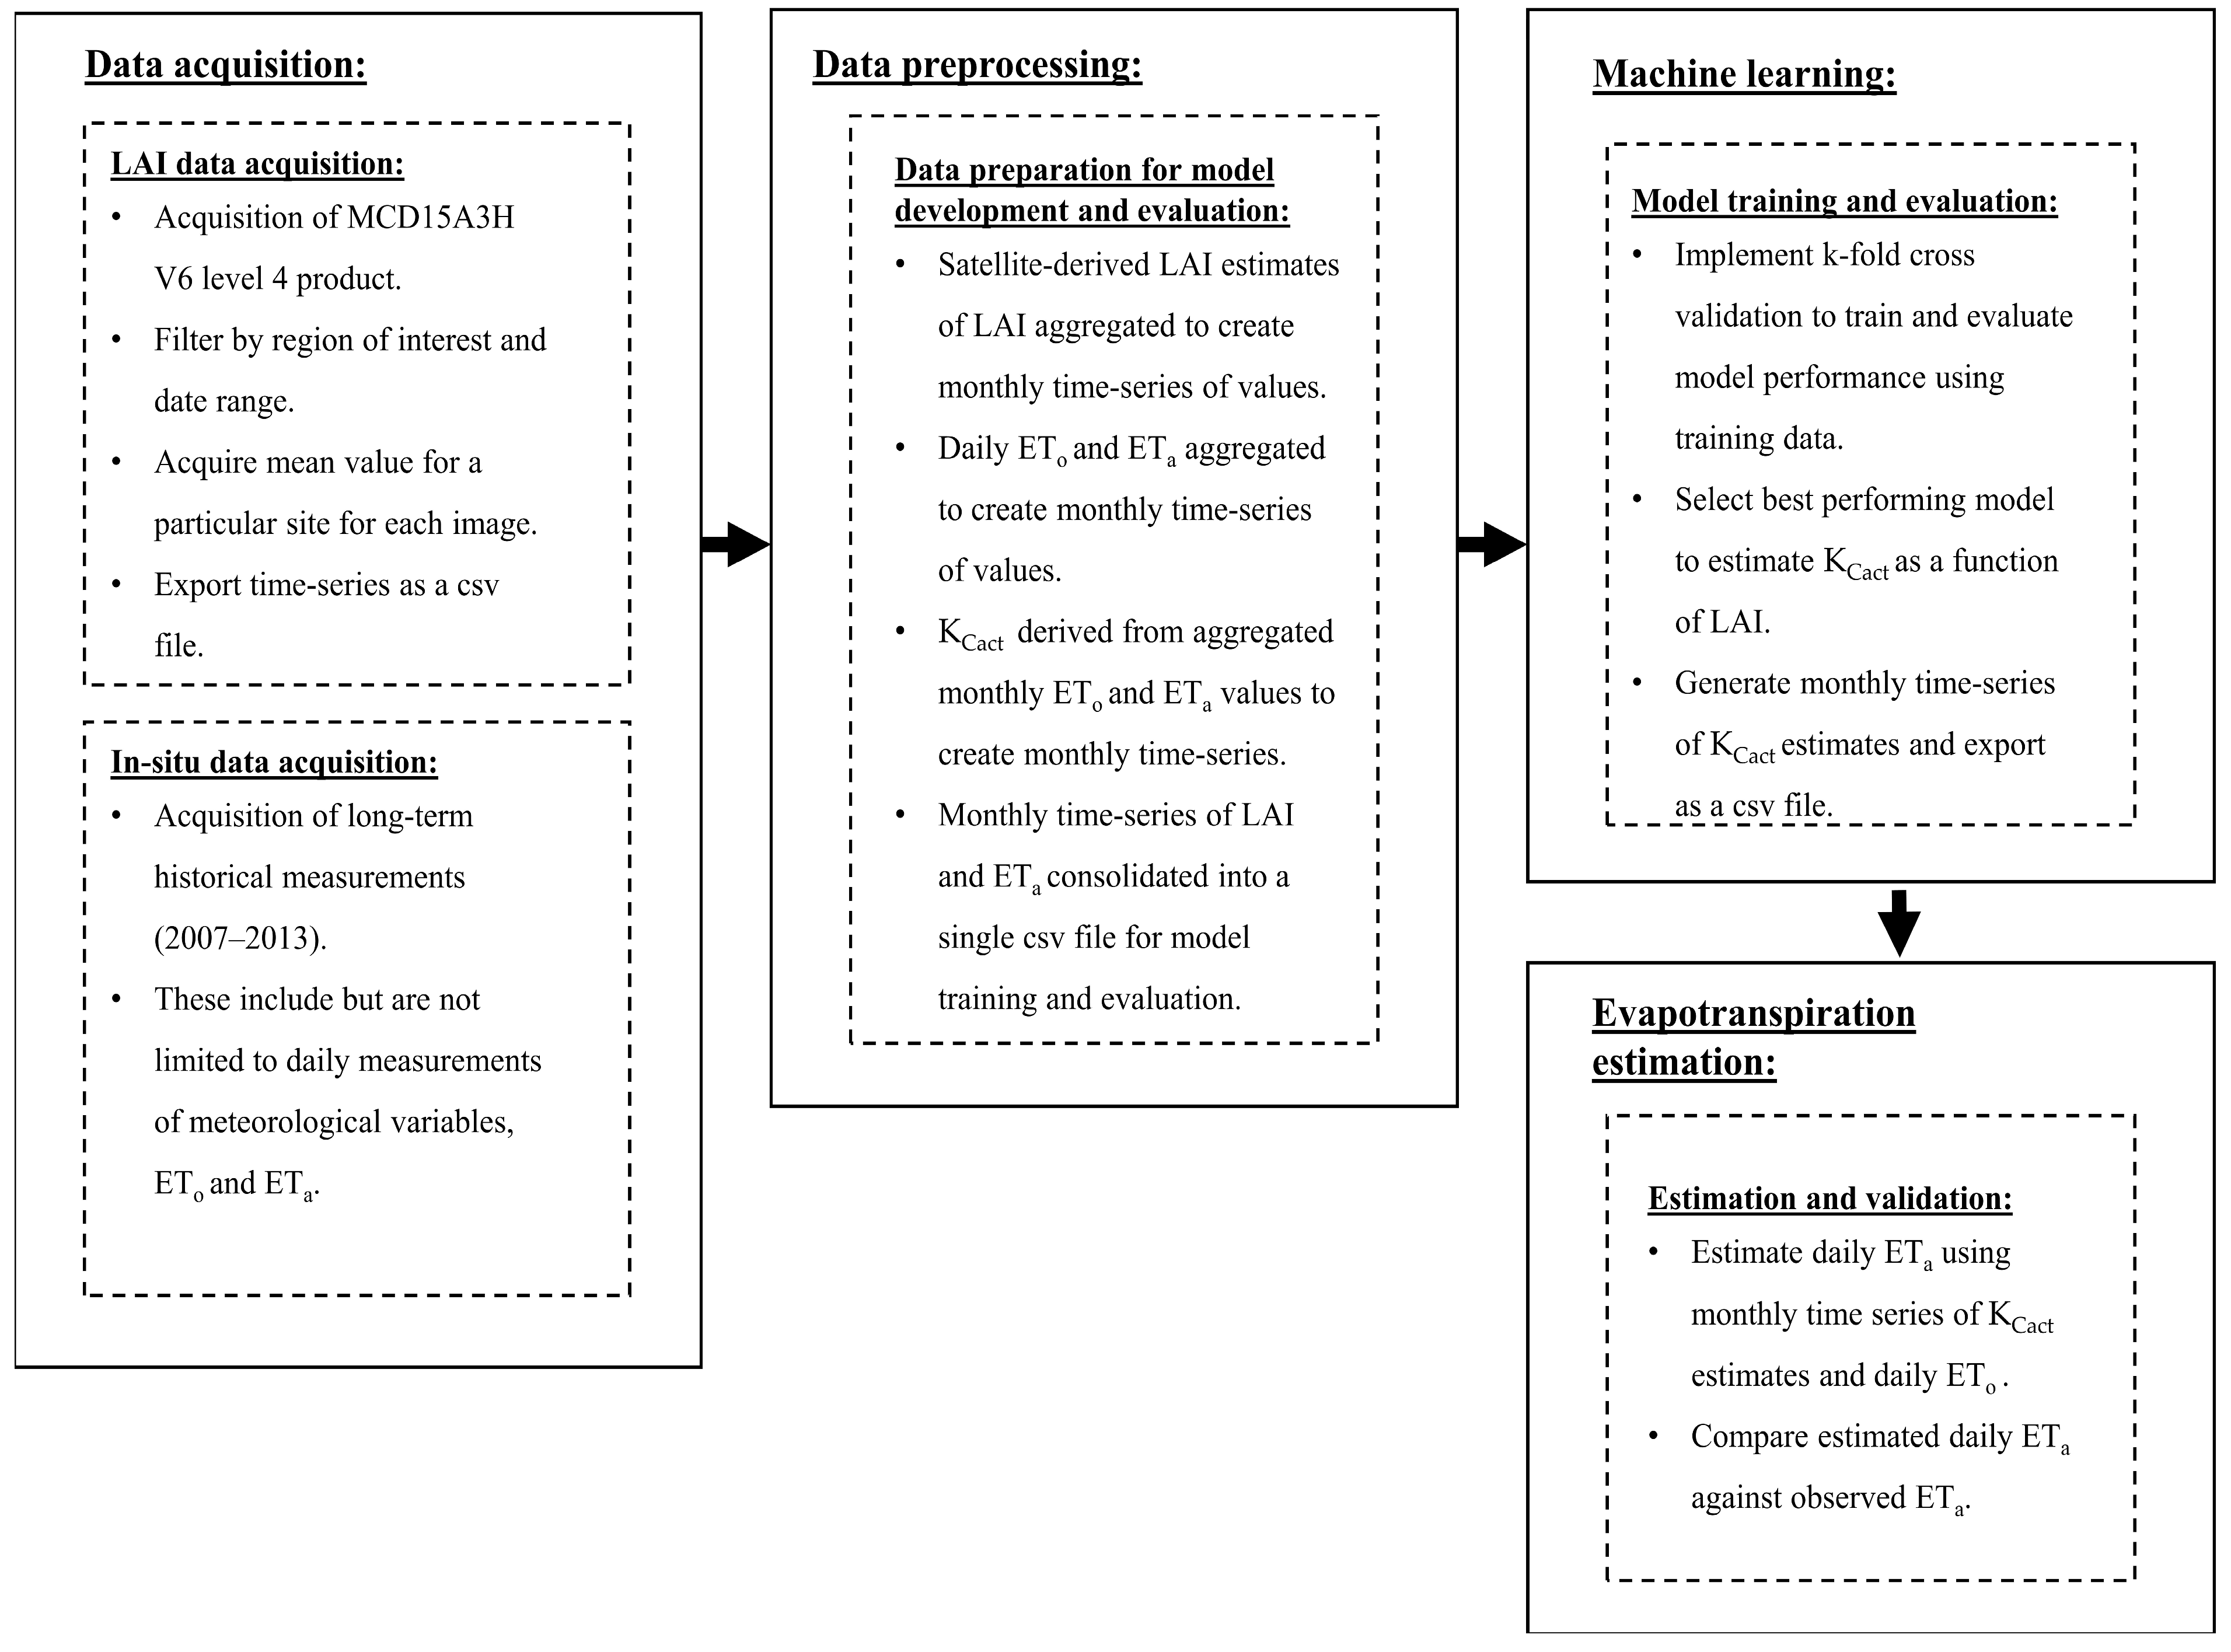
Model performance was then ascertained using the coefficient of determination (R2), root mean square error (RMSE), percentage bias error (PBE) and mean absolute error (MAE). The best-performing model was then used to generate a monthly time series of KCact over the duration of the study period from the monthly LAI time series acquired for the region of interest. Daily ETo was used in conjunction with the monthly predicted KCact time series to estimate daily ETa (assuming KCact remains constant within a given month) via Equation (2). The daily ETa estimates were then compared against the corresponding in situ measurements. A conceptual representation of the proposed methodology is provided in Figure 2.
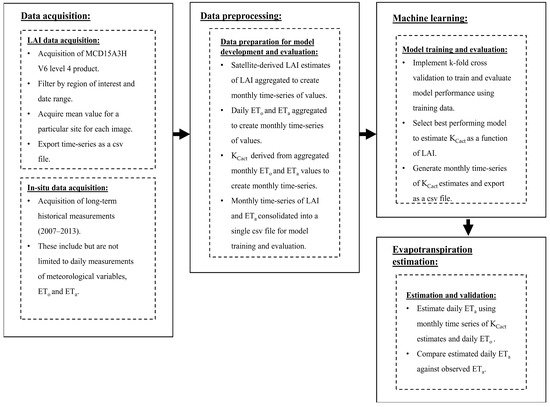
Figure 2.
Conceptual representation of the methodology used to derive KCact from LAI for the estimation of daily ETa using ETo.
The uncertainty in the KCact and ETa estimates was then established using the aforementioned performance metrics and the non-parametric Kruskal–Wallis significance test (95% confidence interval), which was used to assess whether the differences in the means on ranks or medians of the observed and modelled values are statistically significant. The Kruskal–Wallis test is given by the following:
where H is the test statistic, n is the sample size for all samples, c is the number of samples, Tj is the sum of ranks in the jth sample and nj is the size of the jth sample.
3. Results
3.1. Validation of Kc Estimates for Acacia mearnsii
The performance metrics for each of the algorithms used to estimate KCact are provided in Table 1. The results of these investigations indicate that the EMLM was best able to estimate KCact-producing RMSE, MAE and R2 values of 0.05, 0.03 and 0.68, respectively, when compared against the KCact derived from in situ measurements. The monthly crop coefficients estimated using the EMLM (KCact _est) ranged from 1.07 to 1.27, with an average value of 1.21 (±0.04).

Table 1.
Comparison of the performance metrics for each machine learning algorithm used to estimate KCact as a function of LAI.
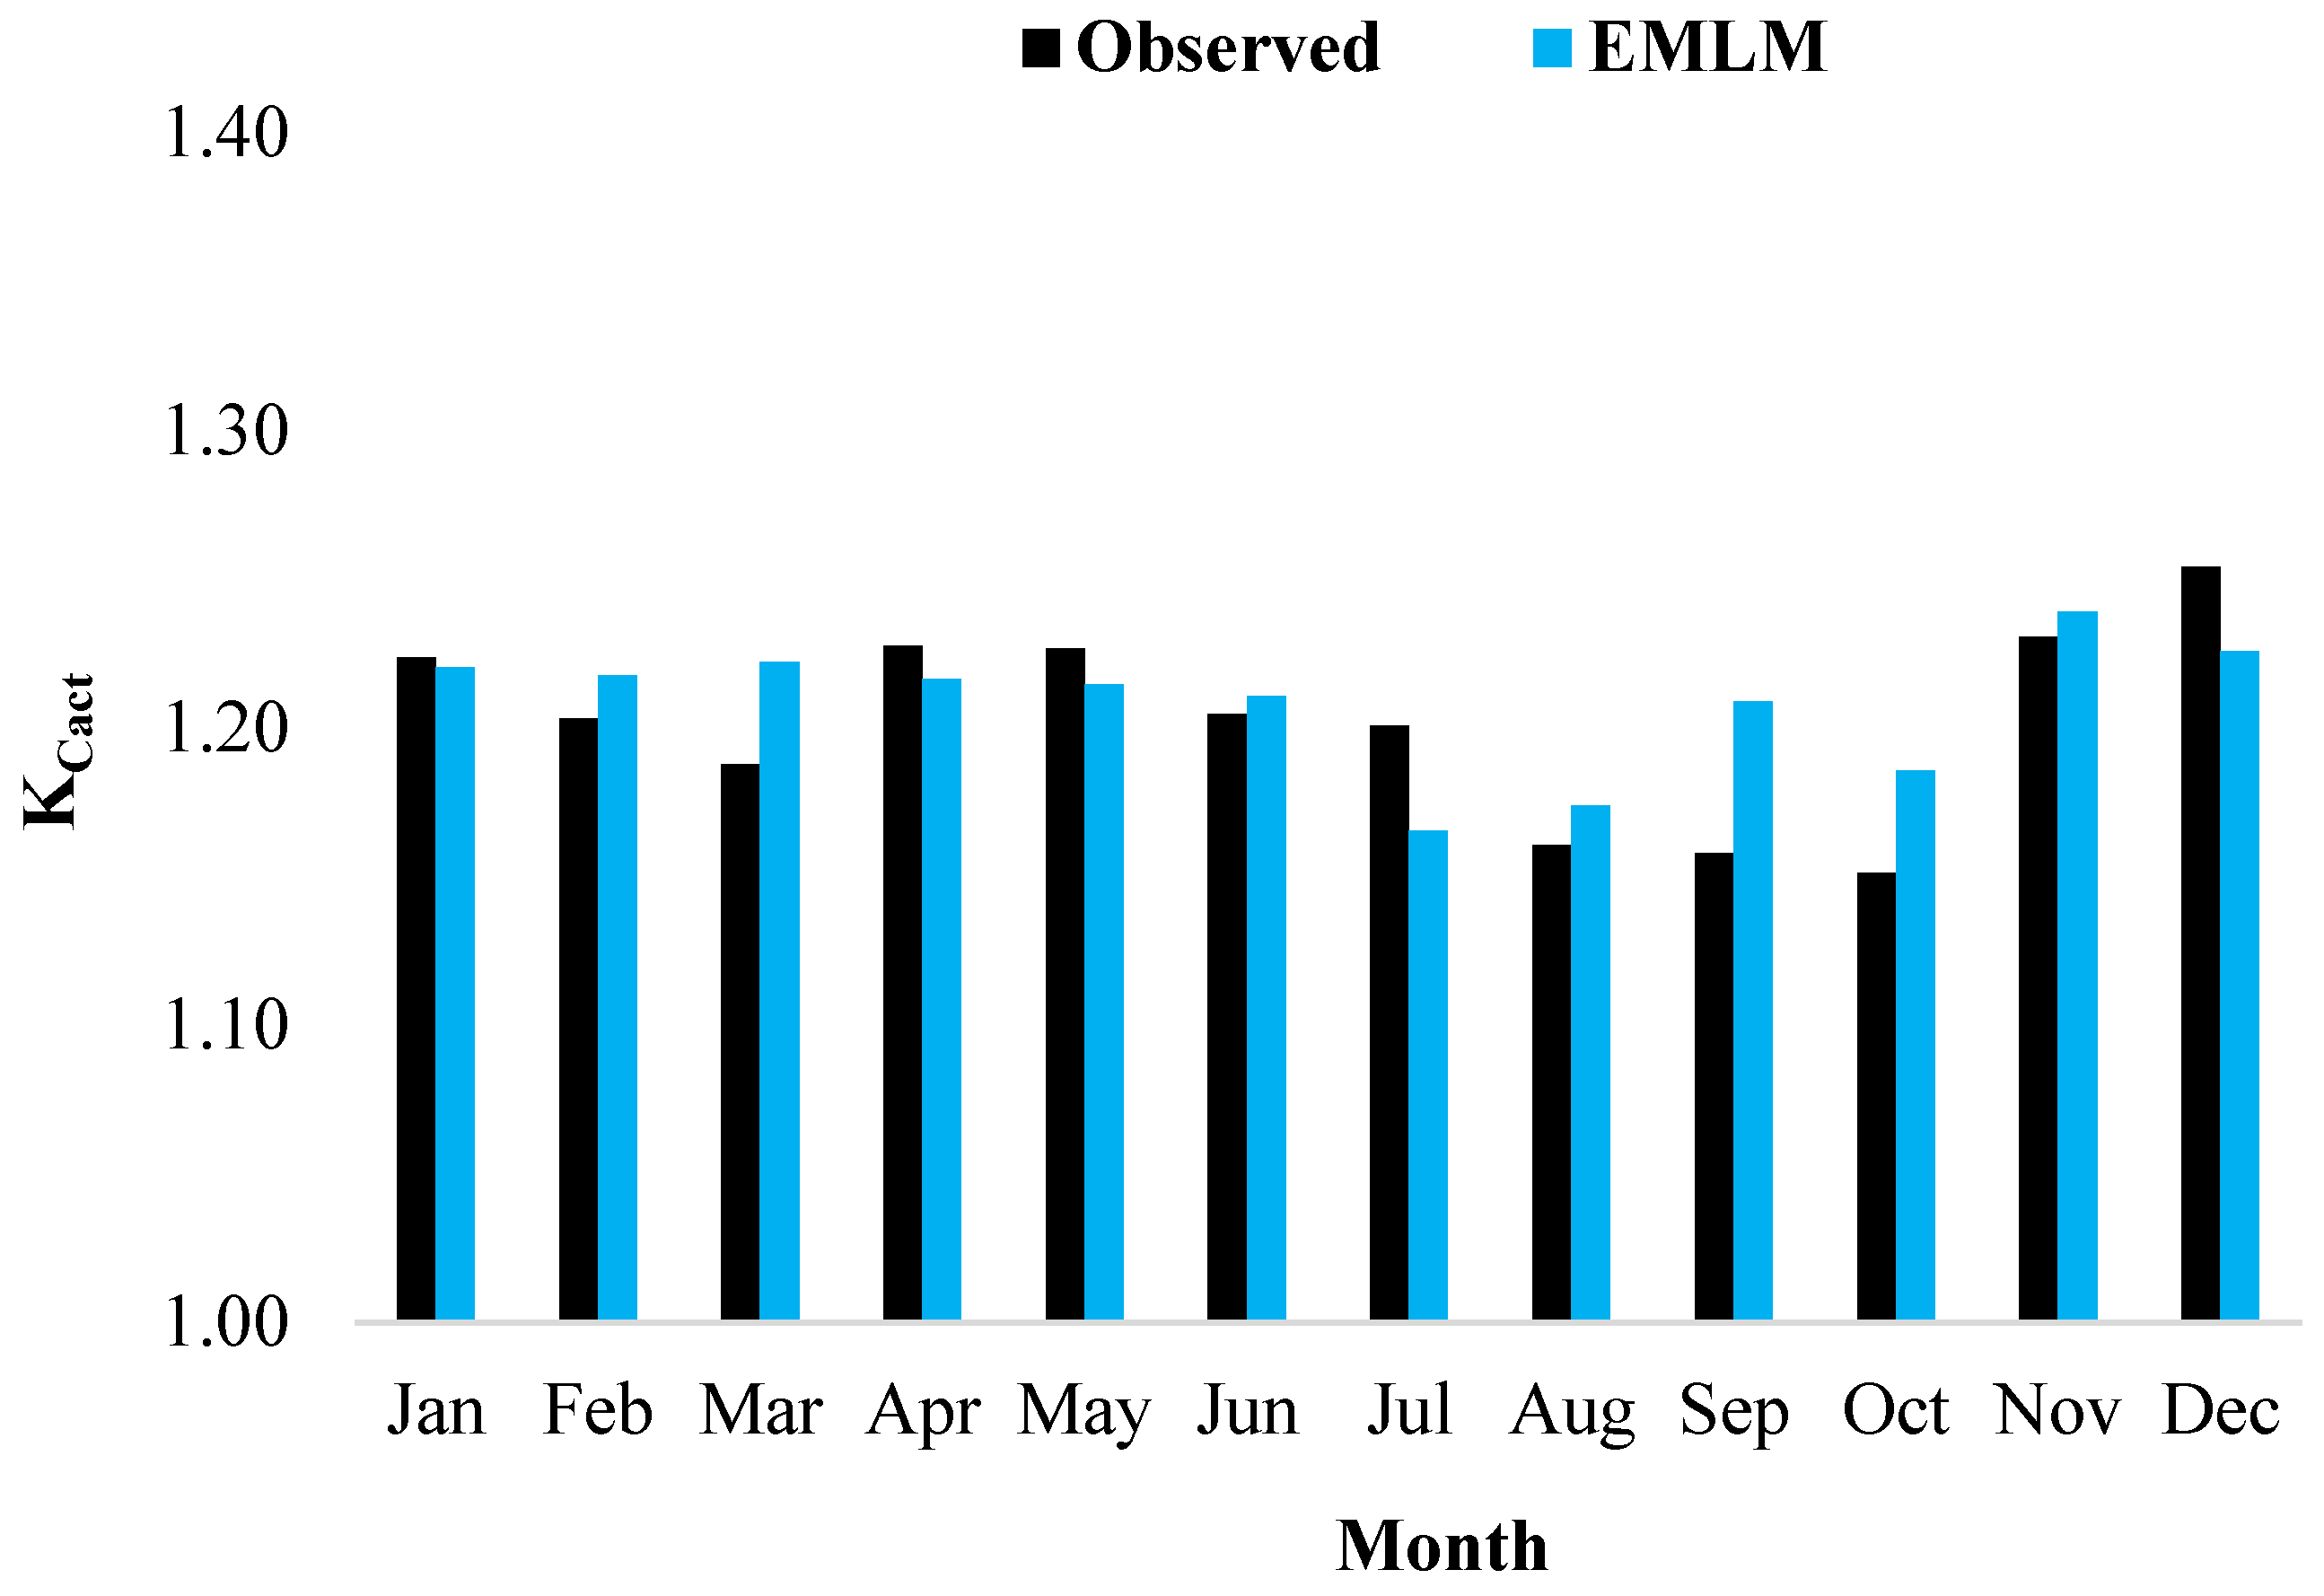
While KCact _est was overestimated during certain months and underestimated in others (at varying degrees), on average KCact _est was overestimated by approximately 1.00%. Furthermore, there were no significant differences found between the KCact derived from in situ measurements and KCact _est (p-value = 0.30). The monthly averages (over the entire period of study) shown in Figure 3 indicate that there is a satisfactory agreement between KCact and KCact _est (r = 0.58). Overall, the comparison between the KCact and KCact _est showed that crop coefficients can be fairly accurately estimated using satellite-derived values of LAI.
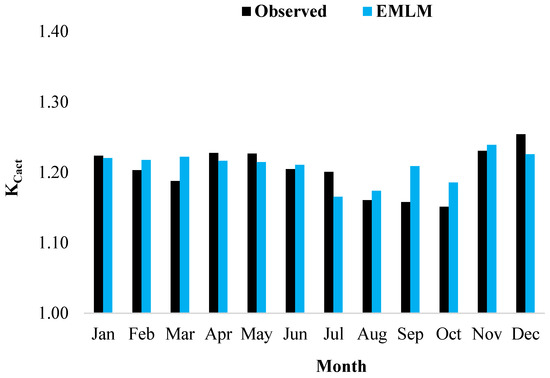
Figure 3.
Comparison of measured and estimated monthly averages of KCact for Acacia mearnsii.
3.2. Comparison of Evapotranspiration Estimates for Acacia mearnsii
A comparison of daily simulated and measured ETa of Acacia mearnsii is presented in Figure 4 and Table 2. The ETa estimates derived using the EMLM-based monthly KCact time series compared favourably against in situ measurements. Although ETa was marginally under-simulated (~1.00%) over the course of the investigation period, there were no significant differences identified between the measured and estimated ETa.
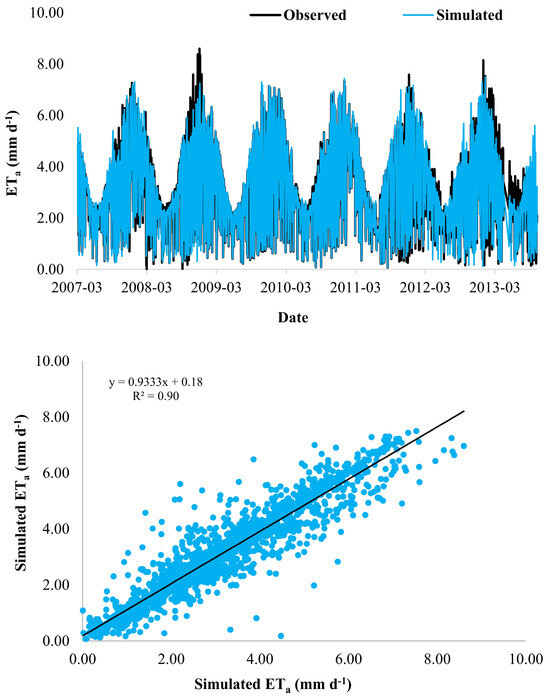
Figure 4.
Plot of daily measured and simulated ET of Acacia mearnsii.
Table 2.
Comparison of daily observed ETa and simulated ETa of Acacia mearnsii derived from monthly EMLM-based KCact estimates for the entire study period.
4. Discussion
The results of our investigations demonstrated that KCact can be estimated relatively accurately using satellite-derived LAI values and machine learning-based approaches. While several models were trained and tested, the EMLM performed the best, with comparisons between KCact derived from in situ measurements and KCact _est yielding a RMSE of 0.05, which lies within the range of published values (0.04–0.30) highlighted in Beeri et al. [22]. The comparatively better performance of this model may be attributed to its ability to harness the strengths of each individual machine learning algorithm and develop an optimal model that is capable of outperforming any of the individual models used in the ensemble. In general, the evaluation of the simulated ETa against the measured ETa revealed that the water use of Acacia mearnsii could be fairly accurately estimated using KCact values derived from satellite-based LAI estimates.
However, as shown in Figure 3, KCact _est was overestimated during certain months (e.g., September and October) and underestimated during others. Subsequently, when using these KCact _est values to estimate daily ETa and then comparing them against observed daily ETa across the entire study period, the full impact of the aforementioned discrepancies may be masked. Such occurrences may prove to be problematic, as forest species are likely to have greater impacts on available water resources during drier periods, i.e., when it is particularly important to accurately estimate ETa.
For example, during the typically dry winter month of July in KZN, the difference between the KCact and KCact _est t within the study site was at its highest (~0.07), which in turn contributes to an underestimation of ETa during this particular month (across all years) by approximately 18%. This is noticeably greater than the value that was attained when comparing observed and simulated ETa for the entire study period. Subsequently, the underestimation of KCact and, in turn, ETa may contribute to an inadequate representation of the impacts of commercial forestry on water resources [57] in this region during this particular period.
Although the overall model performance to derive KCact and ETa can be considered satisfactory to good, the aforementioned observations indicate that there are marginal but potentially important seasonal variations to take cognisance of. These seasonal variations in model performance may potentially be ascribed to the combined influence of multiple factors:
- (i)
- While the use of LAI to predict KCact may adequately account for biophysical properties that influence plant canopy processes, soil water availability which is a limiting factor to ET may not be adequately accounted for in the proposed methodology.
- (ii)
- The remotely sensed LAI values were not validated against in situ observations to evaluate their accuracy. Cloud cover is one of the major factors that contribute to inaccuracies in the MODIS LAI composites. Since the 4-day MODIS LAI image collection used in this study was not screened and filtered for cloud contamination, there may potentially be inaccuracies contained within the dataset. Furthermore, vegetation biophysical characteristics, LAI estimation algorithms and seasonal influences also contribute to inaccuracies [58] and remain unaccounted for in this study. Subsequently, these potential inaccuracies in this dataset may contribute to the KCact model being trained on data that are not always an adequate representation of the vegetation’s biophysical characteristics.
- (iii)
- According to Drechsler et al. [51], KCact estimates derived during summer periods are generally more consistent than those derived during winter, since ETo is less variable from day to day during the summer.
A further limitation of the methods employed in this study was that KCact was potentially derived during sub-optimal conditions, such as when there is a limit on water availability and ET was not occurring at potential rates. While it was difficult to ascertain whether this was the case from the comparison between measured and simulated ETa, this assumption can prove to be problematic when using KCact estimates derived from these methods for hydrological modelling purposes.
Hydrological models are often conceptualised to account for soil water availability to sustain ET, with the potential ET being reduced to account for the effects of water stress during suboptimal conditions. Subsequently, if KCact estimates used in a hydrological model have been derived during water-limited conditions, this may result in an underestimation of ET when using these models. In such instances, it may prove to be beneficial to also derive or utilise an index that provides an indication as to whether the vegetation is experiencing water stress. These can be derived from available in situ or remote sensing data [59,60,61,62] to screen and filter out periods whereby water stress is being experienced to ensure that KCact is derived during stress-free conditions.
The reliance on in situ measurements to estimate KCact as a function of satellite-based LAI estimates poses additional challenges as the footprint for which the in situ ETa measurements are acquired will influence the spatial resolution that the KCact estimate can adequately represent. This may prove to be problematic when applying this method to estimate ETa outside of the in situ measurement footprint, especially if there is a high degree of heterogeneity in vegetation characteristics or environmental conditions. Furthermore, the transferability of the model to other regions (even those with similar environmental conditions) may be constrained by the site-specific nature of the model, limiting the feasibility of applying these methods in regions where additional training data are unavailable.
In such instances, the use of satellite-derived estimates of ETa and ETo may represent the most pragmatic approach to estimate KCact or quantify the water use of non-agricultural and natural environments.
Although the Kc_est values presented in this study were within the acceptable range defined by Pereira et al. [11], caution should be exercised when attempting to utilise these values in other locations, since (i) these values are largely site-specific and have been derived from a relatively small sample size, (ii) they represent actual and potentially suboptimal growing conditions, and (iii) were not adjusted to the standard climate adopted by the FAO56 approach, i.e., sub-humid climate where minimum relative humidity and wind speed at 2 m height are 45% and 2 m s−1, respectively [11].
Notwithstanding the limitations of the methods presented in this study, the results demonstrated that satellite-derived estimates of LAI can provide a pragmatic approach to derive spatially and temporally explicit KCact estimates, which can then be used to estimate ETa for non-agricultural or natural vegetation. Furthermore, since the methods applied herein are fairly robust, if finer spatial resolution estimates of KCact are required in these environmental settings, then LAI can be derived from freely available Sentinel-2 imagery [15,63].
The advantages of adopting machine learning-based approaches are that these techniques can allow for complex relationships between target and explanatory variables to be more adequately accounted for and represented [56,64]. Furthermore, the ability of these approaches to include additional explanatory variables can prove to be beneficial for the estimation of KCact for different vegetation types and in other environmental settings. For example, Park et al. [24] showed that the inclusion of soil moisture data with vegetation indices resulted in the improved estimation of Kc as opposed to the use of vegetation indices alone, since soil moisture is a limiting factor to ET particularly in water-limited environments. Moreover, the ability of machine learning-based approaches to more adequately account for complex relationships between variables can be invaluable when attempting to estimate KCact by extrapolating Kc-LAI models to ungauged sites where only satellite-derived estimates of LAI can be acquired.
It should also be noted that while the focus of this study was to derive KCact and estimate ETa based on satellite-based estimates of LAI, the methods described herein can also be extended to other vegetation indices that may potentially allow for improved estimation and representation of KCact [15].
5. Conclusions
The general lack of Kc values for non-agricultural and natural vegetation types hinders the application of the FAO56 Kc-ETo approach in these settings. To address this limitation, we explored the use of satellite-derived LAI to estimate Kc with a particular focus on Acacia mearnsii. The results from this study were quite promising and demonstrated that the use of geospatial cloud computing and machine learning-based approaches provides a robust and efficient means of handling and optimally utilising large volumes of data. Furthermore, the methodological approach adopted herein can serve as a basis for the development of a generic Kc-LAI model should in situ measurements of ETa and ETo within the greater study region become available for other non-agricultural or natural vegetation types. This could be quite useful for future hydrological modelling applications within the study region, since it facilitates the seamless generation of Kc values for various non-agricultural and natural vegetation types using easily accessible and readily available satellite-based LAI or similar products and datasets. This, in turn, may allow for the improved understanding and estimation of the hydrological impacts of anthropogenic activities such as commercial afforestation in the region, which is urgently required and necessary to improve the management and regulation of this activity.
Author Contributions
Conceptualisation, S.G. and M.T.; methodology, S.G., R.K., A.C. and M.T.; software, S.G.; formal analysis, S.G., R.K., A.C. and M.T.; investigation, S.G., R.K., A.C. and M.T.; resources, S.G., R.K., A.C. and M.T.; data curation, S.G., A.C. and M.T.; writing—original draft preparation, S.G.; writing—reviewing and editing, S.G., R.K., A.C. and M.T.; visualisation, S.G.; supervision, R.K., A.C. and M.T.; project administration, A.C. and M.T.; funding acquisition, M.T. All authors have read and agreed to the published version of the manuscript.
Funding
This work was supported by the Water Research Commission (WRC) project (no. K5/2791) entitled “The expansion of knowledge on evapotranspiration and stream flow reduction of different clones/hybrids to improve the water use estimation of SFRA species (i.e., Pinus, Eucalyptus and Acacia species).
Data Availability Statement
The data presented in this study are available on reasonable request from the corresponding author.
Acknowledgments
The authors would like to acknowledge the Institute for Commercial Forestry Research (ICFR), with special mention to Ilaria Germishuizen, as well as Mondi PLC, for the provision of in situ data used in this study.
Conflicts of Interest
The authors declare no conflicts of interest. The funders had no role in the design of the study; in the collection, analyses or interpretation of data; in the writing of the manuscript; or in the decision to publish the results.
References
- Gush, M.B.; Scott, D.F.; Jewitt, G.P.W.; Schulze, R.E.; Hallowes, L.A.; Görgens, A.H.M. A new approach to modelling streamflow reductions resulting from commercial afforestation in South Africa. S. Afr. For. J. 2002, 196, 27–36. [Google Scholar] [CrossRef]
- Dye, P.; Versfeld, D. Managing the hydrological impacts of South African plantation forests: An overview. For. Ecol. Manag. 2007, 251, 121–128. [Google Scholar] [CrossRef]
- Jewitt, G.P.W.; Lorentz, S.A.; Gush, M.B.; Thornton-Dibb, S.; Kongo, V.; Wiles, L.; Blight, J.; Stuart-Hill, S.I.; Versfeld, D.; Tomlinson, K. Methods and Guidelines for the Licensing of SFRAs with Particular Reference to Low Flows; WRC Report No. 1428/1/09; Water Research Commission (WRC): Pretoria, South Africa, 2009; ISBN 978-1-77005-877-4. [Google Scholar]
- Toucher, M.L.; Everson, C.E. The Expansion of Knowledge on Evapotranspiration and Stream Flow Reduction of Different Clones/Hybrids to Improve the Water Use Estimation of SFRA Species (i.e., Pinus, Eucalyptus and Acacia Species); Deliverable 3, WRC Project no. K5/2791; Water Research Commission (WRC): Pretoria, South Africa, 2018. [Google Scholar]
- Allen, R.G.; Pereira, L.S.; Howell, T.A.; Jensen, M.E. Evapotranspiration information reporting: I. Factors governing measurement accuracy. Agric. Water Manag. 2011, 98, 899–920. [Google Scholar] [CrossRef]
- Zhao, L.; Xia, J.; Xu, C.; Wang, Z.; Sobkowiak, L.; Long, C. Evapotranspiration estimation methods in hydrological models. J. Geogr. Sci. 2013, 23, 359–369. [Google Scholar] [CrossRef]
- Liu, C.; Sun, G.; McNulty, S.G.; Noormets, A.; Fang, Y. Environmental controls on seasonal ecosystem evapotranspiration/potential evapotranspiration ratio as determined by the global eddy flux measurements. Hydrol. Earth Syst. Sci. 2017, 21, 311–322. [Google Scholar] [CrossRef]
- Li, Z.; Yang, Y.; Kan, G.; Hong, Y. Study on the Applicability of the Hargreaves Potential Evapotranspiration Estimation Method in CREST Distributed Hydrological Model (Version 3.0) Applications. Water 2018, 10, 1882. [Google Scholar] [CrossRef]
- Li, F.; Ma, Y. Evaluation of the Dual Crop Coefficient Approach in Estimating Evapotranspiration of Drip-Irrigated Summer Maize in Xinjiang, China. Water 2019, 11, 1053. [Google Scholar] [CrossRef]
- Hunnik, J.E.; Eekhout, J.P.C.; de Vente, J.; Contreras, S.; Droogers, P.; Baille, A. Hydrological Modelling Using Satellite-Based Crop Coefficients: A Comparison of Methods at the Basin Scale. Remote Sens. 2017, 9, 174. [Google Scholar] [CrossRef]
- Pereira, L.; Paredes, P.; Hunsaker, D.J.; López-Urrea, R.; Mohammadi Shad, Z. Standard single and basal crop coefficients for field crops. Updates and advances to the FAO56 crop water requirements method. Agric. Water Manag. 2021, 243, 106466. [Google Scholar] [CrossRef]
- Tran, H.Q.; Fehér, Z.Z. Water balance calculation capability of hydrological models. Acta Agrar. 2022, 26, 37–53. [Google Scholar] [CrossRef]
- Pereira, L.S.; Allen, R.A.; Smith, M.; Raes, D. Crop evapotranspiration estimation with FAO56: Past and future. Agric. Water Manag. 2015, 147, 4–20. [Google Scholar] [CrossRef]
- Allen, R.G.; Pereira, L.S.; Raes, D.; Smith, M. Crop Evapotranspiration. Guidelines for Computing Crop Water Requirements; FAO Irrigation and Drainage Paper 56; FAO: Rome, Italy, 1998; p. 300. [Google Scholar]
- Nagy, A.; Kiss, N.É.; Buday-Bódi, E.; Magyar, T.; Cavazza, F.; Gwntile, S.L.; Abdullah, H.; Tamás, J.; Fehér, Z.Z. Precision Estimation of Crop Coefficient for Maize Cultivation Using High-Resolution Satellite Imagery to Enhance Evapotranspiration Assessment in Agriculture. Plants 2024, 13, 1212. [Google Scholar] [CrossRef]
- Perreira, L.S.; Paredes, P.; Espírito-Santo, D.; Salman, M. Actual and standard crop coefficients for semi-natural and planted grasslands and grasses: A review aimed at supporting water management to improve production and ecosystem services. Irrig. Sci. 2023. [Google Scholar] [CrossRef]
- Descheemaeker, K.; Raes, D.; Allen, R.; Nysen, J.; Poesen, J.; Muys, B.; Haile, M.; Deckers, J. Two rapid appraisals of FAO-56 crop coefficients for semiarid natural vegetation of the northern Ethiopian highlands. J. Arid Environ. 2011, 75, 353–359. [Google Scholar] [CrossRef]
- Glenn, E.P.; Neale, C.M.U.; Hunsaker, D.J.; Nagler, P.L. Vegetation index-based crop coefficients to estimate evapotranspiration by remote sensing in agricultural and natural ecosystems. Hydrol. Process. 2011, 25, 4050–4062. [Google Scholar] [CrossRef]
- Corbari, C.; Ravazzani, G.; Galvagno, M.; Cremonese, E.; Mancini, M. Assessing Crop Coefficients for Natural Vegetated Areas Using Satellite Data and Eddy Covariance Stations. Sensors 2017, 17, 2664. [Google Scholar] [CrossRef] [PubMed]
- Mukiibi, A.; Franke, A.C.; Steyn, J.M. Determination of Crop Coefficients and Evapotranspiration of Potato in a Semi-Arid Climate Using Canopy State Variables and Satellite-Based NDVI. Remote Sens. 2023, 15, 4579. [Google Scholar] [CrossRef]
- Pereira, L.; Paredes, P.; Melton, F.; Johnson, L.; Wang, T.; López-Urrea, R.; Cancella, J.J.; Allen, R.G. Prediction of crop coefficients from fraction of ground cover and height. Background and validation using ground and remote sensing data. Agric. Water Manag. 2020, 241, 106197. [Google Scholar] [CrossRef]
- Beeri, O.; Netzer, Y.; Munitz, S.; Mintz, D.F.; Pelta, R.; Shilo, T.; Horesh, A.; Mey-tal, S. Kc and LAI Estimations Using Optical and SAR Remote Sensing Imagery for Vineyards Plots. Remote Sens. 2020, 12, 3478. [Google Scholar] [CrossRef]
- Feng, Y.; Cui, N.; Gong, D.; Wang, H.; Hao, W.; Mei, X. Estimating rainfed spring maize evapotranspiration using modified dual crop coefficient approach based on leaf area index. Trans. Chin. Soc. Agric. Eng. 2016, 32, 90–98. [Google Scholar]
- Park, J.; Baik, J.; Choi, M. Satellite-based crop coefficient and evapotranspiration using surface soil moisture and vegetation indices in Northeast Asia. CATENA 2017, 156, 305–314. [Google Scholar] [CrossRef]
- Netzer, Y.; Munitz, S.; Shtein, I.; Schwartz, A. Structural memory in grapevines: Early season water availability affects late season drought stress severity. Eur. J. Agron. 2019, 105, 96–103. [Google Scholar] [CrossRef]
- Chen, H.; Huang, J.J.; McBean, E. Partitioning of daily evapotranspiration using a modified shuttleworth-wallace model, random Forest and support vector regression, for a cabbage farmland. Agric. Water Manag. 2020, 228, 105923. [Google Scholar] [CrossRef]
- Ohana-Levei, N.; Munitz, S.; Ben-Gal, A.; Schwartz, A.; Peeters, A.; Netzer, Y. Multiseasonal grapevine water consumption—Drivers and forecasting. Agric. For. Meteorol. 2020, 280, 107796. [Google Scholar] [CrossRef]
- Fan, J.; Zheng, J.; Wu, L.; Zhang, F. Estimation of daily maize transpiration using support vector machines, extreme gradient boosting, artificial and deep neural networks models. Agric. Water Manag. 2021, 245, 106547. [Google Scholar] [CrossRef]
- Jia, Q.; Wang, Y. Relationships between Leaf Area Index and Evapotranspiration and Crop Coefficient of Hilly Apple Orchard in the Loess Plateau. Water 2021, 13, 1957. [Google Scholar] [CrossRef]
- Zhang, H.; Wang, Z.; Yu, S.; Teng, A.; Zhang, C.; Lei, L.; Ba, Y.; Chen, X. Crop coefficient determination and evapotranspiration estimation of watermelon under water deficit in a cold and arid environment. Front. Plant Sci. 2023, 14, 11538. [Google Scholar] [CrossRef]
- Myneni, R.B.; Hoffman, S.; Knyazikhin, Y.; Privette, J.L.; Glassy, J.; Tian, Y.; Wang, Y.; Song, X.; Zhang, Y.; Smith, G.R.; et al. Global products of vegetation leaf area and fraction absorbed PARfrom year one of MODIS data. Remote Sens. Environ. 2002, 83, 214–231. [Google Scholar] [CrossRef]
- Shao, G.; Han, W.; Zhang, H.; Liu, S.; Wang, Y.; Zhang, L.; Cui, X. Mapping maize crop coefficient Kc using random forest algorithm based on leaf area index and UAV-based multispectral vegetation indices. Agric. Water Manag. 2021, 252, 106906. [Google Scholar] [CrossRef]
- Gao, X.; Dirmeyer, P.A.; Guo, Z.; Zhao, M. Sensitivity of land surface simulations to the treatment of vegetation properties and the implications for seasonal climate prediction. J. Hydrometeorol. 2008, 9, 348–366. [Google Scholar] [CrossRef]
- Fang, H.; Li, W.; Wei, S.; Jiang, C. Seasonal variation of leaf area index (LAI) over paddy rice fields in NE China: Intercomparison of destructive sampling, LAI-2200, digital hemispherical photography (DHP), and AccuPAR methods. Agric. For. Meteorol. 2014, 198–199, 126–141. [Google Scholar] [CrossRef]
- Clevers, J.G.P.W.; Kooistra, L.; van den Brande, M.M.M. Using Sentinel-2 Data for Retrieving LAI and Leaf and Canopy Chlorophyll Content of a Potato Crop. Remote Sens. 2017, 9, 405. [Google Scholar] [CrossRef]
- Alexandridis, T.; Ovakoglou, G.; Clevers, J.G.P.W. Relationship between MODIS EVI and LAI across time and space. Geocarto Int. 2019, 35, 1385–1399. [Google Scholar] [CrossRef]
- Ovakoglou, G.; Alexandridis, T.K.; Clevers, J.P.W.; Gitas, I.Z. Downscaling of MODIS leaf area index using landsat vegetation index. Geocarto Int. 2020, 37, 2466–2489. [Google Scholar] [CrossRef]
- Fang, H.; Baret, H.; Plummer, S.; Schaepman-Strub, D. An Overview of Global Leaf Area Index (LAI): Methods, Products, Validation, and Applications. Rev. Geophys. 2019, 57, 739–799. [Google Scholar] [CrossRef]
- Gorelick, N.; Hancher, M.; Dixon, M.; Ilyushchenko, S.; Thau, D.; Moore, R. Google Earth Engine: Planetary-scale geospatial analysis for everyone. Remote Sens. Environ. 2017, 202, 18–27. [Google Scholar] [CrossRef]
- Pérez-Cutillas, P.; Pérez-Navarro, A.; Conesa-García, C.; Zema, D.A.; Amado-Álvarez, J.P. What is going on within google earth engine? A systematic review and meta-analysis. Remote Sens. Appl. Soc. Environ. 2023, 29, 100907. [Google Scholar] [CrossRef]
- Vather, T.; Everson, C.S.; Franz, T. The Applicability of the Cosmic Ray Neutron Sensor to Simultaneously Monitor Soil Water Content and Biomass in an Acacia mearnsii Forest. Hydrology 2020, 7, 48. [Google Scholar] [CrossRef]
- Ngubo, C.Z.; Demlie, M.; Lorentz, S. Investigation of hydrological processes and the impacts of Acacia mearnsii plantations on groundwater in secondary aquifers: Case study at the two-stream research catchment, South Africa. J. Hydrol. Reg. Stud. 2020, 40, 101018. [Google Scholar] [CrossRef]
- Department of Water Affairs (DWA). Business Case for the Inkomati-Usuthu Catchment Management Agency; Department of Water Affairs (DWA): Gaborone, Botswana, 2012. [Google Scholar]
- Department of Water Affairs (DWA). Business Case for the Pongola-Umzimkulu Catchment Management Agency; Department of Water Affairs (DWA): Gaborone, Botswana, 2013. [Google Scholar]
- Clulow, A.D.; Everson, C.S.; Gush, M.B. The Long-Term Impact of Acacia mearnsii Trees on Evaporation, Streamflow and Groundwater Resources; WRC Report No. TT 505/11; Water Research Commission (WRC): Pretoria, South Africa, 2011; ISBN 978-1-4312-0020-3. [Google Scholar]
- Everson, C.S.; Toucher, M.; Vather, T.; Mfeka, S.; Lawrence, K.; Horan, R.; Govender, J.; Gray, B.; Ramjeawon, M.; Aldswaorth, T. Continued Hydrometeorological Monitoring at the Two Streams Catchment for the Clear Felling of the Acacia mearnsii Stand; WRC Project No. K5/2780; Water Research Commission (WRC): Pretoria, South Africa, 2018; ISBN 978-1-4312-0020-3. [Google Scholar]
- Kaptein, N.D.; Everson, C.S.; Clulow, A.D.; Toucher, M.L.; Germishuizen, I. Changes in energy balance and total evaporation with age, and between two commercial forestry species in South Africa. J. Hydrol. 2023, 626, 130127. [Google Scholar] [CrossRef]
- Parent, A.-C.; Anctil, F. Quantifying evapotranspiration of a rainfed potato crop in South-eastern Canada using eddy covariance techniques. Agric. Water Manag. 2012, 113, 45–56. [Google Scholar] [CrossRef]
- Gokool, S.; Jarmain, C.; Riddell, E.; Swemmer, A.; Lerm, R., Jr.; Chetty, K.T. Quantifying riparian total evaporation along the Groot Letaba River: A comparison between infilled and spatially downscaled satellite derived total evaporation estimates. J. Arid Environ. 2017, 147, 114–124. [Google Scholar] [CrossRef]
- Ippolito, M.; De Caro, D.; Ciraolo, G.; Minacapilli, M.; Provenzano, G. Estimating crop coefficients and actual evapotranspiration in citrus orchards with sporadic cover weeds based on ground and remote sensing data. Irrig. Sci. 2023, 41, 5–22. [Google Scholar] [CrossRef] [PubMed]
- Drechsler, K.; Fullton, A.; Kisekka, I. Crop coefficients and water use of young almond orchards. Irrig. Sci. 2022, 40, 379–395. [Google Scholar] [CrossRef]
- Gao, F.; Anderson, M.C.; Kustas, W.P.; Wang, Y. Simple method for retrieving leaf area index from Landsat using MODIS leaf area index products as reference. J. Appl. Remote Sens. 2016, 6, 063554. [Google Scholar] [CrossRef]
- Yan, K.; Park, T.; Yan, G.; Liu, Z.; Yang, B.; Chen, C.; Nemani, R.R.; Knyazikhin, Y.; Myneni, R.B. Evaluation of MODIS LAI/FPAR Product Collection 6. Part 2: Validation and Intercomparison. Remote Sens. 2016, 8, 460. [Google Scholar] [CrossRef]
- Kuhn, M. Building predictive models in R using the caret package. J. Stat. Softw. 2008, 28, 1–26. [Google Scholar] [CrossRef]
- Mayer, Z. caretEnsemble: Framework for Combining Caret Models into Ensembles; R Foundation for Statistical Computing: Vienna, Austria, 2013. [Google Scholar]
- Hirigoyen, A.; Acosta-Muñoz, C.; Salamanca, A.J.A.; Varo-Martinez, M.A.; Rachid-Casnati, C.; Franco, J.; Navarro-Cerrillo, R. A machine learning approach to model leaf area index in Eucalyptus plantations using high-resolution satellite imagery and airborne laser scanner data. Ann. For. Res. 2021, 64, 165–183. [Google Scholar] [CrossRef]
- Mashabatu, M.; Ntshidi, Z.; Dzikiti, S.; Jovanovic, N.; Dube, T.; Taylor, N.J. Deriving crop coefficients for evergreen and deciduous fruit orchards in South Africa using the fraction of vegetation cover and tree height data. Agric. Water Manag. 2023, 286, 108389. [Google Scholar] [CrossRef]
- Kim, S.H.; Park, J.; Woo, C.; Lee, K. Analysis of temporal variability of MODIS Leaf Area Index (LAI) product over temperate forest in Korea. In Proceedings of the Proceedings. 2005 IEEE International Geoscience and Remote Sensing Symposium, Seoul, Republic of Korea, 29 July 2005. [Google Scholar] [CrossRef]
- Cetin, M.; Alsenjar, O.; Aksu, H.; Golpinar, M.S.; Akgul, M.A. Estimation of crop water stress index and leaf area index based on remote sensing data. Water Supply 2023, 23, 1390–1404. [Google Scholar] [CrossRef]
- Liu, S.; Pan, X.; Yang, Y.; Yuan, J.; Yang, Z.; Wang, Z.; Xie, W.; Song, H. A Crop water stress index based on Remote Sensing methods for monitoring drought in an Arid area. Remote Sens. Lett. 2023, 14, 890–900. [Google Scholar] [CrossRef]
- Safdar, M.; Shahid, M.A.; Sarwar, A.; Rasul, F.; Majeed, M.D.; Sabir, R.M. Crop Water Stress Detection Using Remote Sensing Techniques. Environ. Sci. Proc. 2023, 25, 20. [Google Scholar] [CrossRef]
- Ihuoma, S.O.; Madramootoo, C.A. Recent advances in crop water stress detection. Comput. Electron. Agric. 2017, 14, 267–275. [Google Scholar] [CrossRef]
- Gokool, S.; Kunz, R.; Toucher, M. Deriving moderate spatial resolution leaf area index estimates from coarser spatial resolution satellite products. Remote Sens. Appl. Soc. Environ. 2022, 26, 743. [Google Scholar] [CrossRef]
- Houborg, R.; McCabe, M.F. A hybrid training approach for leaf area index estimation via Cubist and random forests machine-learning. ISPRS J. Photogramm. Remote Sens. 2017, 135, 173–188. [Google Scholar] [CrossRef]

Disclaimer/Publisher’s Note: The statements, opinions and data contained in all publications are solely those of the individual author(s) and contributor(s) and not of MDPI and/or the editor(s). MDPI and/or the editor(s) disclaim responsibility for any injury to people or property resulting from any ideas, methods, instructions or products referred to in the content. |
© 2024 by the authors. Licensee MDPI, Basel, Switzerland. This article is an open access article distributed under the terms and conditions of the Creative Commons Attribution (CC BY) license (https://creativecommons.org/licenses/by/4.0/).