
Advancements in Utilizing Image-Analysis Technology for Crop-Yield Estimation

 ,
,
Abstract
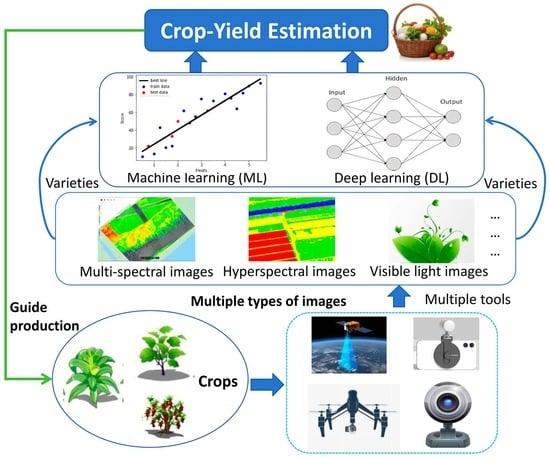
1. Introduction
2. Yield-Calculation Indicators for Different Crops
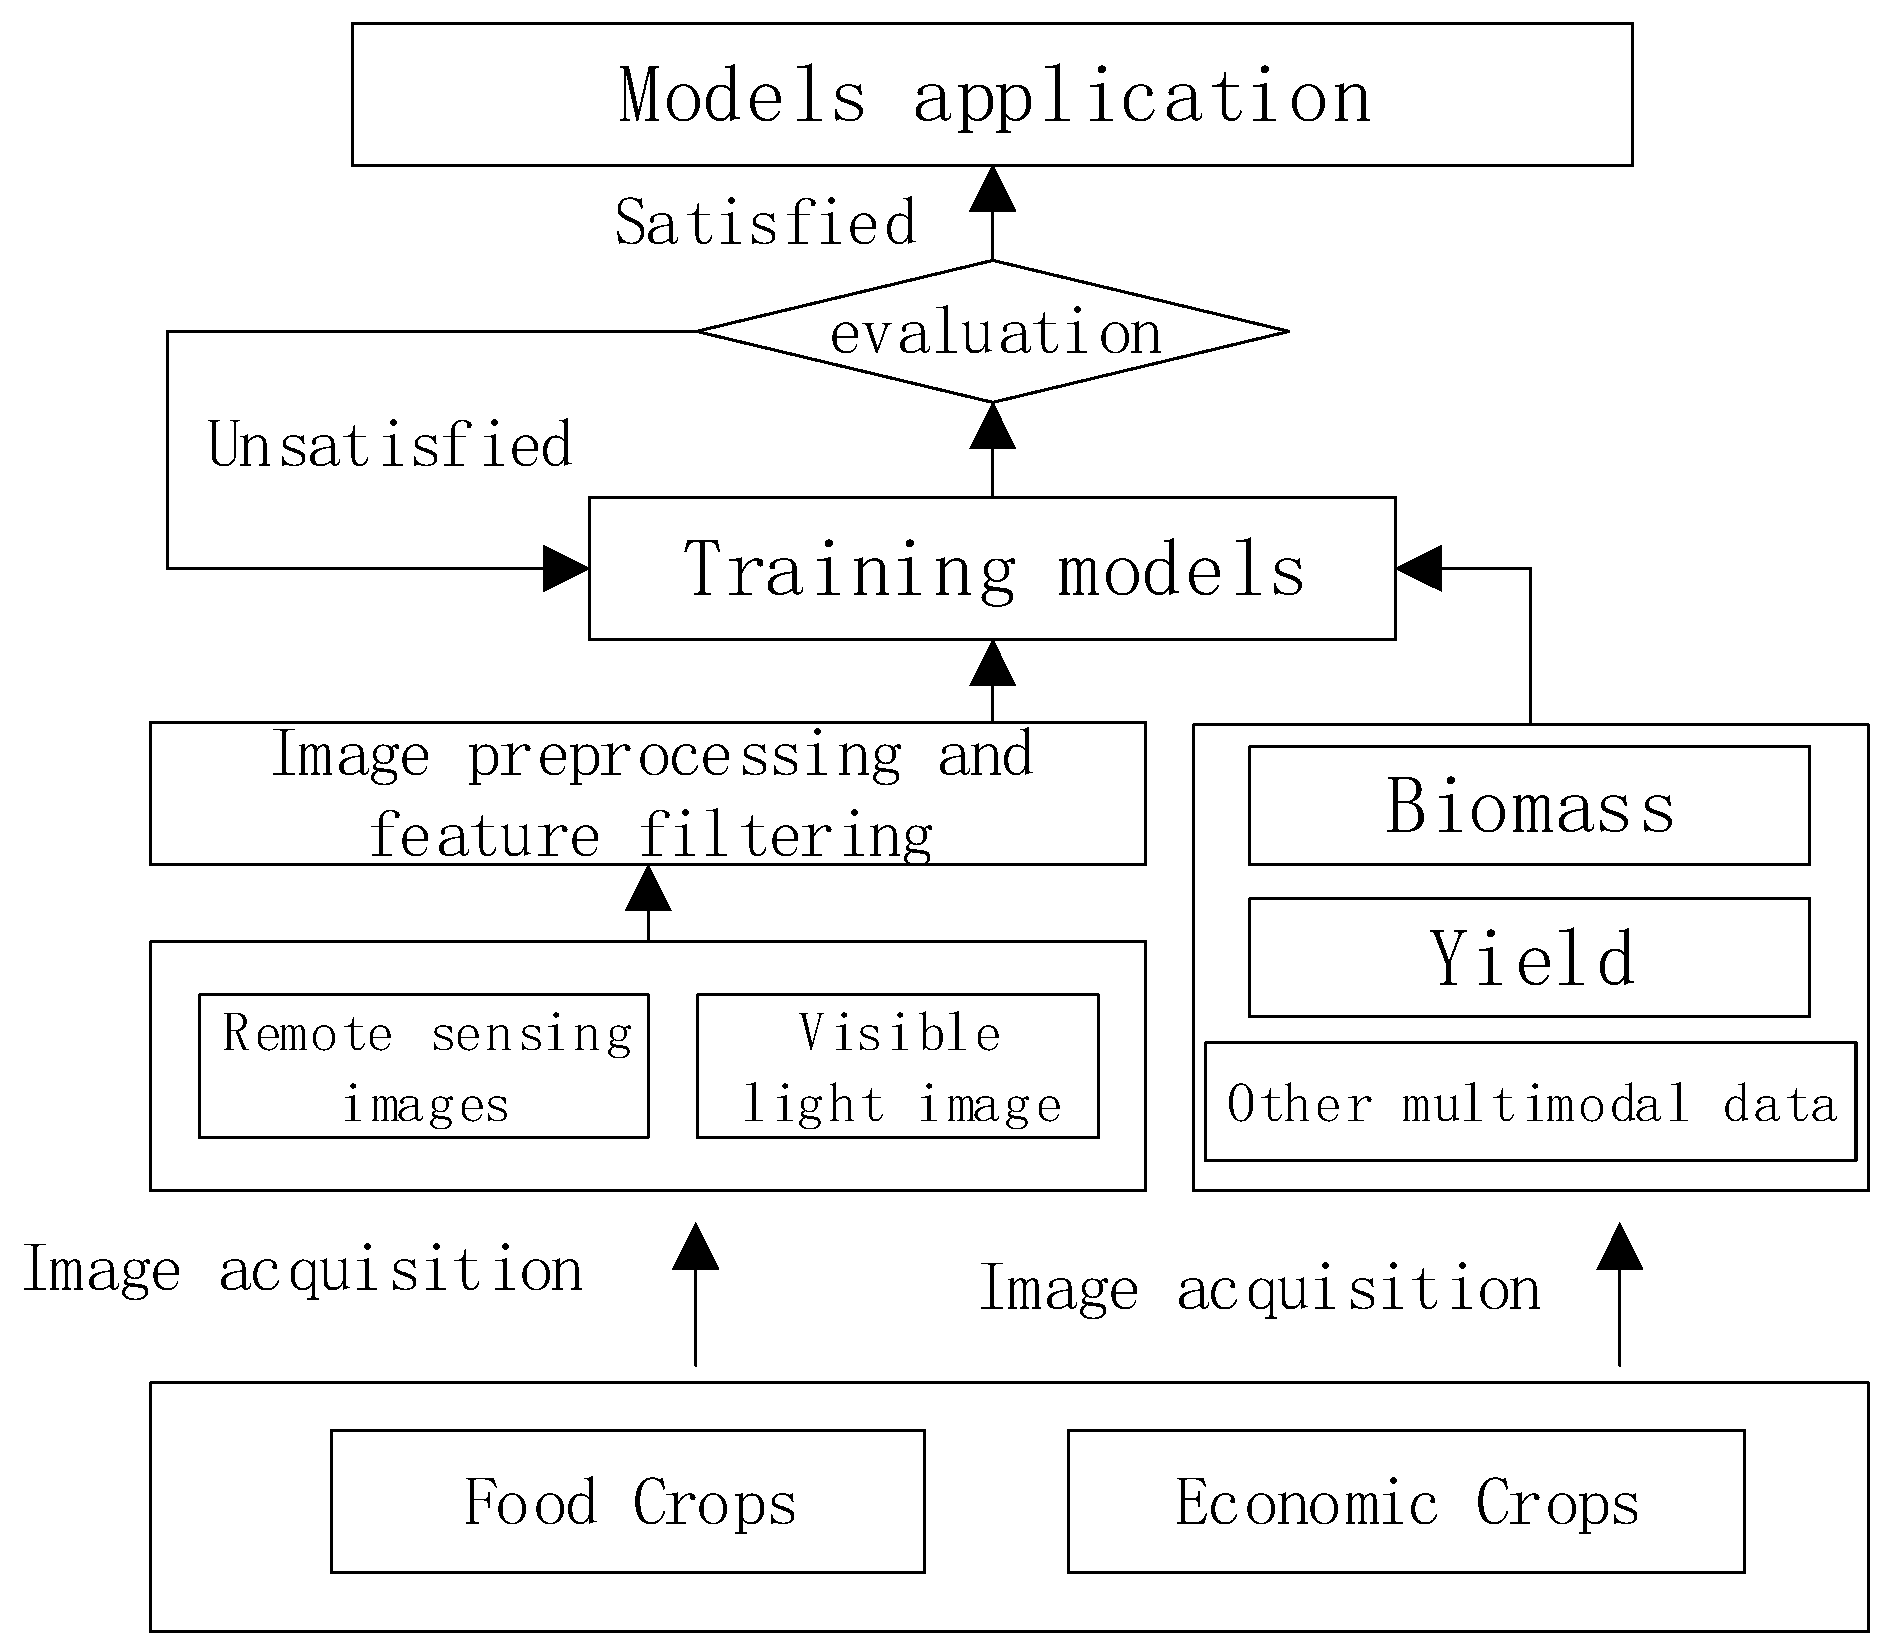
3. The Application of Image Technology in Crop-Yield Calculation
3.1. Yield Calculation by Remote Sensing Image
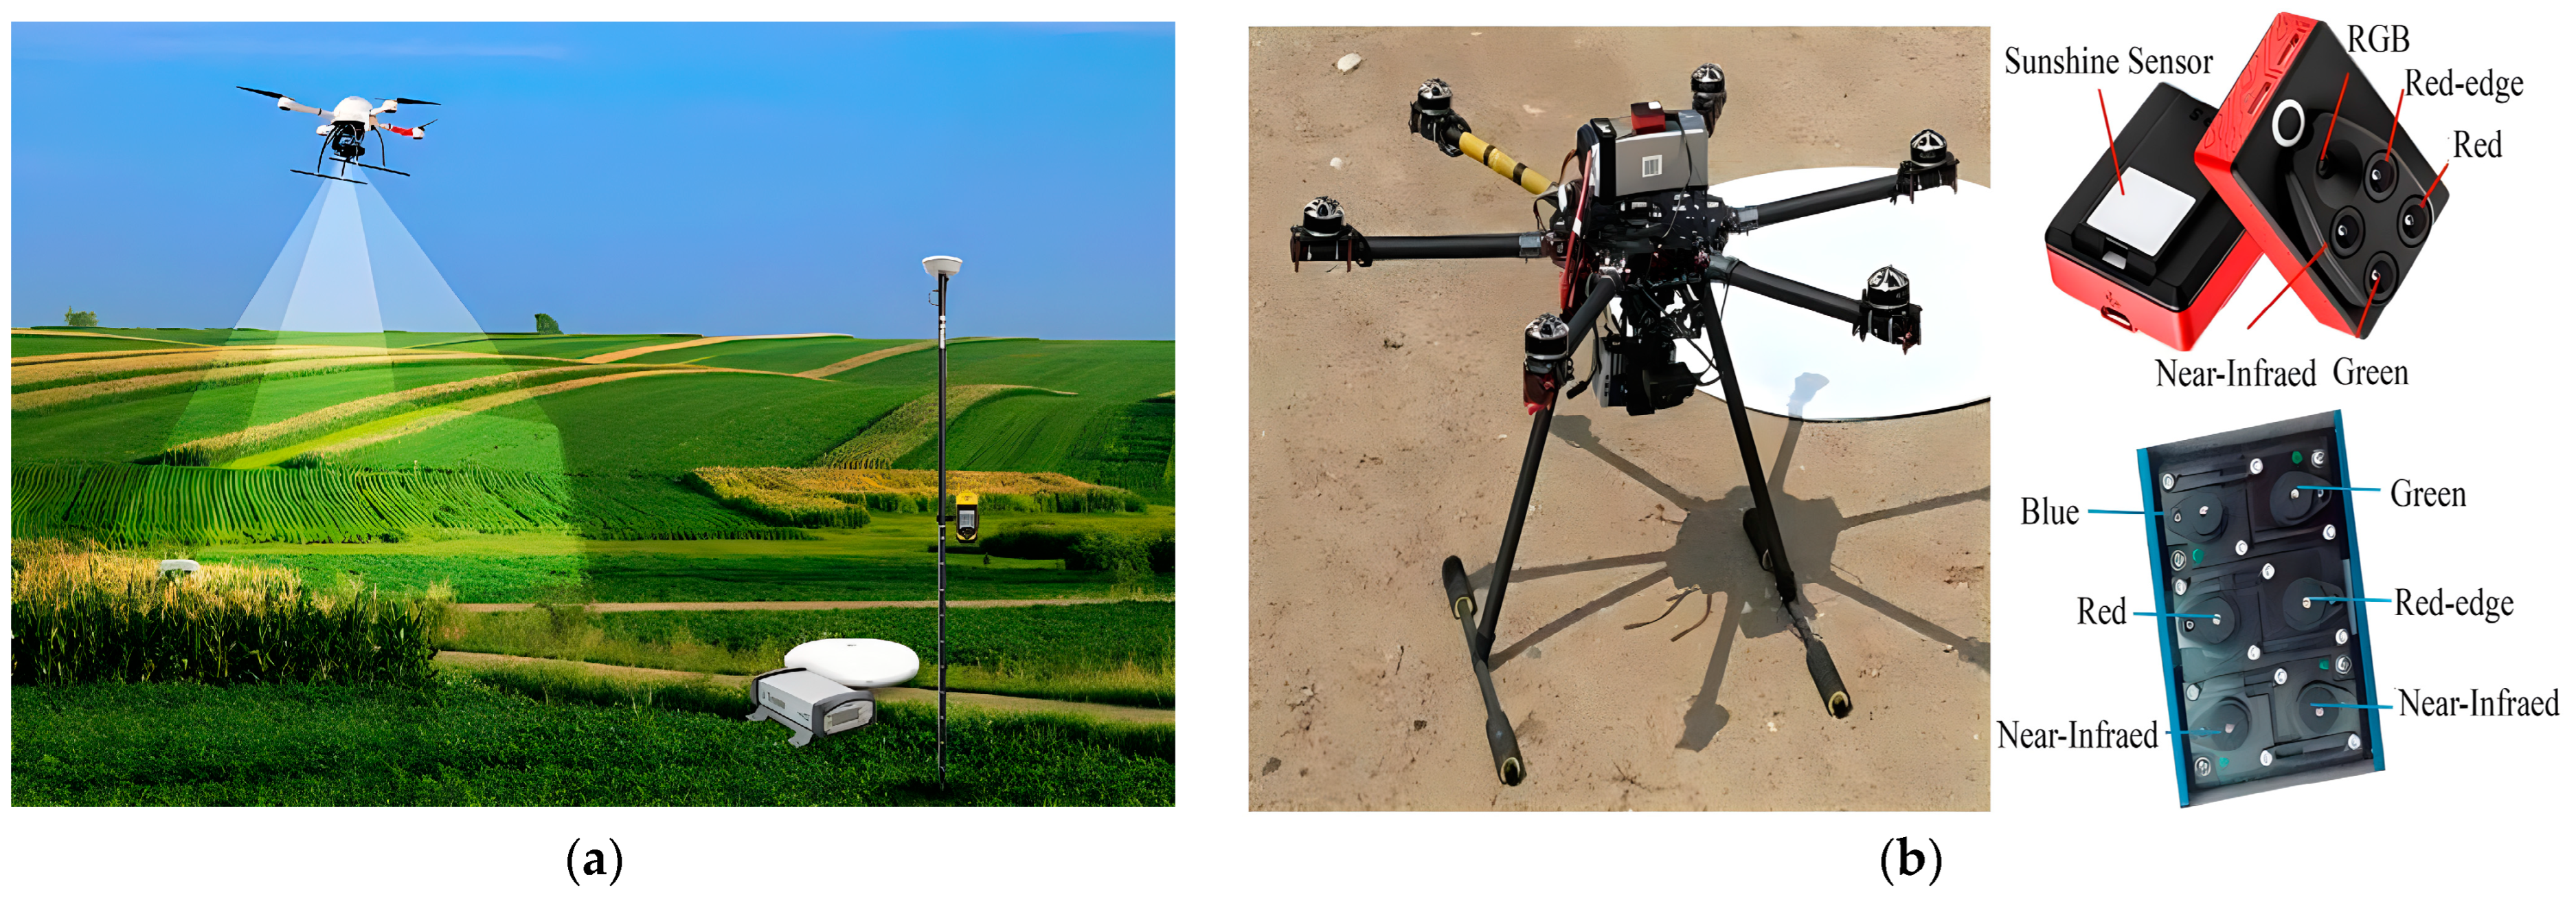
3.1.1. Yield Calculation by Low-Altitude Remote Sensing Imaging
- Yield Calculation of Food Crops
- Yield Calculation of Economic Crops
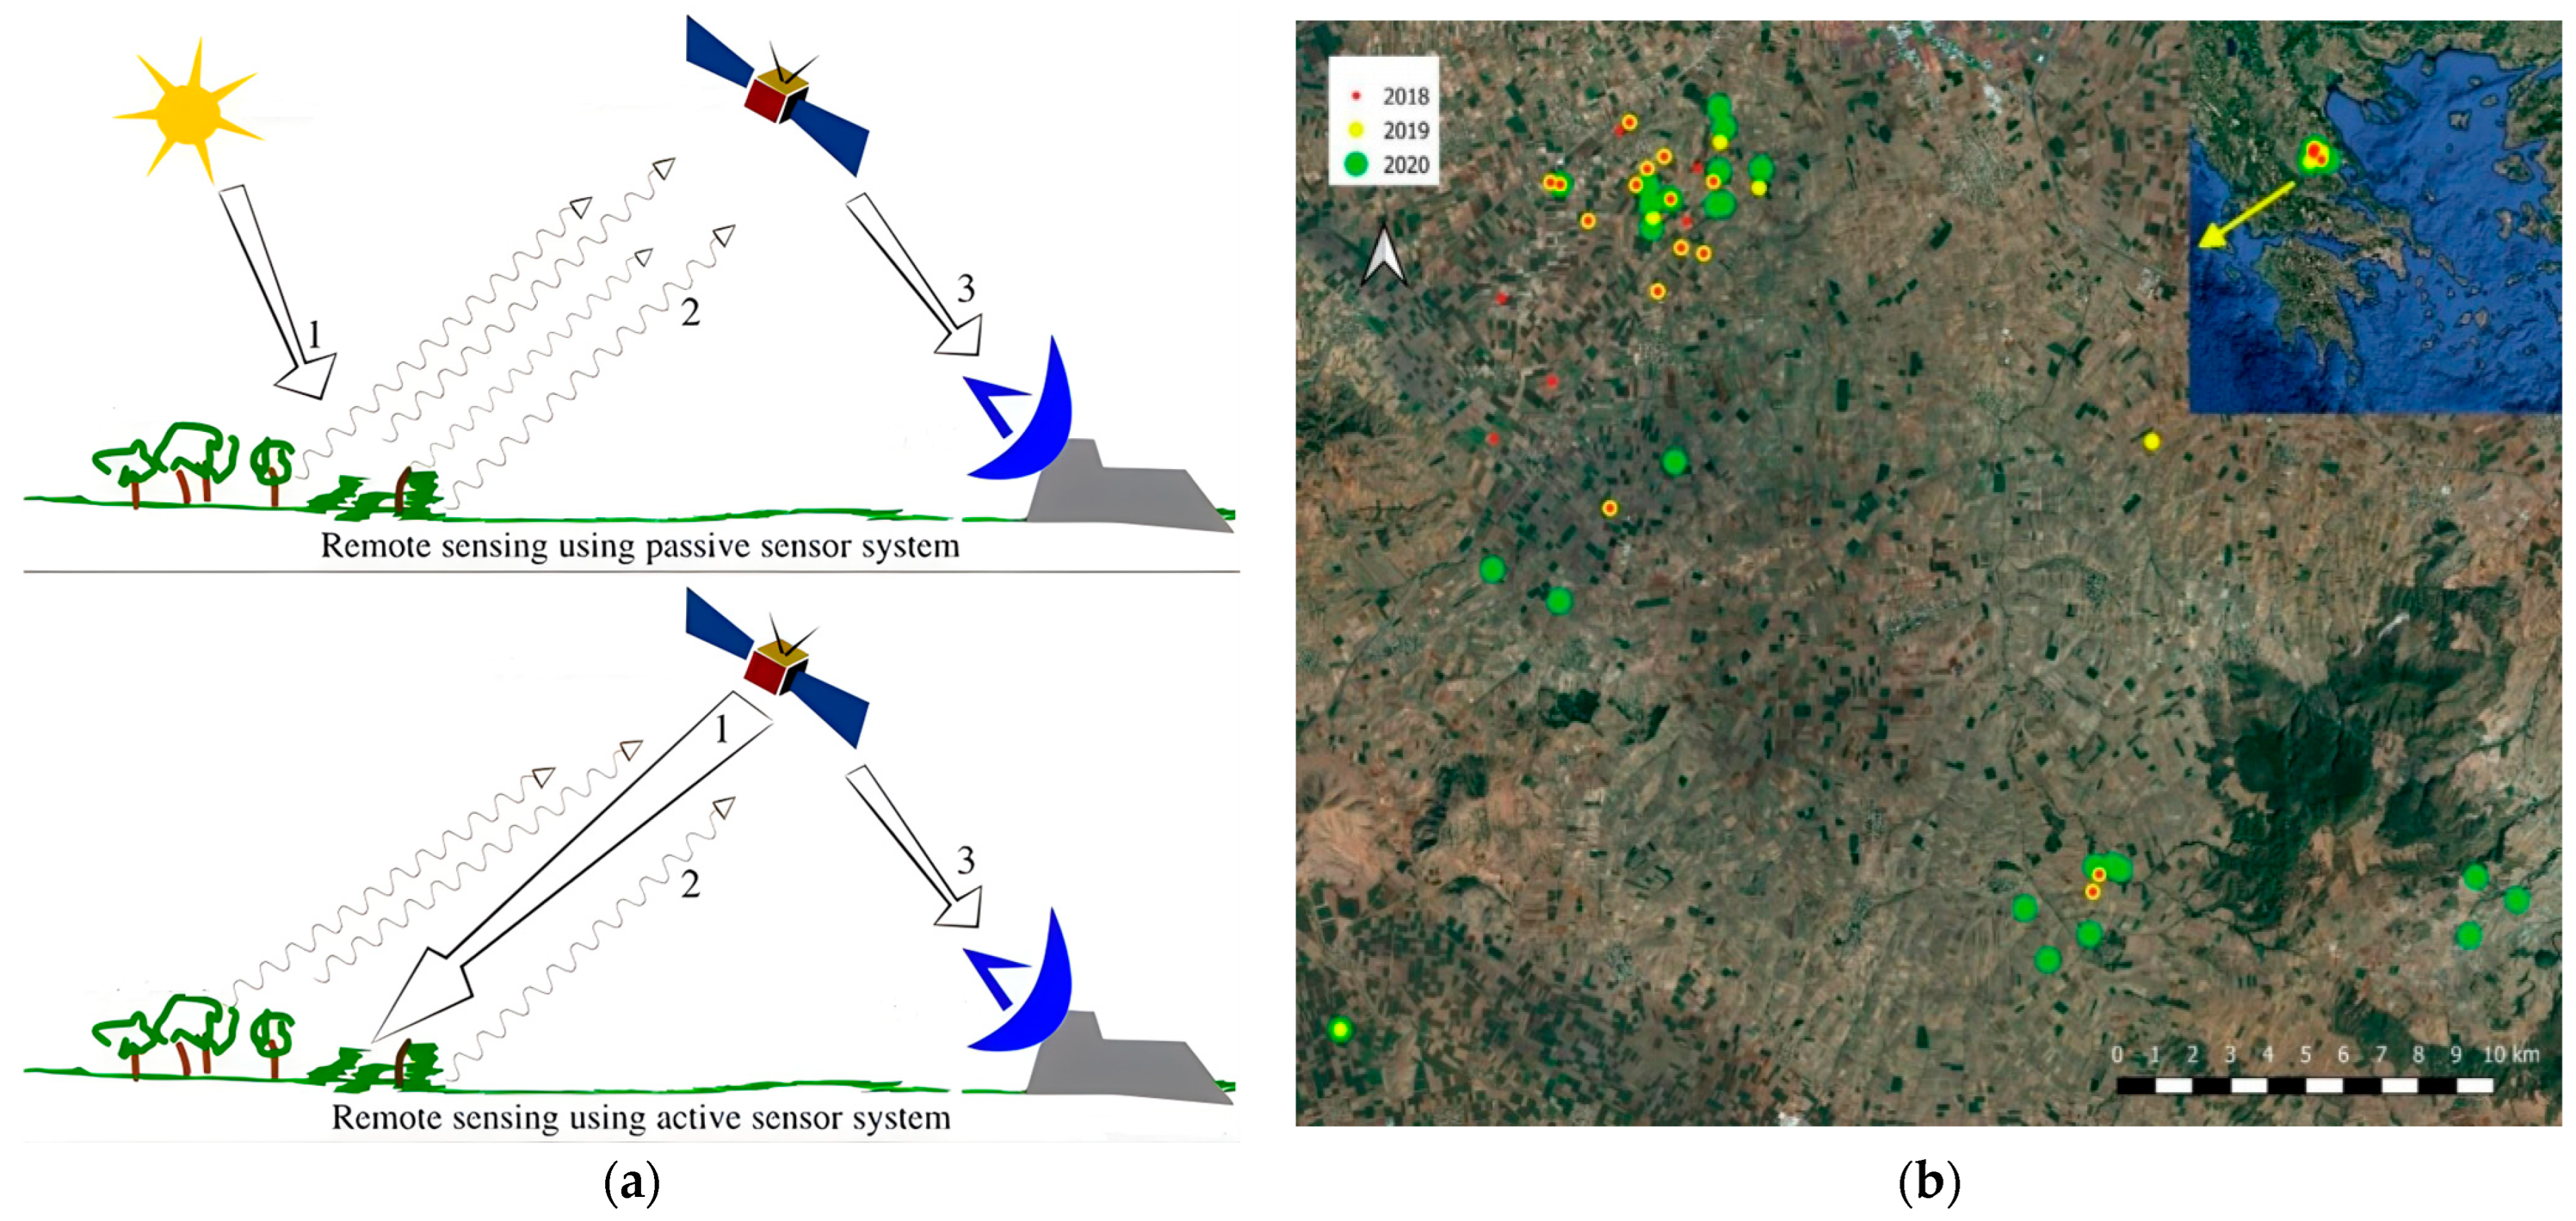
3.1.2. Yield Calculation by High-Altitude Satellite Remote Sensing Imaging
3.2. Yield Calculation by Visible Light Image
3.2.1. Yield Calculation by Traditional Image Processing
3.2.2. Yield Calculation by Deep Learning Imaging
- Yield Calculation of Food Crops
- Yield Calculation of Economic Crops
4. Discussion
- (1)
- Machine learning (ML)
- (2)
- Deep learning (DL)
5. Conclusions and Outlooks
Author Contributions
Funding
Data Availability Statement
Conflicts of Interest
References
- Paudel, D.; Boogaard, H.; de Wit, A.; Janssen, S.; Osinga, S.; Pylianidis, C.; Athanasiadis, I.N. Machine learning for large-scale crop yield forecasting. Agric. Syst. 2021, 187, 103016. [Google Scholar] [CrossRef]
- Zhu, Y.; Wu, S.; Qin, M.; Fu, Z.; Gao, Y.; Wang, Y.; Du, Z. A deep learning crop model for adaptive yield estimation in large areas. Int. J. Appl. Earth Obs. Geoinf. 2022, 110, 102828. [Google Scholar] [CrossRef]
- Akhtar, M.N.; Ansari, E.; Alhady, S.S.N.; Abu Bakar, E. Leveraging on Advanced Remote Sensing- and Artificial Intelligence-Based Technologies to Manage Palm Oil Plantation for Current Global Scenario: A Review. Agriculture 2023, 13, 504. [Google Scholar] [CrossRef]
- Torres-Sánchez, J.; Souza, J.; di Gennaro, S.F.; Mesas-Carrascosa, F.J. Editorial: Fruit detection and yield prediction on woody crops using data from unmanned aerial vehicles. Front. Plant Sci. 2022, 13, 1112445. [Google Scholar] [CrossRef] [PubMed]
- Wen, T.; Li, J.-H.; Wang, Q.; Gao, Y.-Y.; Hao, G.-F.; Song, B.-A. Thermal imaging: The digital eye facilitates high-throughput phenotyping traits of plant growth and stress responses. Sci. Total Environ. 2023, 899, 165626. [Google Scholar] [CrossRef]
- Farjon, G.; Huijun, L.; Edan, Y. Deep-learning-based counting methods, datasets, and applications in agriculture: A review. Precis. Agric. 2023, 24, 1683–1711. [Google Scholar] [CrossRef]
- Rashid, M.; Bari, B.S.; Yusup, Y.; Kamaruddin, M.A.; Khan, N. A Comprehensive Review of Crop Yield Prediction Using Machine Learning Approaches With Special Emphasis on Palm Oil Yield Prediction. IEEE Access 2021, 9, 63406–63439. [Google Scholar] [CrossRef]
- Attri, I.; Awasthi, L.K.; Sharma, T.P. Machine learning in agriculture: A review of crop management applications. Multimed. Tools Appl. 2023, 83, 12875–12915. [Google Scholar] [CrossRef]
- Di, Y.; Gao, M.; Feng, F.; Li, Q.; Zhang, H. A New Framework for Winter Wheat Yield Prediction Integrating Deep Learning and Bayesian Optimization. Agronomy 2022, 12, 3194. [Google Scholar] [CrossRef]
- Teixeira, I.; Morais, R.; Sousa, J.J.; Cunha, A. Deep Learning Models for the Classification of Crops in Aerial Imagery: A Review. Agriculture 2023, 13, 965. [Google Scholar] [CrossRef]
- Bali, N.; Singla, A. Deep Learning Based Wheat Crop Yield Prediction Model in Punjab Region of North India. Appl. Artif. Intell. 2021, 35, 1304–1328. [Google Scholar] [CrossRef]
- van Klompenburg, T.; Kassahun, A.; Catal, C. Crop yield prediction using machine learning: A systematic literature review. Comput. Electron. Agric. 2020, 177, 105709. [Google Scholar] [CrossRef]
- He, L.; Fang, W.; Zhao, G.; Wu, Z.; Fu, L.; Li, R.; Majeed, Y.; Dhupia, J. Fruit yield prediction and estimation in orchards: A state-of-the-art comprehensive review for both direct and indirect methods. Comput. Electron. Agric. 2022, 195, 106812. [Google Scholar] [CrossRef]
- Li, K.-Y.; Sampaio de Lima, R.; Burnside, N.G.; Vahtmäe, E.; Kutser, T.; Sepp, K.; Cabral Pinheiro, V.H.; Yang, M.-D.; Vain, A.; Sepp, K. Toward Automated Machine Learning-Based Hyperspectral Image Analysis in Crop Yield and Biomass Estimation. Remote Sens. 2022, 14, 1114. [Google Scholar] [CrossRef]
- Desloires, J.; Ienco, D.; Botrel, A. Out-of-year corn yield prediction at field-scale using Sentinel-2 satellite imagery and machine learning methods. Comput. Electron. Agric. 2023, 209, 107807. [Google Scholar] [CrossRef]
- Thakur, A.; Venu, S.; Gurusamy, M. An extensive review on agricultural robots with a focus on their perception systems. Comput. Electron. Agric. 2023, 212, 108146. [Google Scholar] [CrossRef]
- Abebe, A.M.; Kim, Y.; Kim, J.; Kim, S.L.; Baek, J. Image-Based High-Throughput Phenotyping in Horticultural Crops. Plants 2023, 12, 2061. [Google Scholar] [CrossRef] [PubMed]
- Alkhaled, A.; Townsend, P.A.A.; Wang, Y. Remote Sensing for Monitoring Potato Nitrogen Status. Am. J. Potato Res. 2023, 100, 1–14. [Google Scholar] [CrossRef]
- Pokhariyal, S.; Patel, N.R.; Govind, A. Machine Learning-Driven Remote Sensing Applications for Agriculture in India—A Systematic Review. Agronomy 2023, 13, 2302. [Google Scholar] [CrossRef]
- Joshi, A.; Pradhan, B.; Gite, S.; Chakraborty, S. Remote-Sensing Data and Deep-Learning Techniques in Crop Mapping and Yield Prediction: A Systematic Review. Remote Sens. 2023, 15, 2014. [Google Scholar] [CrossRef]
- Muruganantham, P.; Wibowo, S.; Grandhi, S.; Samrat, N.H.; Islam, N. A Systematic Literature Review on Crop Yield Prediction with Deep Learning and Remote Sensing. Remote Sens. 2022, 14, 1990. [Google Scholar] [CrossRef]
- Ren, Y.; Li, Q.; Du, X.; Zhang, Y.; Wang, H.; Shi, G.; Wei, M. Analysis of Corn Yield Prediction Potential at Various Growth Phases Using a Process-Based Model and Deep Learning. Plants 2023, 12, 446. [Google Scholar] [CrossRef]
- Zhou, S.; Xu, L.; Chen, N. Rice Yield Prediction in Hubei Province Based on Deep Learning and the Effect of Spatial Heterogeneity. Remote Sens. 2023, 15, 1361. [Google Scholar] [CrossRef]
- Darra, N.; Anastasiou, E.; Kriezi, O.; Lazarou, E.; Kalivas, D.; Fountas, S. Can Yield Prediction Be Fully Digitilized? A Systematic Review. Agronomy 2023, 13, 2441. [Google Scholar] [CrossRef]
- Shahi, T.B.; Xu, C.-Y.; Neupane, A.; Guo, W. Recent Advances in Crop Disease Detection Using UAV and Deep Learning Techniques. Remote Sens. 2023, 15, 2450. [Google Scholar] [CrossRef]
- Istiak, A.; Syeed, M.M.M.; Hossain, S.; Uddin, M.F.; Hasan, M.; Khan, R.H.; Azad, N.S. Adoption of Unmanned Aerial Vehicle (UAV) imagery in agricultural management: A systematic literature review. Ecol. Inform. 2023, 78, 102305. [Google Scholar] [CrossRef]
- Fajardo, M.; Whelan, B.M. Within-farm wheat yield forecasting incorporating off-farm information. Precis. Agric. 2021, 22, 569–585. [Google Scholar] [CrossRef]
- Yli-Heikkilä, M.; Wittke, S.; Luotamo, M.; Puttonen, E.; Sulkava, M.; Pellikka, P.; Heiskanen, J.; Klami, A. Scalable Crop Yield Prediction with Sentinel-2 Time Series and Temporal Convolutional Network. Remote Sens. 2022, 14, 4193. [Google Scholar] [CrossRef]
- Safdar, L.B.; Dugina, K.; Saeidan, A.; Yoshicawa, G.V.; Caporaso, N.; Gapare, B.; Umer, M.J.; Bhosale, R.A.; Searle, I.R.; Foulkes, M.J.; et al. Reviving grain quality in wheat through non-destructive phenotyping techniques like hyperspectral imaging. Food Energy Secur. 2023, 12, e498. [Google Scholar] [CrossRef] [PubMed]
- Tende, I.G.; Aburada, K.; Yamaba, H.; Katayama, T.; Okazaki, N. Development and Evaluation of a Deep Learning Based System to Predict District-Level Maize Yields in Tanzania. Agriculture 2023, 13, 627. [Google Scholar] [CrossRef]
- Leukel, J.; Zimpel, T.; Stumpe, C. Machine learning technology for early prediction of grain yield at the field scale: A systematic review. Comput. Electron. Agric. 2023, 207, 107721. [Google Scholar] [CrossRef]
- Elangovan, A.; Duc, N.T.; Raju, D.; Kumar, S.; Singh, B.; Vishwakarma, C.; Gopala Krishnan, S.; Ellur, R.K.; Dalal, M.; Swain, P.; et al. Imaging Sensor-Based High-Throughput Measurement of Biomass Using Machine Learning Models in Rice. Agriculture 2023, 13, 852. [Google Scholar] [CrossRef]
- Hassanzadeh, A.; Zhang, F.; van Aardt, J.; Murphy, S.P.; Pethybridge, S.J. Broadacre Crop Yield Estimation Using Imaging Spectroscopy from Unmanned Aerial Systems (UAS): A Field-Based Case Study with Snap Bean. Remote Sens. 2021, 13, 3241. [Google Scholar] [CrossRef]
- Sanaeifar, A.; Yang, C.; Guardia, M.d.l.; Zhang, W.; Li, X.; He, Y. Proximal hyperspectral sensing of abiotic stresses in plants. Sci. Total Environ. 2023, 861, 160652. [Google Scholar] [CrossRef]
- Son, N.-T.; Chen, C.-F.; Cheng, Y.-S.; Toscano, P.; Chen, C.-R.; Chen, S.-L.; Tseng, K.-H.; Syu, C.-H.; Guo, H.-Y.; Zhang, Y.-T. Field-scale rice yield prediction from Sentinel-2 monthly image composites using machine learning algorithms. Ecol. Inform. 2022, 69, 101618. [Google Scholar] [CrossRef]
- Elavarasan, D.; Vincent, P.M.D. Crop Yield Prediction Using Deep Reinforcement Learning Model for Sustainable Agrarian Applications. IEEE Access 2020, 8, 86886–86901. [Google Scholar] [CrossRef]
- Teodoro, P.E.; Teodoro, L.P.R.; Baio, F.H.R.; da Silva Junior, C.A.; dos Santos, R.G.; Ramos, A.P.M.; Pinheiro, M.M.F.; Osco, L.P.; Gonçalves, W.N.; Carneiro, A.M.; et al. Predicting Days to Maturity, Plant Height, and Grain Yield in Soybean: A Machine and Deep Learning Approach Using Multispectral Data. Remote Sens. 2021, 13, 4632. [Google Scholar] [CrossRef]
- Fei, S.; Hassan, M.A.; Xiao, Y.; Su, X.; Chen, Z.; Cheng, Q.; Duan, F.; Chen, R.; Ma, Y. UAV-based multi-sensor data fusion and machine learning algorithm for yield prediction in wheat. Precis. Agric. 2022, 24, 187–212. [Google Scholar] [CrossRef]
- Marques Ramos, A.P.; Prado Osco, L.; Elis Garcia Furuya, D.; Nunes Gonçalves, W.; Cordeiro Santana, D.; Pereira Ribeiro Teodoro, L.; Antonio da Silva Junior, C.; Fernando Capristo-Silva, G.; Li, J.; Henrique Rojo Baio, F.; et al. A random forest ranking approach to predict yield in maize with uav-based vegetation spectral indices. Comput. Electron. Agric. 2020, 178, 105791. [Google Scholar] [CrossRef]
- Ji, Y.; Liu, R.; Xiao, Y.; Cui, Y.; Chen, Z.; Zong, X.; Yang, T. Faba bean above-ground biomass and bean yield estimation based on consumer-grade unmanned aerial vehicle RGB images and ensemble learning. Precis. Agric. 2023, 24, 1439–1460. [Google Scholar] [CrossRef]
- Ayankojo, I.T.T.; Thorp, K.R.R.; Thompson, A.L.L. Advances in the Application of Small Unoccupied Aircraft Systems (sUAS) for High-Throughput Plant Phenotyping. Remote Sens. 2023, 15, 2623. [Google Scholar] [CrossRef]
- Zualkernan, I.; Abuhani, D.A.; Hussain, M.H.; Khan, J.; ElMohandes, M. Machine Learning for Precision Agriculture Using Imagery from Unmanned Aerial Vehicles (UAVs): A Survey. Drones 2023, 7, 382. [Google Scholar] [CrossRef]
- Zhang, Z.; Zhu, L. A Review on Unmanned Aerial Vehicle Remote Sensing: Platforms, Sensors, Data Processing Methods, and Applications. Drones 2023, 7, 398. [Google Scholar] [CrossRef]
- He, Z.; Wu, K.; Wang, F.; Jin, L.; Zhang, R.; Tian, S.; Wu, W.; He, Y.; Huang, R.; Yuan, L.; et al. Fresh Yield Estimation of Spring Tea via Spectral Differences in UAV Hyperspectral Images from Unpicked and Picked Canopies. Remote Sens. 2023, 15, 1100. [Google Scholar] [CrossRef]
- Xu, W.; Chen, P.; Zhan, Y.; Chen, S.; Zhang, L.; Lan, Y. Cotton yield estimation model based on machine learning using time series UAV remote sensing data. Int. J. Appl. Earth Obs. Geoinf. 2021, 104, 102511. [Google Scholar] [CrossRef]
- Gonzalez-Sanchez, A.; Frausto-Solis, J.; Ojeda-Bustamante, W. Predictive ability of machine learning methods for massive crop yield prediction. Span. J. Agric. Res. 2014, 12, 313. [Google Scholar] [CrossRef]
- Yang, W.; Nigon, T.; Hao, Z.; Dias Paiao, G.; Fernández, F.G.; Mulla, D.; Yang, C. Estimation of corn yield based on hyperspectral imagery and convolutional neural network. Comput. Electron. Agric. 2021, 184, 106092. [Google Scholar] [CrossRef]
- Danilevicz, M.F.; Bayer, P.E.; Boussaid, F.; Bennamoun, M.; Edwards, D. Maize Yield Prediction at an Early Developmental Stage Using Multispectral Images and Genotype Data for Preliminary Hybrid Selection. Remote Sens. 2021, 13, 3976. [Google Scholar] [CrossRef]
- Kumar, C.; Mubvumba, P.; Huang, Y.; Dhillon, J.; Reddy, K. Multi-Stage Corn Yield Prediction Using High-Resolution UAV Multispectral Data and Machine Learning Models. Agronomy 2023, 13, 1277. [Google Scholar] [CrossRef]
- Yu, D.; Zha, Y.; Sun, Z.; Li, J.; Jin, X.; Zhu, W.; Bian, J.; Ma, L.; Zeng, Y.; Su, Z. Deep convolutional neural networks for estimating maize above-ground biomass using multi-source UAV images: A comparison with traditional machine learning algorithms. Precis. Agric. 2022, 24, 92–113. [Google Scholar] [CrossRef]
- Mia, M.S.; Tanabe, R.; Habibi, L.N.; Hashimoto, N.; Homma, K.; Maki, M.; Matsui, T.; Tanaka, T.S.T. Multimodal Deep Learning for Rice Yield Prediction Using UAV-Based Multispectral Imagery and Weather Data. Remote Sens. 2023, 15, 2511. [Google Scholar] [CrossRef]
- Bellis, E.S.; Hashem, A.A.; Causey, J.L.; Runkle, B.R.K.; Moreno-García, B.; Burns, B.W.; Green, V.S.; Burcham, T.N.; Reba, M.L.; Huang, X. Detecting Intra-Field Variation in Rice Yield With Unmanned Aerial Vehicle Imagery and Deep Learning. Front. Plant Sci. 2022, 13, 716506. [Google Scholar] [CrossRef]
- Bian, C.; Shi, H.; Wu, S.; Zhang, K.; Wei, M.; Zhao, Y.; Sun, Y.; Zhuang, H.; Zhang, X.; Chen, S. Prediction of Field-Scale Wheat Yield Using Machine Learning Method and Multi-Spectral UAV Data. Remote Sens. 2022, 14, 1474. [Google Scholar] [CrossRef]
- Han, Y.; Tang, R.; Liao, Z.; Zhai, B.; Fan, J. A Novel Hybrid GOA-XGB Model for Estimating Wheat Aboveground Biomass Using UAV-Based Multispectral Vegetation Indices. Remote Sens. 2022, 14, 3506. [Google Scholar] [CrossRef]
- Zhou, X.; Kono, Y.; Win, A.; Matsui, T.; Tanaka, T.S.T. Predicting within-field variability in grain yield and protein content of winter wheat using UAV-based multispectral imagery and machine learning approaches. Plant Prod. Sci. 2020, 24, 137–151. [Google Scholar] [CrossRef]
- Sharma, P.; Leigh, L.; Chang, J.; Maimaitijiang, M.; Caffé, M. Above-Ground Biomass Estimation in Oats Using UAV Remote Sensing and Machine Learning. Sensors 2022, 22, 601. [Google Scholar] [CrossRef]
- Wang, F.; Yang, M.; Ma, L.; Zhang, T.; Qin, W.; Li, W.; Zhang, Y.; Sun, Z.; Wang, Z.; Li, F.; et al. Estimation of Above-Ground Biomass of Winter Wheat Based on Consumer-Grade Multi-Spectral UAV. Remote Sens. 2022, 14, 1251. [Google Scholar] [CrossRef]
- Roy Choudhury, M.; Das, S.; Christopher, J.; Apan, A.; Chapman, S.; Menzies, N.W.; Dang, Y.P. Improving Biomass and Grain Yield Prediction of Wheat Genotypes on Sodic Soil Using Integrated High-Resolution Multispectral, Hyperspectral, 3D Point Cloud, and Machine Learning Techniques. Remote Sens. 2021, 13, 3482. [Google Scholar] [CrossRef]
- Fu, Y.; Yang, G.; Song, X.; Li, Z.; Xu, X.; Feng, H.; Zhao, C. Improved Estimation of Winter Wheat Aboveground Biomass Using Multiscale Textures Extracted from UAV-Based Digital Images and Hyperspectral Feature Analysis. Remote Sens. 2021, 13, 581. [Google Scholar] [CrossRef]
- Tanabe, R.; Matsui, T.; Tanaka, T.S.T. Winter wheat yield prediction using convolutional neural networks and UAV-based multispectral imagery. Field Crops Res. 2023, 291, 108786. [Google Scholar] [CrossRef]
- Li, Z.; Chen, Z.; Cheng, Q.; Duan, F.; Sui, R.; Huang, X.; Xu, H. UAV-Based Hyperspectral and Ensemble Machine Learning for Predicting Yield in Winter Wheat. Agronomy 2022, 12, 202. [Google Scholar] [CrossRef]
- Li, R.; Wang, D.; Zhu, B.; Liu, T.; Sun, C.; Zhang, Z. Estimation of grain yield in wheat using source–sink datasets derived from RGB and thermal infrared imaging. Food Energy Secur. 2022, 12, e434. [Google Scholar] [CrossRef]
- Sharifi, A. Yield prediction with machine learning algorithms and satellite images. J. Sci. Food Agric. 2020, 101, 891–896. [Google Scholar] [CrossRef]
- Ma, J.; Liu, B.; Ji, L.; Zhu, Z.; Wu, Y.; Jiao, W. Field-scale yield prediction of winter wheat under different irrigation regimes based on dynamic fusion of multimodal UAV imagery. Int. J. Appl. Earth Obs. Geoinf. 2023, 118, 103292. [Google Scholar] [CrossRef]
- Maimaitijiang, M.; Sagan, V.; Sidike, P.; Hartling, S.; Esposito, F.; Fritschi, F.B. Soybean yield prediction from UAV using multimodal data fusion and deep learning. Remote Sens. Environ. 2020, 237, 111599. [Google Scholar] [CrossRef]
- Zhou, J.; Zhou, J.; Ye, H.; Ali, M.L.; Chen, P.; Nguyen, H.T. Yield estimation of soybean breeding lines under drought stress using unmanned aerial vehicle-based imagery and convolutional neural network. Biosyst. Eng. 2021, 204, 90–103. [Google Scholar] [CrossRef]
- Yoosefzadeh-Najafabadi, M.; Tulpan, D.; Eskandari, M. Using Hybrid Artificial Intelligence and Evolutionary Optimization Algorithms for Estimating Soybean Yield and Fresh Biomass Using Hyperspectral Vegetation Indices. Remote Sens. 2021, 13, 2555. [Google Scholar] [CrossRef]
- Yoosefzadeh-Najafabadi, M.; Earl, H.J.; Tulpan, D.; Sulik, J.; Eskandari, M. Application of Machine Learning Algorithms in Plant Breeding: Predicting Yield From Hyperspectral Reflectance in Soybean. Front. Plant Sci. 2021, 11, 624273. [Google Scholar] [CrossRef]
- Shi, Y.; Gao, Y.; Wang, Y.; Luo, D.; Chen, S.; Ding, Z.; Fan, K. Using Unmanned Aerial Vehicle-Based Multispectral Image Data to Monitor the Growth of Intercropping Crops in Tea Plantation. Front. Plant Sci. 2022, 13, 820585. [Google Scholar] [CrossRef]
- Ji, Y.; Chen, Z.; Cheng, Q.; Liu, R.; Li, M.; Yan, X.; Li, G.; Wang, D.; Fu, L.; Ma, Y.; et al. Estimation of plant height and yield based on UAV imagery in faba bean (Vicia faba L.). Plant Methods 2022, 18, s13007–s13022. [Google Scholar] [CrossRef]
- Liu, Y.; Feng, H.; Yue, J.; Fan, Y.; Jin, X.; Zhao, Y.; Song, X.; Long, H.; Yang, G. Estimation of Potato Above-Ground Biomass Using UAV-Based Hyperspectral images and Machine-Learning Regression. Remote Sens. 2022, 14, 5449. [Google Scholar] [CrossRef]
- Sun, C.; Feng, L.; Zhang, Z.; Ma, Y.; Crosby, T.; Naber, M.; Wang, Y. Prediction of End-Of-Season Tuber Yield and Tuber Set in Potatoes Using In-Season UAV-Based Hyperspectral Imagery and Machine Learning. Sensors 2020, 20, 5293. [Google Scholar] [CrossRef]
- Poudyal, C.; Costa, L.F.; Sandhu, H.; Ampatzidis, Y.; Odero, D.C.; Arbelo, O.C.; Cherry, R.H. Sugarcane yield prediction and genotype selection using unmanned aerial vehicle-based hyperspectral imaging and machine learning. Agron. J. 2022, 114, 2320–2333. [Google Scholar] [CrossRef]
- de Oliveira, R.P.; Barbosa Júnior, M.R.; Pinto, A.A.; Oliveira, J.L.P.; Zerbato, C.; Furlani, C.E.A. Predicting Sugarcane Biometric Parameters by UAV Multispectral Images and Machine Learning. Agronomy 2022, 12, 1992. [Google Scholar] [CrossRef]
- Feng, L.; Zhang, Z.; Ma, Y.; Du, Q.; Williams, P.; Drewry, J.; Luck, B. Alfalfa Yield Prediction Using UAV-Based Hyperspectral Imagery and Ensemble Learning. Remote Sens. 2020, 12, 2028. [Google Scholar] [CrossRef]
- Wengert, M.; Wijesingha, J.; Schulze-Brüninghoff, D.; Wachendorf, M.; Astor, T. Multisite and Multitemporal Grassland Yield Estimation Using UAV-Borne Hyperspectral Data. Remote Sens. 2022, 14, 2068. [Google Scholar] [CrossRef]
- Pranga, J.; Borra-Serrano, I.; Aper, J.; De Swaef, T.; Ghesquiere, A.; Quataert, P.; Roldán-Ruiz, I.; Janssens, I.A.; Ruysschaert, G.; Lootens, P. Improving Accuracy of Herbage Yield Predictions in Perennial Ryegrass with UAV-Based Structural and Spectral Data Fusion and Machine Learning. Remote Sens. 2021, 13, 3459. [Google Scholar] [CrossRef]
- Li, K.-Y.; Burnside, N.G.; Sampaio de Lima, R.; Villoslada Peciña, M.; Sepp, K.; Yang, M.-D.; Raet, J.; Vain, A.; Selge, A.; Sepp, K. The Application of an Unmanned Aerial System and Machine Learning Techniques for Red Clover-Grass Mixture Yield Estimation under Variety Performance Trials. Remote Sens. 2021, 13, 1994. [Google Scholar] [CrossRef]
- Tatsumi, K.; Igarashi, N.; Mengxue, X. Prediction of plant-level tomato biomass and yield using machine learning with unmanned aerial vehicle imagery. Plant Methods 2021, 17, s13007–s13021. [Google Scholar] [CrossRef]
- Ballesteros, R.; Intrigliolo, D.S.; Ortega, J.F.; Ramírez-Cuesta, J.M.; Buesa, I.; Moreno, M.A. Vineyard yield estimation by combining remote sensing, computer vision and artificial neural network techniques. Precis. Agric. 2020, 21, 1242–1262. [Google Scholar] [CrossRef]
- Chen, R.; Zhang, C.; Xu, B.; Zhu, Y.; Zhao, F.; Han, S.; Yang, G.; Yang, H. Predicting individual apple tree yield using UAV multi-source remote sensing data and ensemble learning. Comput. Electron. Agric. 2022, 201, 107275. [Google Scholar] [CrossRef]
- Tang, M.; Sadowski, D.L.; Peng, C.; Vougioukas, S.G.; Klever, B.; Khalsa, S.D.S.; Brown, P.H.; Jin, Y. Tree-level almond yield estimation from high resolution aerial imagery with convolutional neural network. Front. Plant Sci. 2023, 14, 1070699. [Google Scholar] [CrossRef]
- Bebie, M.; Cavalaris, C.; Kyparissis, A. Assessing Durum Wheat Yield through Sentinel-2 Imagery: A Machine Learning Approach. Remote Sens. 2022, 14, 3880. [Google Scholar] [CrossRef]
- Kamir, E.; Waldner, F.; Hochman, Z. Estimating wheat yields in Australia using climate records, satellite image time series and machine learning methods. ISPRS J. Photogramm. Remote Sens. 2020, 160, 124–135. [Google Scholar] [CrossRef]
- Liu, Y.; Wang, S.; Wang, X.; Chen, B.; Chen, J.; Wang, J.; Huang, M.; Wang, Z.; Ma, L.; Wang, P.; et al. Exploring the superiority of solar-induced chlorophyll fluorescence data in predicting wheat yield using machine learning and deep learning methods. Comput. Electron. Agric. 2022, 192, 106612. [Google Scholar] [CrossRef]
- Abreu Júnior, C.A.M.d.; Martins, G.D.; Xavier, L.C.M.; Vieira, B.S.; Gallis, R.B.d.A.; Fraga Junior, E.F.; Martins, R.S.; Paes, A.P.B.; Mendonça, R.C.P.; Lima, J.V.d.N. Estimating Coffee Plant Yield Based on Multispectral Images and Machine Learning Models. Agronomy 2022, 12, 3195. [Google Scholar] [CrossRef]
- Bhumiphan, N.; Nontapon, J.; Kaewplang, S.; Srihanu, N.; Koedsin, W.; Huete, A. Estimation of Rubber Yield Using Sentinel-2 Satellite Data. Sustainability 2023, 15, 7223. [Google Scholar] [CrossRef]
- Filippi, P.; Whelan, B.M.; Vervoort, R.W.; Bishop, T.F.A. Mid-season empirical cotton yield forecasts at fine resolutions using large yield mapping datasets and diverse spatial covariates. Agric. Syst. 2020, 184, 102894. [Google Scholar] [CrossRef]
- Liu, F.; Jiang, X.; Wu, Z. Attention Mechanism-Combined LSTM for Grain Yield Prediction in China Using Multi-Source Satellite Imagery. Sustainability 2023, 15, 9210. [Google Scholar] [CrossRef]
- Tang, Y.; Qiu, J.; Zhang, Y.; Wu, D.; Cao, Y.; Zhao, K.; Zhu, L. Optimization strategies of fruit detection to overcome the challenge of unstructured background in field orchard environment: A review. Precis. Agric. 2023, 24, 1183–1219. [Google Scholar] [CrossRef]
- Darwin, B.; Dharmaraj, P.; Prince, S.; Popescu, D.E.; Hemanth, D.J. Recognition of Bloom/Yield in Crop Images Using Deep Learning Models for Smart Agriculture: A Review. Agronomy 2021, 11, 646. [Google Scholar] [CrossRef]
- Abbas, A.; Zhang, Z.; Zheng, H.; Alami, M.M.; Alrefaei, A.F.; Abbas, Q.; Naqvi, S.A.H.; Rao, M.J.; Mosa, W.F.A.; Abbas, Q.; et al. Drones in Plant Disease Assessment, Efficient Monitoring, and Detection: A Way Forward to Smart Agriculture. Agronomy 2023, 13, 1524. [Google Scholar] [CrossRef]
- Massah, J.; Asefpour Vakilian, K.; Shabanian, M.; Shariatmadari, S.M. Design, development, and performance evaluation of a robot for yield estimation of kiwifruit. Comput. Electron. Agric. 2021, 185, 106132. [Google Scholar] [CrossRef]
- Zhang, Y.; Ta, N.; Guo, S.; Chen, Q.; Zhao, L.; Li, F.; Chang, Q. Combining Spectral and Textural Information from UAV RGB Images for Leaf Area Index Monitoring in Kiwifruit Orchard. Remote Sens. 2022, 14, 1063. [Google Scholar] [CrossRef]
- Guo, Y.; Wang, H.; Wu, Z.; Wang, S.; Sun, H.; Senthilnath, J.; Wang, J.; Robin Bryant, C.; Fu, Y. Modified Red Blue Vegetation Index for Chlorophyll Estimation and Yield Prediction of Maize from Visible Images Captured by UAV. Sensors 2020, 20, 5055. [Google Scholar] [CrossRef]
- Zhang, M.; Zhou, J.; Sudduth, K.A.; Kitchen, N.R. Estimation of maize yield and effects of variable-rate nitrogen application using UAV-based RGB imagery. Biosyst. Eng. 2020, 189, 24–35. [Google Scholar] [CrossRef]
- Saddik, A.; Latif, R.; Abualkishik, A.Z.; El Ouardi, A.; Elhoseny, M. Sustainable Yield Prediction in Agricultural Areas Based on Fruit Counting Approach. Sustainability 2023, 15, 2707. [Google Scholar] [CrossRef]
- Liu, W.; Li, Y.; Liu, J.; Jiang, J. Estimation of Plant Height and Aboveground Biomass of Toona sinensis under Drought Stress Using RGB-D Imaging. Forests 2021, 12, 1747. [Google Scholar] [CrossRef]
- Rodriguez-Sanchez, J.; Li, C.; Paterson, A.H. Cotton Yield Estimation From Aerial Imagery Using Machine Learning Approaches. Front. Plant Sci. 2022, 13, 870181. [Google Scholar] [CrossRef]
- Gong, L.; Yu, M.; Cutsuridis, V.; Kollias, S.; Pearson, S. A Novel Model Fusion Approach for Greenhouse Crop Yield Prediction. Horticulturae 2022, 9, 5. [Google Scholar] [CrossRef]
- Kamilaris, A.; Prenafeta-Boldú, F.X. A review of the use of convolutional neural networks in agriculture. J. Agric. Sci. 2018, 156, 312–322. [Google Scholar] [CrossRef]
- Chin, R.; Catal, C.; Kassahun, A. Plant disease detection using drones in precision agriculture. Precis. Agric. 2023, 24, 1663–1682. [Google Scholar] [CrossRef]
- Jiang, Y.; Li, C. Convolutional Neural Networks for Image-Based High-Throughput Plant Phenotyping: A Review. Plant Phenomics 2020, 2020, 4152816. [Google Scholar] [CrossRef] [PubMed]
- Sanaeifar, A.; Guindo, M.L.; Bakhshipour, A.; Fazayeli, H.; Li, X.; Yang, C. Advancing precision agriculture: The potential of deep learning for cereal plant head detection. Comput. Electron. Agric. 2023, 209, 107875. [Google Scholar] [CrossRef]
- Buxbaum, N.; Lieth, J.H.; Earles, M. Non-destructive Plant Biomass Monitoring With High Spatio-Temporal Resolution via Proximal RGB-D Imagery and End-to-End Deep Learning. Front. Plant Sci. 2022, 13, 758818. [Google Scholar] [CrossRef]
- Lu, H.; Cao, Z. TasselNetV2+: A Fast Implementation for High-Throughput Plant Counting From High-Resolution RGB Imagery. Front. Plant Sci. 2020, 11, 541960. [Google Scholar] [CrossRef]
- Mota-Delfin, C.; López-Canteñs, G.d.J.; López-Cruz, I.L.; Romantchik-Kriuchkova, E.; Olguín-Rojas, J.C. Detection and Counting of Corn Plants in the Presence of Weeds with Convolutional Neural Networks. Remote Sens. 2022, 14, 4892. [Google Scholar] [CrossRef]
- Liu, Y.; Cen, C.; Che, Y.; Ke, R.; Ma, Y.; Ma, Y. Detection of Maize Tassels from UAV RGB Imagery with Faster R-CNN. Remote Sens. 2020, 12, 338. [Google Scholar] [CrossRef]
- Jia, H.; Qu, M.; Wang, G.; Walsh, M.J.; Yao, J.; Guo, H.; Liu, H. Dough-Stage Maize (Zea mays L.) Ear Recognition Based on Multiscale Hierarchical Features and Multifeature Fusion. Math. Probl. Eng. 2020, 2020, 9825472. [Google Scholar] [CrossRef]
- Maji, A.K.; Marwaha, S.; Kumar, S.; Arora, A.; Chinnusamy, V.; Islam, S. SlypNet: Spikelet-based yield prediction of wheat using advanced plant phenotyping and computer vision techniques. Front. Plant Sci. 2022, 13, 889853. [Google Scholar] [CrossRef]
- Nevavuori, P.; Narra, N.; Linna, P.; Lipping, T. Crop Yield Prediction Using Multitemporal UAV Data and Spatio-Temporal Deep Learning Models. Remote Sens. 2020, 12, 4000. [Google Scholar] [CrossRef]
- Qiu, R.; He, Y.; Zhang, M. Automatic Detection and Counting of Wheat Spikelet Using Semi-Automatic Labeling and Deep Learning. Front. Plant Sci. 2022, 13, 872555. [Google Scholar] [CrossRef]
- Zhaosheng, Y.; Tao, L.; Tianle, Y.; Chengxin, J.; Chengming, S. Rapid Detection of Wheat Ears in Orthophotos From Unmanned Aerial Vehicles in Fields Based on YOLOX. Front. Plant Sci. 2022, 13, 851245. [Google Scholar] [CrossRef]
- Zang, H.; Wang, Y.; Ru, L.; Zhou, M.; Chen, D.; Zhao, Q.; Zhang, J.; Li, G.; Zheng, G. Detection method of wheat spike improved YOLOv5s based on the attention mechanism. Front. Plant Sci. 2022, 13, 993244. [Google Scholar] [CrossRef] [PubMed]
- Zhao, F.; Xu, L.; Lv, L.; Zhang, Y. Wheat Ear Detection Algorithm Based on Improved YOLOv4. Appl. Sci. 2022, 12, 12195. [Google Scholar] [CrossRef]
- Lin, Z.; Guo, W. Sorghum Panicle Detection and Counting Using Unmanned Aerial System Images and Deep Learning. Front. Plant Sci. 2020, 11, 534853. [Google Scholar] [CrossRef] [PubMed]
- Guo, Y.; Li, S.; Zhang, Z.; Li, Y.; Hu, Z.; Xin, D.; Chen, Q.; Wang, J.; Zhu, R. Automatic and Accurate Calculation of Rice Seed Setting Rate Based on Image Segmentation and Deep Learning. Front. Plant Sci. 2021, 12, 770916. [Google Scholar] [CrossRef] [PubMed]
- Han, J.; Shi, L.; Yang, Q.; Chen, Z.; Yu, J.; Zha, Y. Rice yield estimation using a CNN-based image-driven data assimilation framework. Field Crops Res. 2022, 288, 108693. [Google Scholar] [CrossRef]
- Zhou, Z.; Song, Z.; Fu, L.; Gao, F.; Li, R.; Cui, Y. Real-time kiwifruit detection in orchard using deep learning on Android™ smartphones for yield estimation. Comput. Electron. Agric. 2020, 179, 105856. [Google Scholar] [CrossRef]
- Xiong, J.; Liu, Z.; Chen, S.; Liu, B.; Zheng, Z.; Zhong, Z.; Yang, Z.; Peng, H. Visual detection of green mangoes by an unmanned aerial vehicle in orchards based on a deep learning method. Biosyst. Eng. 2020, 194, 261–272. [Google Scholar] [CrossRef]
- Santos, T.T.; de Souza, L.L.; dos Santos, A.A.; Avila, S. Grape detection, segmentation, and tracking using deep neural networks and three-dimensional association. Comput. Electron. Agric. 2020, 170, 105247. [Google Scholar] [CrossRef]
- Shen, L.; Su, J.; He, R.; Song, L.; Huang, R.; Fang, Y.; Song, Y.; Su, B. Real-time tracking and counting of grape clusters in the field based on channel pruning with YOLOv5s. Comput. Electron. Agric. 2023, 206, 107662. [Google Scholar] [CrossRef]
- Cecotti, H.; Rivera, A.; Farhadloo, M.; Pedroza, M.A. Grape detection with convolutional neural networks. Expert Syst. Appl. 2020, 159, 113588. [Google Scholar] [CrossRef]
- Palacios, F.; Melo-Pinto, P.; Diago, M.P.; Tardaguila, J. Deep learning and computer vision for assessing the number of actual berries in commercial vineyards. Biosyst. Eng. 2022, 218, 175–188. [Google Scholar] [CrossRef]
- Chen, S.; Song, Y.; Su, J.; Fang, Y.; Shen, L.; Mi, Z.; Su, B. Segmentation of field grape bunches via an improved pyramid scene parsing network. Int. J. Agric. Biol. Eng. 2021, 14, 185–194. [Google Scholar] [CrossRef]
- Olenskyj, A.G.; Sams, B.S.; Fei, Z.; Singh, V.; Raja, P.V.; Bornhorst, G.M.; Earles, J.M. End-to-end deep learning for directly estimating grape yield from ground-based imagery. Comput. Electron. Agric. 2022, 198, 107081. [Google Scholar] [CrossRef]
- Sozzi, M.; Cantalamessa, S.; Cogato, A.; Kayad, A.; Marinello, F. Automatic Bunch Detection in White Grape Varieties Using YOLOv3, YOLOv4, and YOLOv5 Deep Learning Algorithms. Agronomy 2022, 12, 319. [Google Scholar] [CrossRef]
- Palacios, F.; Bueno, G.; Salido, J.; Diago, M.P.; Hernández, I.; Tardaguila, J. Automated grapevine flower detection and quantification method based on computer vision and deep learning from on-the-go imaging using a mobile sensing platform under field conditions. Comput. Electron. Agric. 2020, 178, 105796. [Google Scholar] [CrossRef]
- Sun, L.; Hu, G.; Chen, C.; Cai, H.; Li, C.; Zhang, S.; Chen, J. Lightweight Apple Detection in Complex Orchards Using YOLOV5-PRE. Horticulturae 2022, 8, 1169. [Google Scholar] [CrossRef]
- Apolo-Apolo, O.E.; Pérez-Ruiz, M.; Martínez-Guanter, J.; Valente, J. A Cloud-Based Environment for Generating Yield Estimation Maps From Apple Orchards Using UAV Imagery and a Deep Learning Technique. Front. Plant Sci. 2020, 11, 1086. [Google Scholar] [CrossRef]
- Murad, N.Y.; Mahmood, T.; Forkan, A.R.M.; Morshed, A.; Jayaraman, P.P.; Siddiqui, M.S. Weed Detection Using Deep Learning: A Systematic Literature Review. Sensors 2023, 23, 3670. [Google Scholar] [CrossRef]
- Quan, L.; Li, H.; Li, H.; Jiang, W.; Lou, Z.; Chen, L. Two-Stream Dense Feature Fusion Network Based on RGB-D Data for the Real-Time Prediction of Weed Aboveground Fresh Weight in a Field Environment. Remote Sens. 2021, 13, 2288. [Google Scholar] [CrossRef]
- Moon, T.; Kim, D.; Kwon, S.; Ahn, T.I.; Son, J.E. Non-Destructive Monitoring of Crop Fresh Weight and Leaf Area with a Simple Formula and a Convolutional Neural Network. Sensors 2022, 22, 7728. [Google Scholar] [CrossRef] [PubMed]
- Lu, W.; Du, R.; Niu, P.; Xing, G.; Luo, H.; Deng, Y.; Shu, L. Soybean Yield Preharvest Prediction Based on Bean Pods and Leaves Image Recognition Using Deep Learning Neural Network Combined With GRNN. Front. Plant Sci. 2022, 12, 791256. [Google Scholar] [CrossRef] [PubMed]
- Riera, L.G.; Carroll, M.E.; Zhang, Z.; Shook, J.M.; Ghosal, S.; Gao, T.; Singh, A.; Bhattacharya, S.; Ganapathysubramanian, B.; Singh, A.K.; et al. Deep Multiview Image Fusion for Soybean Yield Estimation in Breeding Applications. Plant Phenomics 2021, 2021, 9846470. [Google Scholar] [CrossRef]
- Sandhu, K.; Patil, S.S.; Pumphrey, M.; Carter, A. Multitrait machine- and deep-learning models for genomic selection using spectral information in a wheat breeding program. Plant Genome 2021, 14, e20119. [Google Scholar] [CrossRef]
- Vinson Joshua, S.; Selwin Mich Priyadharson, A.; Kannadasan, R.; Ahmad Khan, A.; Lawanont, W.; Ahmed Khan, F.; Ur Rehman, A.; Junaid Ali, M. Crop Yield Prediction Using Machine Learning Approaches on a Wide Spectrum. Comput. Mater. Contin. 2022, 72, 5663–5679. [Google Scholar] [CrossRef]
- Wolanin, A.; Mateo-García, G.; Camps-Valls, G.; Gómez-Chova, L.; Meroni, M.; Duveiller, G.; Liangzhi, Y.; Guanter, L. Estimating and understanding crop yields with explainable deep learning in the Indian Wheat Belt. Environ. Res. Lett. 2020, 15, 024019. [Google Scholar] [CrossRef]
- Gong, L.; Yu, M.; Jiang, S.; Cutsuridis, V.; Pearson, S. Deep Learning Based Prediction on Greenhouse Crop Yield Combined TCN and RNN. Sensors 2021, 21, 4537. [Google Scholar] [CrossRef]
- de Oliveira, G.S.; Marcato Junior, J.; Polidoro, C.; Osco, L.P.; Siqueira, H.; Rodrigues, L.; Jank, L.; Barrios, S.; Valle, C.; Simeão, R.; et al. Convolutional Neural Networks to Estimate Dry Matter Yield in a Guineagrass Breeding Program Using UAV Remote Sensing. Sensors 2021, 21, 3971. [Google Scholar] [CrossRef]
- Meng, Y.; Xu, M.; Yoon, S.; Jeong, Y.; Park, D.S. Flexible and high quality plant growth prediction with limited data. Front. Plant Sci. 2022, 13, 989304. [Google Scholar] [CrossRef] [PubMed]
- Oikonomidis, A.; Catal, C.; Kassahun, A. Deep learning for crop yield prediction: A systematic literature review. N. Z. J. Crop Hortic. Sci. 2022, 51, 1–26. [Google Scholar] [CrossRef]


| Calculation Method | Implementation Method | Advantage | Disadvantages |
|---|---|---|---|
| Artificial field investigation | Manual statistical calculation by calculation tools | Low technical threshold, simple operation, and strong universality | Each step of the operation is cumbersome and prone to errors, and some crops are also subject to damage detection |
| Meteorological model | Analyze the correlation of meteorological factors and establish models using statistical, simulation, and other methods | Strong regularity and strong guiding significance for crop production | Needs a large amount of historical data to be accumulated, suitable for large-scale crops |
| Growth model | Digging a large amount of growth data to digitally describe the entire growth cycle of crops | Strong mechanism, high interpretability, and high accuracy | The growth models have numerous parameters, are difficult to obtain, are only suitable for specific varieties and regions, and have limited applications |
| Remote sensing calculation | Obtaining remote sensing data from multiple channels such as multispectral and hyperspectral data to establish regression models | Expressing internal and external characteristics of crops, which can reflect agronomic traits of crops | Applicable to specific regions, environments, and large-scale crops |
| Image detection | Implementing statistics and counting through target segmentation or detection | Low cost and high precision | A large number of sample images is required, and the occlusion problem is not easy to solve |
| Classification | Variety | Crop Characteristics | Yield-Calculation Indicators |
|---|---|---|---|
| Food crops | Corn | Important grain crop with strong adaptability, planted in many countries, and also an important source of feed | Number of plants, empty stem rate, number of grains per spike |
| Wheat | The world’s highest sowing area, yield, and distribution of food crops; high planting density and severe mutual obstruction | Number of ears, number of grains per ear, and thousand-grain weight | |
| Rice | One of the world’s most important food crops, accounting for over 40% of total global food production | Number of ears, number of grains per ear, seed setting rate, thousand-grain weight | |
| Economic crops | Cotton | One of the world’s important economic crops; an important industrial raw material for strategic supplies | Total number of cotton beads per unit area, number of cotton bolls per plant, and quality of seed cotton per boll |
| Soybean | One of the world’s important economic crops, widely used in food, feed, and industrial raw materials | Number of pods, number of seeds per plant, and weight of 100 seeds | |
| Potato | Potatoes are the world’s fourth largest food crop after wheat, corn, and rice | Tuber weight and fruiting rate | |
| Sugarcane | Important economic crops, grown globally; important sugar raw materials | Single stem weight and number of stems | |
| Sunflower | Important economic and oil crops | Kui disk size and number of seeds | |
| Tea | Important beverage raw materials | Number and density of tender leaves | |
| Apple | The third largest fruit crop in the world | Number of plants per mu, number of fruits per plant, and fruit weight | |
| Grape | Fruit consumption and brewing raw materials have high social and economic impacts | Grape bead count, ear count, and grain count | |
| Orange | The world’s largest category of fruits has become a leading industry in many countries | Number of plants per mu, number of fruits per plant, and fruit weight | |
| Tomato | One of the main vegetable varieties in the facility, and also an important raw material for seasoning sauces | Number of spikes per plant, number of fruits, and fruit weight | |
| Almond | Common food and traditional Chinese medicine raw materials | Number of plants per mu, number of fruits per plant, and fruit weight | |
| Kiwifruit | One of the most consumed fruits in the world, renowned as the “King of Fruits” and “World Treasure Fruit” | Number of plants per mu, number of fruits per plant, and fruit weight |
| Type | Title | Extraction Method or Description | Remarks |
|---|---|---|---|
| Vegetation index | Normalized Vegetation Index (NDVI) | (NIR − R)/(NIR + R) | Reflects the coverage and health status of plants |
| Red-edge chlorophyll vegetation index (ReCl) | (NIR/RED) − 1 | Displays the photosynthetic activity of the canopy | |
| Enhanced Vegetation Index (EVI2) | 2.5 × (NIR − R)/(NIR + 2.4 × R + 1) × (1 − ATB) | Accurately reflects the growth of vegetation | |
| Ratio Vegetation Index (RVI) | NIR/R | Sensitive indicator parameter of green plants, which can be used to estimate biomass | |
| Difference Vegetation Index (DVI) | NIR − R | Sensitive to soil background, beneficial for monitoring vegetation ecological environment | |
| Vertical Vegetation Index (PVI) | ((SR − VR)2 + (SNIR − VNIR)2)1/2 | S represents soil emissivity and V represents vegetation reflectance | |
| Transformed Vegetation Index (TVI) | (NDVI + 0.5)1/2 | Conversion of chlorophyll absorption | |
| Green Normalized Difference Vegetation Index (GNDVI) | (NIR − G)/(NIR + G) | Strong correlation with nitrogen | |
| Normalized Difference Red-Edge Index (NDRE) | (NIR − RE)/(NIR + RE) | RE represents the emissivity of the red-edge band | |
| Red–Green–Blue Vegetation Index (RGBVI) | (G − R)/(G + R) | Measuring vegetation and surface red-color characteristics | |
| Green Leaf Vegetation Index (GLI) | (2G − B − R)/(2G + B + R) | Measures the degree of surface-vegetation coverage | |
| Excess Green (ExG) | (2G − R − B) | Small-scale plant detection | |
| Super Green Reduced Red Vegetation Index (ExGR) | 2G − 2.4R | Small-scale plant detection | |
| Excess Red (ExR) | 1.4R − G | Soil background extraction | |
| Visible Light Atmospheric Impedance Vegetation Index (VARI) | (G − R)/(G + R − B) | Reduces the impacts of lighting differences and atmospheric effects | |
| Leaf Area Vegetation Index (LAI) | leaf area (m2)/ground area (m2) | The ratio of leaf area to the soil surface covered | |
| Atmospheric Resilience Vegetation Index (ARVI) | (NIR − (2 × R) + B)/(NIR + (2 × R) + B) | Used in areas with high atmospheric aerosol content | |
| Modified Soil Adjusted Vegetation Index (MSAVI) | (2 × NIR + 1 − sqrt((2 × NIR + 1)2 − 8 × (NIR-RED)))/2 | Reduce the impact of soil on crop-monitoring results | |
| Soil Adjusted Vegetation Index (SAVI) | (NIR − R) × (1 + L)/(NIR + R + L) | L is a parameter that varies with vegetation density | |
| Optimize Soil Adjusted Vegetation Index (OSAVI) | (NIR − R)/(NIR + R + 0.16) | Uses reflectance from NIR and red spectra | |
| Normalized Difference Water Index (NDWI) | (BG − BNIR)/(BG + BNIR) | Research on vegetation moisture or soil moisture | |
| Conditional Vegetation Index (VCI) | The ratio of the current NDVI to the maximum and minimum NDVI values during the same periods of time over the years | Reflects the growth status of vegetation within the same physiological period | |
| Biophysical parameters | Leaf Area Index (LAI) | Total leaf area/land area | The total leaf area of plants per unit land area is closely related to crop transpiration, soil water balance, and canopy photosynthesis |
| Photosynthetically active radiation component (FPAR) | Proportion of absorbable photosynthetically active radiation in photosynthetically active radiation (PAR) | Important biophysical parameter commonly used to estimate vegetation biomass | |
| Growth environment parameters | Conditional Temperature Index (TCI) | The ratio of the current surface temperature to the maximum and minimum surface temperature values over the same periods of time over the years | Reflecting surface temperature conditions, widely used in drought inversion and monitoring |
| Conditional Vegetation Temperature Index (VTCI) | The ratio of LST differences between all pixels with NDVI values equal to a specific value in a certain research area | Quantitatively characterizing crop water stress information | |
| Temperature Vegetation Drought Index (TVDI) | Inversion of surface soil moisture in vegetation-covered areas | Analyzing spatial changes in drought severity | |
| Vertical Drought Index (PDI) | The normal soil baseline perpendicular to the coordinate origin in the two-dimensional scatter space of near-infrared and red reflectance | The spatial distribution characteristic commonly used for soil moisture |
| Crop Varieties | Literature | Year | Task | Network Framework and Algorithms | Result |
|---|---|---|---|---|---|
| Corn | [47] | 2021 | Predict the yield of corn | CNN | AP: 75.5% |
| [48] | 2021 | Predict the yield of corn | tab-DNN and sp-DNN | R2: 0.73 | |
| [49] | 2023 | Predict the yield of corn | LR, KNN, RF, SVR, DNN | R2: 0.84 | |
| [50] | 2022 | Estimate biomass of corn | DCNN, MLR, RF, SVM | R2: 0.94 | |
| [39] | 2020 | Predict the yield of corn | RF | R2: 0.78 | |
| Rice | [51] | 2023 | Predict the yield of rice | CNN | RMSPE: 14% |
| [52] | 2022 | Predict the yield of rice | 3D-CNN, 2D-CNN | RMSE: 8.8% | |
| Wheat | [53] | 2022 | Predict the yield of wheat | GPR | R2: 0.88 |
| [38] | 2023 | Predict the yield of wheat | Ensemble learning algorithms of ML | R2: 0.692 | |
| [61] | 2022 | Predict the yield of wheat | Ensemble learning algorithms of ML | R2: 0.78 | |
| [54] | 2022 | Estimate biomass AGB of wheat | GOA-XGB | R2: 0.855 | |
| [62] | 2022 | Estimate yield of wheat | RF | R2: 0.86 | |
| [55] | 2021 | Calculate the yield and protein content of wheat | SVR, RF, and ANN | R2: 0.62 | |
| [59] | 2021 | Estimate biomass of wheat | LSSVM | R2: 0.87 | |
| [57] | 2022 | Estimate biomass of wheat | RF | R2: 0.97 | |
| [58] | 2021 | Calculate the yield of wheat | ANN | R2: 0.88 | |
| [64] | 2023 | Predict the yield of wheat | MultimodalNet | R2: 0.7411 | |
| [60] | 2023 | Predict the yield of wheat | CNN | RMSE: 0.94 t ha−1 | |
| [56] | 2022 | Estimate biomass of oats | PLS, SVM, ANN, RF | r: 0.65 | |
| [63] | 2020 | Calculate the yield of barley | GPR | R2: 0.84 | |
| Beans | [65] | 2020 | Predict the yield of soybean | DNN-F2 | R2: 0.72 |
| [66] | 2021 | Predict the yield of soybean | CNN | R2: 0.78 | |
| [37] | 2021 | Predict the yield of soybean | DL and ML | r: 0.44 | |
| [67] | 2021 | Predict yield and biomass | DNN-SPEA2 | R2: 0.77 | |
| [68] | 2021 | Predict the yield of soybean seed | RF | AP: 93% | |
| [69] | 2022 | Predict AGB and LAI | SVM | R2: 0.811 | |
| [70] | 2022 | Estimate plant height and yield of broad beans | SVM | R2: 0.7238 | |
| [40] | 2023 | Predict biomass and yield of broad beans | Ensemble learning algorithms of ML | R2: 0.854 | |
| Potato | [71] | 2022 | Estimate biomass of potatoes | SVM, RF, GPR | R2: 0.76 |
| [72] | 2020 | Predict the yield of potato tuber | ridge regression | R2: 0.63 | |
| Cotton | [45] | 2021 | Predict the yield of cotton | BP neural network | R2: 0.854 |
| Sugarcane | [73] | 2022 | Predict component yields of sugarcane | GBRT | AP: 94% |
| [74] | 2022 | Predict characteristic parameters of sugarcane | RF | R2: 0.7 | |
| Spring tea | [44] | 2023 | Predict fresh yield of spring tea | PLMSVs | R2: 0.625 |
| Alfalfa | [75] | 2020 | Predict yield | Ensemble learning algorithms of ML | R2: 0.854 |
| Meadow | [76] | 2022 | Predict the yield of the meadow | CBR | R2: 0.87 |
| Ryegrass | [77] | 2021 | Predict the yield of ryegrass | PLSR, RF, SVM | RMSE: 13.1% |
| Red clover | [78] | 2021 | Estimate the yield of red clover | ANN | R2: 0.90 |
| Tomato | [79] | 2021 | Predict biomass and yield of tomato | RF, RI, SVM | rMSE: 8.8% |
| Grape | [80] | 2020 | Estimate the yield of the vineyard | ANN | RE: 21.8% |
| Apple | [81] | 2022 | Predict the yield of apple tree | SVR, KNN | R2: 0.813 |
| Almond | [82] | 2020 | Estimate yield of almond | Improved CNN | R2: 0.96 |
| Crop Varieties | Literature | Year | Task | Network Framework and Algorithms | Result |
|---|---|---|---|---|---|
| Wheat | [83] | 2022 | Predict the yield of wheat | RF, KNN, BR | R2: 0.91 |
| [84] | 2020 | Predict the yield of wheat | SVM | R2: 0.77 | |
| [85] | 2022 | Predict the yield of wheat | SVR | R2: 0.87 | |
| Rice | [35] | 2022 | Predict the yield of rice | SVM, RF, ANN | MAPE: 3.5% |
| Coffee tree | [86] | 2022 | Predict the yield of coffee tree | NN | R2: 0.82 |
| Rubber | [87] | 2023 | Predict the yield of rubber | LR | R2: 0.80 |
| Cotton | [88] | 2020 | Predict the yield of cotton | RF | LCCC: 0.65 |
| Corn | [15] | 2023 | Predict the yield of corn | Ensemble learning algorithms of ML | R2: 0.42 |
| Foodstuff | [89] | 2023 | Predict the yield of a foodstuff | LSTM | R2: 0.989 |
| Crop Varieties | Literature | Year | Task | Network Framework and Algorithms | Result |
|---|---|---|---|---|---|
| Kiwifruit | [93] | 2021 | Count fruit quantity | SVM | R2: 0.96 |
| [94] | 2022 | Calculate the leaf area index of kiwifruit | RFR | R2: 0.972 | |
| Corn | [95] | 2020 | Predict the yield of corn | BP, SVM, RF, ELM | R2: 0.570 |
| [96] | 2020 | Estimate yield of corn | Regression Analysis | MAPE: 15.1% | |
| Apple | [97] | 2023 | Count apple fruit | Raspberry | AP: 97.22% |
| Toona sinensis | [98] | 2021 | Predict aboveground biomass | MLR | R2: 0.83 |
| Cotton | [99] | 2022 | Estimate the yield of cotton | SVM | R2: 0.93 |
| Crop Varieties | Literature | Year | Task | Network Framework and Algorithms | Result |
|---|---|---|---|---|---|
| Corn | [107] | 2022 | Detect and count corn plants | YOLOv4, YOLOv5 series | mAP: 73.1% |
| [108] | 2020 | Detect and count corn ears | Faster R-CNN | AP: 94.99% | |
| [109] | 2020 | Detect and count corn ears | VGG16 | mAP: 97.02% | |
| Wheat | [110] | 2022 | Detect and count wheat ears | SlypNet | mAP: 99% |
| [111] | 2020 | Predict wheat yield | 3D-CNN | R2: 0.962 | |
| [112] | 2022 | Detect and count wheat ears | DCNN | R2: 0.84 | |
| [113] | 2022 | Rapidly detect wheat spikes | YOLOX-m | AP: 88.03% | |
| [114] | 2022 | Detect and count wheat ears | YOLOv5s | AP: 71.61% | |
| [115] | 2022 | Detect and count wheat ears | YOLOv4 | R2: 0.973 | |
| Sorghum | [116] | 2020 | Detect and count sorghum spikes | U-Net | AP: 95.5% |
| Rice | [117] | 2021 | Calculate Rice Seed Setting Rate (RSSR) | YOLOv4 | mAP: 99.43% |
| [118] | 2022 | Estimate rice yield | CNN | R2: 0.646 | |
| Kiwifruit | [119] | 2020 | Count fruit quantity | MobileNetV2, InceptionV3 | TDR: 89.7% |
| Mango | [120] | 2020 | Detect and count mangos | YOLOv2 | error rate: 1.1% |
| Grape | [121] | 2020 | Detect and count grape strings | Mask R-CNN, YOLOv3 | F1 score: 0.91 |
| [122] | 2023 | Detect and count grape strings | YOLO v5s | mAP: 82.3% | |
| [123] | 2020 | Detect grapes | Resnet | mAP: 99% | |
| [124] | 2022 | Detect and count grape-berry quantity | SegNet, SVR | R2: 0.83 | |
| [125] | 2021 | Segment grape skewers | PSPNet | PA: 95.73% | |
| [126] | 2022 | Detect and count grape strings | Object detection, CNN, Transformer | MAPE: 18% | |
| [127] | 2022 | Detect and count grape strings | YOLO | MAPE: 13.3% | |
| [128] | 2020 | Detect and count grapevine flowers | SegNet | R2: 0.70 | |
| Apple | [129] | 2022 | Detect and count apples | YOLOv5-PRE | mAP: 94.03% |
| [130] | 2020 | Detect and count apples | Faster R-CNN | R2: 0.86 | |
| Weed | [132] | 2021 | Estimate aboveground fresh weight of weeds | YOLO-V4 | mAP: 75.34% |
| Capsicum | [133] | 2022 | Estimate fresh weight and leaf area | ConvNet | R2: 0.95 |
| Soybean | [134] | 2022 | Predict soybean yield | YOLOv3, GRNN | mAP: 97.43% |
| [135] | 2021 | Count soybean pods | RetinaNet | mAP: 0.71 |
| Image Types | Obtaining Methods | Image Preprocessing | Extracting Indicators | Main Advantages | Main Disadvantages | Representative Algorithms |
|---|---|---|---|---|---|---|
| Remote sensing images | Low-altitude drone: equipped with multispectral cameras, visible light cameras, thermal imaging cameras, and hyperspectral cameras | Size correction; multi-channel image fusion; projection conversion; resampling; | Surface reflectance; multispectral vegetation index; biophysical parameters; growth environment parameters; | Multi-channel image containing time, space, temperature, and band information; multi-channel fusion; rich information | The spatiotemporal and band attributes are difficult to fully utilize, and the shooting distance is far, making it suitable for predicting the yield of large-scale land parcels with low accuracy; easily affected by weather; | ML, ANN, CNN-LSTM, and 3DCNN |
| Satellite | low spatial and temporal resolution, long cycle time, and pixel mixing | |||||
| Visible light images | Digital camera | Size adjustment; rotation; cropping; gaussian blur; color enhancement; brightening; noise reduction, etc.; annotation; dataset partitioning; | Color index; texture index; morphological index; | Easy to obtain images at a low cost | Only three bands of red, green, and blue that have limited information content | Linear regression, ML, |
| YOLO, Resnet, SSD, Mask R-CNN |
Disclaimer/Publisher’s Note: The statements, opinions and data contained in all publications are solely those of the individual author(s) and contributor(s) and not of MDPI and/or the editor(s). MDPI and/or the editor(s) disclaim responsibility for any injury to people or property resulting from any ideas, methods, instructions or products referred to in the content. |
© 2024 by the authors. Licensee MDPI, Basel, Switzerland. This article is an open access article distributed under the terms and conditions of the Creative Commons Attribution (CC BY) license (https://creativecommons.org/licenses/by/4.0/).
Share and Cite
Yu, F.; Wang, M.; Xiao, J.; Zhang, Q.; Zhang, J.; Liu, X.; Ping, Y.; Luan, R. Advancements in Utilizing Image-Analysis Technology for Crop-Yield Estimation. Remote Sens. 2024, 16, 1003. https://doi.org/10.3390/rs16061003
Yu F, Wang M, Xiao J, Zhang Q, Zhang J, Liu X, Ping Y, Luan R. Advancements in Utilizing Image-Analysis Technology for Crop-Yield Estimation. Remote Sensing. 2024; 16(6):1003. https://doi.org/10.3390/rs16061003
Chicago/Turabian StyleYu, Feng, Ming Wang, Jun Xiao, Qian Zhang, Jinmeng Zhang, Xin Liu, Yang Ping, and Rupeng Luan. 2024. "Advancements in Utilizing Image-Analysis Technology for Crop-Yield Estimation" Remote Sensing 16, no. 6: 1003. https://doi.org/10.3390/rs16061003
APA StyleYu, F., Wang, M., Xiao, J., Zhang, Q., Zhang, J., Liu, X., Ping, Y., & Luan, R. (2024). Advancements in Utilizing Image-Analysis Technology for Crop-Yield Estimation. Remote Sensing, 16(6), 1003. https://doi.org/10.3390/rs16061003