Article

Early Identification of River Blockage Disasters Caused by Debris Flows in the Bailong River Basin, China

1
College of Urban Environment, Lanzhou City University, Lanzhou 730070, China
2
State Key Laboratory of Eco-Hydraulics in Northwest Arid Region of China, Xi’an University of Technology, Xi’an 710048, China
3
School of Earth Sciences, Lanzhou University, Lanzhou 730000, China
4
College of Earth and Environmental Sciences, Lanzhou University, Lanzhou 730000, China
5
Geological Environment Monitoring Institute of Gansu Province, Lanzhou 730050, China
6
Gansu Technology & Innovation Center for Environmental Geology and Geohazards Prevention, Lanzhou 730000, China
7
Gansu Geohazards Field Observation and Research Station, Lanzhou 730000, China
*
Author to whom correspondence should be addressed.
Remote Sens. 2024, 16(7), 1302; https://doi.org/10.3390/rs16071302
Submission received: 25 February 2024 / Revised: 22 March 2024 / Accepted: 5 April 2024 / Published: 7 April 2024

Abstract

:
The Bailong River Basin is one of the most developed regions for debris flow disasters worldwide, often causing severe secondary disasters by blocking rivers. Therefore, the early identification of potential debris flow disasters that may block the river in this region is of great significance for disaster risk prevention and reduction. However, it is quite challenging to identify potential debris flow disasters that may block rivers at a regional scale, as conducting numerical simulations for each debris flow catchment would require significant time and financial resources. The purpose of this article is to use public resource data and machine learning methods to establish a relationship model between debris flow-induced river blockage and key influencing factors, thereby economically predicting potential areas at risk for debris flow-induced river blockage disasters. Based on the field investigation, data collection, and remote sensing interpretation, this study selected 12 parameters, including the basin area, basin height difference, relief ratio, circularity ratio, landslide density, fault density, lithology index, annual average frequency of daily rainfall exceeding 40 mm, river width, river discharge, river gradient, and confluence angle, as critical factors to determine whether debris flows will cause river blockages. A relationship model between debris flow-induced river blockage and influencing factors was constructed based on machine learning algorithms. Several machine learning algorithms were compared, and the XGB model performed the best, with a prediction accuracy of 0.881 and an area under the ROC curve of 0.926. This study found that the river width is the determining factor for debris flow blocking rivers, followed by the annual average frequency of daily rainfall exceeding 40 mm, basin height difference, circularity ratio, basin area, and river discharge. The early identification method proposed in this study for river blockage disasters caused by debris flows can provide a reference for the quantitative assessment and pre-disaster prevention of debris flow-induced river blockage chain risks in similar high-mountain gorge areas.

1. Introduction

Sediment transport is the primary driving force behind the morphological and landscape evolution of river channels. It has significant impacts on the chemical and biological processes of rivers, as well as human activities, with debris flow processes being particularly severe [1]. Debris flows are one of the common geological hazards in mountainous areas, attracting extensive attention due to their destructive nature [2,3,4,5,6]. Once debris flows block rivers, they can cause severe secondary disasters. Therefore, the risk prediction of debris flow-induced river blockage disasters in the region is of great significance for debris flow risk prevention and reduction [7,8]. The Bailong River Basin is one of the regions in the world with the most severe debris flow disasters [9,10,11]. River blockages caused by debris flows often occur in this area during heavy rainfall, resulting in serious loss of life and property.
For example, on 8 August 2010, the Sanyanyu catchment (Figure 1a) and Luojiayu catchment in Zhouqu County experienced a debris flow that blocked the river. This event, which occurs once every 200 years, resulted in 1765 deaths and direct economic losses of about CNY 3.3 billion [12]. On 7 August 2017, Wenxian was hit by an extreme rainstorm. The Yangtang catchment (Figure 1b) experienced a large-scale debris flow that occurs once every 80 years. It caused five deaths and destroyed the Liping Village at the mouth of the catchment. The Longba River was blocked, forming a barrier lake that submerged roads and a large area of farmland. The direct economic loss exceeded CNY 30 million. On 17 August 2020, the Shuimo catchment in Wenxian County (Figure 1c) experienced a debris flow that occurs once every hundred years, which blocked the Baishui River, a tributary of the Bailong River, forming a barrier lake that was 300 m wide and 800 m long. This event caused significant loss of life and property. The increase in loose materials after the May 12th earthquake in Wenchuan County greatly amplified the scale of debris flows and the risk of river blockage caused by debris flows [13,14,15]. Therefore, the early identification of debris flow-induced river blockage disasters should be given a high level of attention.
Several studies have been conducted on the risk assessment of debris flow-induced river blockages. Ref. [16] analyzed the formation, collapse, background, and key factors of debris flow dams. They conducted 19 groups of flume experiments to establish critical indicators of dam formation. Ref. [17] assessed the probability of river blockages caused by debris flows after the Wenchuan earthquake. They used equations for the total mudslide volume and maximum flow rate per unit width to obtain damming parameters. Ref. [18] proposed a backward calculation method and numerical simulation for mitigation planning for the Xiaojia catchment based on predictions of river blockages. Ref. [19] used the FLO-2D model to simulate the formation, movement, deposition, and degree of river blockages caused by debris flows in Guangyuanbao under different rainfall frequencies. Ref. [20] developed an evaluation method for assessing debris flow dam formation. This method includes two conditions: the sediment transported by debris flow must reach the opposite bank of the river, and the thickness of debris flow deposits must be higher than the in situ river depth. Ref. [21] proposed an early identification method for river blockages caused by debris flows based on a dimensionless volume index. They considered the relationship between the volume of sediment deposition from tributary mudslides and the minimum damming volume and introduced the dimensionless volume index to evaluate dam formation. Ref. [8] analyzed the impact of climate change on regional river blockages caused by debris flows, focusing on the Palong Zangbo basin. They established a regional damming assessment model and system for river blocking disasters. Ref. [22] conducted experimental research on the use of flow-blocking walls at the confluence of tributaries and main rivers to mitigate debris flow disasters. Ref. [7] conducted experimental studies on the blockage of rivers by viscous debris flows and investigated the relationship between the degree of blockage and key parameters such as the confluence angle, dimensionless volume, unit flow rate ratio, and dimensionless yield stress.
From the above, it can be seen that the risk assessment of debris flow blockage disasters mainly includes a critical index/condition method, a numerical back-calculation method, a numerical simulation method, a quantitative assessment method, etc. There are many factors that affect river blockages caused by debris flows, including the confluence angle of the debris flow, the discharge of the main river and the debris flow, the total volume of debris flow, the width of the main river, the gradient of the main river, and the yield stress of the debris flow [7,20,21,22], among which the confluence angle is considered an important factor [16,21,23].
However, it is quite challenging to identify potential debris flow disasters that may block rivers at a regional scale, as conducting numerical simulations for each debris flow catchment would require significant time and financial resources. The purpose of this article is to use public resource data and scientific modeling methods to establish a relationship model between debris flow-induced river blockage and key influencing factors, thereby economically predicting potential risk areas for debris flow-induced river blockage disasters and providing a reference for the risk prevention and reduction in chain disasters caused by debris flow-induced river blockages in the region. Specifically, the densely populated Bailong River Basin, known for its frequent occurrence of debris flows, was selected as the research area. Historical records of debris flow-induced river blockage disasters in the region were investigated, and the key influencing factors affecting river blockages were identified. Based on machine learning algorithms, a probability prediction model for debris flow-induced river blockages was constructed, enabling the early identification and spatial prediction of regional debris flow-induced river blockage disasters. This research provides a reference for the risk prevention and reduction in chain disasters caused by debris flow-induced river blockages in the region.

2. Data and Methods

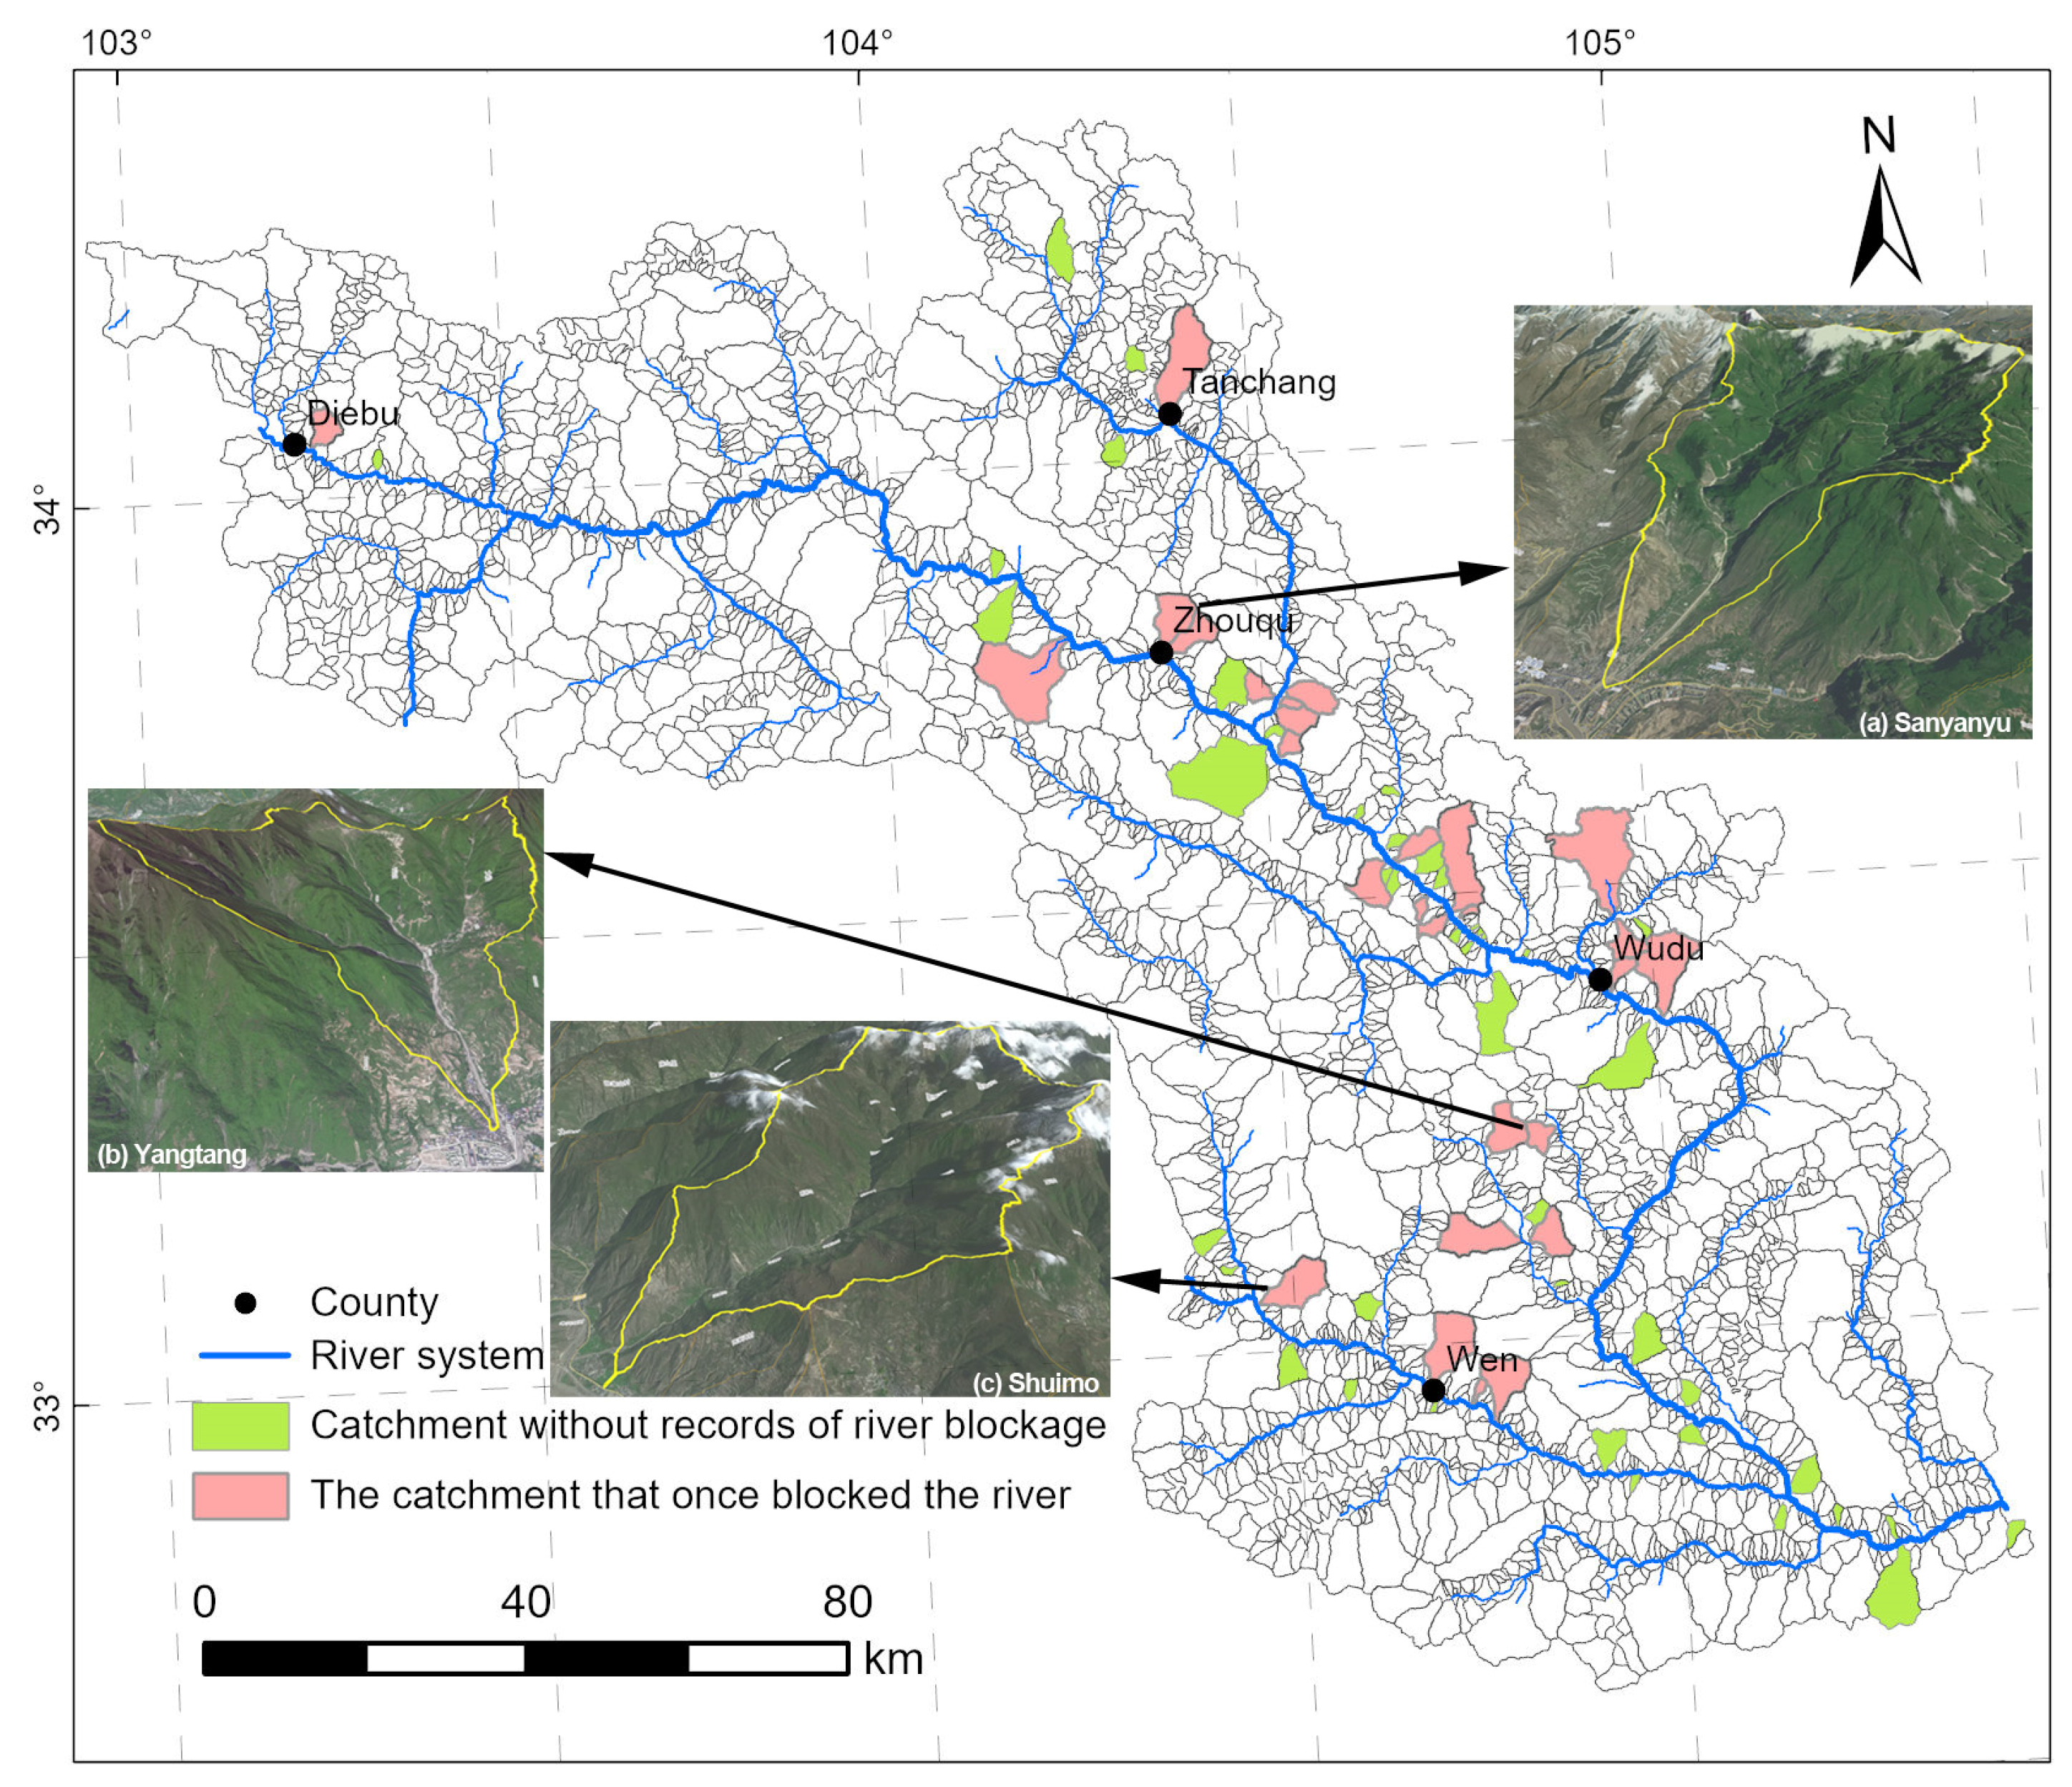
2.1. Inventory of River Blocking Disasters

The Bailong River Basin is located in a rapidly deformed zone transitioning from the Qinghai–Tibet Plateau to the Loess Plateau. It is characterized by large elevation differences, active neotectonics, widespread weak rock strata, concentrated rainfall, and rainstorm, making it one of the areas that are the most severely affected by debris flow disasters in China [24]. The lowest elevation in the area is 406 m, the highest elevation is 4457 m, and the maximum elevation difference of the river basin is 4051 m. The annual average precipitation is 500–900 mm, mainly concentrated from June to September. According to the data from the Geological Environmental Monitoring Institute of Gansu Province, there are currently over 800 catchments with significant debris flow activity in the region. The frequency of debris flow occurrences varies from once every 50 years or more to over 10 times per year. Through data collection, remote sensing image interpretation, and field investigations, the basic characteristics of debris flow occurrences in the Bailong River Basin over the past 60 years have been compiled. A total of 28 debris flow catchments with historical river blockage disasters and 45 debris flow catchments without river blockage disasters have been identified in the study area (Figure 1). Specifically, we conducted field investigations and interviews with residents at the mouths of the debris flow channels to determine whether blockage events have occurred. We also cross-referenced this information with historical records and historical remote sensing images. These points are mainly distributed along the main stem of the Bailong River and its secondary tributaries, with the highest concentration of points occurring in the middle reaches of the main stem of the Bailong River.

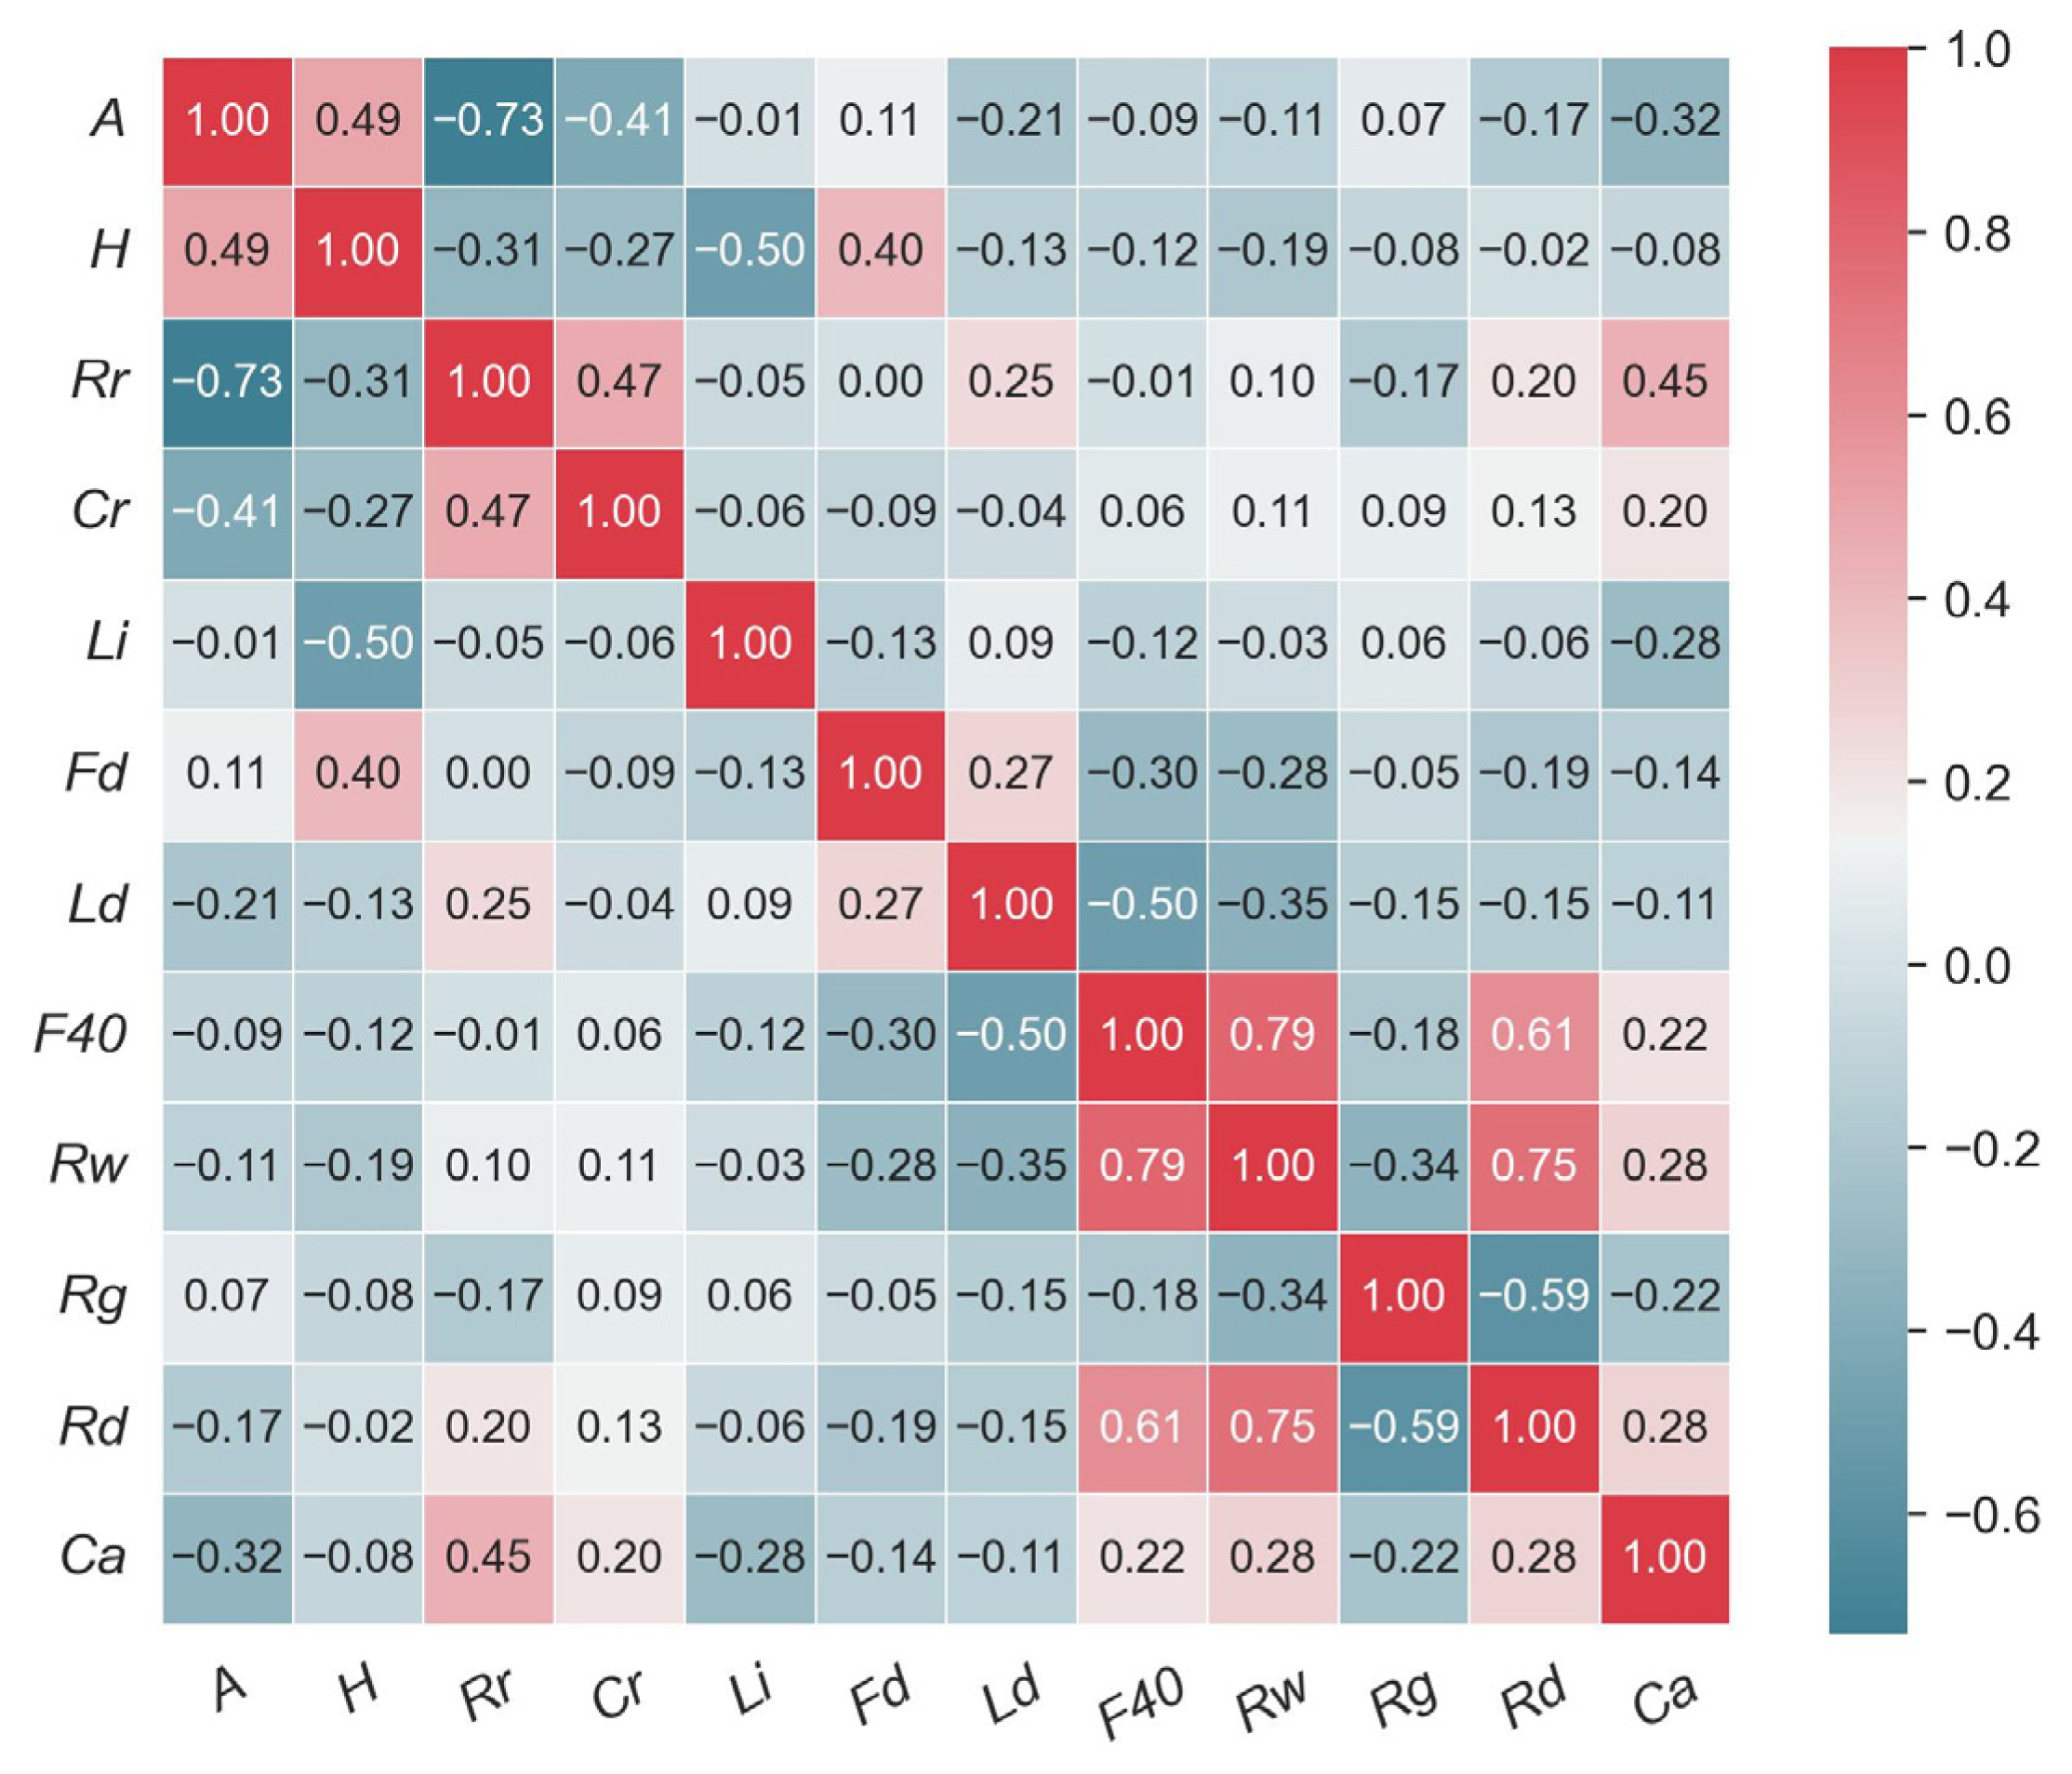
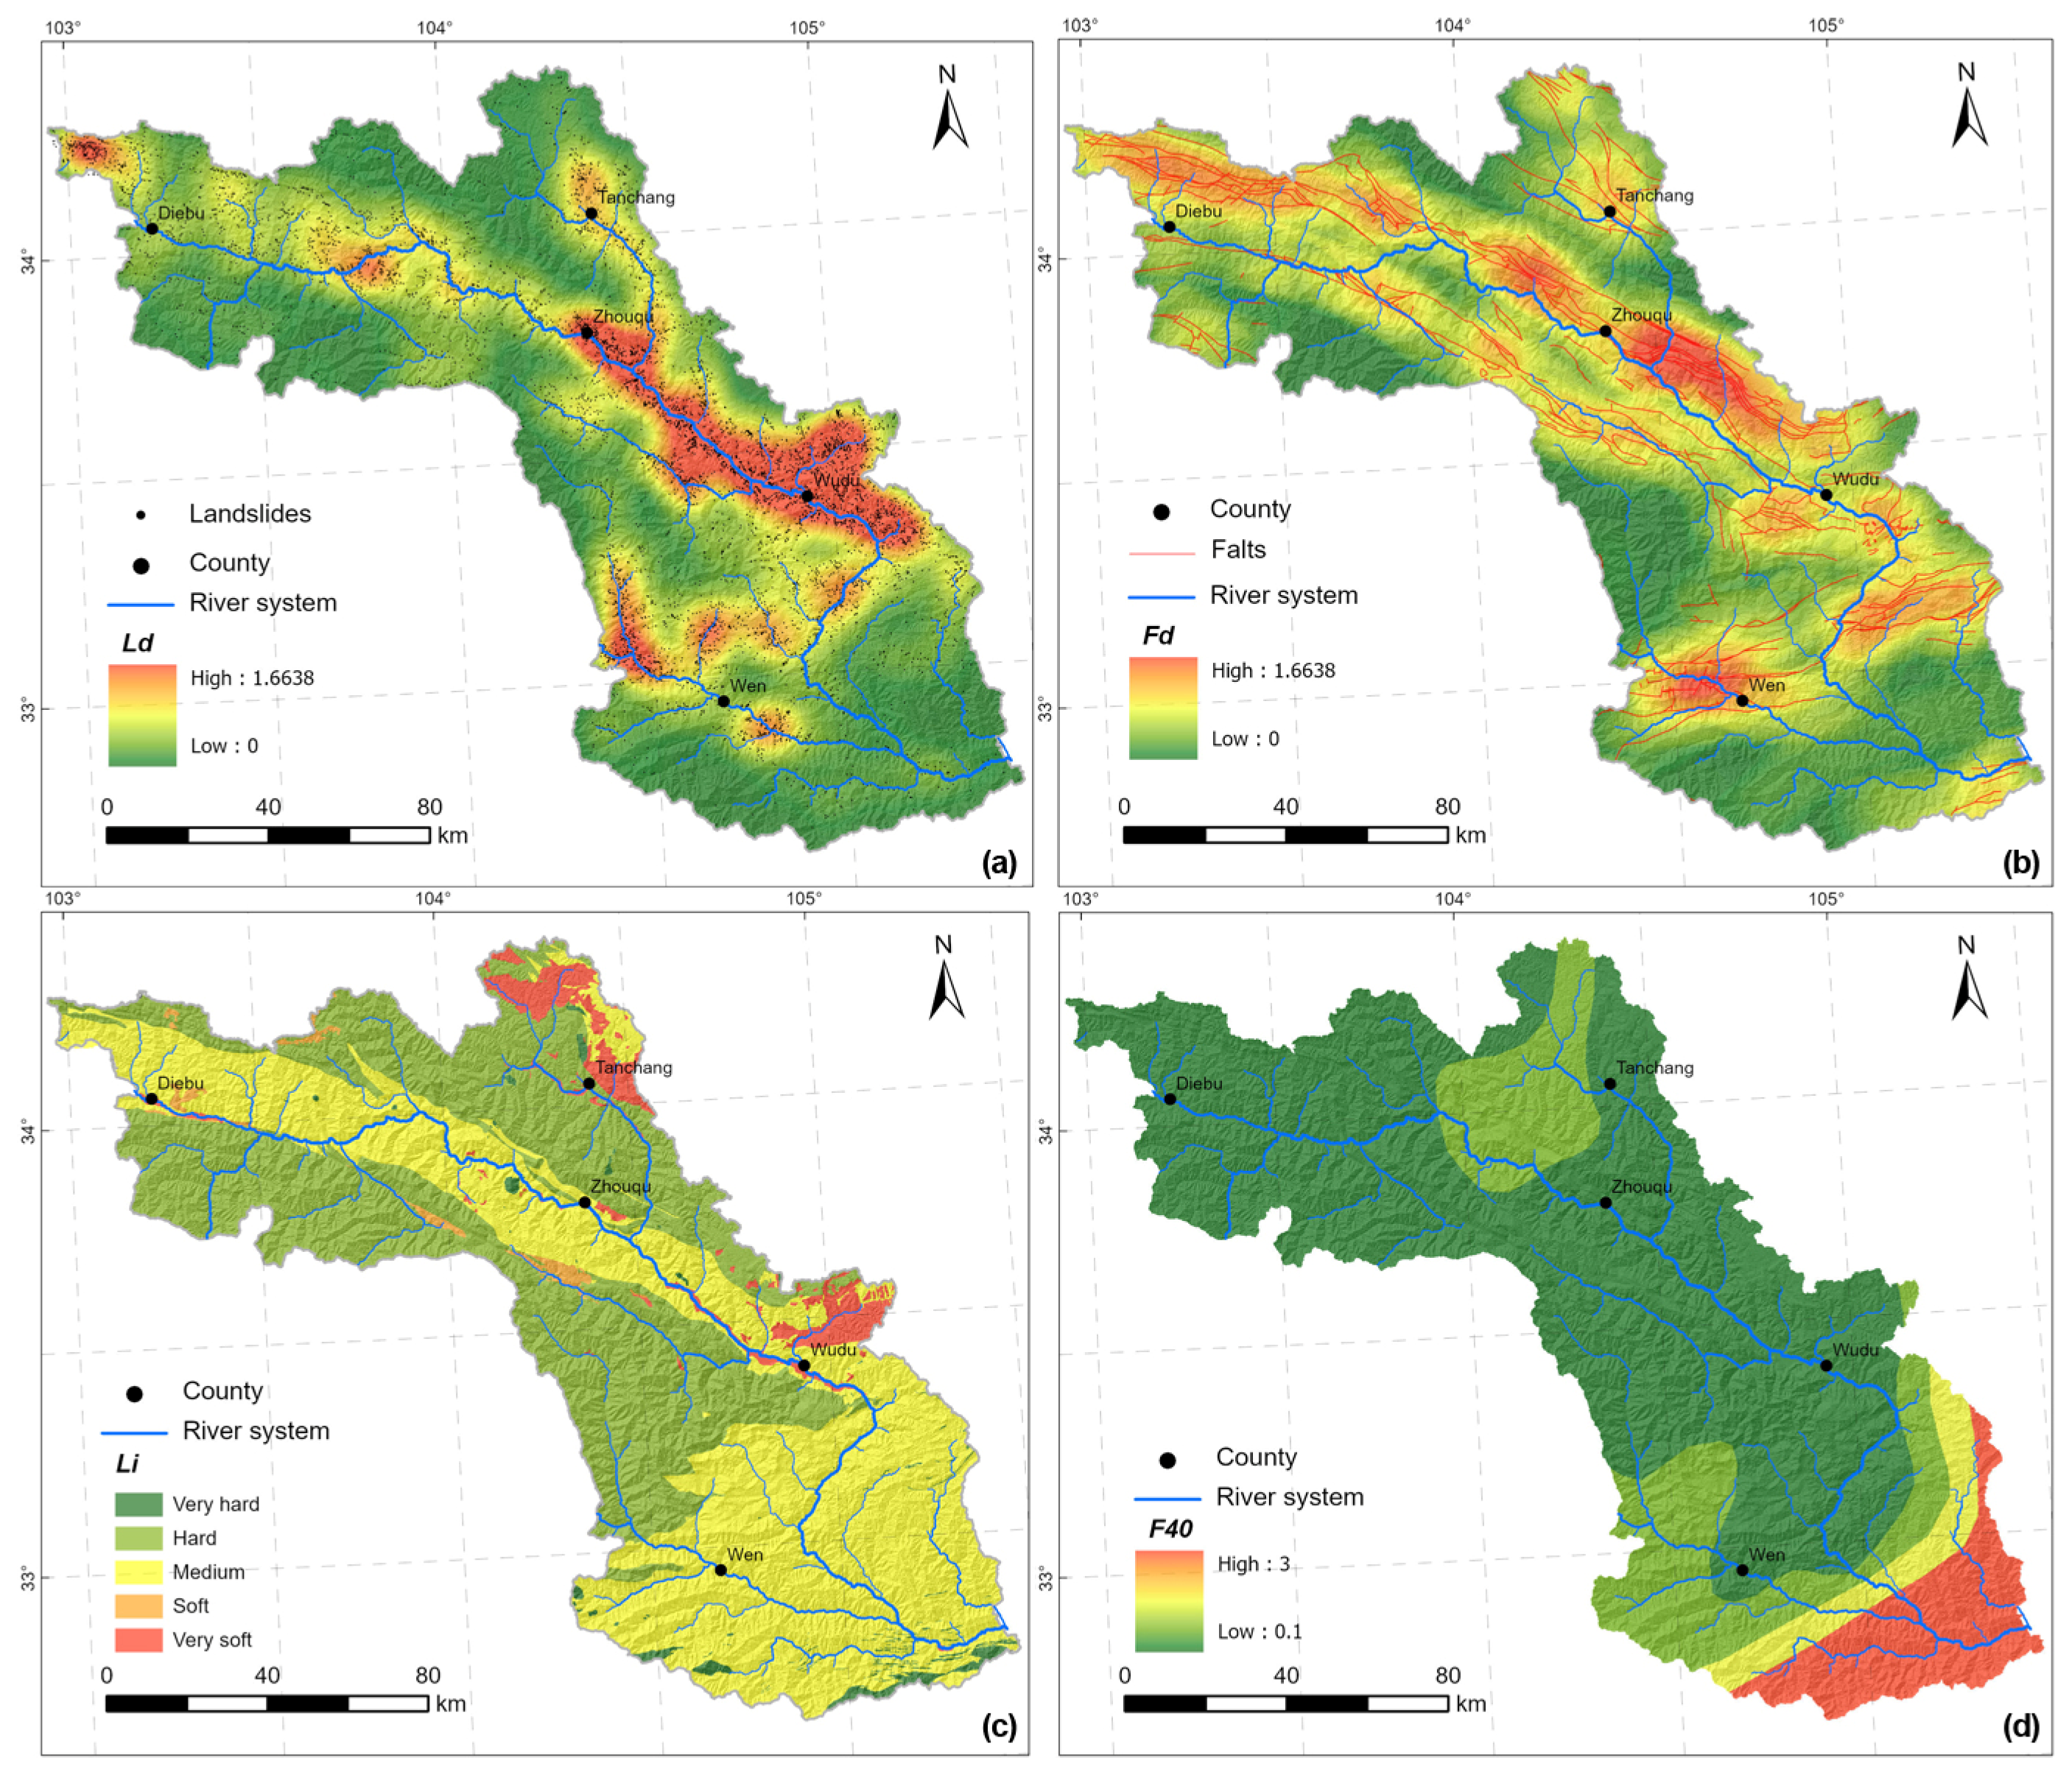
2.2. Impact Factors of Debris Flow-Induced River Blockages

The factors influencing debris flow-induced river blockage in this study are divided into two categories: characteristics of the debris flow catchments and characteristics of the rivers. A total of 12 factors were selected (Table 1). Specifically, 8 parameters were chosen as the characteristics of the debris flow catchments, and their selection criteria are detailed below.
Basin area (A): A larger basin area of a debris flow catchment typically means there are more soil and rocks available for the debris flow to transport. Therefore, during a debris flow event, there may be a greater input of sediment into the river channel, thereby increasing the likelihood of river blockage.
Basin height difference (H) and channel relief ratio (Rr, the ratio of basin relief to basin length): These reflect the potential energy conditions of debris flows [25,26,27], thereby affecting the dynamic conditions of debris flows. A steep terrain and large relief make debris flows more likely to occur and increase the probability of river blockage. The slope of the debris flow channel is one of the important factors that determine the flow velocity and erosive power of the debris flow. This parameter was selected with the aim of assessing the erosive capacity of debris flows.
Circularity ratio (Cr): This reflects the roundness of a catchment and its ability to concentrate water by analyzing the relationship between the basin area and perimeter [28,29,30,31].
Landslide density (Ld, Figure 2a): This reflects the material supply for debris flows, thereby influencing the scale of debris flows. When a landslide occurs, a large amount of soil and rocks may collapse [32,33], forming landslide dams that block the channel. If a debris flow occurs at this time, it can result in dam-break effects, amplifying the scale of the debris flow and increasing the likelihood of river blockage.
Fault density (Fd, Figure 2b): Fault zones are often associated with the formation of mountainous terrain, where the geological strata can become unstable and prone to landslides and debris flows. When earthquakes or other geological activities trigger fault movements, a large amount of loose material may collapse into the debris flow channel, increasing the risk of river blockage. The lithological and fault data are sourced from the 1:100,000 public version geological map.
Lithology index (Li): Lithology affects the sediment supply capacity of debris flows, which, in turn, influences the scale of debris flows. Certain rocks, such as siltstone and mudstone, have strong erodibility. These rocks are prone to disintegration and dissolution during debris flow events, resulting in the formation of a large amount of fine-grained material. This increases the mobility of the debris flow and the risk of river blockage. Additionally, some rocks, like shale and sandstone, are susceptible to erosion and fragmentation. During a debris flow process, these rocks may rapidly undergo erosion and collapse, releasing a significant amount of sediment, thereby increasing the sediment yield of the debris flow and the probability of river blockage. In this study, rock types have been classified into five categories ranging from hard to soft: extremely hard (including granite, diorite, granodiorite, quartz diorite, and gabbro), hard (including slate, gneiss, marble, limestone, quartzite, and schist), medium (including mudstone, sandstone, sandy mudstone, muddy sandstone, and clastic occasionally interbedded with siltstone), soft (including limestone, phyllite, and shale), and extremely soft (including alluvial deposits, lacustrine sediments, marine sediments, fluvial sediments, and glacial sediments). They are assigned a value from 1 to 5 to form a 30 m × 30 m grid dataset of rock types. The average value of all grids within each catchment is calculated as the lithology index (Li) to represent the rock characteristics of each catchment (Figure 2c).
Annual average frequency of daily rainfall exceeding 40 mm (F40): Intense rainfall events are one of the main factors leading to river blockage by debris flow. This study selects the annual average frequency of daily rainfall exceeding 40 mm (F40) (Figure 2d) to reflect the rainfall erosive conditions in the region. The 40 mm value is selected here because the larger values of annual precipitation frequency do not vary significantly across the entire study area, which does not provide sufficient rainfall information for modeling. Rainfall data are sourced from the rainfall records from 41 meteorological stations in the study area for the 2003–2013 period.
The river characteristic factors include four parameters: river width (Rw), river discharge (Rd), river gradient (Rg), and confluence angle (Ca). Generally, a wider river valley, larger river discharge, smaller confluence angle, and steeper channel slope make a river less susceptible to river blockage disasters [7,21]. The river width, river gradient, and confluence angle are derived from regional digital elevation models (DEMs) and a visual interpretation of remote sensing images. River discharge data are obtained from hydrological monitoring points provided by local soil and water conservation departments.

2.3. Modeling Methods

2.3.1. Machine Learning Algorithms

The aim of this study is to construct a binary classification machine learning model to quantitatively analyze the relationship between influencing factors and the occurrence of debris flow-induced river blockage disasters. In recent years, numerous machine learning algorithms have been developed and applied in various research fields. This study selects five machine learning models, namely Logistic Regression, Random Forest, Extra Tree, Gradient Boosting, and XGBoost, for a comparative analysis and chooses the optimal model. The model selection includes popular ensemble learning methods as well as traditional learning algorithms.
Logistic Regression: Logistic Regression is a supervised learning model used to handle binary classification problems. It establishes a probabilistic relationship between input features and output labels using a logistic function, allowing for class labels and their probabilities to be predicted.
Random Forest: Random Forest is an ensemble learning algorithm that combines multiple decision trees through model averaging for classification or regression predictions. It improves model stability and generalization by introducing randomness and feature sampling.
Extra Tree: Extra Tree, or Extremely Randomized Trees, is another ensemble learning algorithm similar to Random Forest, but with more random splits at each node during tree construction. By further randomizing the splitting process, Extra Tree aims to reduce overfitting and achieve higher computational efficiency. It is suitable for large-scale datasets and high-dimensional feature problems.
Gradient Boosting: Gradient Boosting is an ensemble learning algorithm that trains weak learners iteratively and combines them into a strong learner for predictions. Through gradient descent, each weak learner tries to minimize the residuals of the previous learner on the training set.
XGBoost: XGBoost, short for Extreme Gradient Boosting, is an efficient Gradient Boosting algorithm that is particularly useful for large-scale datasets and high-dimensional feature problems. It combines Gradient Boosting with regularization techniques and employs strategies like parallel computing and cache optimization, achieving high prediction performance.

2.3.2. Data Processing

To reveal the degree of correlation between different features and identify the presence of redundant features, a cross-correlation heatmap of the factors was computed (Figure 3). It is evident from the heatmap that the parameters exhibit good variability, indicating their distinctiveness.
The ratio of debris flow-blocking rivers and non-blocking rivers in the collected sample data in this study is 28:45, indicating that the number of negative samples is greater than that of positive samples. This data imbalance can lead to an imbalance in the training process, where the model tends to learn more about the negative samples, affecting the stability of the model [34]. In this study, the SMOTE (Synthetic Minority Oversampling Technique) resampling technique is used to generate synthetic positive samples in order to increase the number of positive samples. The main idea of SMOTE is to create new synthetic samples by interpolating between minority class samples [35].

2.3.3. Model Validation and Feature Importance
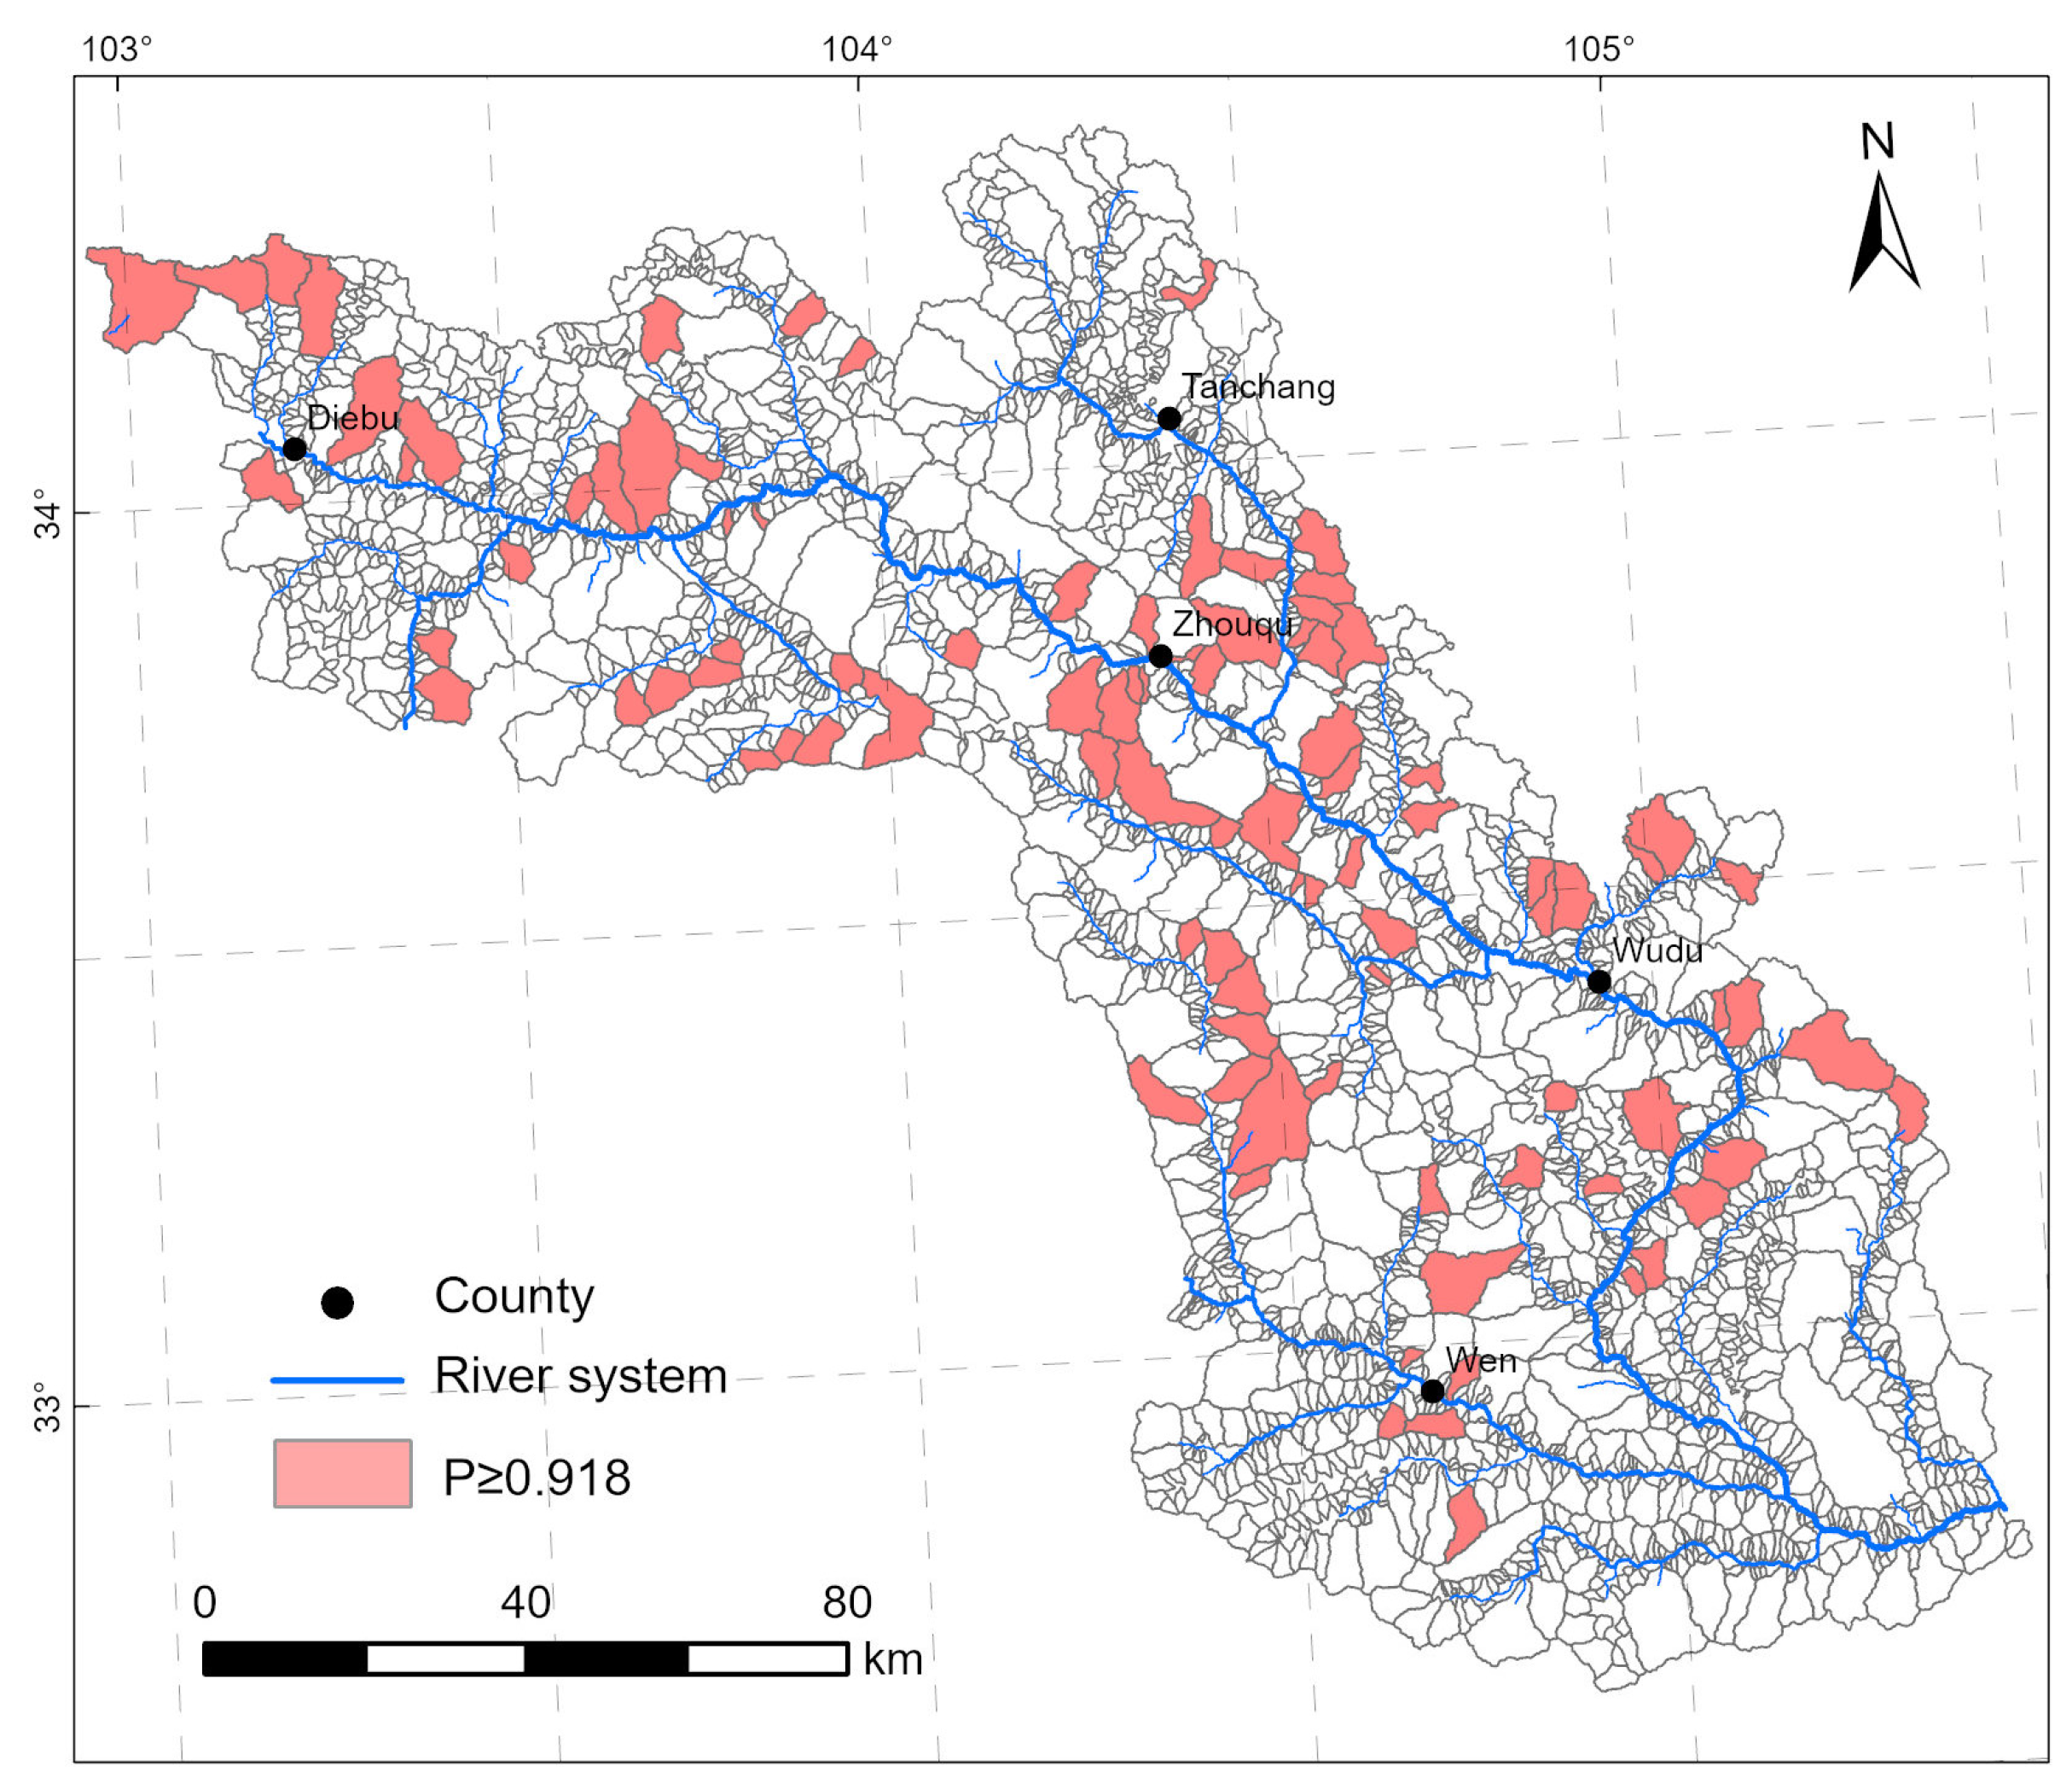
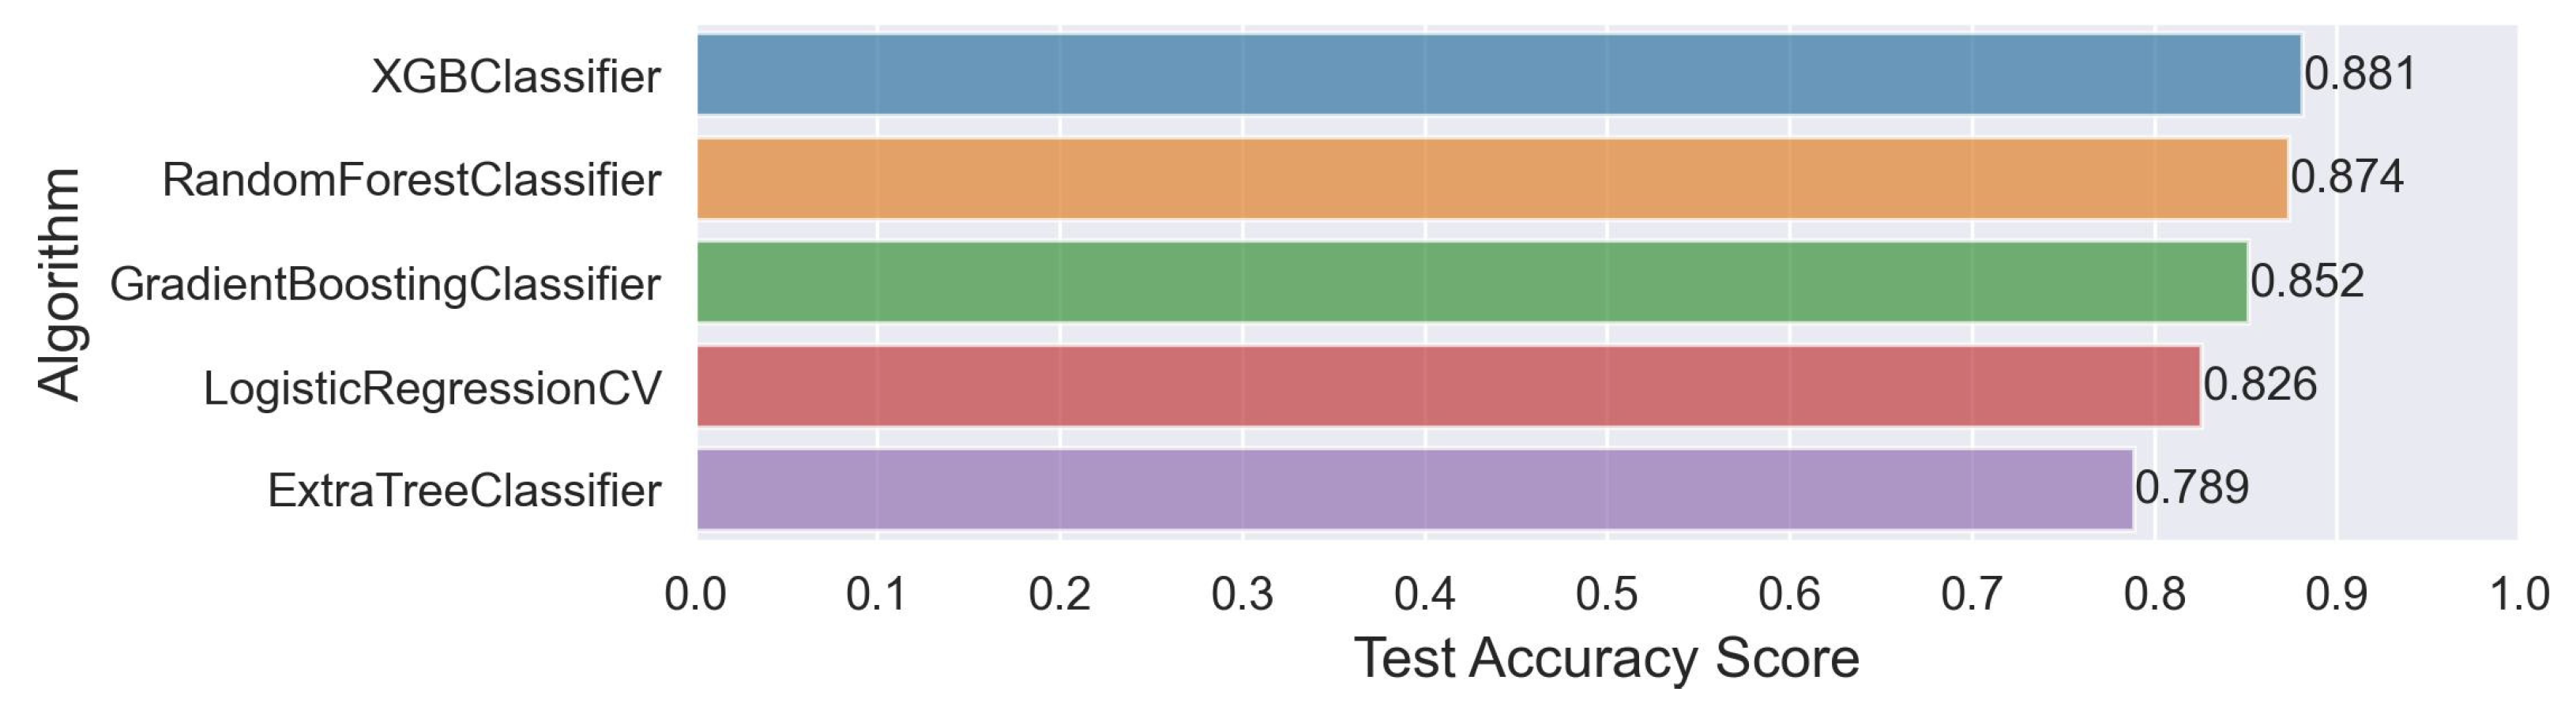
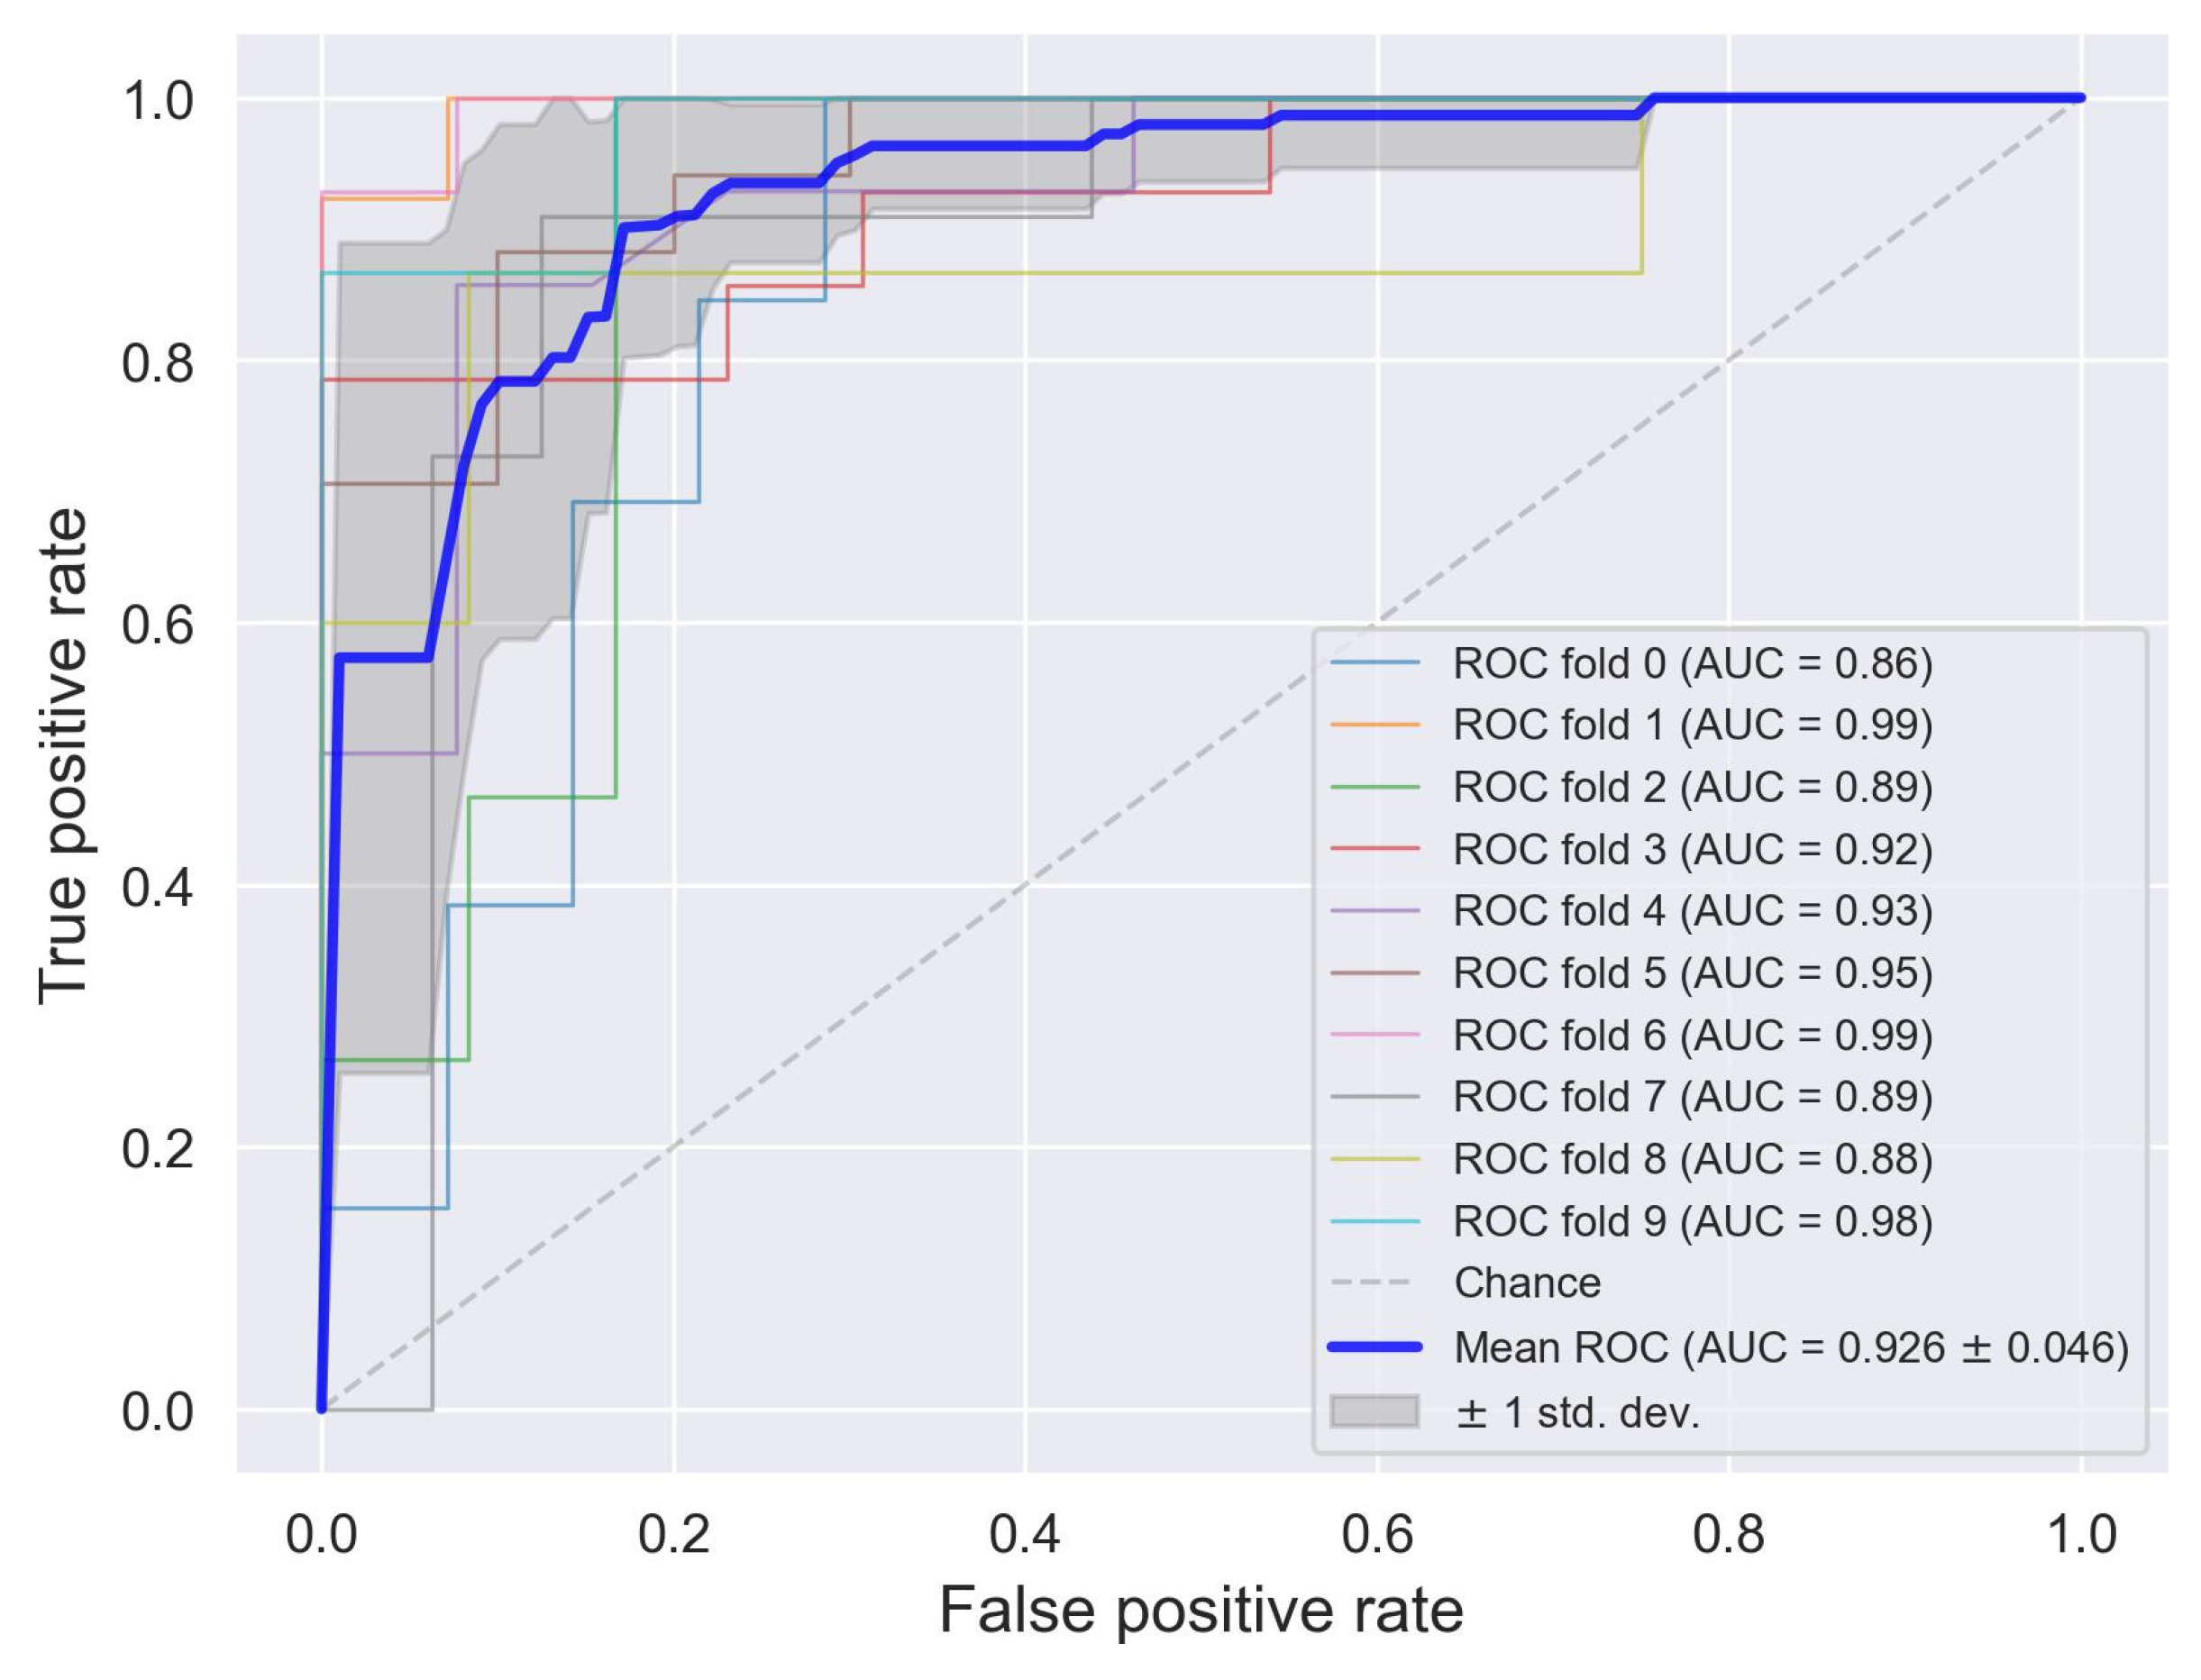
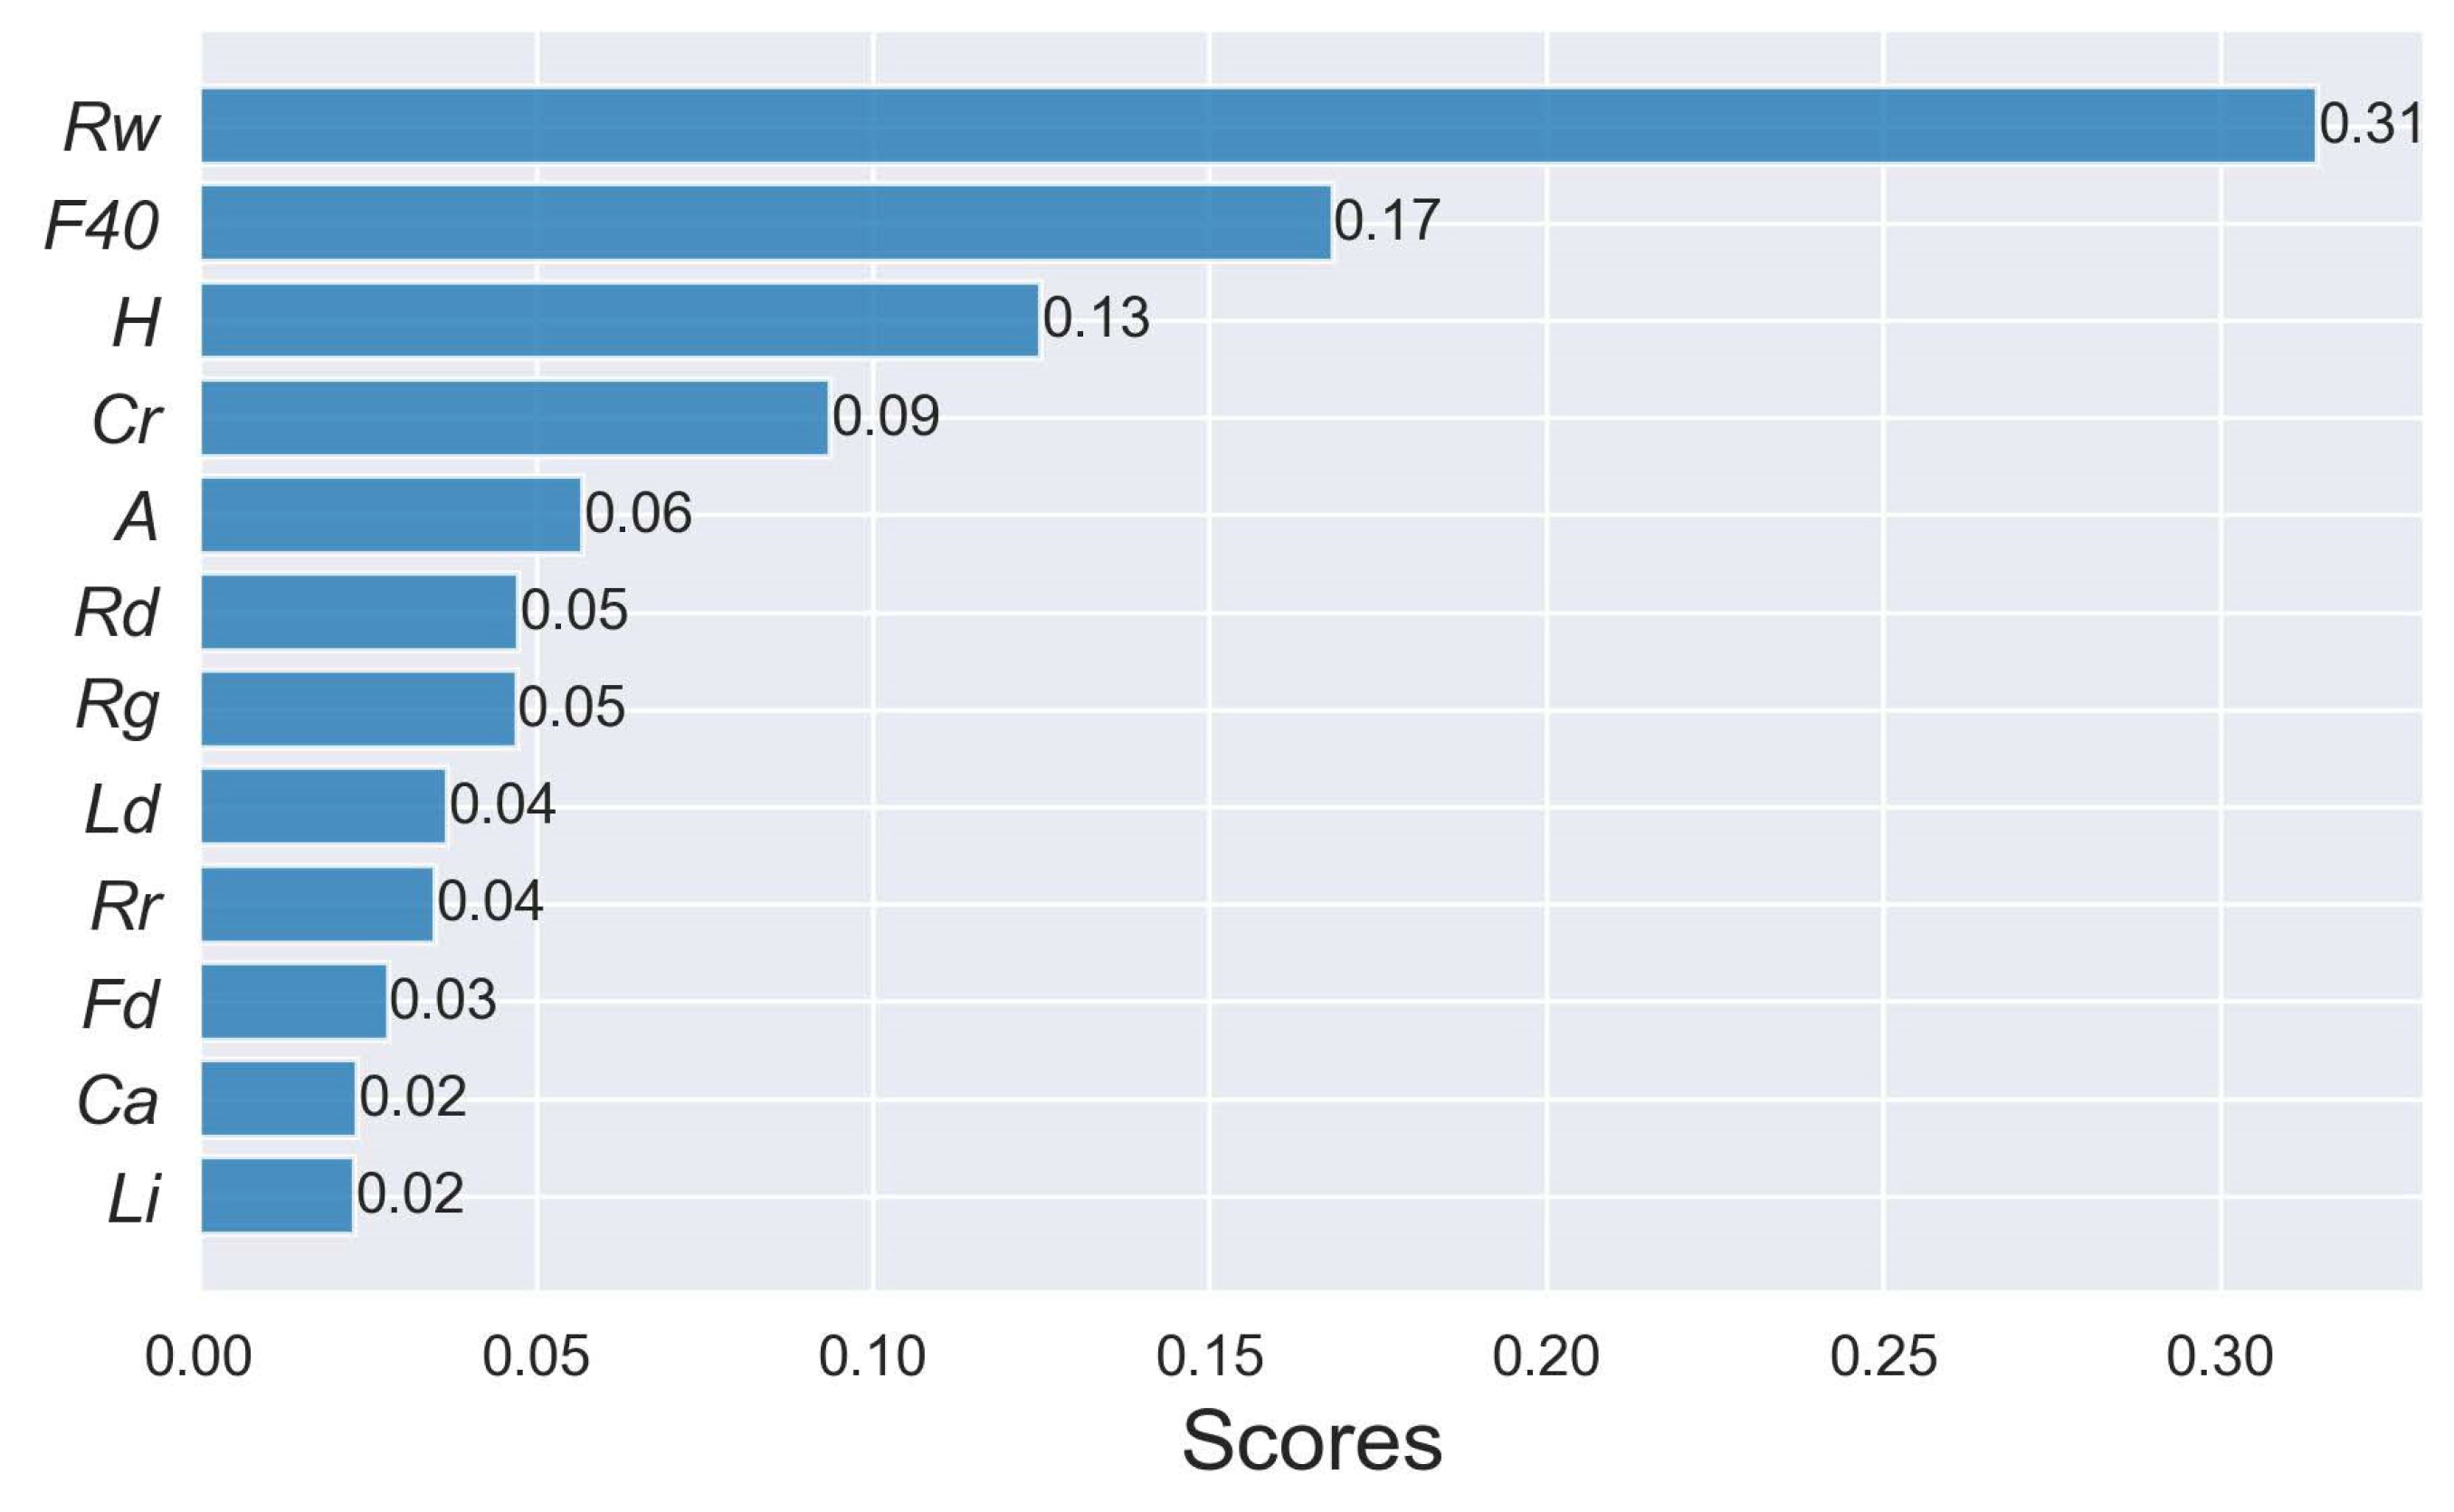
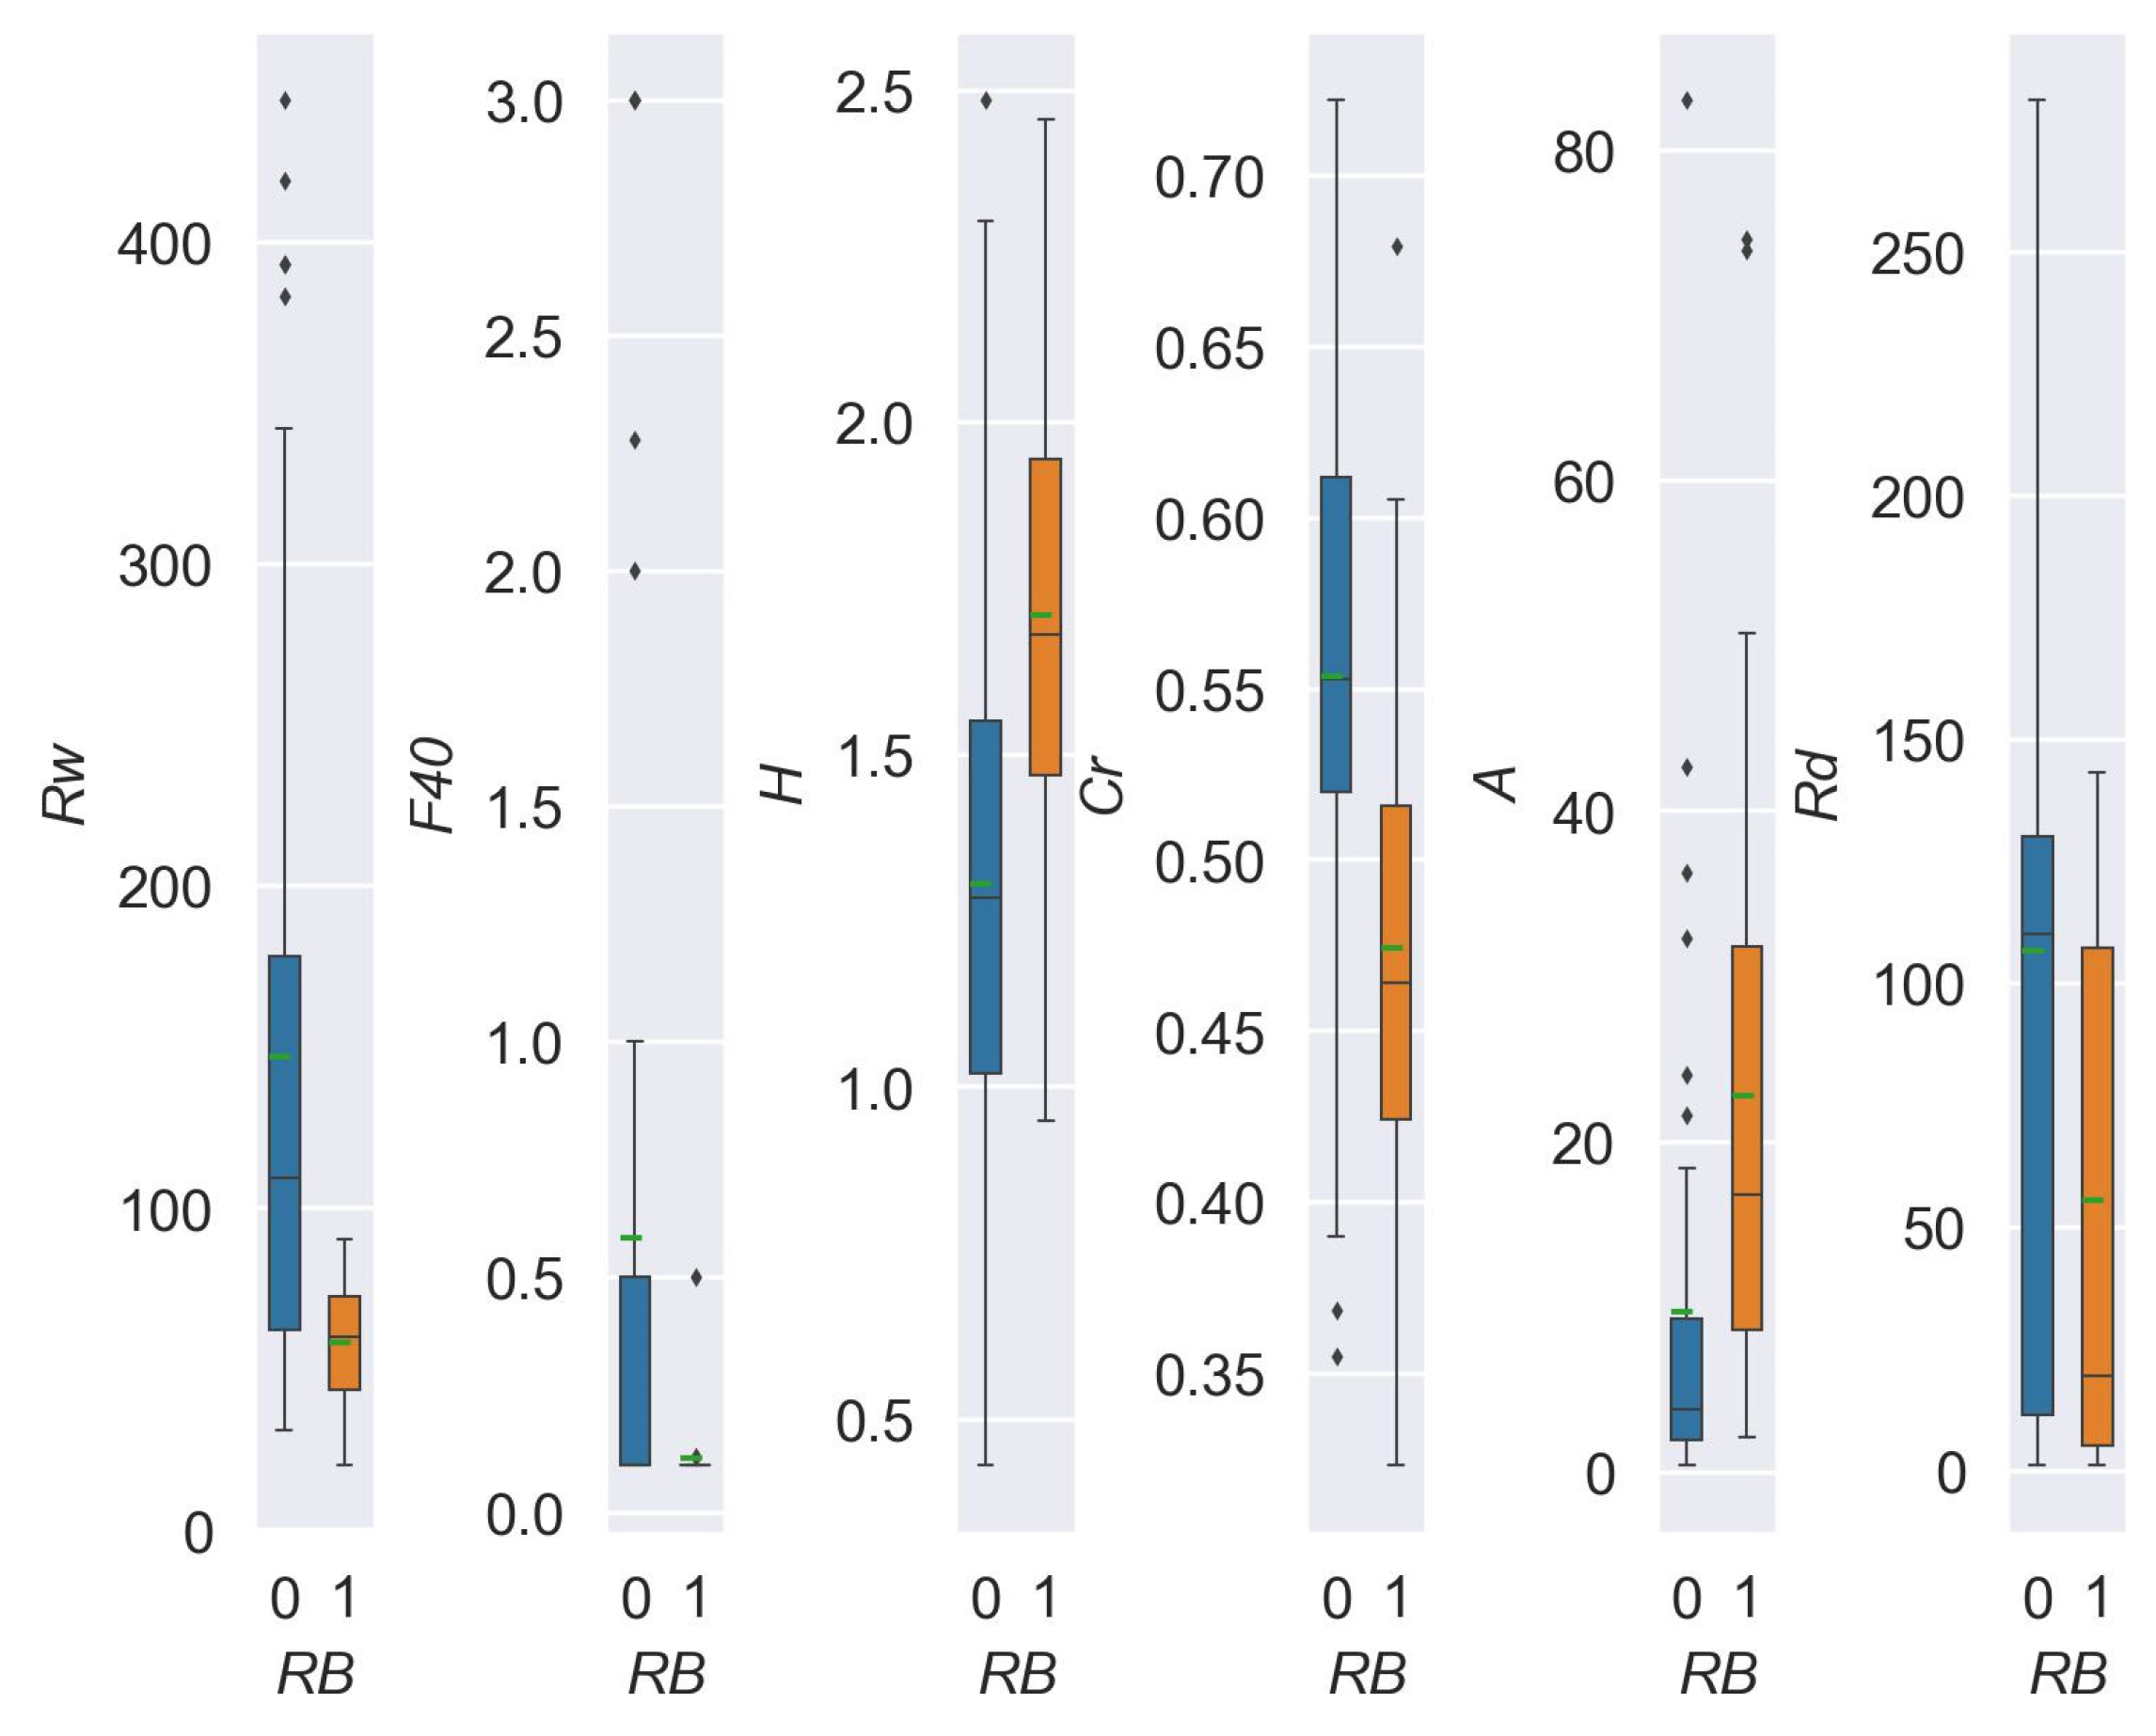
Using the cross-validation algorithm in Scikit-learn, 70% of the data are randomly selected as the training set for model training, while the remaining 30% are used as the validation set to evaluate the model. This process is repeated 10 times. By using different subsets of training data to build the model and evaluating the model’s performance using the testing data, this algorithm prevents the overfitting of the model [36].
The feature importance method based on mean impurity reduction is used to calculate the importance of each factor. The importance of a feature is determined by the total impurity reduction brought by that feature [37].

3. Results

The 12 influencing factors were used as independent variables, and the occurrence of blockade in the rivers was used as the dependent variable. These variables were input into machine learning algorithms for training, resulting in the construction of a multi-factor model for predicting the risk of debris flow-induced river blockage. After model evaluation, the prediction accuracy of the validation set samples for each model was determined and is shown in Figure 4. It can be observed that the XGB model performs the best, with an average prediction accuracy of 0.881 on the validation set samples. The average area under the ROC curve (AUC) is 0.926 (Figure 5), indicating the model’s good performance.
Using the constructed XGB model, the probability values (P) of debris flows causing river blockage in the study area were predicted. Based on the prediction results, the probability values of 28 known instances of river blockage caused by debris flows ranged from 0.918 to 0.995. Therefore, debris flow catchments with probability values greater than 0.918 were classified as having a higher risk of causing river blockage. Based on this criterion, a total of 80 potential hazardous points of debris flow-induced river blockage were identified, as shown in Figure 6.
The distribution characteristics of these identified potential river blockage points cannot be intuitively inferred from Figure 6. Therefore, a feature importance analysis is needed to reveal the importance of different influencing factors in predicting river blockage hazard points. To analyze the importance of different factors in the blockage caused by debris flows, the importance of different factors in predicting blockage was quantitatively evaluated through feature importance algorithms (Figure 7). It is revealed that the river width (Rw) is the most important factor in debris flow-induced river blockage. The next important factors include the annual average frequency of daily rainfall exceeding 40 mm (F40), basin height difference (H), circularity ratio (Cr), basin area (A), and river discharge (Rd).
To better understand the relationship between the key influencing factors and river blockage hazard points, box plots for six parameters were calculated and are presented in Figure 8.
The river width ranks first, indicating that it is a determining factor for debris flow-induced river blockage. Narrow river valleys significantly increase the likelihood of debris flow blockage. The second key factor is the annual average frequency of daily rainfall exceeding 40 mm. The frequency of debris flow occurrence is determined by the coupling of material supply conditions and rainfall conditions [38,39]. The overall frequency of daily rainfall exceeding 40 mm for non-blockage debris flow catchments is higher than that for blockage debris flow catchments. This may be due to the lower rate of material accumulation in regions with high-frequency rainfall, resulting in a smaller debris flow scale. Through field investigations, it was found that debris flow catchments with blockage histories have a lower frequency of occurrence, while those without blockage history have a higher frequency of occurrence but on a smaller scale. Therefore, high-intensity precipitation events and sediment accumulation within the watershed significantly influence the frequency and scale of debris flows [1].
The third key factor is the basin height difference, which reflects the potential energy conditions of debris flows. Favorable potential energy conditions allow for greater dynamic in debris flows, increasing their scale and the possibility of river blockage.
The circularity ratio of non-blockage debris flow catchments is generally larger than that of blockage debris flow catchments. This can be seen in the three-dimensional watershed screenshots of the Sanyanyu, Yangtang, and Shuimo catchments shown in Figure 1. Blockage debris flow catchments typically have longer main channels. On one hand, this allows for the accumulation of water from tributaries, resulting in a higher flow rate in the main channel. On the other hand, it enables the initiation of more loose material through the main channel, gradually increasing the speed and enhancing the size and momentum of the debris flow. Such watershed morphology contributes to a relatively low circularity ratio. Therefore, a higher basin circularity ratio may reduce the potential risk of debris flow-induced river blockage, as the larger hydraulic conditions required for blockage necessitate a longer main channel in the basin.
The basin area determines the scale of the debris flow, so a larger basin area increases the possibility of debris flow-induced river blockage. As for the river discharge parameters, the overall river discharge of non-blockage debris flow catchments is slightly higher than that of blockage debris flow catchments. When the river discharge is larger, debris flows are less likely to accumulate and stabilize, reducing the likelihood of river blockage.

4. Discussion

This study constructed a relationship model between influencing factors and debris flow-induced blockage disasters using machine learning algorithms. The methods and steps strictly followed the analysis methods of data science, and the accuracy and performance of the model were validated.
The strength of this study lies in its use of machine learning algorithms to construct a relationship model between the possibility of debris flow-induced river blockage and the key influencing factors. This allows for the rapid and effective early identification of debris flow-induced river blockage hazards within a regional scope, providing support for risk prevention and reduction efforts. However, this approach may not fully consider the specific dynamic processes of debris flow-induced river blockage. Further investigations and detailed numerical simulations of the dynamic processes of debris flows are needed to accurately assess the potential risk areas of river blockage identified through early identification in this study. Therefore, the regional debris flow-blocking river prediction method provided in this article can be combined with the physically based single gully debris flow hazard prediction method so that they can mutually benefit from each other at different spatial scales [40].

5. Conclusions

This study focuses on the densely populated Bailong River Basin, which is prone to debris flows, and explores the relationship between debris flow-induced river blockage and influencing factors using machine learning algorithms. A probability prediction model for debris flow-induced river blockage was constructed, and the model evaluation revealed that the XGB model effectively captured the relationship between debris flow-induced river blockage and influencing factors. A total of 80 potential sites for debris flow-induced river blockage hazards were identified in the region through early identification.
This study found that the river width is the decisive factor for debris flow-induced river blockage, followed by the annual average frequency of daily rainfall exceeding 40 mm, basin height difference, circularity ratio, basin area, and river discharge. Through analyzing how these factors influence debris flow-induced river blockage, new insights were gained, providing references for future research. The early identification method for debris flow-induced river blockage proposed in this study can serve as a reference for a quantitative assessment and pre-event prevention of chain risks related to debris flow-induced river blockage in similar high mountain canyon areas.

Author Contributions

Conceptualization, methodology, software, and writing—original draft preparation, J.Z. (Jianjun Zeng) and Y.Z. (Yan Zhao); supervision, validation, and resources, X.M. and G.C.; visualization, investigation, and data curation, Y.L., J.Z. (Jiaoyu Zheng), Y.Z. (Yongjun Zhang) and P.S.; writing—reviewing and editing, D.Y. All authors have read and agreed to the published version of the manuscript.

Funding

This work was supported by the Major Scientific and Technological Projects of Gansu Province (22ZD6FA051); the Second Tibetan Plateau Scientific Expedition and Research Program (STEP) (2021QZKK0201); the National Natural Science Foundation of China (42130709); the National Natural Science Foundation of China (42077230); the important talent project of Gansu Province (2022RCXM033); the Key Research and Development Program of Gansu province (20YF8FA074, 23YFFA0056); the Natural Science Foundation of Gansu Province (21JR7RA442); the Construction Project of Gansu Technological Innovation Center (18JR2JA006); the Longyuan Youth Innovation and Entrepreneurship Talent (Team) Project of Gansu Provincial Party Committee Organization Department (2022LQTD39); the Higher Education Institutions Research Projects of Gansu Province (2023B-152); and the Project of Risk Assessment and Comprehensive Prevention-Control Technology for Major Geological Disasters in Zhouqu, Gansu Province (Phase III).

Data Availability Statement

For relevant data, please contact the corresponding author.

Acknowledgments

The DEM data were provided by the International Scientific and Technical Data Mirror Site, Computer Network Information Center, Chinese Academy of Sciences.

Conflicts of Interest

The authors declare no conflicts of interest.

References

  1. Juez, C.; Garijo, N.; Hassan, M.A.; Nadal-Romero, E. Intraseasonal-to-Interannual Analysis of Discharge and Suspended Sediment Concentration Time-Series of the Upper Changjiang (Yangtze River). Water Resour. Res. 2021, 57, e2020WR029457. [Google Scholar] [CrossRef]
  2. Xiong, J.; Chen, H.; Tang, C.; Chen, M.; Chang, M.; Zhang, X.; Gong, L.; Li, N.; Shi, Q.; Li, M. Application of Remote Sensing Monitoring to the Spatiotemporal Variation in Debris Flow Activity in the Catastrophic Wenchuan Seismic Area. Catena 2023, 232, 107450. [Google Scholar] [CrossRef]
  3. Xia, X.; Jarsve, K.T.; Dijkstra, T.; Liang, Q.; Meng, X.; Chen, G. An Integrated Hydrodynamic Model for Runoff-Generated Debris Flows with Novel Formulation of Bed Erosion and Deposition. Eng. Geol. 2023, 326, 107310. [Google Scholar] [CrossRef]
  4. Zhao, Y.; Meng, X.; Qi, T.; Chen, G.; Li, Y.; Yue, D.; Qing, F. Extracting More Features from Rainfall Data to Analyze the Conditions Triggering Debris Flows. Landslides 2022, 19, 2091–2099. [Google Scholar] [CrossRef]
  5. Zhao, Y.; Meng, X.; Qi, T.; Li, Y.; Chen, G.; Yue, D.; Qing, F. AI-Based Rainfall Prediction Model for Debris Flows. Eng. Geol. 2022, 296, 106456. [Google Scholar] [CrossRef]
  6. Li, Y.; Zou, Q.; Hao, J.; Su, L. Risk Assessment of Debris Flows Along the Karakoram Highway (Kashgar-Khunjerab Section) in the Context of Climate Change. Int. J. Disaster Risk Sci. 2023, 14, 586–599. [Google Scholar] [CrossRef]
  7. Yu, B.; Yang, C.; Yu, M. Experimental Study on the Critical Condition of River Blockage by a Viscous Debris Flow. Catena 2022, 213, 106198. [Google Scholar] [CrossRef]
  8. Zou, Q.; Cui, P.; Jiang, H.; Wang, J.; Li, C.; Zhou, B. Analysis of Regional River Blocking by Debris Flows in Response to Climate Change. Sci. Total Environ. 2020, 741, 140262. [Google Scholar] [CrossRef] [PubMed]
  9. Zhao, Y.; Meng, X.; Qi, T.; Chen, G.; Li, Y.; Yue, D.; Qing, F. Estimating the Daily Rainfall Thresholds of Regional Debris Flows in the Bailong River Basin, China. Bull. Eng. Geol. Environ. 2023, 82, 46. [Google Scholar] [CrossRef]
  10. Zhao, Y.; Meng, X.; Qi, T.; Chen, G.; Li, Y.; Yue, D.; Qing, F. Modeling the Spatial Distribution of Debris Flows and Analysis of the Controlling Factors: A Machine Learning Approach. Remote Sens. 2021, 13, 4813. [Google Scholar] [CrossRef]
  11. Qing, F.; Zhao, Y.; Meng, X.; Su, X.; Qi, T.; Yue, D. Application of Machine Learning to Debris Flow Susceptibility Mapping along the China–Pakistan Karakoram Highway. Remote Sens. 2020, 12, 2933. [Google Scholar] [CrossRef]
  12. Tang, C.; Rengers, N.; van Asch, T.W.J.; Yang, Y.H.; Wang, G.F. Triggering Conditions and Depositional Characteristics of a Disastrous Debris Flow Event in Zhouqu City, Gansu Province, Northwestern China. Nat. Hazards Earth Syst. Sci. 2011, 11, 2903–2912. [Google Scholar] [CrossRef]
  13. Jiang, Z.; Fan, X.; Siva Subramanian, S.; Yang, F.; Tang, R.; Xu, Q.; Huang, R. Probabilistic Rainfall Thresholds for Debris Flows Occurred after the Wenchuan Earthquake Using a Bayesian Technique. Eng. Geol. 2021, 280, 105965. [Google Scholar] [CrossRef]
  14. Ma, C.; Wang, Y.; Hu, K.; Du, C.; Yang, W. Rainfall Intensity–Duration Threshold and Erosion Competence of Debris Flows in Four Areas Affected by the 2008 Wenchuan Earthquake. Geomorphology 2017, 282, 85–95. [Google Scholar] [CrossRef]
  15. Chen, N.S.; Zhang, Y.; Tian, S.F.; Deng, M.F.; Wang, T.; Liu, L.H.; Liu, M.; Hu, G.S. Effectiveness Analysis of the Prediction of Regional Debris Flow Susceptibility in Post-Earthquake and Drought Site. J. Mt. Sci. 2020, 17, 329–339. [Google Scholar] [CrossRef]
  16. Dang, C.; Cui, P.; Cheng, Z.L. The Formation and Failure of Debris Flow-Dams, Background, Key Factors and Model Tests: Case Studies from China. Environ. Geol. 2009, 57, 1901–1910. [Google Scholar] [CrossRef]
  17. Zhuang, J.Q.; Cui, P.; Ge, Y.G.; Yi-Ping, H.; Liu, Y.H.; Guo, X.J. Probability Assessment of River Blocking by Debris Flow Associated with the Wenchuan Earthquake. Int. J. Remote Sens. 2010, 31, 3465–3478. [Google Scholar] [CrossRef]
  18. Liu, J.; You, Y.; Chen, X.; Chen, X. Mitigation Planning Based on the Prediction of River Blocking by a Typical Large-Scale Debris Flow in the Wenchuan Earthquake Area. Landslides 2016, 13, 1231–1242. [Google Scholar] [CrossRef]
  19. Wang, L.; Chang, M.; Dou, X.; Ma, G.; Yang, C. Analysis of River Blocking Induced by a Debris Flow. Geofluids 2017, 2017, 1268135. [Google Scholar] [CrossRef]
  20. Chen, K.T.; Lin, C.H.; Chen, X.Q.; Hu, G.S.; Guo, X.J.; Shieh, C.L. An Assessment Method for Debris Flow Dam Formation in Taiwan. Earth Sci. Res. J. 2018, 22, 37–43. [Google Scholar] [CrossRef]
  21. Chen, K.T.; Chen, X.Q.; Niu, Z.P.; Guo, X.J. Early Identification of River Blocking Induced by Tributary Debris Flow Based on Dimensionless Volume Index. Landslides 2019, 16, 2335–2352. [Google Scholar] [CrossRef]
  22. Wang, J.; Hassan, M.A.; Saletti, M.; Yang, X.; Zhou, H.; Zhou, J. Experimental Study on the Mitigation Effects of Deflection Walls on Debris Flow Hazards at the Confluence of Tributary and Main River. Bull. Eng. Geol. Environ. 2022, 81, 354. [Google Scholar] [CrossRef]
  23. Stancanelli, L.M.; Lanzoni, S.; Foti, E. Propagation and Deposition of Stony Debris Flows at Channel Confluences. Water Resour. Res. 2015, 51, 5100–5116. [Google Scholar] [CrossRef]
  24. Zhao, Y.; Meng, X.; Qi, T.; Qing, F.; Xiong, M.; Li, Y.; Guo, P.; Chen, G. AI-Based Identification of Low-Frequency Debris Flow Catchments in the Bailong River Basin, China. Geomorphology 2020, 359, 107125. [Google Scholar] [CrossRef]
  25. Patton, P.C. Drainage Basin Morphometry and Floods. In Flood Geomorphology; John Wiley & Sons: Hoboken, NJ, USA, 1988; pp. 51–64. [Google Scholar]
  26. Alqahtani, F.; Qaddah, A.A. GIS Digital Mapping of Flood Hazard in Jeddah–Makkah Region from Morphometric Analysis. Arab. J. Geosci. 2019, 12, 199. [Google Scholar] [CrossRef]
  27. Patton, P.C.; Baker, V.R. Morphometry and Floods in Small Drainage Basins Subject to Diverse Hydrogeomorphic Controls. Water Resour. Res. 1976, 12, 941–952. [Google Scholar] [CrossRef]
  28. Potter, P.E. A Quantitative Geomorphic Study of Drainage Basin Characteristics in the Clinch Mountain Area, Virginia and Tennessee. V.C. Miller. J. Geol. 1957, 65, 112–113. [Google Scholar] [CrossRef]
  29. Strahler, A.N. Quantitative Analysis of Watershed Geomorphology. Eos Trans. Am. Geophys. Union 1957, 38, 913–920. [Google Scholar] [CrossRef]
  30. Malik, A.; Kumar, A.; Kandpal, H. Morphometric Analysis and Prioritization of Sub-Watersheds in a Hilly Watershed Using Weighted Sum Approach. Arab. J. Geosci. 2019, 12, 118. [Google Scholar] [CrossRef]
  31. Sreedevi, P.D.; Subrahmanyam, K.; Ahmed, S. The Significance of Morphometric Analysis for Obtaining Groundwater Potential Zones in a Structurally Controlled Terrain. Environ. Geol. 2005, 47, 412–420. [Google Scholar] [CrossRef]
  32. Gong, Y.; Xing, X.; Li, Y.; Zhu, C.; Li, Y.; Yan, J.; Le, H.; Li, X. Insights into the Movement and Diffusion Accumulation Characteristics of a Catastrophic Rock Avalanche Debris—A Case Study. Remote Sens. 2023, 15, 5154. [Google Scholar] [CrossRef]
  33. Gong, Y.; Yao, A.; Li, Y.; Li, Y.; Li, Y.; Sun, Y. Model Test Study on Sliding-Toppling Composite Deformation Evolution of Anti-Dip Layered Rock Slope. Bull. Eng. Geol. Environ. 2023, 82, 194. [Google Scholar] [CrossRef]
  34. Chawla, N.V.; Japkowicz, N.; Drive, P. Editorial: Special Issue on Learning from Imbalanced Data Sets Aleksander Ko l Cz. ACM Sigkdd Explor. Newsl. 2004, 6, 1–6. [Google Scholar] [CrossRef]
  35. Chawla, N.V.; Bowyer, K.W.; Hall, L.O.; Kegelmeyer, W.P. SMOTE: Synthetic Minority over-Sampling Technique. J. Artif. Intell. Res. 2002, 16, 321–357. [Google Scholar] [CrossRef]
  36. Guyon, I.; Weston, J.; Barnhill, S.; Vapnik, V. Gene Selection for Cancer Classification Using Support Vector Machines. Mach. Learn. 2002, 46, 389–422. [Google Scholar] [CrossRef]
  37. Li, X.; Wang, Y.; Basu, S.; Kumbier, K.; Yu, B. A Debiased MDI Feature Importance Measure for Random Forests. In Proceedings of the 33rd Conference on Neural Information Processing Systems (NeurIPS 2019), Vancouver, BC, Canada, 26 June 2019. [Google Scholar]
  38. Glade, T. Linking Debris-Flow Hazard Assessments with Geomorphology. Geomorphology 2005, 66, 189–213. [Google Scholar] [CrossRef]
  39. Jakob, M.; Bovis, M.; Oden, M. The Significance of Channel Recharge Rates for Estimating Debris-Flow Magnitude and Frequency. Earth Surf. Process. Landf. 2005, 30, 755–766. [Google Scholar] [CrossRef]
  40. Huang, C.; Sun, Y.; An, Y.; Shi, C.; Feng, C.; Liu, Q.; Yang, X.; Wang, X. Three-Dimensional Simulations of Large-Scale Long Run-out Landslides with a GPU-Accelerated Elasto-Plastic SPH Model. Eng. Anal. Bound. Elem. 2022, 145, 132–148. [Google Scholar] [CrossRef]
Figure 1. The distribution of debris flow catchments once blocked the river and catchments without river blocking records in the Bailong River Basin (within Gansu Province, China).
Remotesensing 16 01302 g001
Figure 2. The distribution maps of the landslide density (a), fault density (b), lithologic index (c), and annual average frequency of daily rainfall exceeding 40 mm (d) in the Bailong River Basin.
Remotesensing 16 01302 g002
Figure 3. Correlation heatmap of influencing factors.
Remotesensing 16 01302 g003
Figure 4. The prediction accuracy of the model in the validation set samples.
Remotesensing 16 01302 g004
Figure 5. ROC curve of XGB model.
Remotesensing 16 01302 g005
Figure 6. Identification results of debris flow river-blocking disasters in Bailong River Basin.
Remotesensing 16 01302 g006
Figure 7. Feature importance of different factors influencing river blockage.
Remotesensing 16 01302 g007
Figure 8. Box diagrams of important parameters.
Remotesensing 16 01302 g008
Table 1. Impact factors of debris flow-induced river blockages.
No.FactorsAbbr.UnitData and Methods
1Basin areaAkm2DEM and GIS analysis
2Basin height differenceHmDEM and GIS analysis
3Channel relief ratioRr/DEM and GIS analysis
4Circularity ratioCr/DEM and GIS analysis
5Landslide densityLd/Remote sensing interpretation and GIS analysis
6Fault densityFd/GIS analysis
7Lithology indexLi/GIS analysis
8Annual average frequency of daily rainfall >40 mmF40times/yrRainfall data and GIS analysis
9River widthRwmRemote sensing interpretation and GIS analysis
10River dischargeRdm3/sHydrological observation data
11River gradientRg/Remote sensing interpretation and GIS analysis
12Confluence angleCa°Remote sensing interpretation and GIS analysis
Disclaimer/Publisher’s Note: The statements, opinions and data contained in all publications are solely those of the individual author(s) and contributor(s) and not of MDPI and/or the editor(s). MDPI and/or the editor(s) disclaim responsibility for any injury to people or property resulting from any ideas, methods, instructions or products referred to in the content.

