Article

Exploring the Spatiotemporal Alterations in China’s GPP Based on the DTEC Model

1
College of Geography and Remote Sensing Sciences, Xinjiang University, Urumqi 830046, China
2
Xinjiang Key Laboratory of Oasis Ecology, Xinjiang University, Urumqi 830046, China
3
Schiller Institute for Integrated Science and Society, Boston College, Chestnut Hill, MA 02467, USA
4
College of Environmental and Resource Sciences, Shanxi University, Taiyuan 030006, China
5
Institute of Geographical Science, Taiyuan Normal University, Jinzhong 030619, China
6
Shanxi Key Laboratory of Earth Surface Processes and Resource Ecological Security in Fenhe River Basin, Taiyuan Normal University, Jinzhong 030619, China
7
College of Geography and Environmental Sciences, Zhejiang Normal University, Jinhua 321004, China
*
Author to whom correspondence should be addressed.
Remote Sens. 2024, 16(8), 1361; https://doi.org/10.3390/rs16081361
Submission received: 21 February 2024 / Revised: 4 April 2024 / Accepted: 9 April 2024 / Published: 12 April 2024

Abstract

:
Gross primary productivity (GPP) is a reliable measure of the carbon sink potential of terrestrial ecosystems and is an essential element of terrestrial carbon cycle research. This study employs the diffuse fraction-based two-leaf light-use efficiency (DTEC) model to imitate China’s monthly GPP from 2001 to 2020. We studied the trend of GPP, investigated its relationship with climatic factors, and separated the contributions of climate change and human activities. The findings showed that the DTEC model was widely applicable in China. During the study period, China’s average GPP increased significantly, by 9.77 g C m−2 yr−1 (p < 0.001). The detrimental effect of aerosol optical depth (AOD) on GPP was more widespread than that of total precipitation, temperature, and solar radiation. Areas that benefited from AOD, such as Northwest China, experienced significant increases in GPP. Climate change and human activities had a primary and positive influence on GPP during the study period, accounting for 28% and 72% of the increase, respectively. Human activities, particularly ecological restoration projects and the adoption of advanced agricultural technologies, played a significant role in China’s GPP growth. China’s afforestation plan was particularly notable, with the GPP increasing in afforestation areas at a rate greater than 10 g C m−2 yr−1. This research provides a theoretical foundation for the long-term management of China’s terrestrial ecosystems and helps develop adaptive ecological restoration tactics.

1. Introduction

Global carbon sequestration is an essential step in the terrestrial carbon cycle [1]. For determining the state and dynamics of the terrestrial carbon cycle, Gross Primary Productivity (GPP) is an essential indicator that describes the overall amount of atmospheric carbon dioxide that plants absorb via photosynthesis [2]. Therefore, accurate modelling of GPP on a zonal or worldwide scale will contribute to understanding the stability of terrestrial ecosystems and assist in decision making in response to more climatic changes [3].
Currently, two main methods are used to estimate GPP: ground-based observations and model simulations [4]. Ground-based observational methods generally tend to use eddy correlation techniques [5]. However, as the number of flux sites is few and sparsely distributed, ground-based observations are commonly used for validation analyses of GPP models [6]. Ecosystem modelling, which primarily consists of process-based models and is based on vegetation photosynthesis light-use efficiency (LUE) models, is a useful technique for predicting GPP on a zonal or global scale. Due to its simpler structure and fewer parameter inputs, the LUE model is widely applied on a larger scale than process-based models that require many parameters and data inputs.
However, there are large differences in the variety of LUE models. For example, the MODIS GPP product was based on the big-leaf LUE model, but the fixed parameters of the model led to an underestimation of simulated GPP values, especially in farmland ecosystems, with an underestimation of approximately 30% [7]. Additionally, GPP is underestimated by the LUE model because its algorithms do not distinguish between the maximum LUE of C3 and C4 vegetation [8]. To compensate for this deficiency, Yan [9] proposed a terrestrial ecosystem carbon flux model (TEC) to differentiate the LUEs of C3 and C4 vegetation. C3 and C4 plants are two fundamental plant functional types (PFTs) with different responses during photosynthesis. Nonetheless, the model encountered limitations, as the LUE of scattered radiation from vegetation canopies was greater than that of direct radiation. He [10] proposed the two-leaf light-use efficiency model (TL-LUE), which distinguishes between shaded and sunlit leaves. However, the two-leaf model does not consider the influence of soil moisture stress and the diffuse fraction on vegetative photosynthesis. To address this limitation, Yan [11] proposed a diffuse fraction-based two-leaf light-use efficiency model (DTEC) based on previous models. The novel model adds a diffuse fraction to recalculate the solar radiation received and the LUE by the sunny and shady leaves, allowing the model to better capture seasonal variations in the GPP [12].
The effects of climate change on the dynamics of GPP have been a hot topic in global change research [13]. Surplus solar radiation may cause an increase in soil moisture, leading to anaerobic conditions in the soil, thus reducing vegetation productivity on the Tibetan Plateau [14]. Furthermore, aerosol particles have a scattering effect on solar radiation, increasing the proportion of scattered radiation to total solar radiation, which in turn affects vegetation productivity by influencing photosynthesis [15]. In particular, climate extremes can alter the ecosystem’s structure and capacity to function; this phenomenon may negatively impact the terrestrial carbon cycle [16]. Another aspect is human activity, notably grazing [17], the use of ecological restoration initiatives [18], land management strategies [19], and urbanization [20].
China has become the most important and sensitive region in global research on carbon and water cycles in terrestrial ecosystems [21]. Moreover, China, the world’s largest carbon emitter, has pledged to achieve carbon neutrality by 2060 [22]. To achieve this goal, an in-depth understanding of the status of the terrestrial carbon cycle in China is needed. Since the conclusion of the 20th century, China has initiated a range of environmental recovery and conservation measures, including China’s afforestation program (CAP) and the Conversion of Cropland to Forest Program (CCFP). The main objective of these initiatives is to restore the natural environment through a variety of human endeavours, such as afforestation and the protection of natural forests [23]. Therefore, understanding how anthropogenic influences and climate change affect carbon sinks in detail is essential for understanding China’s terrestrial ecosystems [24].
In this research, the GPP of Chinese areas from 2001 to 2020 was calculated using the DTEC model, and we analysed the spatial-temporal patterns and their influencing factors. The main research objectives were as follows: (1) to evaluate the applicability of the DTEC model in the Chinese region and create a new GPP dataset, (2) to analyse the spatial and temporal distribution characteristics of the new GPP data, (3) to explore the correlations with different climatic variables, and (4) to evaluate the relative impacts and contributions of anthropogenic activities and the climate to GPP at the regional and national levels.

2. Materials and Methods
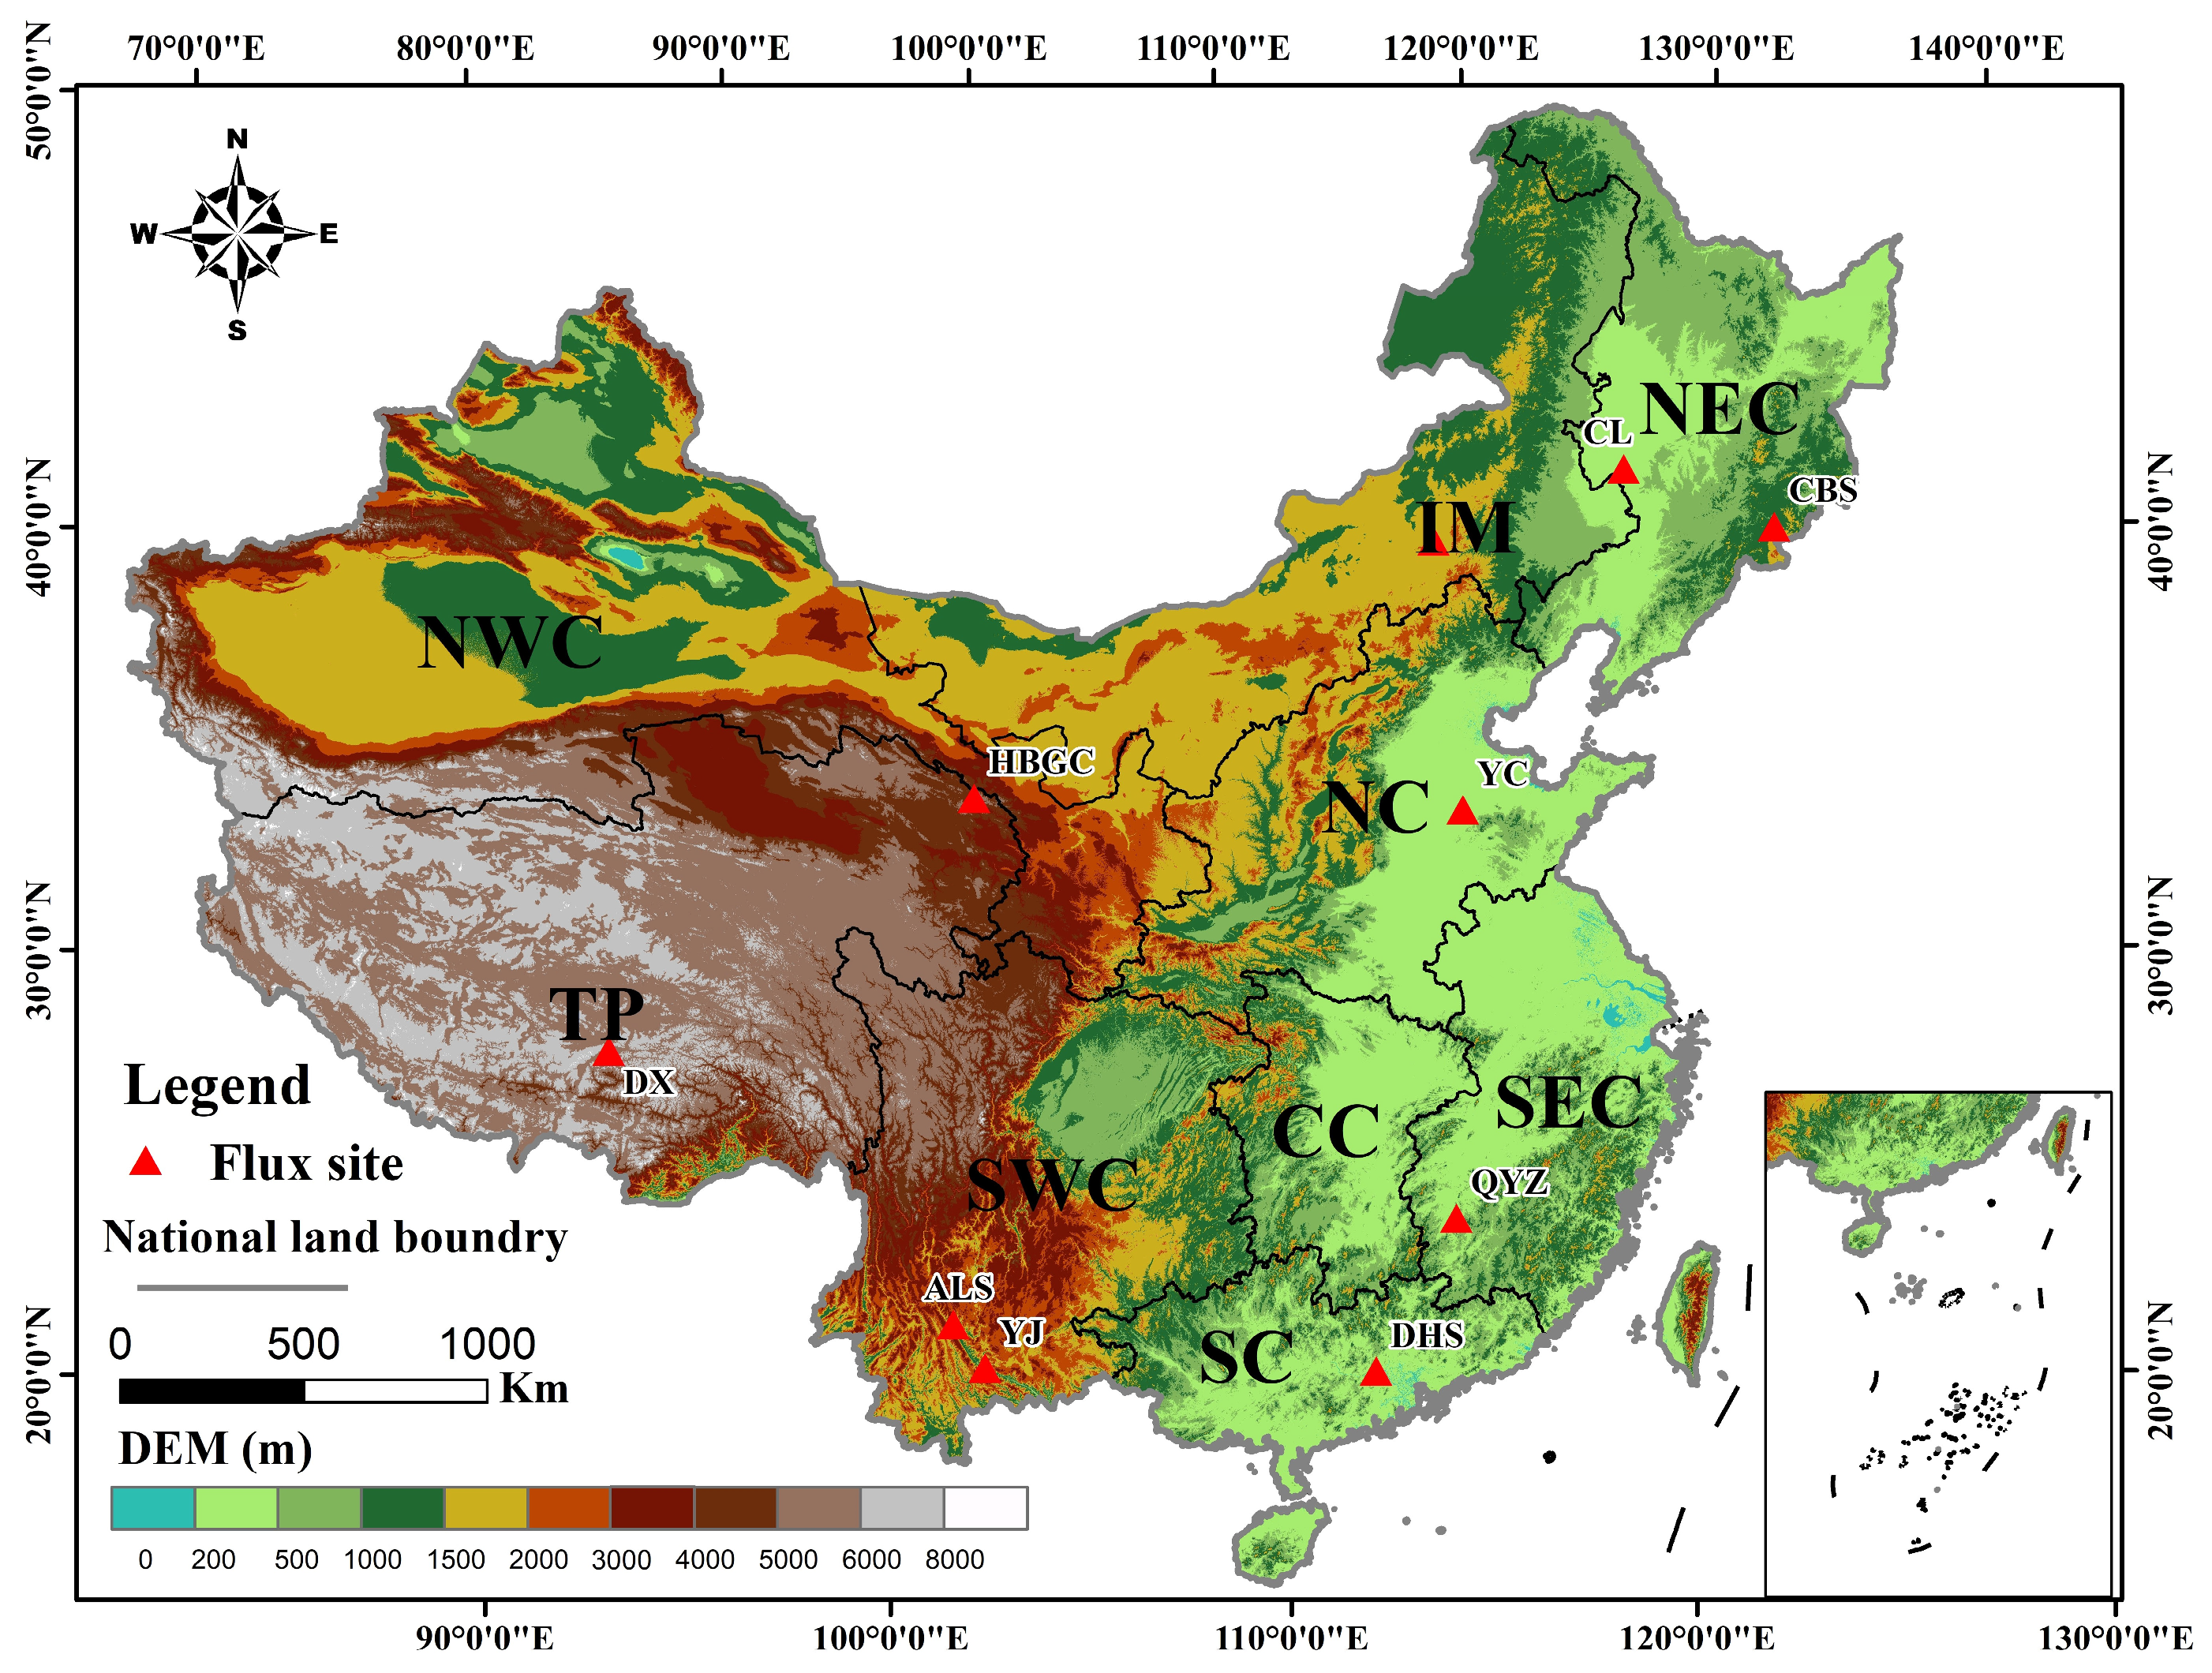
2.1. Study Area

In this study, nine zones were created within the study area (Figure 1) according to the geo-ecological factors. These regions included Northeast China (NEC), Inner Mongolia (IM), Northwest China (NWC), North China (NC), Central China (CC), the Tibetan Plateau (TP), Southeast China (SEC), South China (SC), and Southwest China (SWC) [25].

2.2. Data Sources

The flux observation data used in this paper were obtained from the China Terrestrial Ecosystem Flux Observation Research Network (http://chinaflux.org, accessed on 11 April 2022) and the FLUXENT2015 dataset (https://fluxnet.org, accessed on 20 April 2022). This study selected 10 flux towers in China, and detailed information about each site is shown in Table 1.
The two types of GPP product data used in this paper were MODIS17A2H.006 (MOD17) and the global dataset of sun-induced chlorophyll fluorescence (GO-SIF). The GO-SIF data were obtained from the high spatial and temporal resolution (0.05°, 8 days) dataset provided by the Global Ecology Team (https://globalecology.unh.edu, accessed on 15 April 2022). The MOD17 data were obtained from the MOD17A2H.006 product on the Google Earth Engine (GEE) platform, which provides spatial and temporal resolution (500 m, 8 days). The performance of the DTEC model was evaluated in this paper with these two products and flux data. The C4 vegetation distribution percentage data were obtained from the International-Satellite-Land-Surface-Climatology-Project-II (https://doi.org/10.3334/ORNLDAAC/932, accessed on 15 April 2022), which provides a 1° spatial resolution static map of the globe. The aerosol optical depth (AOD) data were obtained from https://doi.org/10.5281/zenodo.5652257 (accessed on 15 April 2022), which was produced by the Bai team and had a spatial and temporal resolution of 1000 m/day.
The following data were obtained from the GEE platform. Meteorological driving data such as temperature, precipitation, and solar radiation were obtained from the ERA5-Land Monthly Averaged-ECMWF Climate Reanalysis data, with a spatiotemporal resolution of 11,132 m/1 month. The digital elevation model (DEM) data were taken from the NASANASADEM_HGT.001 data product with a spatial resolution of 30 m. Evapotranspiration and potential evapotranspiration data were obtained from the MOD16A2.006 product, solar zenith angle data were obtained from the MOD09A1.061 product, the leaf area index (LAI) was obtained from the MOD15A2H.061 product, and the temporal and spatial resolutions were both 500 m, 8 days. The land cover type data were taken from the IGBP classification data of the MCD12Q1.006 data, with a spatial resolution of 500 m. The land cover types were reclassified into 10 categories: evergreen needleleaf forest (ENF), evergreen broadleaf forest (EBF), deciduous needleleaf forest (DNF), deciduous broadleaf forest (DBF), mixed forest (MF), shrublands, savannas, grasslands, croplands, and non-vegetated areas (NOA). Considering the consistency of the model runs with the cycles of each dataset, all the data were resampled to 500 m, and the period was chosen to be 2001–2020 month by month.

2.3. Methods

2.3.1. DTEC Model

DTEC is a two-leaf light-use efficiency model based on the diffusion fraction. The model considers the effects of scattered radiation, diffuse fraction and soil water stress on GPP [11]. The main structure of the model is as follows:
GPP = ( ε msu × APAR sun   + ε msh × APAR shd   ) × W ε × T ε
APAR sun = [ PAR dir × cos ( β ) cos ( θ ) + PAR dif PAR dif , u LAI + C ] × LAI sun
APAR shd   = [ PAR dif PAR dif ,   u   LAI + C ] × LAI shd  
LAI sum = 2 × cos ( θ ) × [ 1 exp ( 0.5 × Ω × L A I cos ( θ ) ) ]
LAI shd   = LAI LAI sum
PAR dif = PAR × D f
D f = 0.7527 + 3.8453 S I 16.316 S I 2 + 18.962 S I 3 7.0802 S I 4
S I = P A R [ 0.48 S 0 cos ( θ ) ]
W ε = E / E P T
T ε = ( T a T min ) ( T a T max ) ( T a T min ) ( T a T max ) ( T a T opt ) 2
where ε msu and ε msh are the maximum LUEs of the sun and shade leaves, respectively. For C3 plants: ε msh = 3.78 × D f 1.8 , ε msu = 1.67   g   C / M J , and for C4 plants: ε msh = 5.78 × D f 1.8 , ε msu = 2.56   g   C / M J . APAR sun   and APAR shd   are the photosynthetically active radiation absorbed by the sun and shade leaves, respectively. W ε is the water stress factor, in which E is the actual evapotranspiration and E PT is the potential evapotranspiration. T ε is the temperature stress factor, in which T a is the air temperature and T min , T max , and T opt are the minimum, maximum, and optimal temperatures for photosynthesis in biomes, respectively. C is the contribution of direct radiation to the scattered radiation after multiple scattering, and the formula is 0.07 Ω × P A R d i r × ( 1.1 0.1 L A I ) × e ( c o s ( θ ) ) . Ω is the vegetation type index. β is the mean leaf solar angle, which is 60°, and θ is the solar zenith angle. PAR dir   , PAR dif and PAR dif , u are the direct photosynthetically active radiation, scattered photosynthetically active radiation and scattered radiation under the canopy, respectively, in which PAR dir   = P A R P A R d i f and PAR dif , u = P A R d i f × e ( 0.5 × Ω × L A I ) / ( 0.537 + 0.025 L A I ) . LAI sun and LAI shd are the LAIs for sunny and shady leaves, respectively, which were obtained by separating the LAI products. PAR is the photosynthetically active radiation, calculated as 0.48 R g , where R g is the solar radiation. D f is the scattering ratio, SI is the clear sky index, and S 0 is the solar constant (1367 W/m−2).

2.3.2. Analytical Methods

The accuracy of the simulated values was determined using three metrics: coefficient of determination (R2), root mean square error (RMSE), and bias. The Theil–Sen median trend was used for the GPP time series trend analysis [26]. Partial correlation analysis was used to quantify complex connections between variables with multiple correlations [27]. Residual analysis was used to evaluate the contributions of climate change and human activities to GPP changes [28]. To more accurately assess how human activities and climate conditions affect GPP, the contribution of climatic factors (GPPCC) and contribution of human activities (GPPHA) were classified into 7 levels based on their linear trend values [29], as shown in Table S1. The classification of the main drivers of change in China and the calculations of the relative contributions to GPP [30] are shown in Table S2.
Figure 2 shows the steps and sequences adopted in the present study’s data acquisition and analysis. The flow charts were divided into four parts: data preparation, model accuracy verification, GPP change analysis, and determination of the contributions of anthropogenic and climate factors to GPP.

3. Results

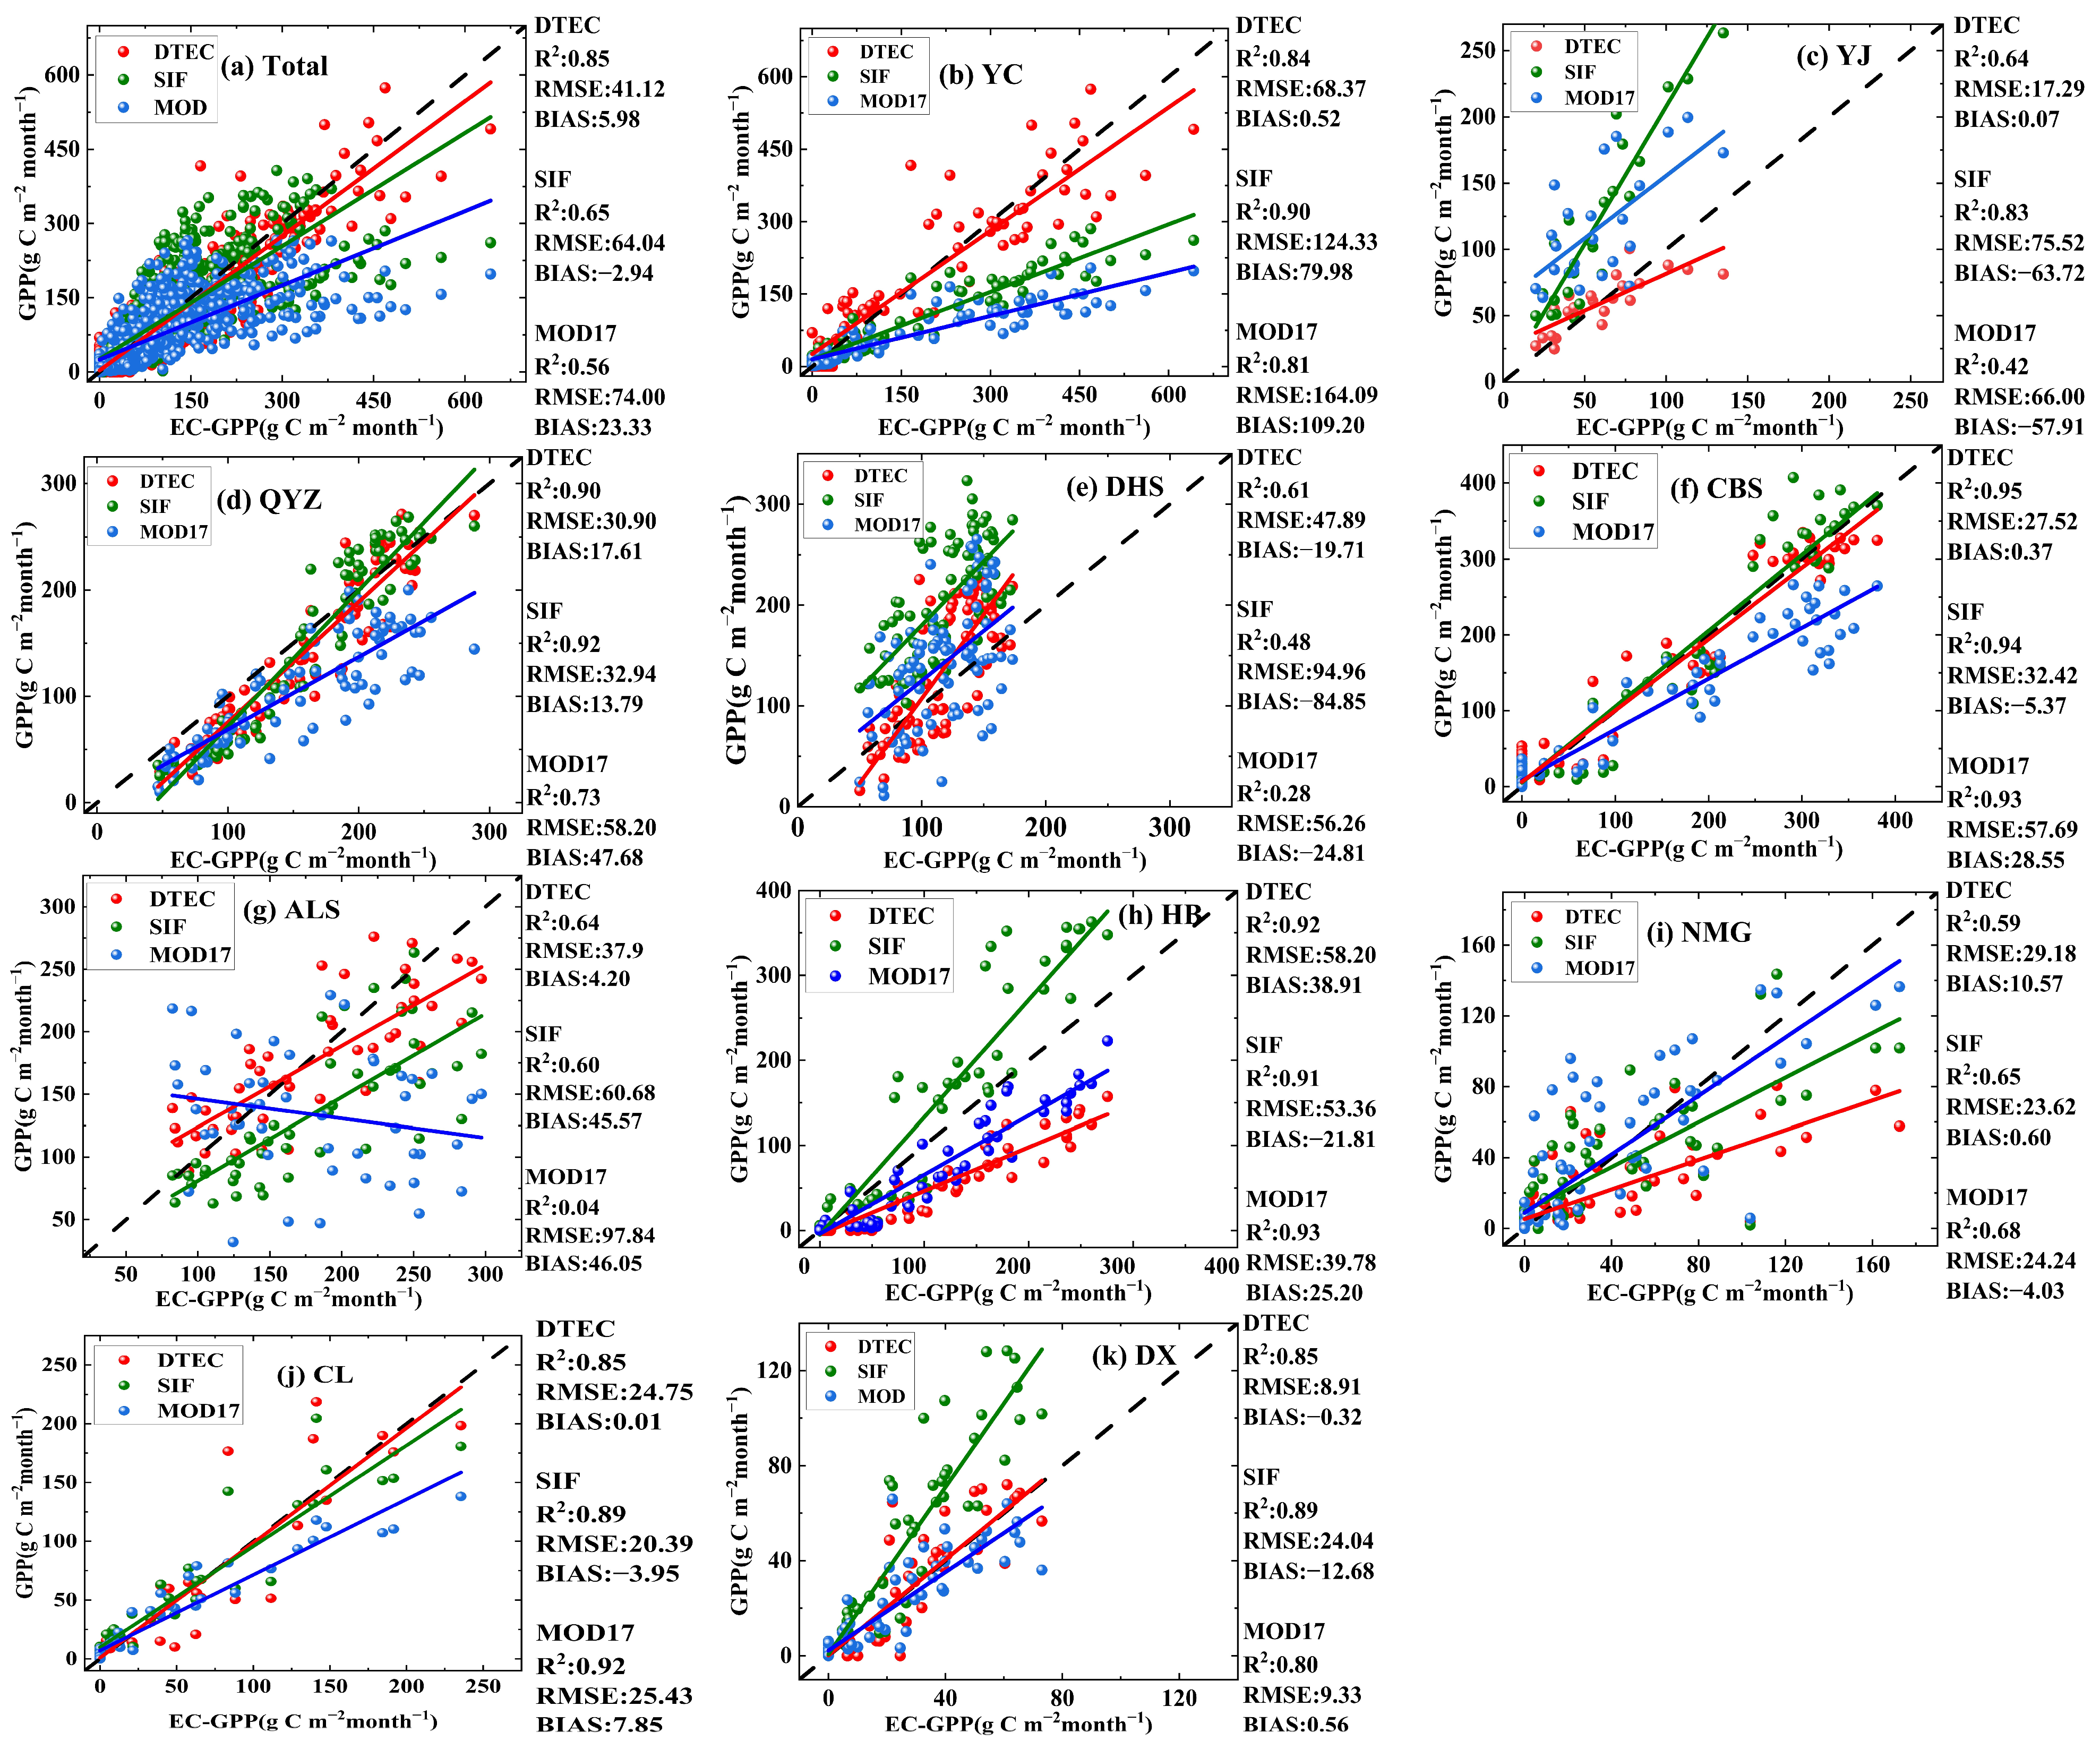
3.1. Verification of GPP Simulation Accuracy

The monthly GPP values simulated by the DTEC model (GPPDT) with GO-SIF GPP (GPPSIF) and MOD17 GPP (GPPMOD) were compared at the site scale with flux measurement data (GPPEC). These accuracy validation results (Figure 3) showed that the three models simulated and captured the dynamics of the GPP well, but the simulation accuracy changed with flux site and ecosystem type. At the cropland site (YC), GPPDT ( R 2 = 0.84, RMSE = 68.37 g C m−2 month−1, bias = 0.52 g C m−2 month−1) was more accurate than GPPSIF ( R 2 = 0.90, RMSE = 124.33 g C m−2 month−1, bias = 79.98 g C m−2 month−1) and GPPMOD ( R 2 = 0.81, RMSE = 164.09 g C m−2 month−1, bias = 109.20 g C m−2 month−1) (Figure 3b). Among the QYZ, CBS and DHS forest sites, GPPDT achieved the best simulation, and the CBS site had the highest accuracy ( R 2 = 0.95, RMSE = 27.52 g C m−2 month−1, bias = 0.37 g C m−2 month−1) (Figure 3f). The GPPDT values were more accurate than the GPPMOD and GPPSIF values at the mixed forest (ALS) (Figure 3g) and savanna (YJ) (Figure 3c) sites. In general, GPPDT ( R 2 = 0.85, RMSE = 41.12 g C m−2 month−1, bias = 5.98 g C m−2 month−1) was better than GPPSIF ( R 2 = 0.65, RMSE = 64.04 g C m−2 month−1, bias = −2.94 g C m−2 month−1) and GPPMOD ( R 2 = 0.56, RMSE = 74.00 g C m−2 month−1, bias = 23.33 g C m−2 month−1) (Figure 3a).
This paper further compared GPPDT data with GPPSIF and GPPMOD data to evaluate the precision and accuracy of the DTEC model from three aspects: multiyear average (Figure S1), spatial distribution (Figure S2), and GPP trend significance test (Figure S3). Overall, the DTEC model had the highest accuracy, could better reflect the status of GPP in China, and could provide more accurate data for subsequent analyses.

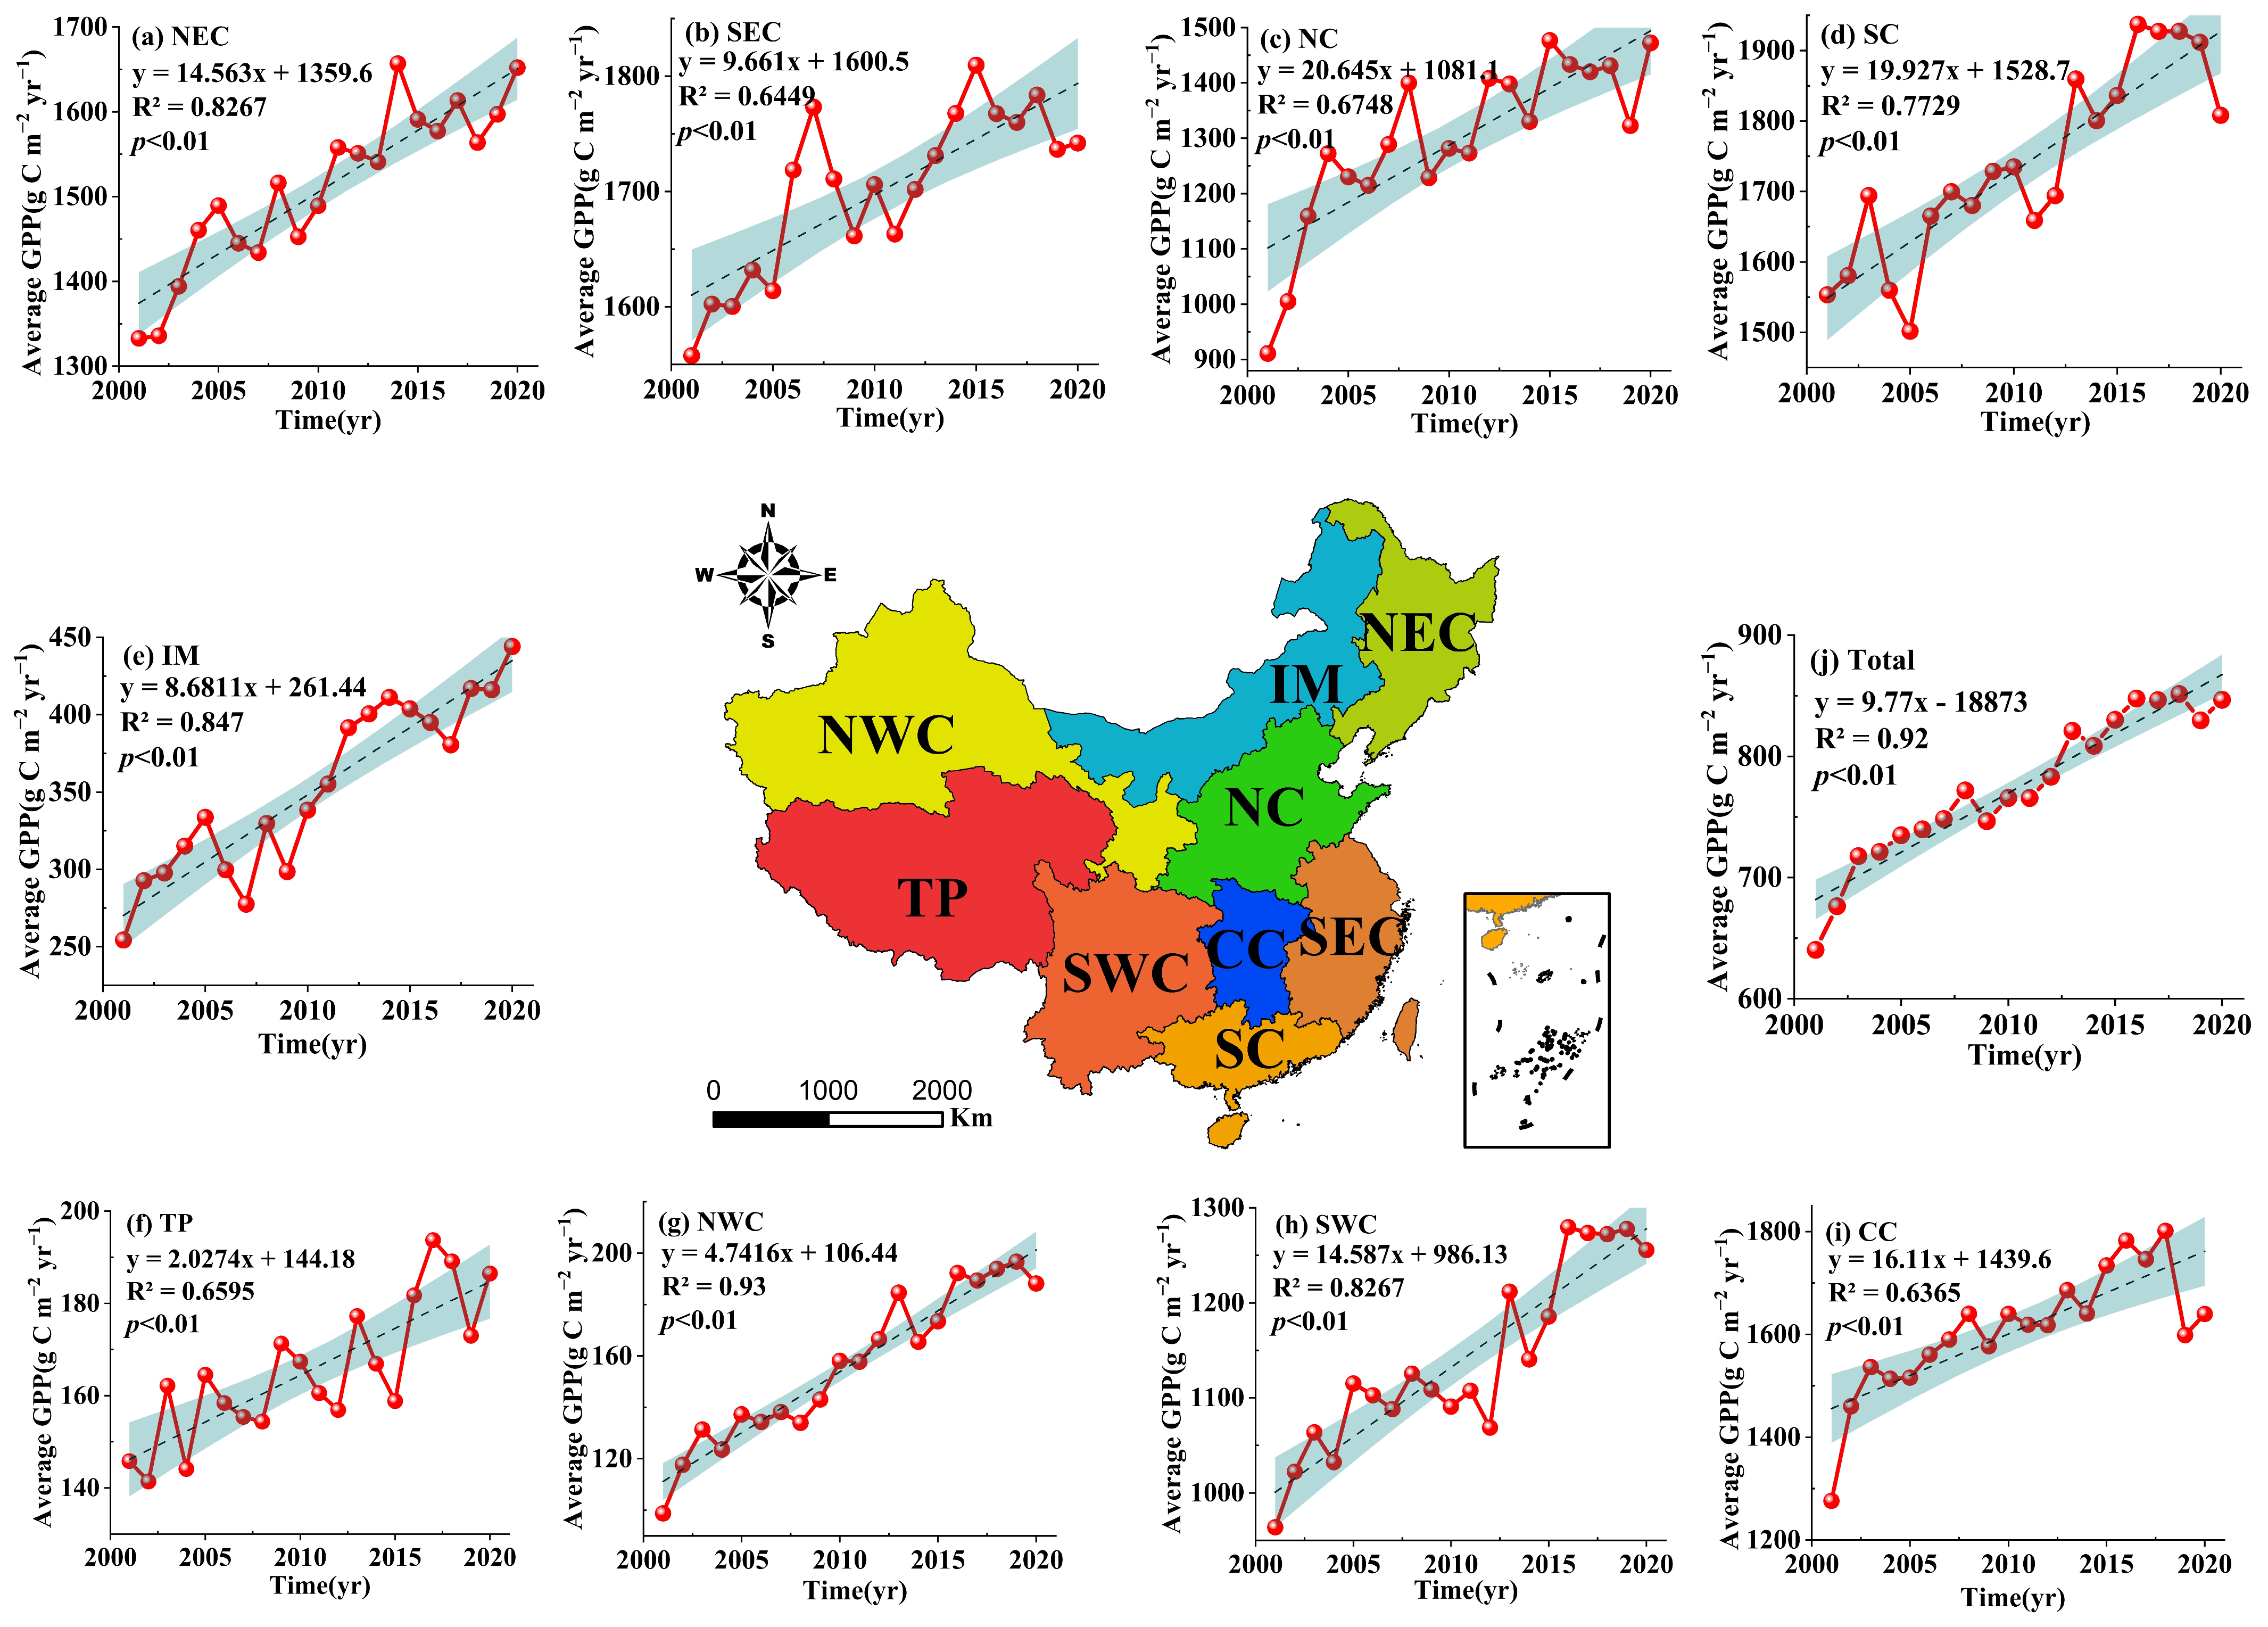
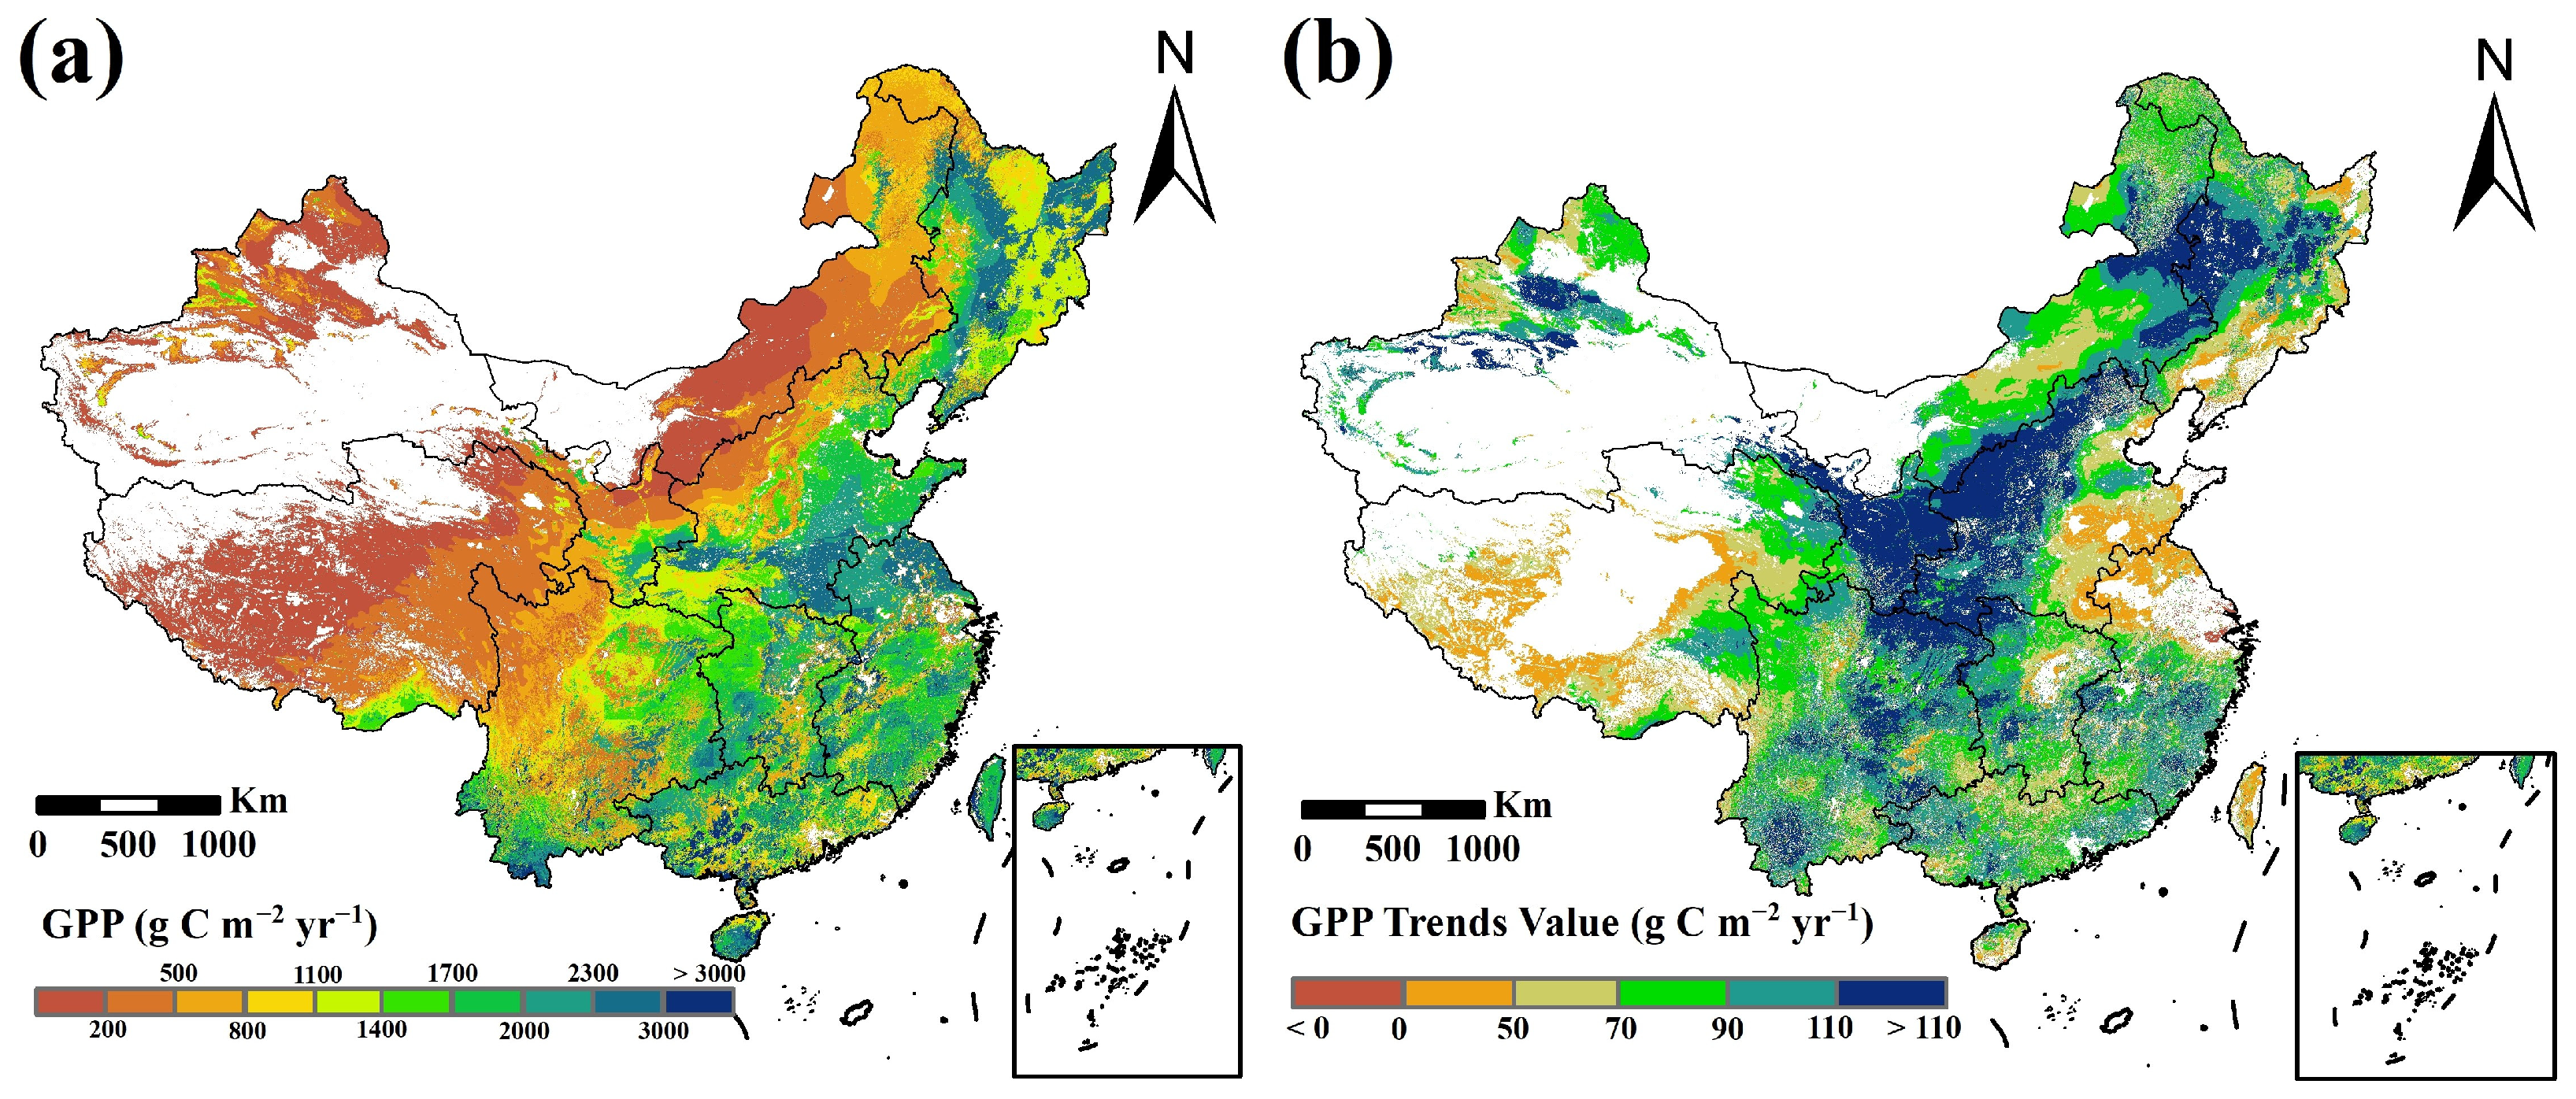
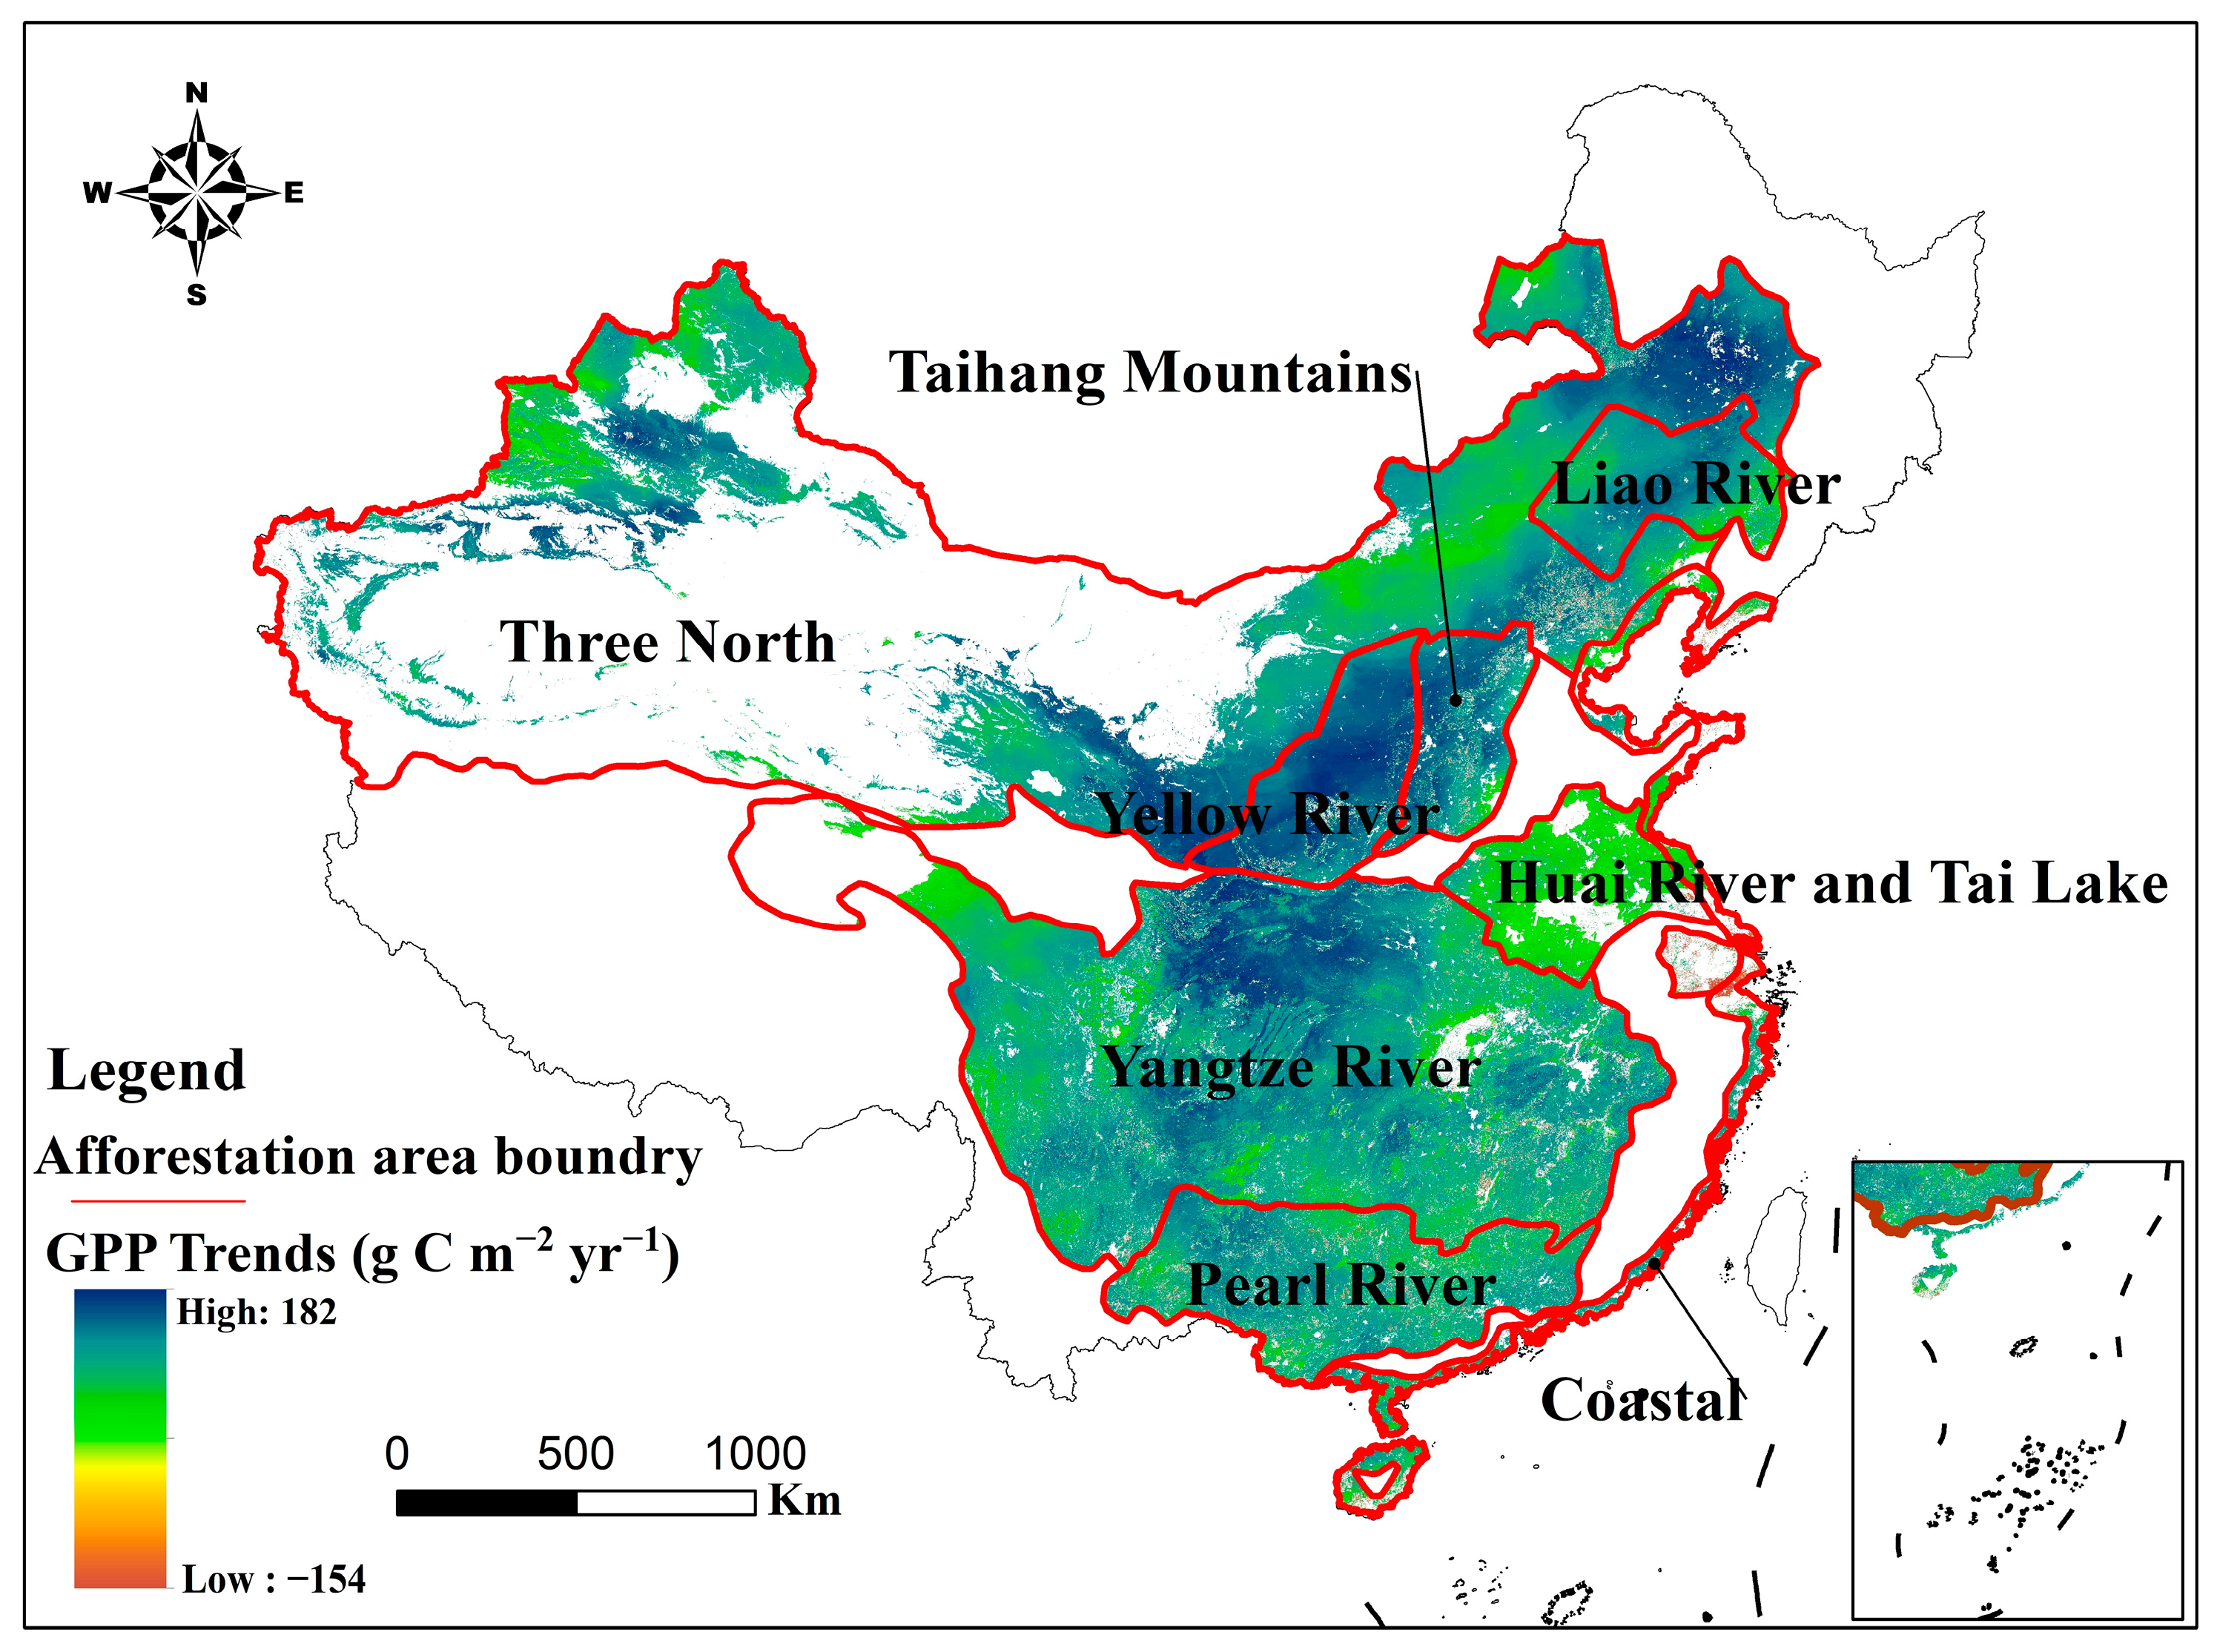
3.2. Spatiotemporal Variation Characteristics of Chinese Terrestrial Ecosystem GPP

The DTEC model showed a significant increasing trend from 2001 to 2020 (Figure 4j), but there were fluctuations between years. The minimum value occurred in 2001, and the maximum value occurred in 2018. The average annual increase is 9.77 g C m−2 yr−1 (p < 0.001). The GPP growth trends of the nine regions passed the significance test, and all showed a very significant increase (Figure 4). Among them, the NC region had the largest growth rate of 20.65 g C m−2 yr−1, and the lowest growth trend was in the TP region, at 2.03 g C m−2 yr−1.
The spatial distribution of the multiyear average GPP in China from 2001 to 2020 is shown in Figure 5a. According to the colour of the spatial distribution of the average GPP value from 2001 to 2020, the high values were mainly distributed in the eastern region, and the low values were mainly distributed in the western region. The overall trend decreased from the southeast to the northwest and from the coast to the interior. The areas with increasing GPP trends in China from 2001 to 2020 were 67.29%, approximately 6.46 million km2, and the areas with decreasing trends were 32.71%, approximately 3.14 million km2. The results revealed that the trend of GPP change differed among the different regions, and in general, the area with an increasing trend of GPP in China was larger than the area with a decreasing trend. Among them, the decreasing regions were mainly in NWC, IM, TP, and SEC, and the increasing regions were mainly in SC, CC, NC, and SWC. According to the significance test results, 43.08% of China’s regional GPP changes were nonsignificant, and 56.92% of the area passed the significance test; within that range, the percentages of the areas with very significant increases, significant increases, very significant decreases, and significant decreases were 47.88%, 8.23%, 0.24%, and 0.57%, respectively (Figure 5b).

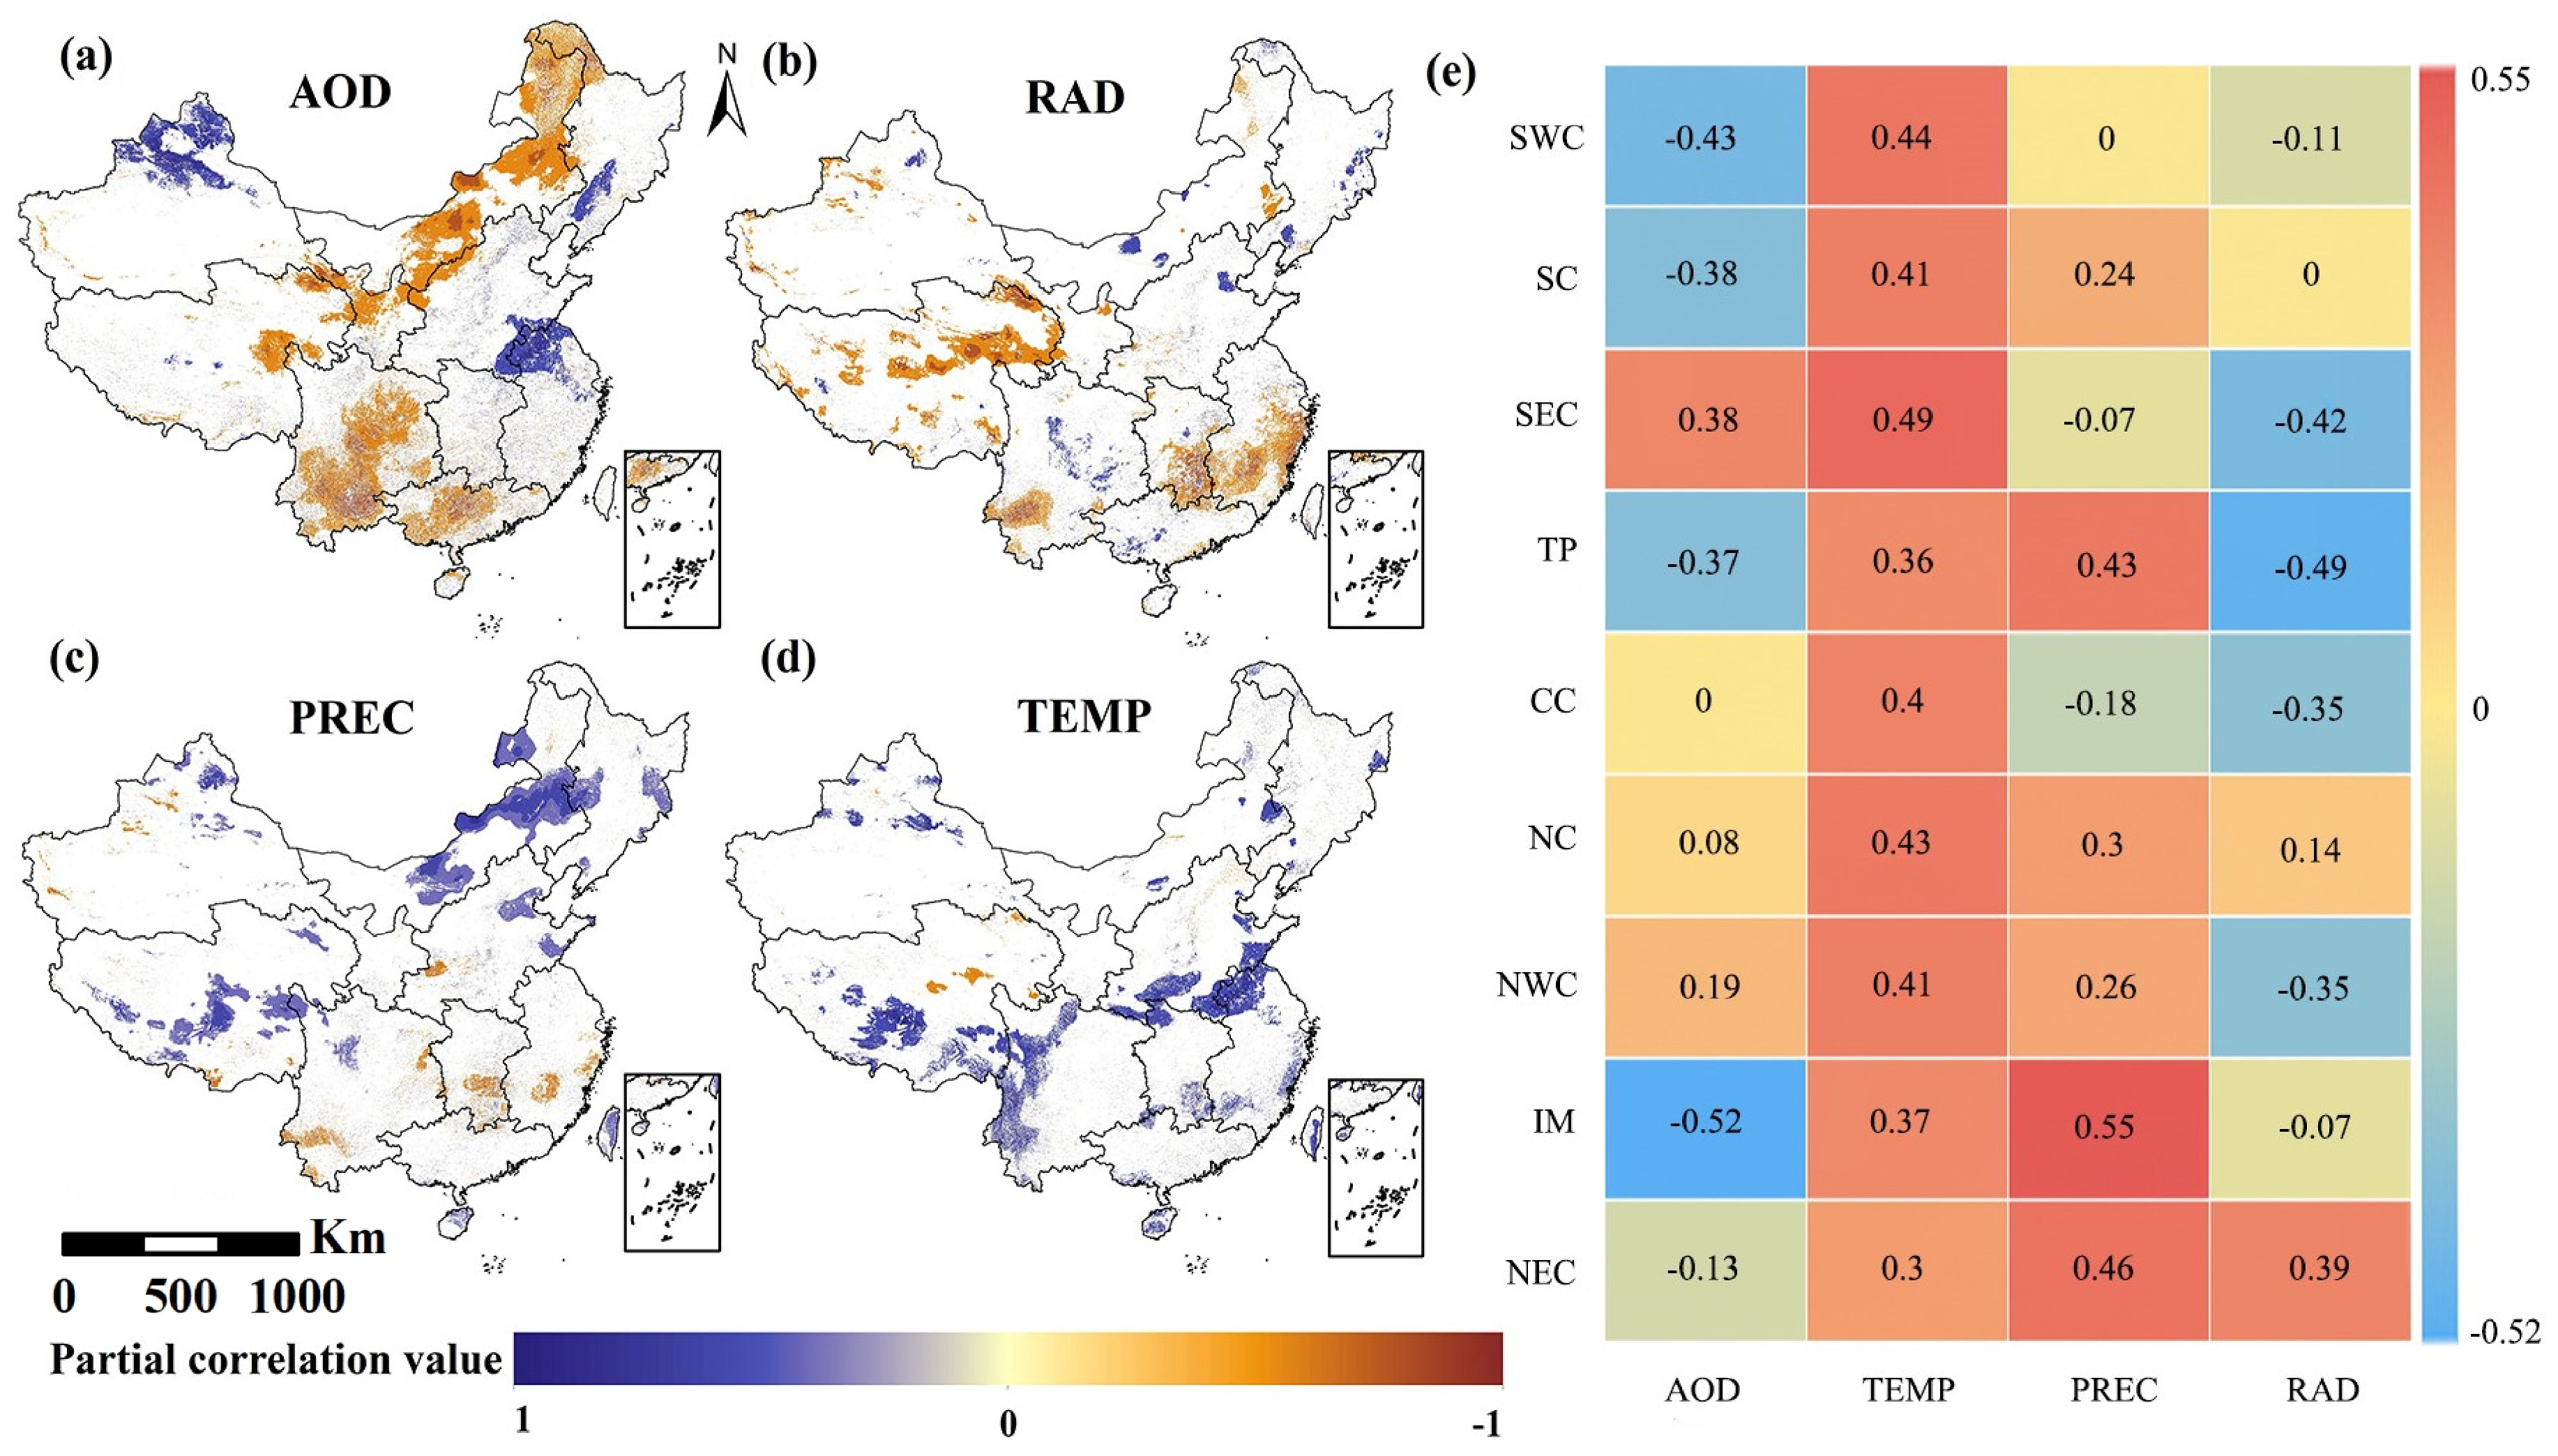
3.3. The Effects of Climate Factors on GPP

By counting the partial correlation coefficients between GPP and various climate factors that passed the significance test, we found that the average partial correlation coefficients between China’s GPP and temperature, precipitation, solar radiation, and AOD were 0.41, 0.34, −0.29, and −0.22, respectively (Figure 6). The percent areas with a positive correlation between GPP and temperature and precipitation were larger than the areas with a negative correlation (9.5% and 9.8% vs. 0.9% and 0.2%, respectively), and the overall correlation was positive. The percent area of negative correlation between GPP and solar radiation and AOD was larger than the area of positive correlation (8.8% and 15.3% vs. 2.5% and 6.2%, respectively), and an overall negative correlation was present. At the national scale, the order of the response of GPP to climate factors in China was temperature > precipitation > solar radiation > AOD.
However, at the regional scale, the response of GPP to climate factors exhibited significant spatial heterogeneity (Figure 6e). Precipitation had the greatest effect on GPP in the NEC and IM regions, with partial correlation coefficients of 0.46 and 0.55, respectively. In the NWC, NC, CC, SEC, and SC regions, temperature had the greatest influence on GPP, with partial correlation coefficients of 0.41, 0.43, 0.4, 0.49, and 0.41, respectively. The greatest influence on GPP in the TP region was from solar radiation, with a partial correlation coefficient of −0.49. Temperature (0.44) and solar radiation (−0.43) had the greatest impacts on GPP in the SWC region.

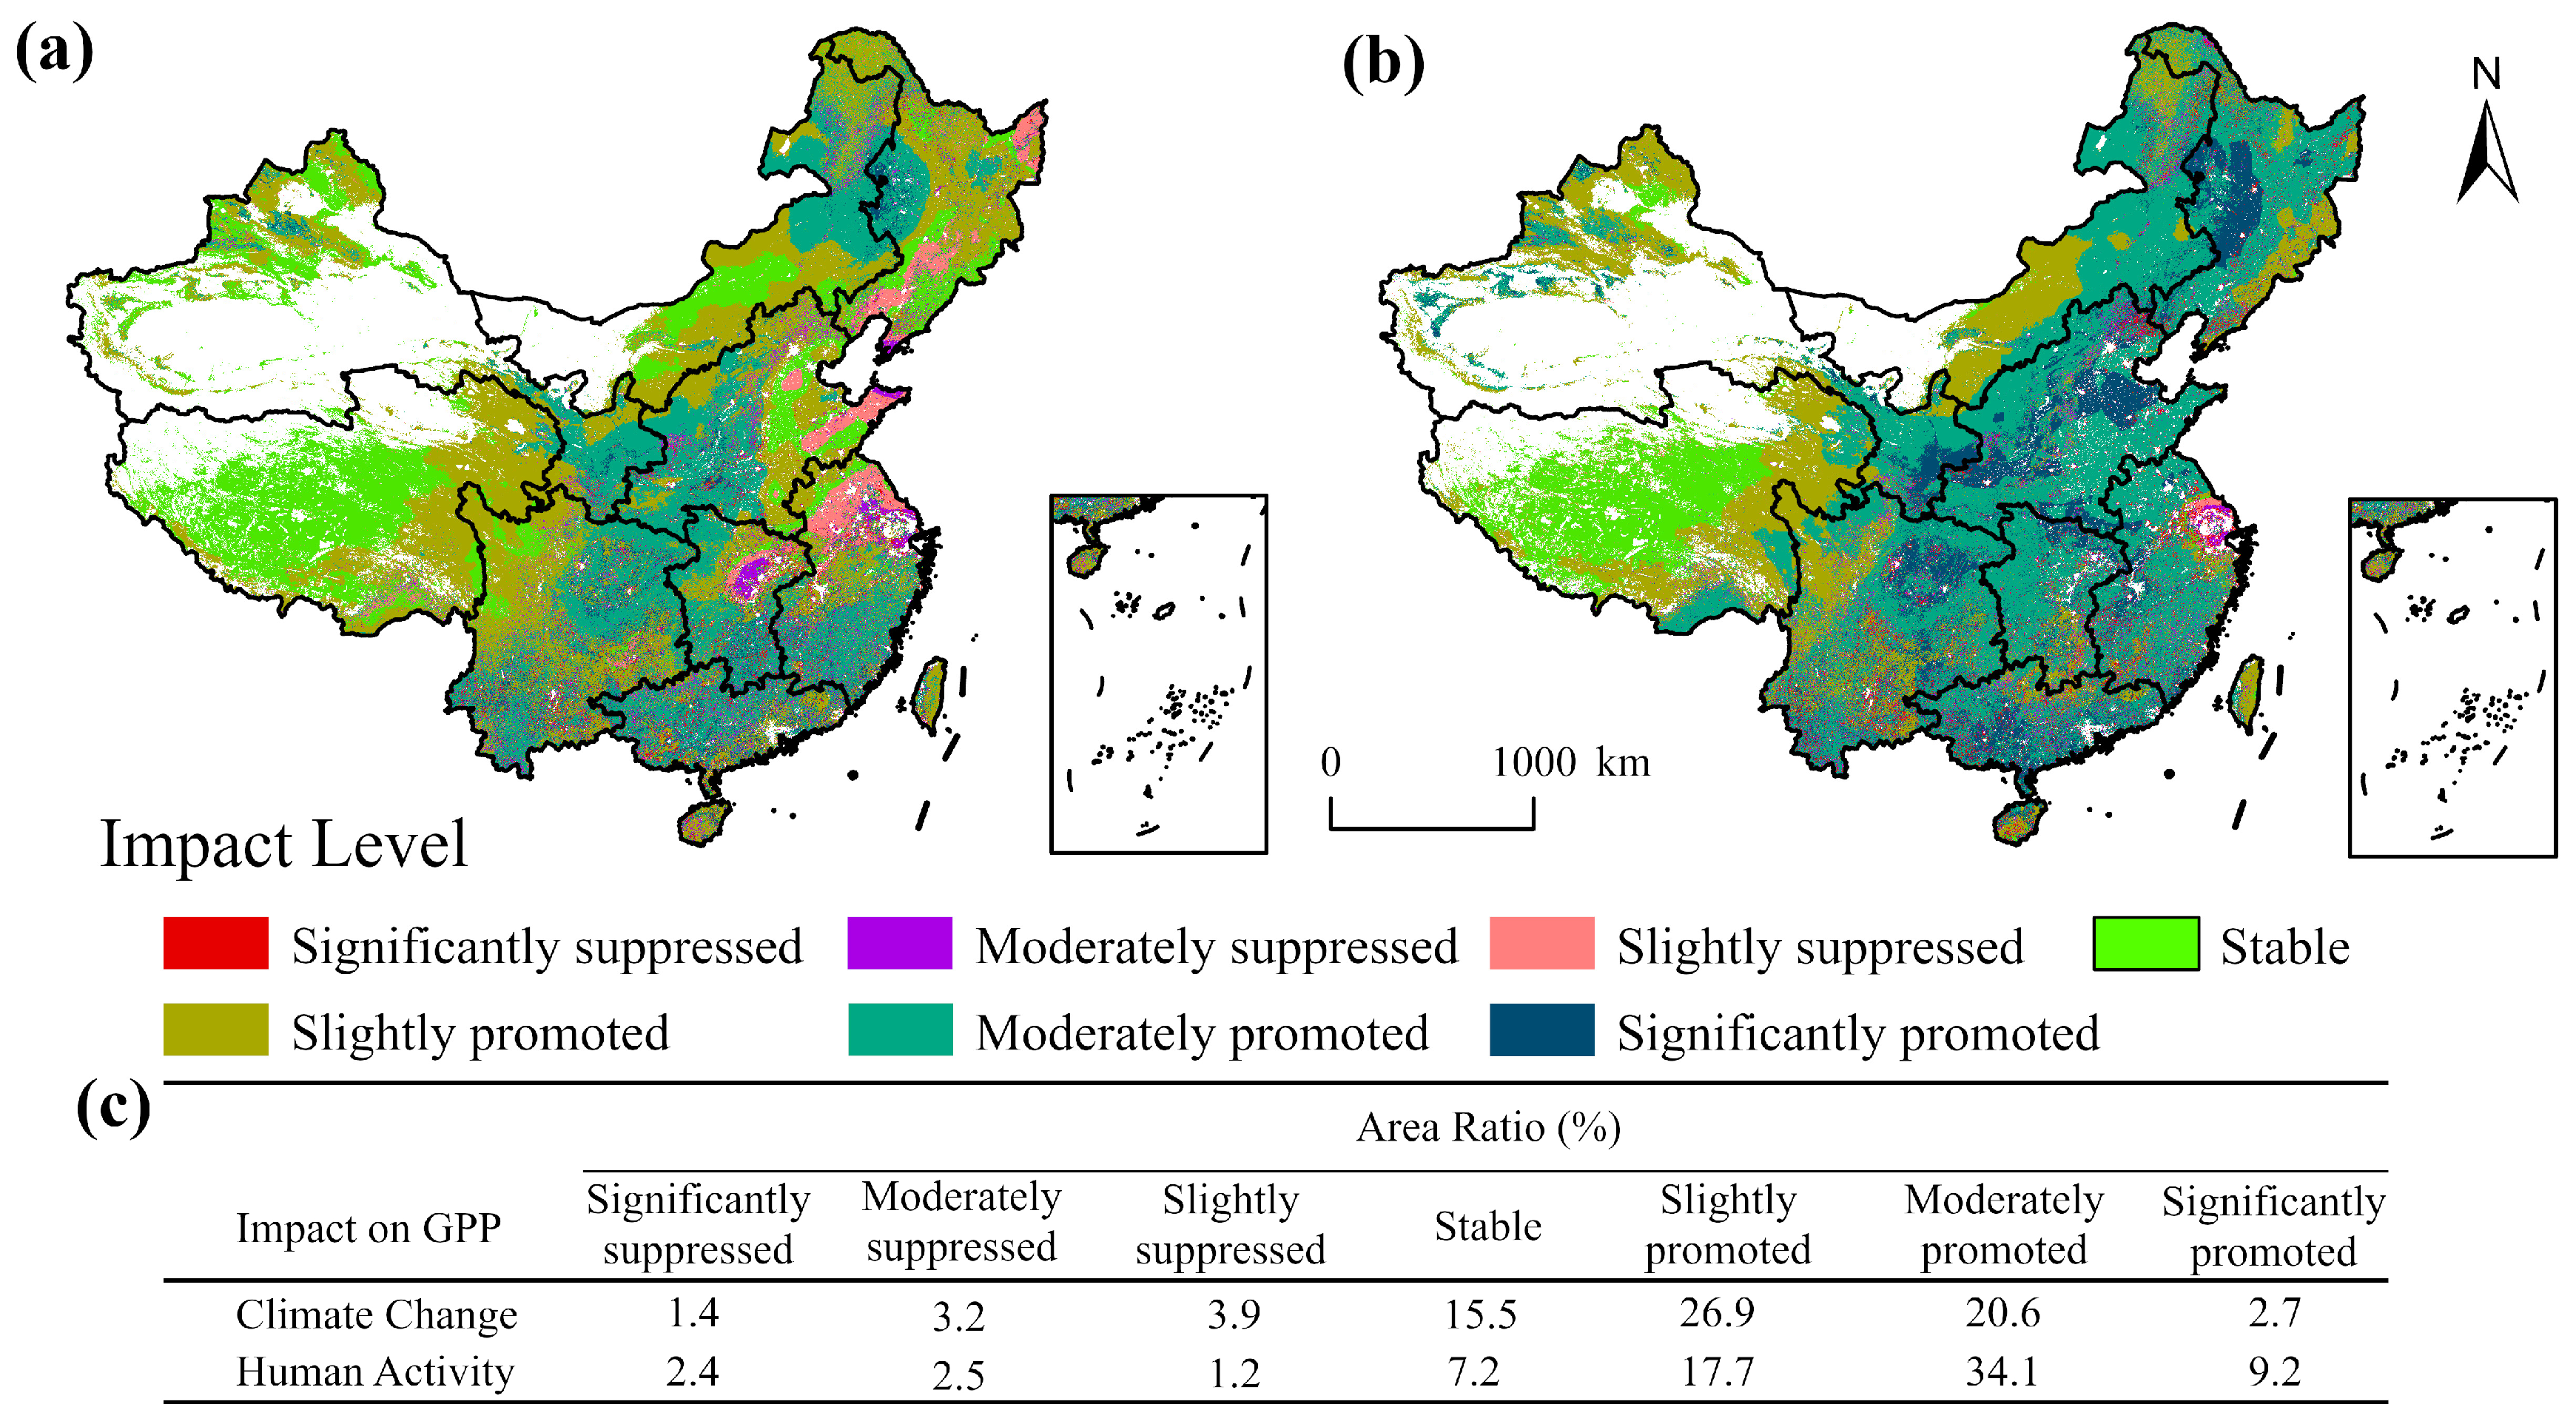
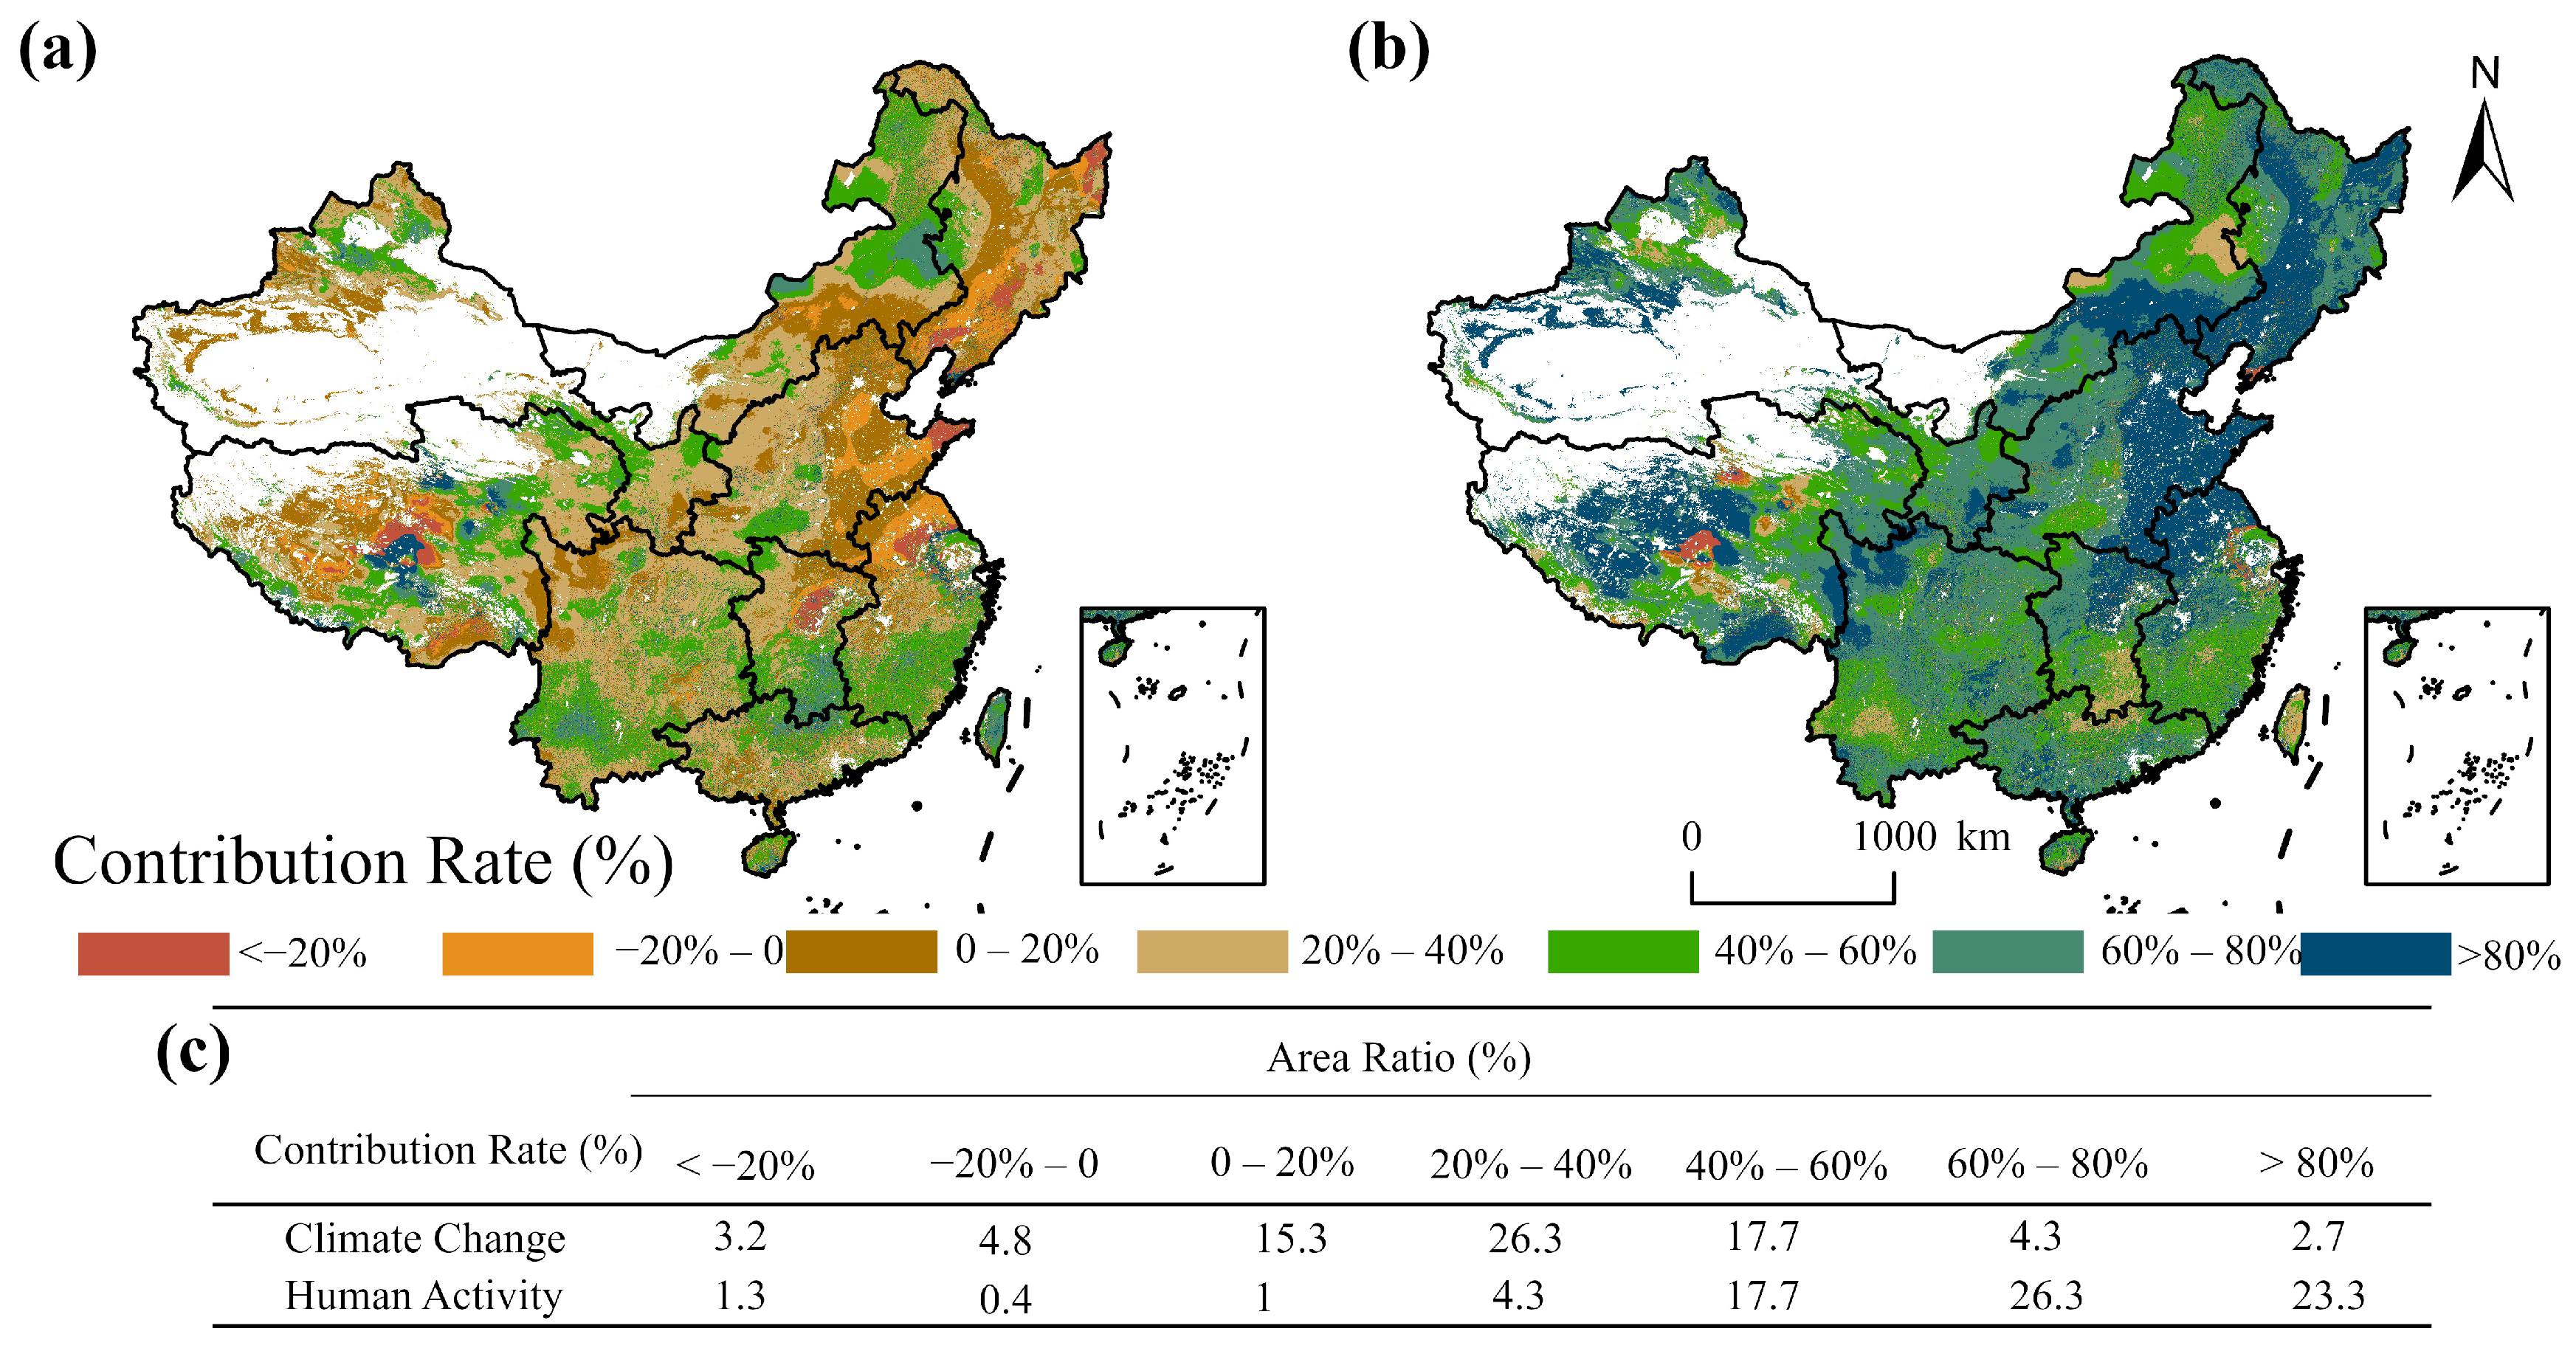
3.4. Drivers of China’s GPP Change and Their Relative Contributions

The regions where climate change contributed (CCC) to GPP were equal to an area of approximately 50.2% (Figure 7a). The regions where it contributed moderately and significantly were equal to an area of approximately 23.3%, mainly in the junction regions of NWC, NC, SWC, CC, IM, and NEC. The area where climate change suppressed GPP was approximately 8.6%. The area where GPP moderately and significantly decreased was approximately 4.7%, mainly in the central region of CC, the eastern coastal region of NC, the southern region of NEC, and the northeastern region of SEC. The areas where human activity contributed (CHA) to GPP accounted for approximately 61.1% of the total area (Figure 7b). The area of moderate and significant contribution of human activities to GPP was larger than that of climate change (approximately 43.3%). The regions where human activities suppressed GPP accounted for approximately 6.1%, and these regions were mainly in the northern part of the NC and the northeastern part of the SEC.
Figure 8a shows that approximately 66.4% of the regional CCC had a positive effect on GPP. The area with a contribution between 0% and 60% was larger, accounting for 59.4% of the total area, and the area with a contribution greater than 80% accounted for approximately 2.7% of the total area, which was mainly concentrated in the central part of the TP and the eastern coast of the SEC. The regions with negative CCC to GPP accounted for approximately 8.1% of the total area, which was mainly distributed in the southern part of the NEC, the eastern part of the NC, the northern part of the SEC, the TP, and the central part of the CC. Figure 8b shows that approximately 72.6% of the regional CHA had a positive effect on GPP. Within this range, the areas with contributions in the range of 40% to 80% and greater than 80% are larger, and these areas account for approximately 67.4% of the total area. The areas with a contribution rate of more than 80% are mainly concentrated in NEC, NC, the TP, and NWC, with an area share of 23.3%. The regions with negative CHA to GPP accounted for approximately 1.8% of the total area and were mainly concentrated in the central part of the TP and the northeastern coastal area of the SEC. In comparison, the contribution of HA was greater than that of CC in most regions. The contributions of climate change and human activities to changes in the gross primary productivity of vegetation in China were approximately 28% and 72%, respectively.
At the regional scale, the CCC ranged from 18% to 37%, as shown in Figure 9. Among them, the CCC in the SWC, TP, IM, and SC regions were greater than 30%; the highest contribution was in the IM and SWC regions, both with 37%, and the lowest was in the NC region, with 18%. The CHA ranged from 63% to 82%; statistically, the CHA exceeded 60% in all nine ecoregions; the highest was 82% in NC, and the lowest was 63% in IM.

4. Discussion

4.1. The Influence of Climate Change on China’s Dynamic Changes in GPP

The relationships between GPP and climate factors in China show significant spatial heterogeneity. At higher elevations and latitudes (e.g., the TP) (Figure 6d), temperature was positively correlated with GPP. Because the temperature in these areas is low, it affects the activity of vegetation photosynthesis-related enzymes, making temperature the main factor limiting the photosynthetic rate of vegetation [31]. In contrast, solar radiation had an inhibitory effect on vegetation in the TP region [32] (Figure 6b). This result may be due to sufficient solar radiation causing snow and permafrost to melt, increasing the water content of vegetation roots and keeping the soil in an anaerobic state, thus reducing vegetation productivity [33]. In the southern part of the humid region (SWC, CC, and SEC) (Figure 6c), an increase in precipitation reduced temperature and radiation, which led to precipitation suppression of vegetation growth, making GPP significantly negatively correlated with precipitation [34]. In arid and semiarid regions (IM and NWC), GPP was more sensitive to precipitation and had a significant positive correlation with precipitation; precipitation was the main factor affecting GPP in northern China [35]. This was because with the increase in global warming, the water demand of vegetation in arid regions has increased significantly compared to that in non-arid regions [36]. Jiao [37] also noted that vegetation water constraints are associated with greening trends, which leads to vegetation becoming increasingly sensitive to precipitation.
In recent years, it has been concluded that aerosol optical depth (AOD) can enhance scattered radiation by weakening direct radiation and total radiation, thereby promoting or inhibiting vegetation photosynthesis [38]. This has attracted increasing attention from scholars to the impact of AOD on GPP [39]. At the regional scale, GPP was significantly positively correlated with AOD in most of the regions. These regions were significantly negatively correlated with solar radiation and vice versa (Figure 6a,e). This phenomenon indicates that when vegetation is undergoing photosynthesis, the high canopy of vegetation can absorb both direct and scattered radiation and easily reach light saturation, after which photosynthesis is inhibited with increasing solar radiation [40,41]. In contrast, as AOD increases, direct radiation is attenuated, and the proportion of scattered radiation increases, resulting in an increase in radiation absorbed by shady lower canopy leaves that have not yet reached light saturation, thereby improving productivity [42]. In the northwestern region of NWC, AOD had a significant positive correlation with GPP, which may be related to the vegetation types of grassland, ENF and desert in this region [43]. In the SWC and SC regions, GPP had a large and significant negative correlation with AOD. This phenomenon was due to the reduction in total radiation, which decreased the productivity of more complex ecosystems, such as forests, at a level greater than the compensatory effect of scattered radiation, thus reducing overall productivity [43]. GPP was also significantly negatively correlated with AOD in IM and its surrounding areas. As the vegetation type in the zone was mostly grassland, where AOD leads to a reduction in direct radiation, the canopy structure of grassland is simpler, so it cannot sufficiently absorb scattered radiation [44].

4.2. The Influence of Human Activities on China’s GPP Dynamic Changes

The effects of climate change and anthropogenic activities on increasing GPP trends were 1.39 and 5.67 g C m−2 yr−1, respectively. Anthropogenic activities had a greater positive impact on GPP than did climate change, showing that anthropogenic activities are the dominant factor in China’s GPP growth. Zhang [45] also showed that anthropogenic activities had a stronger effect on vegetation changes than did climate change. The overall trend of change was positive, showing that China’s ecological construction and protection projects have been effective [46]. Zhang [47] reported that China’s forest area increased by 13.48% from 2001 to 2015. By 2020, the forest area had increased to 16%, with the increase obtained mainly by the conversion of shrubland and savanna types (Figure S4). According to the eighth consecutive inventory of forest resources in China, compared with the second inventory, China’s plantation forest preservation area increased by 2.13 times, and the plantation forest stock increased by approximately five times [48]. This conclusion is in agreement with the regions covered in this paper where the GPP growth trend was greater than 10 g C m−2 yr−1. Against the background of the continuous reduction in global forest area, the average annual growth rate of China’s forest coverage was the highest in the world, especially in terms of the growth of artificial forest area, accounting for approximately 41% of the global afforestation rate [49]. China’s forest ecosystems have had a significant carbon sink function in the last two decades [50]. Notably, land use changes caused by human activities are also among the key factors affecting vegetation GPP [51]. Among them, the promotion of agricultural intensification techniques, such as replanting [52] and various irrigation techniques [53], has greatly contributed to the increase in GPP in farmlands in China. Zhong [54] noted that the grain output of farmland in China has increased by more than 35% since 2000. In this paper, by comparing the land use data from 2001 to 2020, we found that the area of cultivated land in China increased by 3%; this increase was mainly obtained by the conversion of grassland and savanna vegetation types to crops through the ecological reclamation activities of adjusting land use [55] (Figure S4). The spatial distribution of cropland coincided with regions with greater positive anthropogenic contributions (Figure 8b). However, crops are seasonal [56], and after crops and straw are harvested and consumed during the nongrowing season, carbon is no longer stored [57]. With the respiration of microorganisms in the soil and the decomposition of soil residual fertilizers, the carbon exchange process between farmland ecosystems and other systems intensifies [58]. Therefore, many scholars generally believe that the carbon sink of crops is zero [59]. The DTEC model was driven by remote sensing data to assess the productivity of terrestrial ecosystems. Therefore, this model only focuses on the carbon sequestration effect of vegetation. For issues such as carbon exchange in nongrowing seasons and soil carbon consumption in farmland ecosystems, this model’s mechanism cannot be reflected at present, so we will not discuss it too much here.
There were significant regional variations in the effects of anthropogenic activities on GPP. A comparison of the trends of human activity in the nine regions revealed that the difference between the extremes was 15.66 g C m−2 yr−1. The NC area was the most effective area for implementing vegetation construction projects [60], and the relative contribution of human activities was also the highest (82%). The regions with growth trends greater than 10 g C m−2 yr−1 (NEC, NC, SC, SWC, and CC) all corresponded to the major areas in China’s afforestation program (Figure 10); this finding was consistent with that of Cai [61], and in the abovementioned areas, the contribution of human activities exceeded 62%. This result highlights the positive effect of ecological engineering on China’s vegetation GPP [62]. However, there are also studies showing the negative impacts of afforestation [63]. For example, in the Loess Plateau region, afforestation has led to increasing negative impacts such as deep soil drying, erosion, and water scarcity [64]. Cai [65] suggested that nonnative forests are not suitable for controlling erosion in the Loess Plateau region unless there is a protective ground cover of herbaceous plants. In arid and semiarid grassland areas, artificial herbs consume more water than natural herbs, which can easily lead to soil degradation and further environmental degradation in ecologically fragile areas [66]. Therefore, in the future, we should further strengthen the construction of ecological engineering in ecologically fragile areas and degraded vegetation areas to realize the coupling between China’s urbanization and development and the quality of the natural environment.

4.3. DTEC Model Evaluation

The results of this study show that the accuracy and applicability of the DTEC model in China were greater than those of the GO-SIF and MOD17 products. The model parameters in this paper do not use the parameters given in previous studies but were adjusted and modified for the Chinese region on the basis of the original parameters to conform to the characteristics of vegetation in China, which is one of the reasons why the accuracy of the DTEC model is higher than that of the other two models in China. Second, it distinguishes the LUE of C4 and C3 vegetation, which can be seen in the accuracy validation of the farmland site. The simulation accuracy of the DTEC model is significantly better than that of the GO-SIF and MOD17 products. As farmland ecosystems are the most active carbon reservoirs in terrestrial ecosystems, the high-accuracy estimation of the GPP of farmland ecosystems will be effective in reducing the error in the simulation of the total amount of China’s terrestrial GPP. Finally, the effect of scattered radiation on vegetation photosynthesis was considered. In the past, the LUE of low-canopy vegetation leaves was often underestimated [67], which made the simulation error larger in areas with complex vegetation structures and dense canopies, such as tropical rainforests, while the DTEC model considered this problem and effectively improved the simulation accuracy in these areas. In summary, the DTEC model has good applicability in China and can meet the needs of subsequent studies.

4.4. Uncertainties and Limitations

The DTEC model distinguishes the different light-use efficiencies of C3 and C4 plants in GPP calculations; however, due to the lack of large-scale, long-term, and high-resolution C3 and C4 vegetation type data, we can use only a static map of C3 and C4 vegetation for GPP estimation, which affects the estimation accuracy of GPP. The atmospheric CO2 concentration is an important factor affecting photosynthetic efficiency because vegetation adjusts leaf chemistry in response to elevated CO2 concentrations [68], leading to changes in photosynthetic capacity [69]. Accounting for the CO2 fertilization effect (CFE) in models can improve GPP estimates to reproduce long-term changes [70], and studies [71] have also shown that accounting for the CFE can better capture long-term trends in elevated GPP in the tropics; the CFE can also better explain and quantify the causes of global vegetation greening [72]. CFE should be incorporated into models in future studies.

5. Conclusions

In this study, the diffuse fraction-based two-leaf light-use efficiency (DTEC) model was used to calculate China’s gross primary productivity (GPP) from 2001 to 2020, and the contributions of climate change (temperature, precipitation, solar radiation, and aerosol optical depth) and human activities to China’s GPP were further investigated. The results showed that the DTEC model has good applicability in China compared with the 10 flux sites, and its overall accuracy coefficients were R2 = 0.85, RMSE = 41.12 g C m−2 month−1, and bias = 5.98 g C m−2 month−1, which achieved great accuracy for different vegetation types. From 2001 to 2020, 67.29% of China’s regions showed an increasing trend in GPP, with an average increasing trend of 9.77 g C m−2 yr−1 (p < 0.01), and within different ecological regions, the increasing trend in GPP ranged from 20.65 to 2.03 g C m−2 yr−1 (p < 0.01). Temperature has a greater impact on GPP than precipitation, solar radiation, and aerosol optical depth under climate change, especially on the Qinghai–Tibet Plateau. In addition, multiple regression residual methods show that there is great spatial heterogeneity in the impacts of climate change and human activities on China’s GPP. The impacts on GPP growth were 1.39 and 5.67 g C m−2 yr−1, respectively, and the relative contributions were 28% and 72%, respectively. Our conclusions show that human activities, mainly ecological restoration projects and agricultural intensification technologies, have been the main driving force behind China’s GPP growth over the past 20 years.

Supplementary Materials

The following supporting information can be downloaded at: https://www.mdpi.com/article/10.3390/rs16081361/s1, Figure S1: Inter-annual changes in China’s GPP from 2001 to 2020, where DTEC stands for the simulated value of the DTEC model, SIF stands for the simulated value of the GO-SIF model, and MOD17 stands for the simulated value of the MOD17 model. Figure S2: Spatial distribution of the annual mean values of GPP from 2001 to 2020: GO-SIF (a), MOD17 (b), and DTEC (c). Among them, the darker the blue color, the higher the value of GPP in the region. Figure S3: Spatial distribution of GPP passing the significance test for 2001–2020: GO-SIF (a), MOD17 (b), and DTEC (c). Among them, the darker the blue color, the higher the trend of GPP growth in the region. Figure S4: Spatial distribution of land use types in China from 2001 (a) to 2020 (b) and conversion between different land use types from 2001 to 2020 (c). The land use types in China were resampled into six: forest, shrubland, savanna, grassland, crop, and non-vegetated area (NOA). Table S1: Grading of the impact of GPPCC and GPPHA. Table S2: Determination Criteria for Drivers of China’s GPP Changes and Calculation Method of Contribution Rate.

Author Contributions

Methodology, writing original draft, J.P.; conceptualization, review and editing, Y.X.; methodology and resources, N.P., Y.Z. and H.L.; review and editing, F.Z. All authors contributed to the editing of the manuscript. All authors have read and agreed to the published version of the manuscript.

Funding

This study was financially supported by the Key Research and Development Program of the Xinjiang Uygur Autonomous Region (Grant Number: 2022B01012), the National Nature Science Foundation of China (Grant Number: 42301127), the Ph.D. Start-up Fund in Xinjiang University (Grant Number: 620321046), and the Tianchi Doctor Program of the Xinjiang Uygur Autonomous Region (Grant Number: TCBS202140).

Data Availability Statement

Data sharing is not applicable to this article.

Acknowledgments

We are sincerely grateful to the reviewers and editors for their constructive comments towards the improvement of the manuscript.

Conflicts of Interest

The authors declare no conflicts of interest.

References

  1. Friedlingstein, P.; Jones, M.W.; O’Sullivan, M.; Andrew, R.M.; Hauck, J.; Peters, G.P.; Peters, W.; Pongratz, J.; Sitch, S.; Le Quéré, C.; et al. Global Carbon Budget 2019. Earth Syst. Sci. Data 2019, 11, 1783–1838. [Google Scholar] [CrossRef]
  2. Chen, C.; Park, T.; Wang, X.; Piao, S.; Xu, B.; Chaturvedi, R.K.; Fuchs, R.; Brovkin, V.; Ciais, P.; Fensholt, R.; et al. China and India Lead in Greening of the World through Land-Use Management. Nat. Sustain. 2019, 2, 122–129. [Google Scholar] [CrossRef] [PubMed]
  3. Wang, S.; Zhang, Y.; Ju, W.; Chen, J.M.; Ciais, P.; Cescatti, A.; Sardans, J.; Janssens, I.A.; Wu, M.; Berry, J.A.; et al. Recent Global Decline of CO2 Fertilization Effects on Vegetation Photosynthesis. Science 2020, 370, 1295–1300. [Google Scholar] [CrossRef] [PubMed]
  4. Xiao, J.; Chevallier, F.; Gomez, C.; Guanter, L.; Hicke, J.A.; Huete, A.R.; Ichii, K.; Ni, W.; Pang, Y.; Rahman, A.F. Remote Sensing of the Terrestrial Carbon Cycle: A Review of Advances over 50 Years. Remote Sens. Environ. 2019, 233, 111383. [Google Scholar] [CrossRef]
  5. Wofsy, S.C.; Goulden, M.L.; Munger, J.W.; Fan, S.-M.; Bakwin, P.S.; Daube, B.C.; Bassow, S.L.; Bazzaz, F.A. Net Exchange of CO2 in a Mid-Latitude Forest. Science 1993, 260, 1314–1317. [Google Scholar] [CrossRef] [PubMed]
  6. Wang, X.; Ma, M.; Li, X.; Song, Y.; Tan, J.; Huang, G.; Zhang, Z.; Zhao, T.; Feng, J.; Ma, Z.; et al. Validation of MODIS-GPP Product at 10 Flux Sites in Northern China. Int. J. Remote Sens. 2013, 34, 587–599. [Google Scholar] [CrossRef]
  7. Zhang, F.; Chen, J.M.; Chen, J.; Gough, C.M.; Martin, T.A.; Dragoni, D. Evaluating Spatial and Temporal Patterns of MODIS GPP over the Conterminous U.S. against Flux Measurements and a Process Model. Remote Sens. Environ. 2012, 124, 717–729. [Google Scholar] [CrossRef]
  8. Zhang, K.; Kimball, J.S.; Running, S.W. A Review of Remote Sensing Based Actual Evapotranspiration Estimation. WIREs Water 2016, 3, 834–853. [Google Scholar] [CrossRef]
  9. Yan, H.; Wang, S.; Billesbach, D.; Oechel, W.; Bohrer, G.; Meyers, T.; Martin, T.A.; Matamala, R.; Phillips, R.P.; Rahman, F.; et al. Improved Global Simulations of Gross Primary Product Based on a New Definition of Water Stress Factor and a Separate Treatment of C3 and C4 Plants. Ecol. Model. 2015, 297, 42–59. [Google Scholar] [CrossRef]
  10. He, M.; Ju, W.; Zhou, Y.; Chen, J.; He, H.; Wang, S.; Wang, H.; Guan, D.; Yan, J.; Li, Y.; et al. Development of a Two-Leaf Light Use Efficiency Model for Improving the Calculation of Terrestrial Gross Primary Productivity. Agric. For. Meteorol. 2013, 173, 28–39. [Google Scholar] [CrossRef]
  11. Yan, H.; Wang, S.-Q.; Yu, K.-L.; Wang, B.; Yu, Q.; Bohrer, G.; Billesbach, D.; Bracho, R.; Rahman, F.; Shugart, H.H. A Novel Diffuse Fraction-Based Two-Leaf Light Use Efficiency Model: An Application Quantifying Photosynthetic Seasonality across 20 AmeriFlux Flux Tower Sites. J. Adv. Model. Earth Syst. 2017, 9, 2317–2332. [Google Scholar] [CrossRef]
  12. Kanniah, K.D.; Beringer, J.; Hutley, L. Exploring the Link between Clouds, Radiation, and Canopy Productivity of Tropical Savannas. Agric. For. Meteorol. 2013, 182, 304–313. [Google Scholar] [CrossRef]
  13. Cao, D.; Zhang, J.; Yan, H.; Xun, L.; Yang, S.; Bai, Y.; Zhang, S.; Yao, F.; Zhou, W. Regional Assessment of Climate Potential Productivity of Terrestrial Ecosystems and Its Responses to Climate Change Over China From 1980–2018. IEEE Access 2020, 8, 11138–11151. [Google Scholar] [CrossRef]
  14. Yang, J.; Zhang, X.C.; Luo, Z.H.; Yu, X.J. Nonlinear Variations of Net Primary Productivity and Its Relationship with Climate and Vegetation Phenology, China. Forests 2017, 8, 361. [Google Scholar] [CrossRef]
  15. Wild, M.; Trüssel, B.; Ohmura, A.; Long, C.N.; König-Langlo, G.; Dutton, E.G.; Tsvetkov, A. Global Dimming and Brightening: An Update beyond 2000. J. Geophys. Res. Atmos. 2009, 114. [Google Scholar] [CrossRef]
  16. von Buttlar, J.; Zscheischler, J.; Rammig, A.; Sippel, S.; Reichstein, M.; Knohl, A.; Jung, M.; Menzer, O.; Arain, M.A.; Buchmann, N.; et al. Impacts of Droughts and Extreme-Temperature Events on Gross Primary Production and Ecosystem Respiration: A Systematic Assessment across Ecosystems and Climate Zones. Biogeosciences 2018, 15, 1293–1318. [Google Scholar] [CrossRef]
  17. Batunacun; Wieland, R.; Lakes, T.; Nendel, C. Using Shapley Additive Explanations to Interpret Extreme Gradient Boosting Predictions of Grassland Degradation in Xilingol, China. Geosci. Model Dev. 2021, 14, 1493–1510. [Google Scholar] [CrossRef]
  18. Xue, Y.; Liang, H.; Zhang, B.; He, C. Vegetation Restoration Dominated the Variation of Water Use Efficiency in China. J. Hydrol. 2022, 612, 128257. [Google Scholar] [CrossRef]
  19. Xue, Y.; Liang, H.; Ma, Y.; Xue, G.; He, J. The Impacts of Climate and Human Activities on Grassland Productivity Variation in China. Remote Sens. 2023, 15, 3864. [Google Scholar] [CrossRef]
  20. Yang, K.; Sun, W.; Luo, Y.; Zhao, L. Impact of Urban Expansion on Vegetation: The Case of China (2000–2018). J. Environ. Manag. 2021, 291, 112598. [Google Scholar] [CrossRef] [PubMed]
  21. Piao, S.; Ciais, P.; Huang, Y.; Shen, Z.; Peng, S.; Li, J.; Zhou, L.; Liu, H.; Ma, Y.; Ding, Y.; et al. The Impacts of Climate Change on Water Resources and Agriculture in China. Nature 2010, 467, 43–51. [Google Scholar] [CrossRef] [PubMed]
  22. Mallapaty, S. How China Could Be Carbon Neutral by Mid-Century. Nature 2020, 586, 482–483. [Google Scholar] [CrossRef]
  23. Doelman, J.C.; Stehfest, E.; van Vuuren, D.P.; Tabeau, A.; Hof, A.F.; Braakhekke, M.C.; Gernaat, D.E.H.J.; van den Berg, M.; van Zeist, W.-J.; Daioglou, V.; et al. Afforestation for Climate Change Mitigation: Potentials, Risks and Trade-Offs. Glob. Chang. Biol. 2020, 26, 1576–1591. [Google Scholar] [CrossRef] [PubMed]
  24. Chen, Y.; Feng, X.; Tian, H.; Wu, X.; Gao, Z.; Feng, Y.; Piao, S.; Lv, N.; Pan, N.; Fu, B. Accelerated Increase in Vegetation Carbon Sequestration in China after 2010: A Turning Point Resulting from Climate and Human Interaction. Glob. Chang. Biol. 2021, 27, 5848–5864. [Google Scholar] [CrossRef] [PubMed]
  25. Piao, S.; Fang, J.; Ciais, P.; Peylin, P.; Huang, Y.; Sitch, S.; Wang, T. The Carbon Balance of Terrestrial Ecosystems in China. Nature 2009, 458, 1009–1013. [Google Scholar] [CrossRef] [PubMed]
  26. Jiang, W.; Yuan, L.; Wang, W.; Cao, R.; Zhang, Y.; Shen, W. Spatio-Temporal Analysis of Vegetation Variation in the Yellow River Basin. Ecol. Indic. 2015, 51, 117–126. [Google Scholar] [CrossRef]
  27. Qu, S.; Wang, L.; Lin, A.; Yu, D.; Yuan, M.; Li, C. Distinguishing the Impacts of Climate Change and Anthropogenic Factors on Vegetation Dynamics in the Yangtze River Basin, China. Ecol. Indic. 2020, 108, 105724. [Google Scholar] [CrossRef]
  28. Evans, J.; Geerken, R. Discrimination between Climate and Human-Induced Dryland Degradation. J. Arid Environ. 2004, 57, 535–554. [Google Scholar] [CrossRef]
  29. Badgley, G.; Anderegg, L.D.L.; Berry, J.A.; Field, C.B. Terrestrial Gross Primary Production: Using NIRV to Scale from Site to Globe. Glob. Chang. Biol. 2019, 25, 3731–3740. [Google Scholar] [CrossRef] [PubMed]
  30. Jin, K.; Wang, F.; Zong, Q.; Qin, P.; Liu, C.; Wang, S. Spatiotemporal Differences in Climate Change Impacts on Vegetation Cover in China from 1982 to 2015. Environ. Sci. Pollut. Res. 2022, 29, 10263–10276. [Google Scholar] [CrossRef] [PubMed]
  31. Keenan, T.F.; Riley, W.J. Greening of the Land Surface in the World’s Cold Regions Consistent with Recent Warming. Nat. Clim. Chang. 2018, 8, 825–828. [Google Scholar] [CrossRef] [PubMed]
  32. Luo, L.; Ma, W.; Zhuang, Y.; Zhang, Y.; Yi, S.; Xu, J.; Long, Y.; Ma, D.; Zhang, Z. The Impacts of Climate Change and Human Activities on Alpine Vegetation and Permafrost in the Qinghai-Tibet Engineering Corridor. Ecol. Indic. 2018, 93, 24–35. [Google Scholar] [CrossRef]
  33. Yang, Y.; Guan, H.; Shen, M.; Liang, W.; Jiang, L. Changes in Autumn Vegetation Dormancy Onset Date and the Climate Controls across Temperate Ecosystems in China from 1982 to 2010. Glob. Chang. Biol. 2015, 21, 652–665. [Google Scholar] [CrossRef] [PubMed]
  34. Nemani, R.R.; Keeling, C.D.; Hashimoto, H.; Jolly, W.M.; Piper, S.C.; Tucker, C.J.; Myneni, R.B.; Running, S.W. Climate-Driven Increases in Global Terrestrial Net Primary Production from 1982 to 1999. Science 2003, 300, 1560–1563. [Google Scholar] [CrossRef] [PubMed]
  35. Shi, S.; Yu, J.; Wang, F.; Wang, P.; Zhang, Y.; Jin, K. Quantitative Contributions of Climate Change and Human Activities to Vegetation Changes over Multiple Time Scales on the Loess Plateau. Sci. Total Environ. 2021, 755, 142419. [Google Scholar] [CrossRef] [PubMed]
  36. Lai, W.; Wang, M.; Wei, J.; Zhang, J.; Song, J.; Zhou, H.; Chou, S.; Wang, Y. Separating the Impact of Climate Changes and Human Activities on Vegetation Growth Based on the NDVI in China. Adv. Meteorol. 2022, 2022, e6294029. [Google Scholar] [CrossRef]
  37. Jiao, W.; Wang, L.; Smith, W.K.; Chang, Q.; Wang, H.; D’Odorico, P. Observed Increasing Water Constraint on Vegetation Growth over the Last Three Decades. Nat. Commun. 2021, 12, 3777. [Google Scholar] [CrossRef] [PubMed]
  38. Shu, Y.; Liu, S.; Wang, Z.; Xiao, J.; Shi, Y.; Peng, X.; Gao, H.; Wang, Y.; Yuan, W.; Yan, W.; et al. Effects of Aerosols on Gross Primary Production from Ecosystems to the Globe. Remote Sens. 2022, 14, 2759. [Google Scholar] [CrossRef]
  39. Ma, W.; Ding, J.; Wang, J.; Zhang, J. Effects of Aerosol on Terrestrial Gross Primary Productivity in Central Asia. Atmos. Environ. 2022, 288, 119294. [Google Scholar] [CrossRef]
  40. Kanniah, K.D.; Beringer, J.; North, P.; Hutley, L. Control of Atmospheric Particles on Diffuse Radiation and Terrestrial Plant Productivity: A Review. Prog. Phys. Geogr. Earth Environ. 2012, 36, 209–237. [Google Scholar] [CrossRef]
  41. Urban, O.; Janouš, D.; Acosta, M.; Czerný, R.; Marková, I.; Navrátil, M.; Pavelka, M.; Pokorný, R.; Šprtová, M.; Zhang, R.; et al. Ecophysiological Controls over the Net Ecosystem Exchange of Mountain Spruce Stand. Comparison of the Response in Direct vs. Diffuse Solar Radiation. Glob. Chang. Biol. 2007, 13, 157–168. [Google Scholar] [CrossRef]
  42. Zan, M.; Zhou, Y.; Ju, W.; Zhang, Y.; Zhang, L.; Liu, Y. Performance of a Two-Leaf Light Use Efficiency Model for Mapping Gross Primary Productivity against Remotely Sensed Sun-Induced Chlorophyll Fluorescence Data. Sci. Total Environ. 2018, 613–614, 977–989. [Google Scholar] [CrossRef] [PubMed]
  43. Cirino, G.G.; Souza, R.A.F.; Adams, D.K.; Artaxo, P. The Effect of Atmospheric Aerosol Particles and Clouds on Net Ecosystem Exchange in the Amazon. Atmos. Chem. Phys. 2014, 14, 6523–6543. [Google Scholar] [CrossRef]
  44. Niyogi, D.; Chang, H.-I.; Saxena, V.K.; Holt, T.; Alapaty, K.; Booker, F.; Chen, F.; Davis, K.J.; Holben, B.; Matsui, T. Direct Observations of the Effects of Aerosol Loading on Net Ecosystem CO2 Exchanges over Different Landscapes. Geophys. Res. Lett. 2004, 31. [Google Scholar] [CrossRef]
  45. Zhang, X.; Huang, X. Human Disturbance Caused Stronger Influences on Global Vegetation Change than Climate Change. PeerJ 2019, 7, e7763. [Google Scholar] [CrossRef] [PubMed]
  46. Chen, J.M.; Ju, W.; Ciais, P.; Viovy, N.; Liu, R.; Liu, Y.; Lu, X. Vegetation Structural Change since 1981 Significantly Enhanced the Terrestrial Carbon Sink. Nat. Commun. 2019, 10, 4259. [Google Scholar] [CrossRef] [PubMed]
  47. Zhang, Y.; Xiao, X.; Jin, C.; Dong, J.; Zhou, S.; Wagle, P.; Joiner, J.; Guanter, L.; Zhang, Y.; Zhang, G.; et al. Consistency between Sun-Induced Chlorophyll Fluorescence and Gross Primary Production of Vegetation in North America. Remote Sens. Environ. 2016, 183, 154–169. [Google Scholar] [CrossRef]
  48. Yu, Z.; You, W.; Agathokleous, E.; Zhou, G.; Liu, S. Forest Management Required for Consistent Carbon Sink in China’s Forest Plantations. For. Ecosyst. 2021, 8, 54. [Google Scholar] [CrossRef]
  49. Zhang, L.; Sun, P.; Huettmann, F.; Liu, S. Where Should China Practice Forestry in a Warming World? Glob. Chang. Biol. 2022, 28, 2461–2475. [Google Scholar] [CrossRef] [PubMed]
  50. Qiu, Z.; Feng, Z.; Song, Y.; Li, M.; Zhang, P. Carbon Sequestration Potential of Forest Vegetation in China from 2003 to 2050: Predicting Forest Vegetation Growth Based on Climate and the Environment. J. Clean. Prod. 2020, 252, 119715. [Google Scholar] [CrossRef]
  51. Zhou, Q.; Li, B.; Chen, Y. Remote Sensing Change Detection and Process Analysis of Long-Term Land Use Change and Human Impacts. AMBIO 2011, 40, 807–818. [Google Scholar] [CrossRef] [PubMed]
  52. Zhang, C.; Zhang, H.; Tian, S. Phenology-Assisted Supervised Paddy Rice Mapping with the Landsat Imagery on Google Earth Engine: Experiments in Heilongjiang Province of China from 1990 to 2020. Comput. Electron. Agric. 2023, 212, 108105. [Google Scholar] [CrossRef]
  53. Banerjee, S.; Walder, F.; Büchi, L.; Meyer, M.; Held, A.Y.; Gattinger, A.; Keller, T.; Charles, R.; van der Heijden, M.G.A. Agricultural Intensification Reduces Microbial Network Complexity and the Abundance of Keystone Taxa in Roots. ISME J. 2019, 13, 1722–1736. [Google Scholar] [CrossRef] [PubMed]
  54. Zhong, T.; Mitchell, B.; Scott, S.; Huang, X.; Li, Y.; Lu, X. Growing Centralization in China’s Farmland Protection Policy in Response to Policy Failure and Related Upward-Extending Unwillingness to Protect Farmland since 1978. Environ. Plan. C Polit. Space 2017, 35, 1075–1097. [Google Scholar] [CrossRef]
  55. Gerber, S.; Hedin, L.O.; Keel, S.G.; Pacala, S.W.; Shevliakova, E. Land Use Change and Nitrogen Feedbacks Constrain the Trajectory of the Land Carbon Sink. Geophys. Res. Lett. 2013, 40, 5218–5222. [Google Scholar] [CrossRef]
  56. Huang, M.; Tian, A.; Zhou, X.; Gao, W.; Li, Z.; Chen, G.; Li, Z.; Chen, Y.; Liu, L.; Yin, X.; et al. Yield Performance of Machine-Transplanted Double-Season Rice Grown Following Oilseed Rape. Sci. Rep. 2019, 9, 6818. [Google Scholar] [CrossRef] [PubMed]
  57. Lu, X.; Lu, X. Tillage and Crop Residue Effects on the Energy Consumption, Input–Output Costs and Greenhouse Gas Emissions of Maize Crops. Nutr. Cycl. Agroecosyst. 2017, 108, 323–337. [Google Scholar] [CrossRef]
  58. Almusaed, A. Landscape Ecology: The Influences of Land Use and Anthropogenic Impacts of Landscape Creation; BoD—Books on Demand: Norderstedt, Germany, 2016; ISBN 978-953-51-2513-6. [Google Scholar]
  59. Li, M.; Peng, J.; Lu, Z.; Zhu, P. Research Progress on Carbon Sources and Sinks of Farmland Ecosystems. Resour. Environ. Sustain. 2023, 11, 100099. [Google Scholar] [CrossRef]
  60. Wang, S.; Fu, B.; Piao, S.; Lü, Y.; Ciais, P.; Feng, X.; Wang, Y. Reduced Sediment Transport in the Yellow River Due to Anthropogenic Changes. Nat. Geosci. 2016, 9, 38–41. [Google Scholar] [CrossRef]
  61. Cai, Y.; Zhang, F.; Duan, P.; Yung Jim, C.; Weng Chan, N.; Shi, J.; Liu, C.; Wang, J.; Bahtebay, J.; Ma, X. Vegetation Cover Changes in China Induced by Ecological Restoration-Protection Projects and Land-Use Changes from 2000 to 2020. Catena 2022, 217, 106530. [Google Scholar] [CrossRef]
  62. Chen, P.; Liu, H.; Wang, Z.; Mao, D.; Liang, C.; Wen, L.; Li, Z.; Zhang, J.; Liu, D.; Zhuo, Y. Vegetation Dynamic Assessment by NDVI and Field Observations for Sustainability of China’s Wulagai River Basin. Int. J. Environ. Res. Public Health 2021, 18, 2528. [Google Scholar] [CrossRef] [PubMed]
  63. Niu, Y.; Squires, V.; Jentsch, A. Risks of China’s Increased Forest Area. Science 2023, 379, 447–448. [Google Scholar] [CrossRef] [PubMed]
  64. Wang, Z.; Liu, B.; Liu, G.; Zhang, Y. Soil Water Depletion Depth by Planted Vegetation on the Loess Plateau. Sci. China Ser. Earth Sci. 2009, 52, 835–842. [Google Scholar] [CrossRef]
  65. Jiang, W.; Yang, S.; Yang, X.; Gu, N. Negative Impacts of Afforestation and Economic Forestry on the Chinese Loess Plateau and Proposed Solutions. Quat. Int. 2016, 399, 165–173. [Google Scholar] [CrossRef]
  66. Li, W.; Yan, M.; Qingfeng, Z.; Zhikaun, J. Effects of Vegetation Restoration on Soil Physical Properties in the Wind–Water Erosion Region of the Northern Loess Plateau of China. CLEAN—Soil Air Water 2012, 40, 7–15. [Google Scholar] [CrossRef]
  67. Cheng, S.J.; Bohrer, G.; Steiner, A.L.; Hollinger, D.Y.; Suyker, A.; Phillips, R.P.; Nadelhoffer, K.J. Variations in the Influence of Diffuse Light on Gross Primary Productivity in Temperate Ecosystems. Agric. For. Meteorol. 2015, 201, 98–110. [Google Scholar] [CrossRef]
  68. Smith, N.G.; Keenan, T.F. Mechanisms Underlying Leaf Photosynthetic Acclimation to Warming and Elevated CO2 as Inferred from Least-Cost Optimality Theory. Glob. Chang. Biol. 2020, 26, 5202–5216. [Google Scholar] [CrossRef] [PubMed]
  69. Wu, Q.; Wang, X.; Chen, S.; Wang, L.; Jiang, J. Land Surface Greening and CO2 Fertilization More than Offset the Gross Carbon Sequestration Decline Caused by Land Cover Change and the Enhanced Vapour Pressure Deficit in Europe. Remote Sens. 2023, 15, 1372. [Google Scholar] [CrossRef]
  70. Zheng, Y.; Shen, R.; Wang, Y.; Li, X.; Liu, S.; Liang, S.; Chen, J.M.; Ju, W.; Zhang, L.; Yuan, W. Improved Estimate of Global Gross Primary Production for Reproducing Its Long-Term Variation, 1982–2017. Earth Syst. Sci. Data 2020, 12, 2725–2746. [Google Scholar] [CrossRef]
  71. Kang, Y.; Gaber, M.; Bassiouni, M.; Lu, X.; Keenan, T. CEDAR-GPP: Spatiotemporally Upscaled Estimates of Gross Primary Productivity Incorporating CO2 Fertilization. Earth Syst. Sci. Data Discuss. 2023, 1–51. [Google Scholar] [CrossRef]
  72. Chen, C.; Riley, W.J.; Prentice, I.C.; Keenan, T.F. CO2 Fertilization of Terrestrial Photosynthesis Inferred from Site to Global Scales. Proc. Natl. Acad. Sci. USA 2022, 119, e2115627119. [Google Scholar] [CrossRef]
Figure 1. Elevation, flux tower location distribution and ecological regions in the study area.
Remotesensing 16 01361 g001
Figure 2. Flow charts show the steps and sequences adopted in the present study’s data acquisition and analysis. According to the order of the arrows in the figure, the pictures displayed were: spatial distribution of the multi-year mean value of three GPP models; three model significance test results; DTEC model partial correlation analysis results; residual analysis contribution results; and GPP growth trend in China’s afforestation areas.
Remotesensing 16 01361 g002
Figure 3. The accuracy validation results of the DTEC, GO-SIF, and MOD17 models at 10 flux sites in China, where the x-axis represents the measured data at the flux sites, the y-axis represents the simulated values of the three models, and R2, RMSE, and BIAS were used as the coefficients to evaluate the accuracy of the models.
Remotesensing 16 01361 g003
Figure 4. Annual average trends of GPP in China as a whole and in each ecological region from 2001 to 2020, with different colours representing different ecological regions. Among them, NEC (a) represents Northeast China, IM (e) represents Inner Mongolia, NWC (g) represents Northwest China, NC (c) represents North China, CC (i) represents Central China, TP (f) represents the Tibetan Plateau, SEC (b) represents Southeast China, SC (d) represents South China, SWC (h) represents Southwest China, and Total (j) represents the overall trend of China.
Remotesensing 16 01361 g004
Figure 5. The spatial distribution of the multiyear average of China’s GPP from 2001 to 2020 (a) and the spatial distribution of the GPP trend that passed the significance test (b).
Remotesensing 16 01361 g005
Figure 6. Spatial distribution of partial correlation coefficients between GPP and aerosol optical depth (a), solar radiation (b), precipitation (c), and temperature (d) in China from 2001 to 2020 and partial correlations of nine ecological regions to four climate factor coefficients (e); only pixels that passed the significance test are shown in the figure.
Remotesensing 16 01361 g006
Figure 7. Spatial distribution of the impacts of climate change (a) and human activities (b) on GPP in China from 2001 to 2020 and the percentage of area affected by each impact level (c).
Remotesensing 16 01361 g007
Figure 8. Spatial distribution of the contribution rates of climate change (a) and human activities (b) to the GPP in China from 2001 to 2020 and the area percentage of each contribution rate (c).
Remotesensing 16 01361 g008
Figure 9. Relative contributions of climate change and human activities to GPP in nine eco-regions of China, 2001–2020.
Remotesensing 16 01361 g009
Figure 10. The distribution of GPP changes in China’s major afforestation program from 2001–2020.
Remotesensing 16 01361 g010
Table 1. Flux site details for 10 flux towers in China.
Flux SitesLatitude/°NLongitude/°EVegetation TypePeriod/Year
Changbaishan
(CBS)
42.40128.10Deciduous Broadleaf Forests2004–2010
Dinghushan
(DHS)
23.17112.53Evergreen Broadleaf Forests2004–2010
Dangxiong
(DX)
30.5091.07Grassland2004–2010
Haibei
(HB)
37.62101.32Shrubland2004–2010
Inner Mongolia
(NMG)
43.55116.67Grassland2004–2010
Qianyanzhou
(QYZ)
26.74115.06Evergreen Broadleaf Forests2004–2010
Yucheng
(YC)
36.83116.57Cropland2004–2010
Changling
(CL)
44.59123.51Grassland2007–2010
Ailaoshan
(ALS)
24.54101.29Mixed Forest2009–2012
Yuanjiang
(YJ)
23.47102.18Savannas2014–2015
Disclaimer/Publisher’s Note: The statements, opinions and data contained in all publications are solely those of the individual author(s) and contributor(s) and not of MDPI and/or the editor(s). MDPI and/or the editor(s) disclaim responsibility for any injury to people or property resulting from any ideas, methods, instructions or products referred to in the content.

