
HSAA-CD: A Hierarchical Semantic Aggregation Mechanism and Attention Module for Non-Agricultural Change Detection in Cultivated Land


Abstract
:
1. Introduction
- A hierarchical semantic structure of land-use types for non-agricultural changes in cultivated land is established, and the relationships between different types of changes are analyzed. Taking Hubei Province in China as an example, we select data from five regions to construct a dataset for detecting such changes. The dataset is suitable for cultivated land-change detection. We hope that the dataset will contribute to the innovation of farmland-change monitoring methods and their application
- Aiming at the problems of scattered results and disordered hierarchies in current networks for non-agricultural CD, a hierarchical semantic aggregation mechanism and attention module (HSAA) is proposed. The scattered classification results are aggregated by adding a semantic aggregation layer, and the aggregated types are enhanced by an attention mechanism, thus the accuracy of CD is further improved.
2. Related Work
2.1. RSI Datasets for Change Detection (CD)
2.2. Deep-Learning Methods for Change Detection (CD)
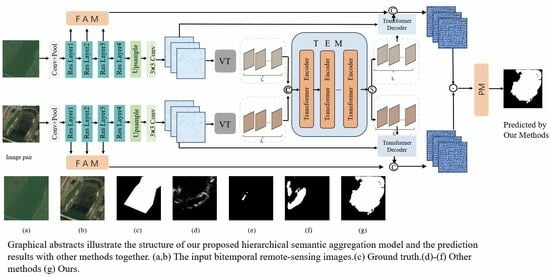
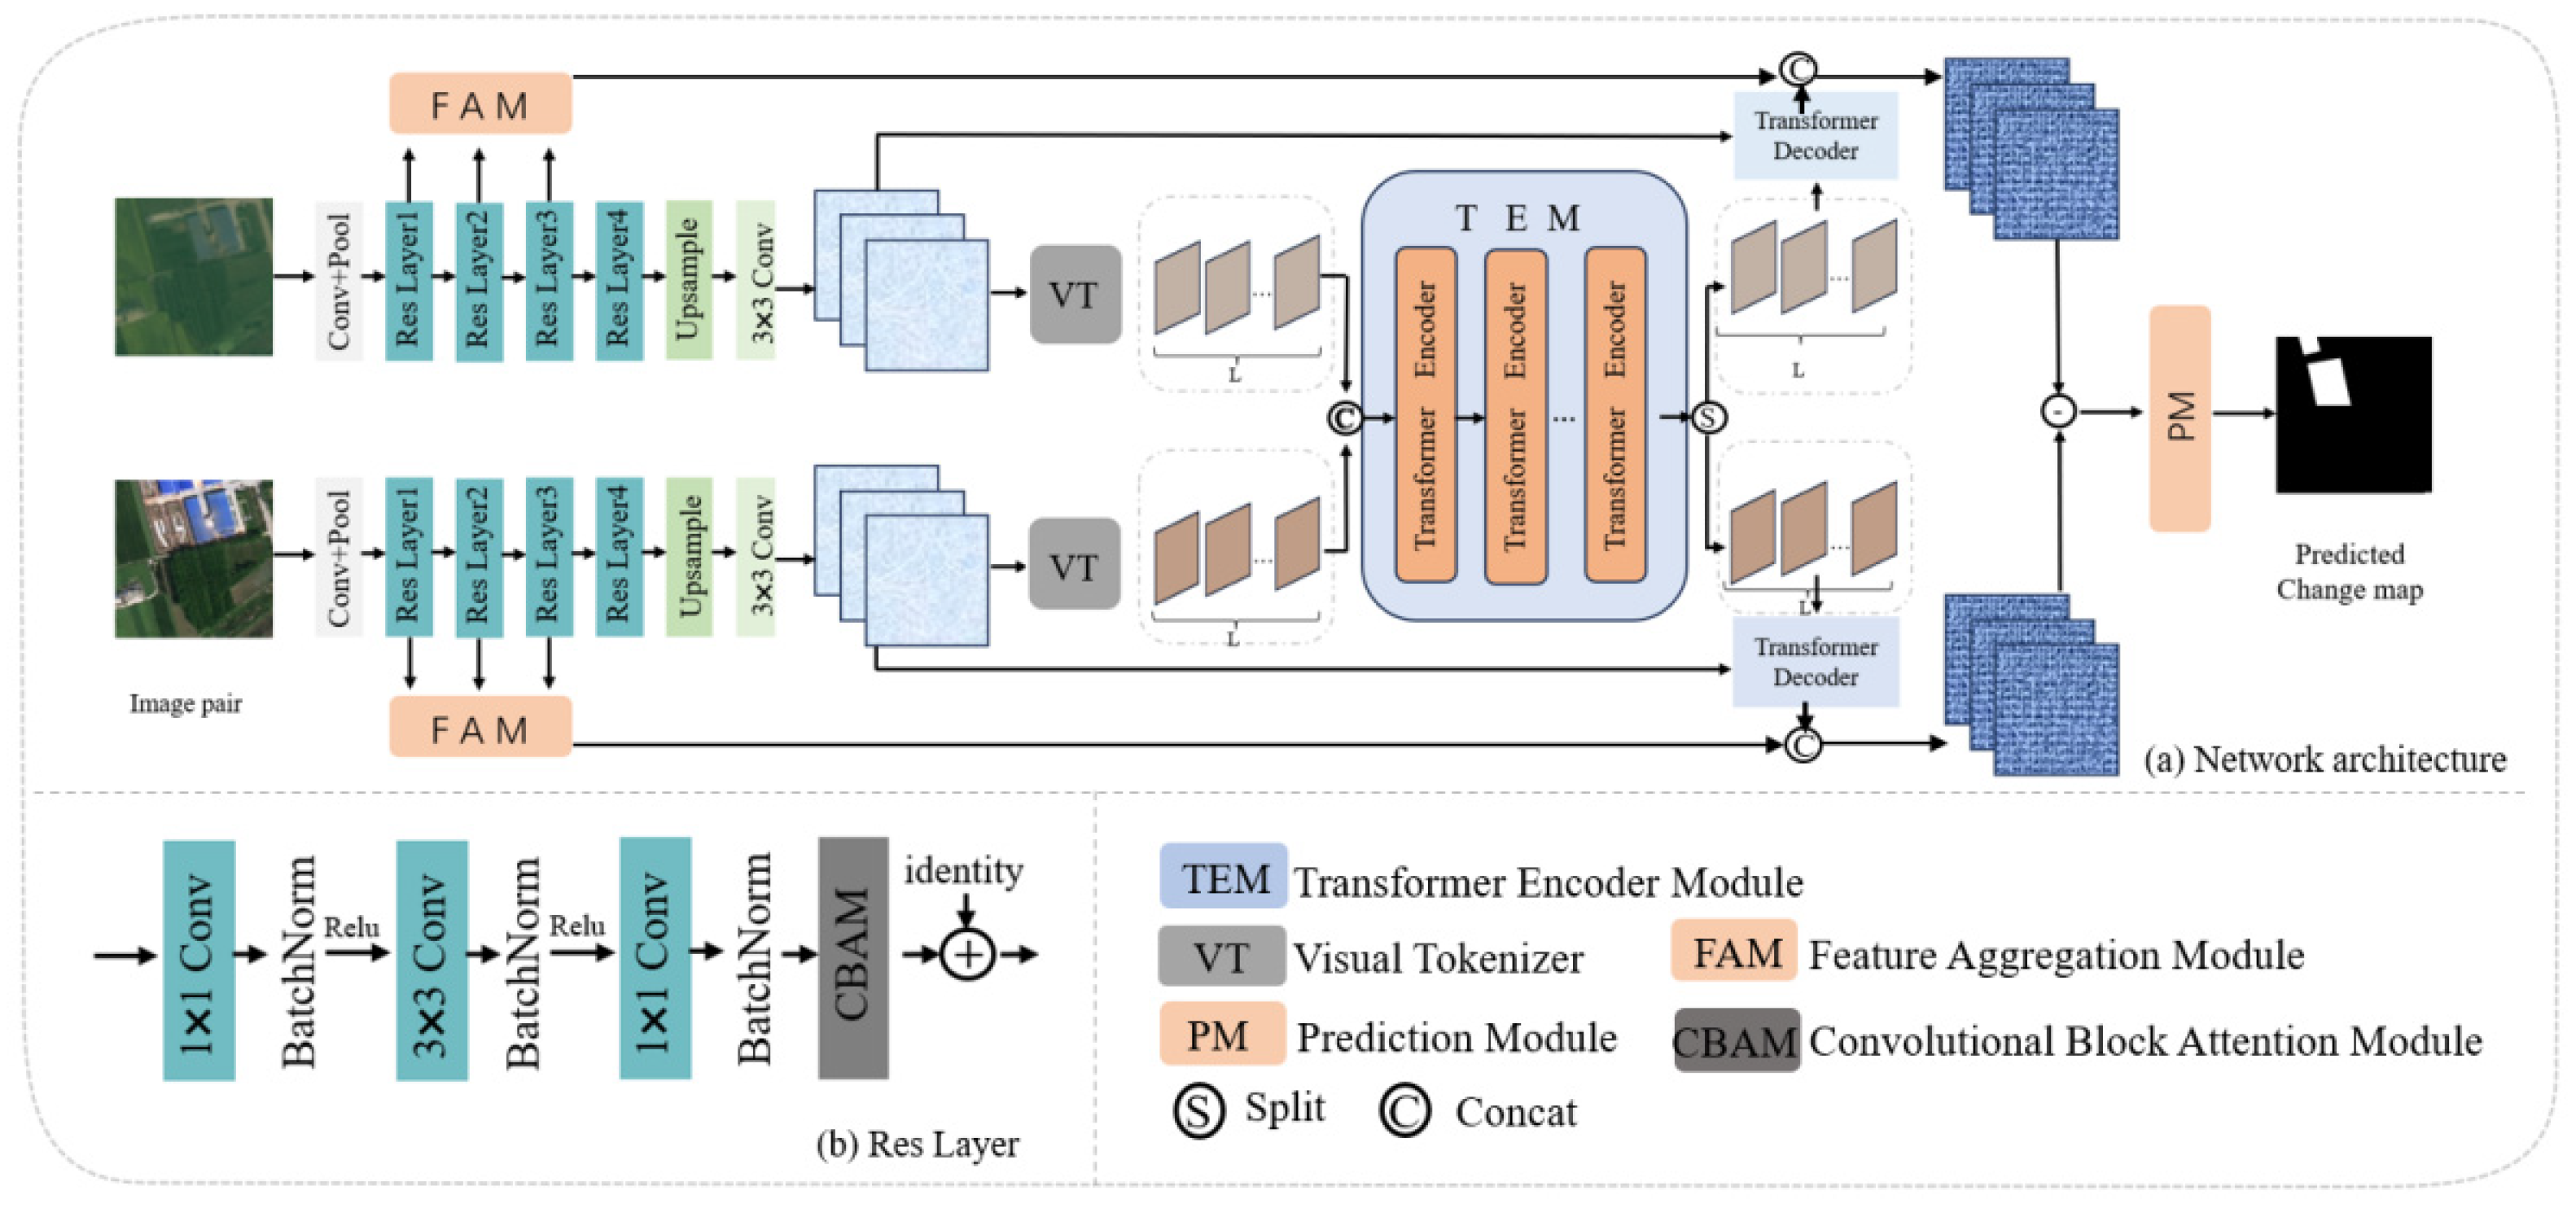
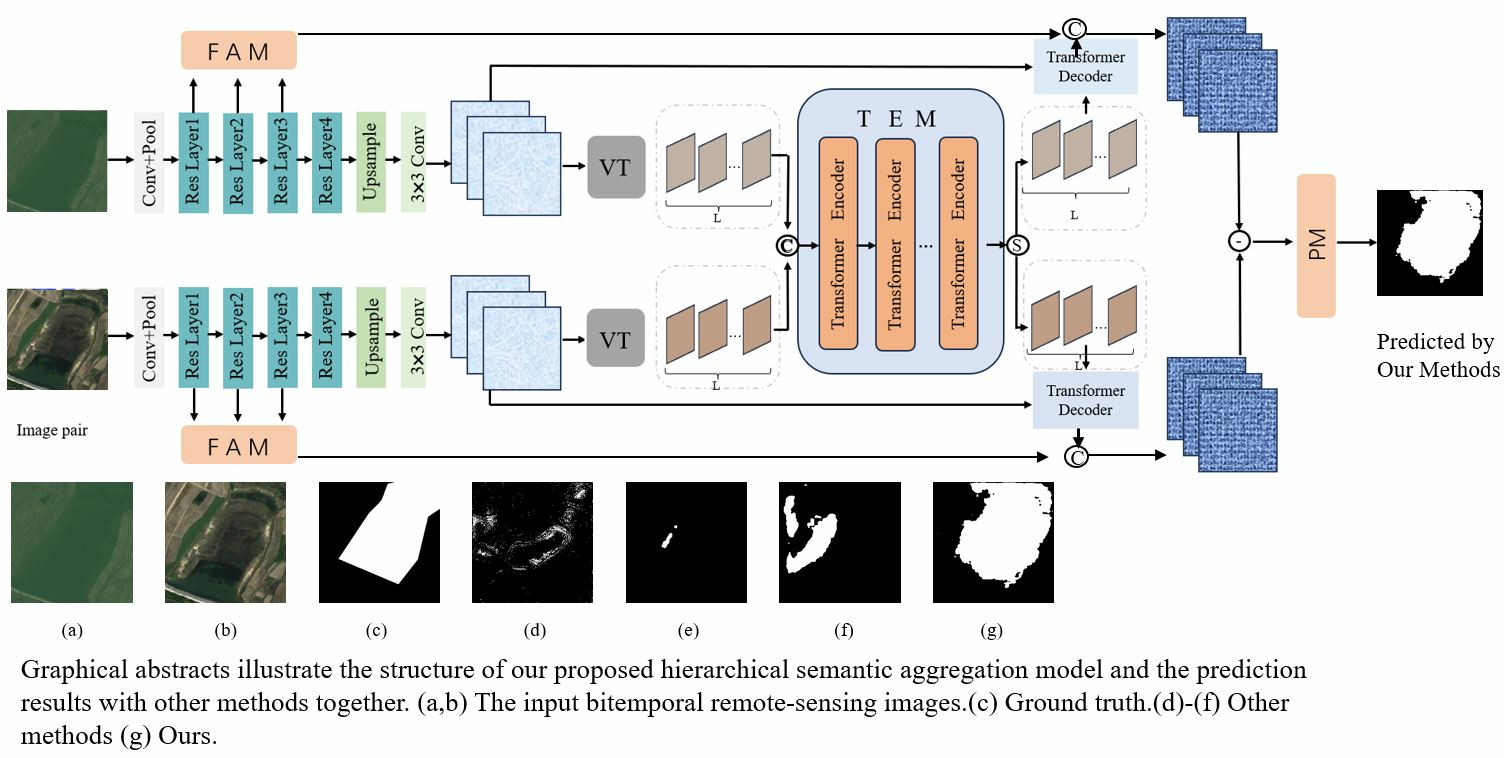
3. The Proposed Method
3.1. Overview of the Proposed Architecture
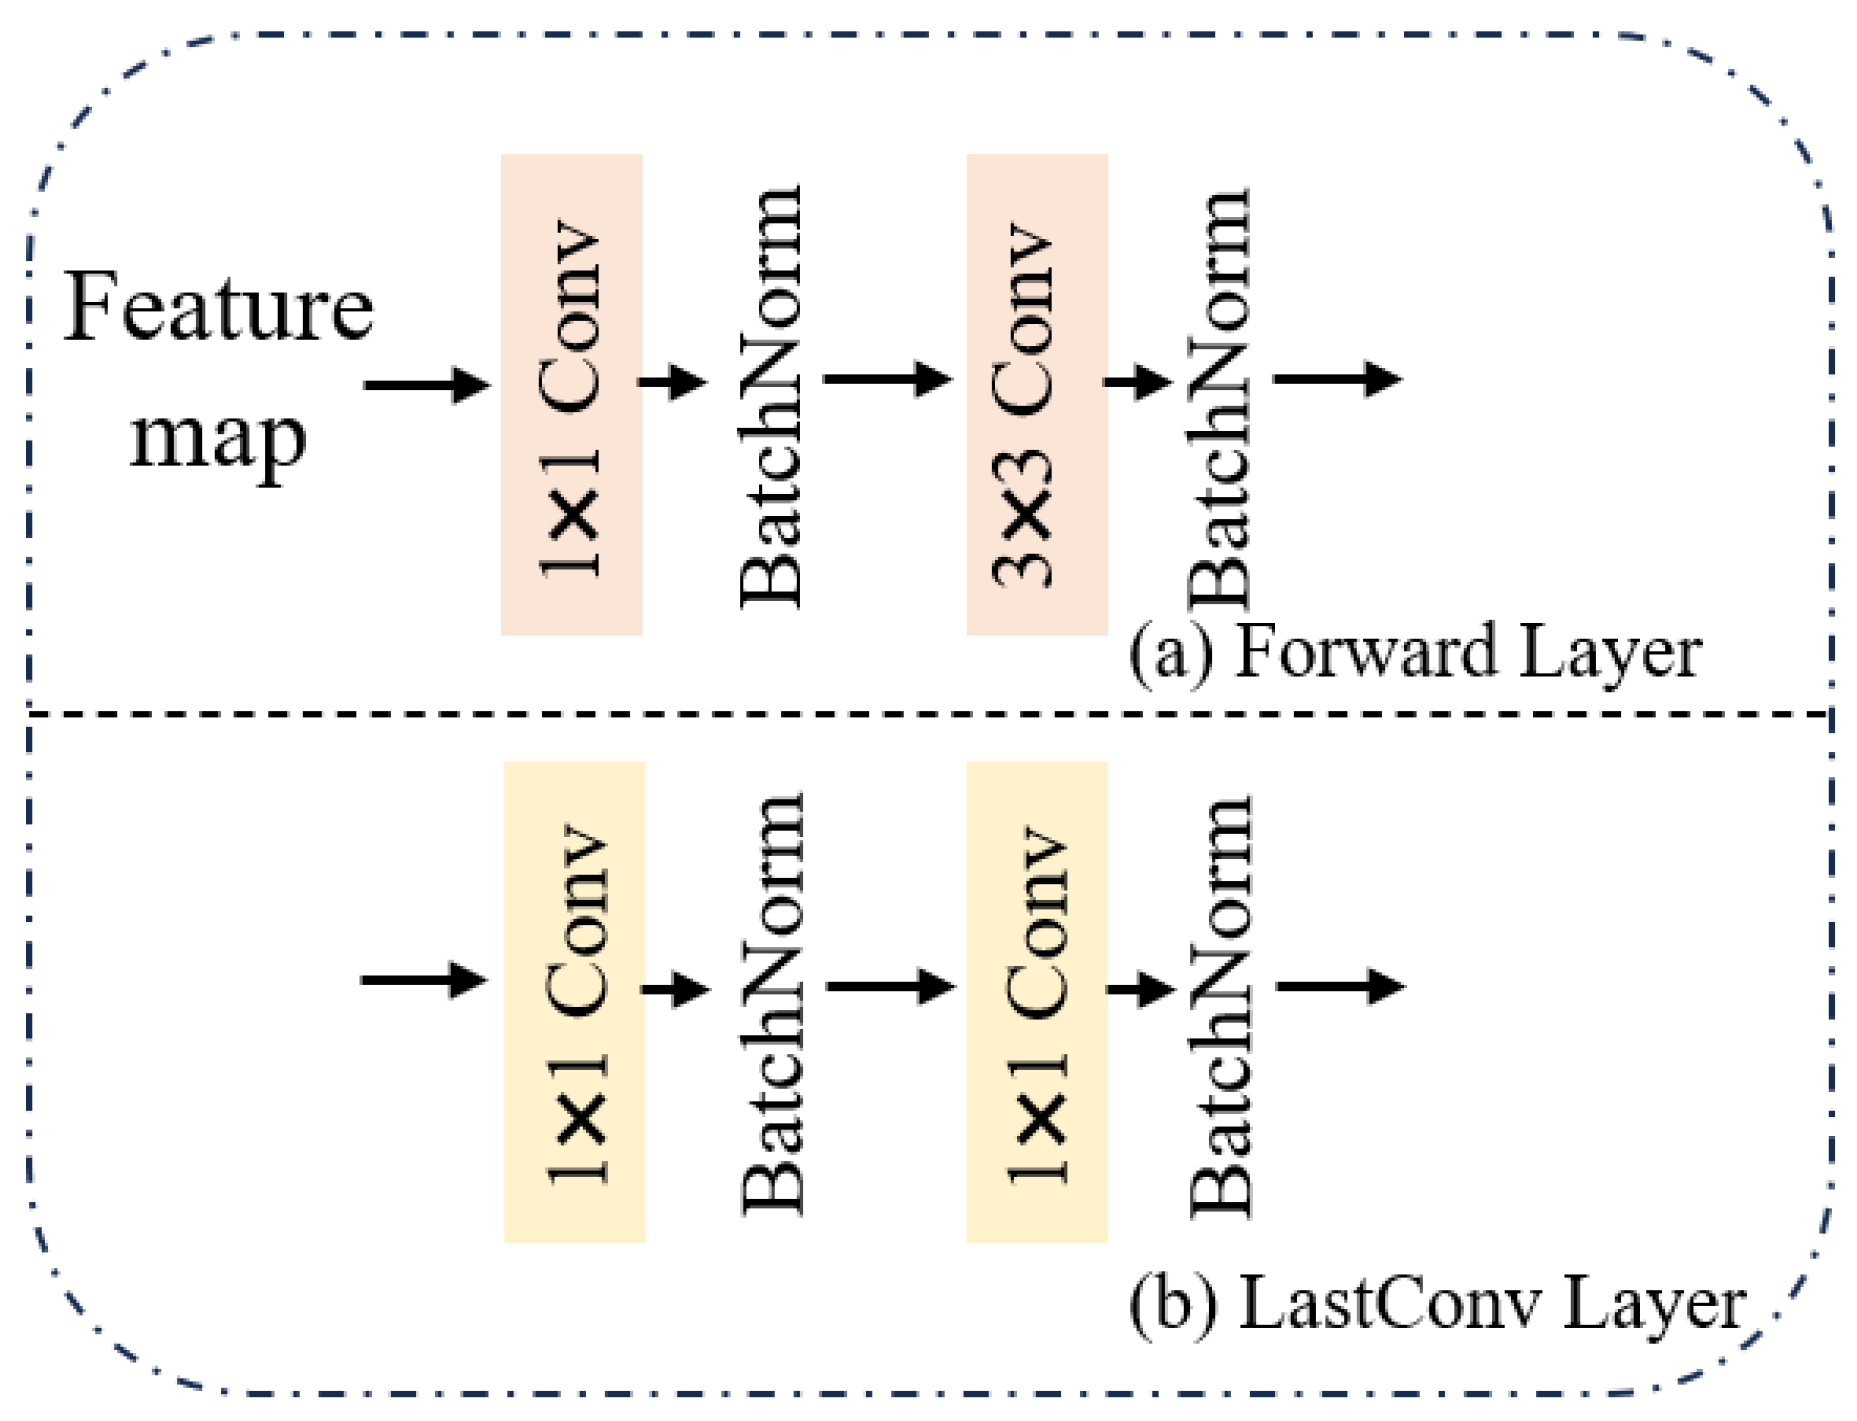
3.2. Feature Aggregation Module (FAM)
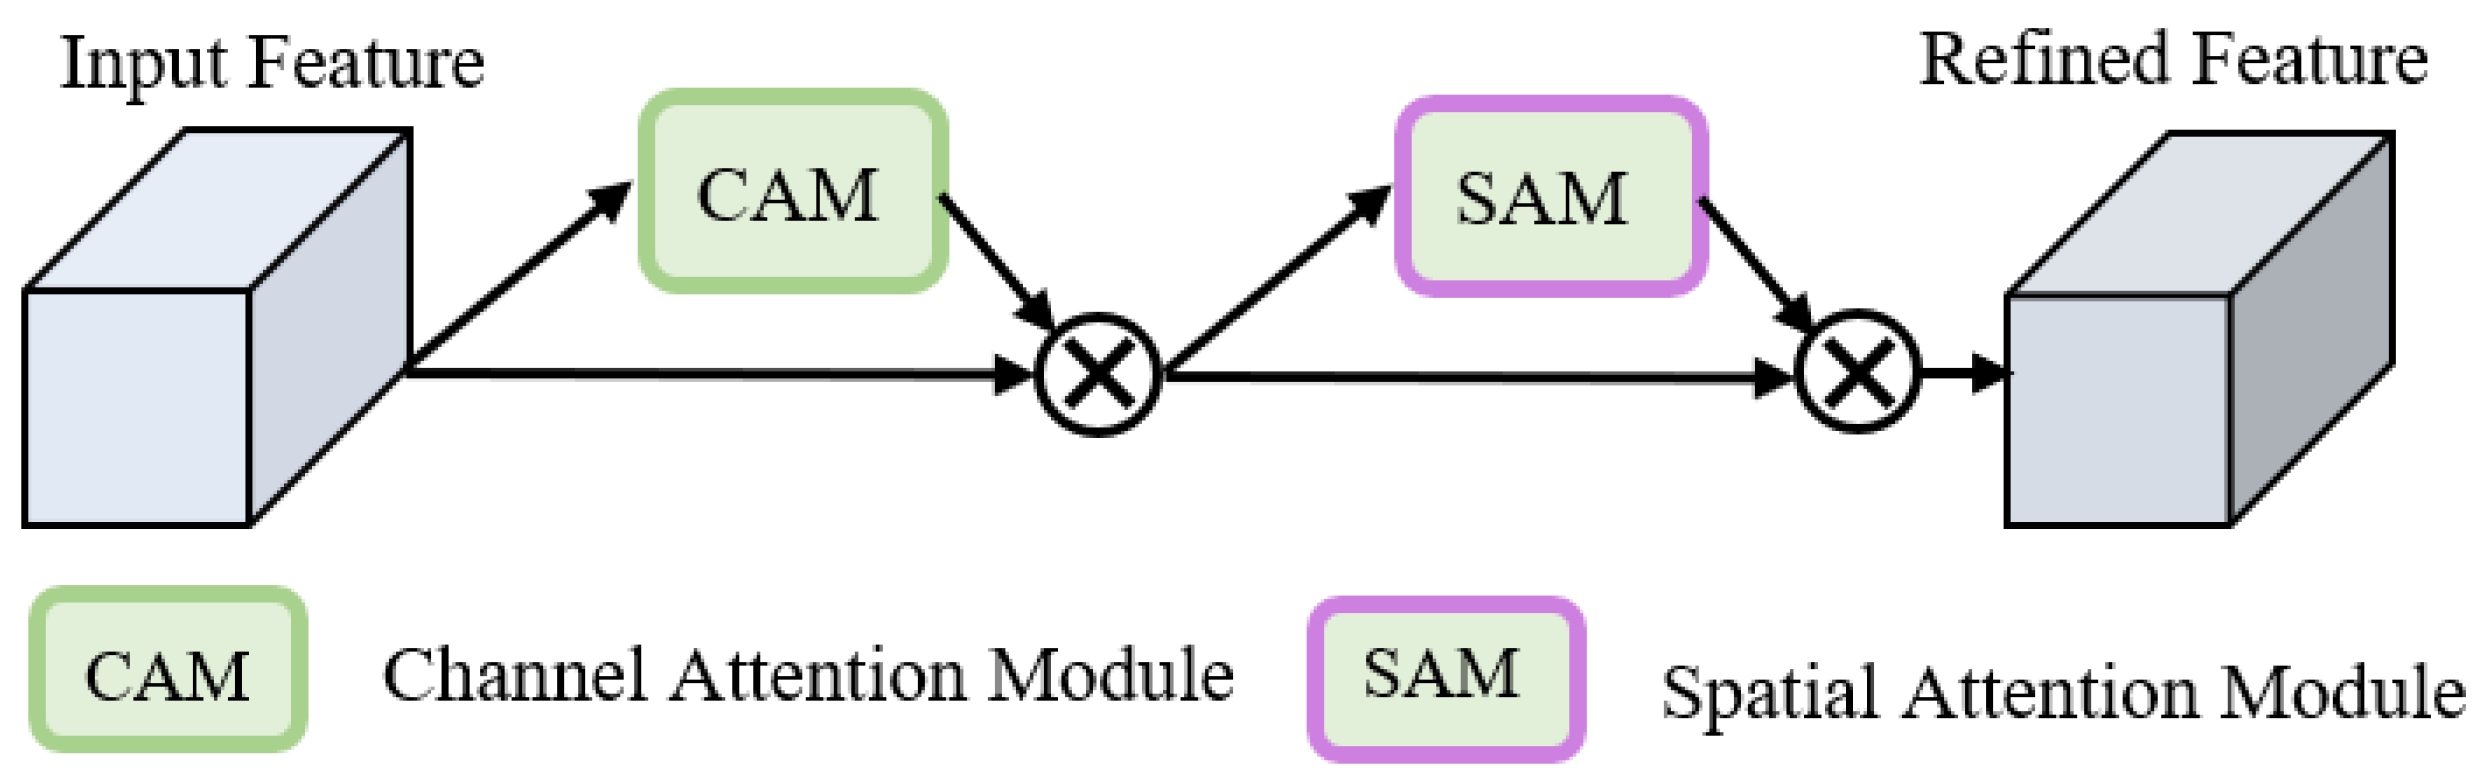
3.3. Convolutional Block Attention Module (CBAM)
4. Experiments and Results
4.1. Datasets
4.1.1. Self-Built Image Dataset
4.1.2. LEVIR-CD Dataset and WHU-CD Dataset
4.2. Experiment Setting and Evaluation Metrics
4.3. Comparison of Most Recent Networks
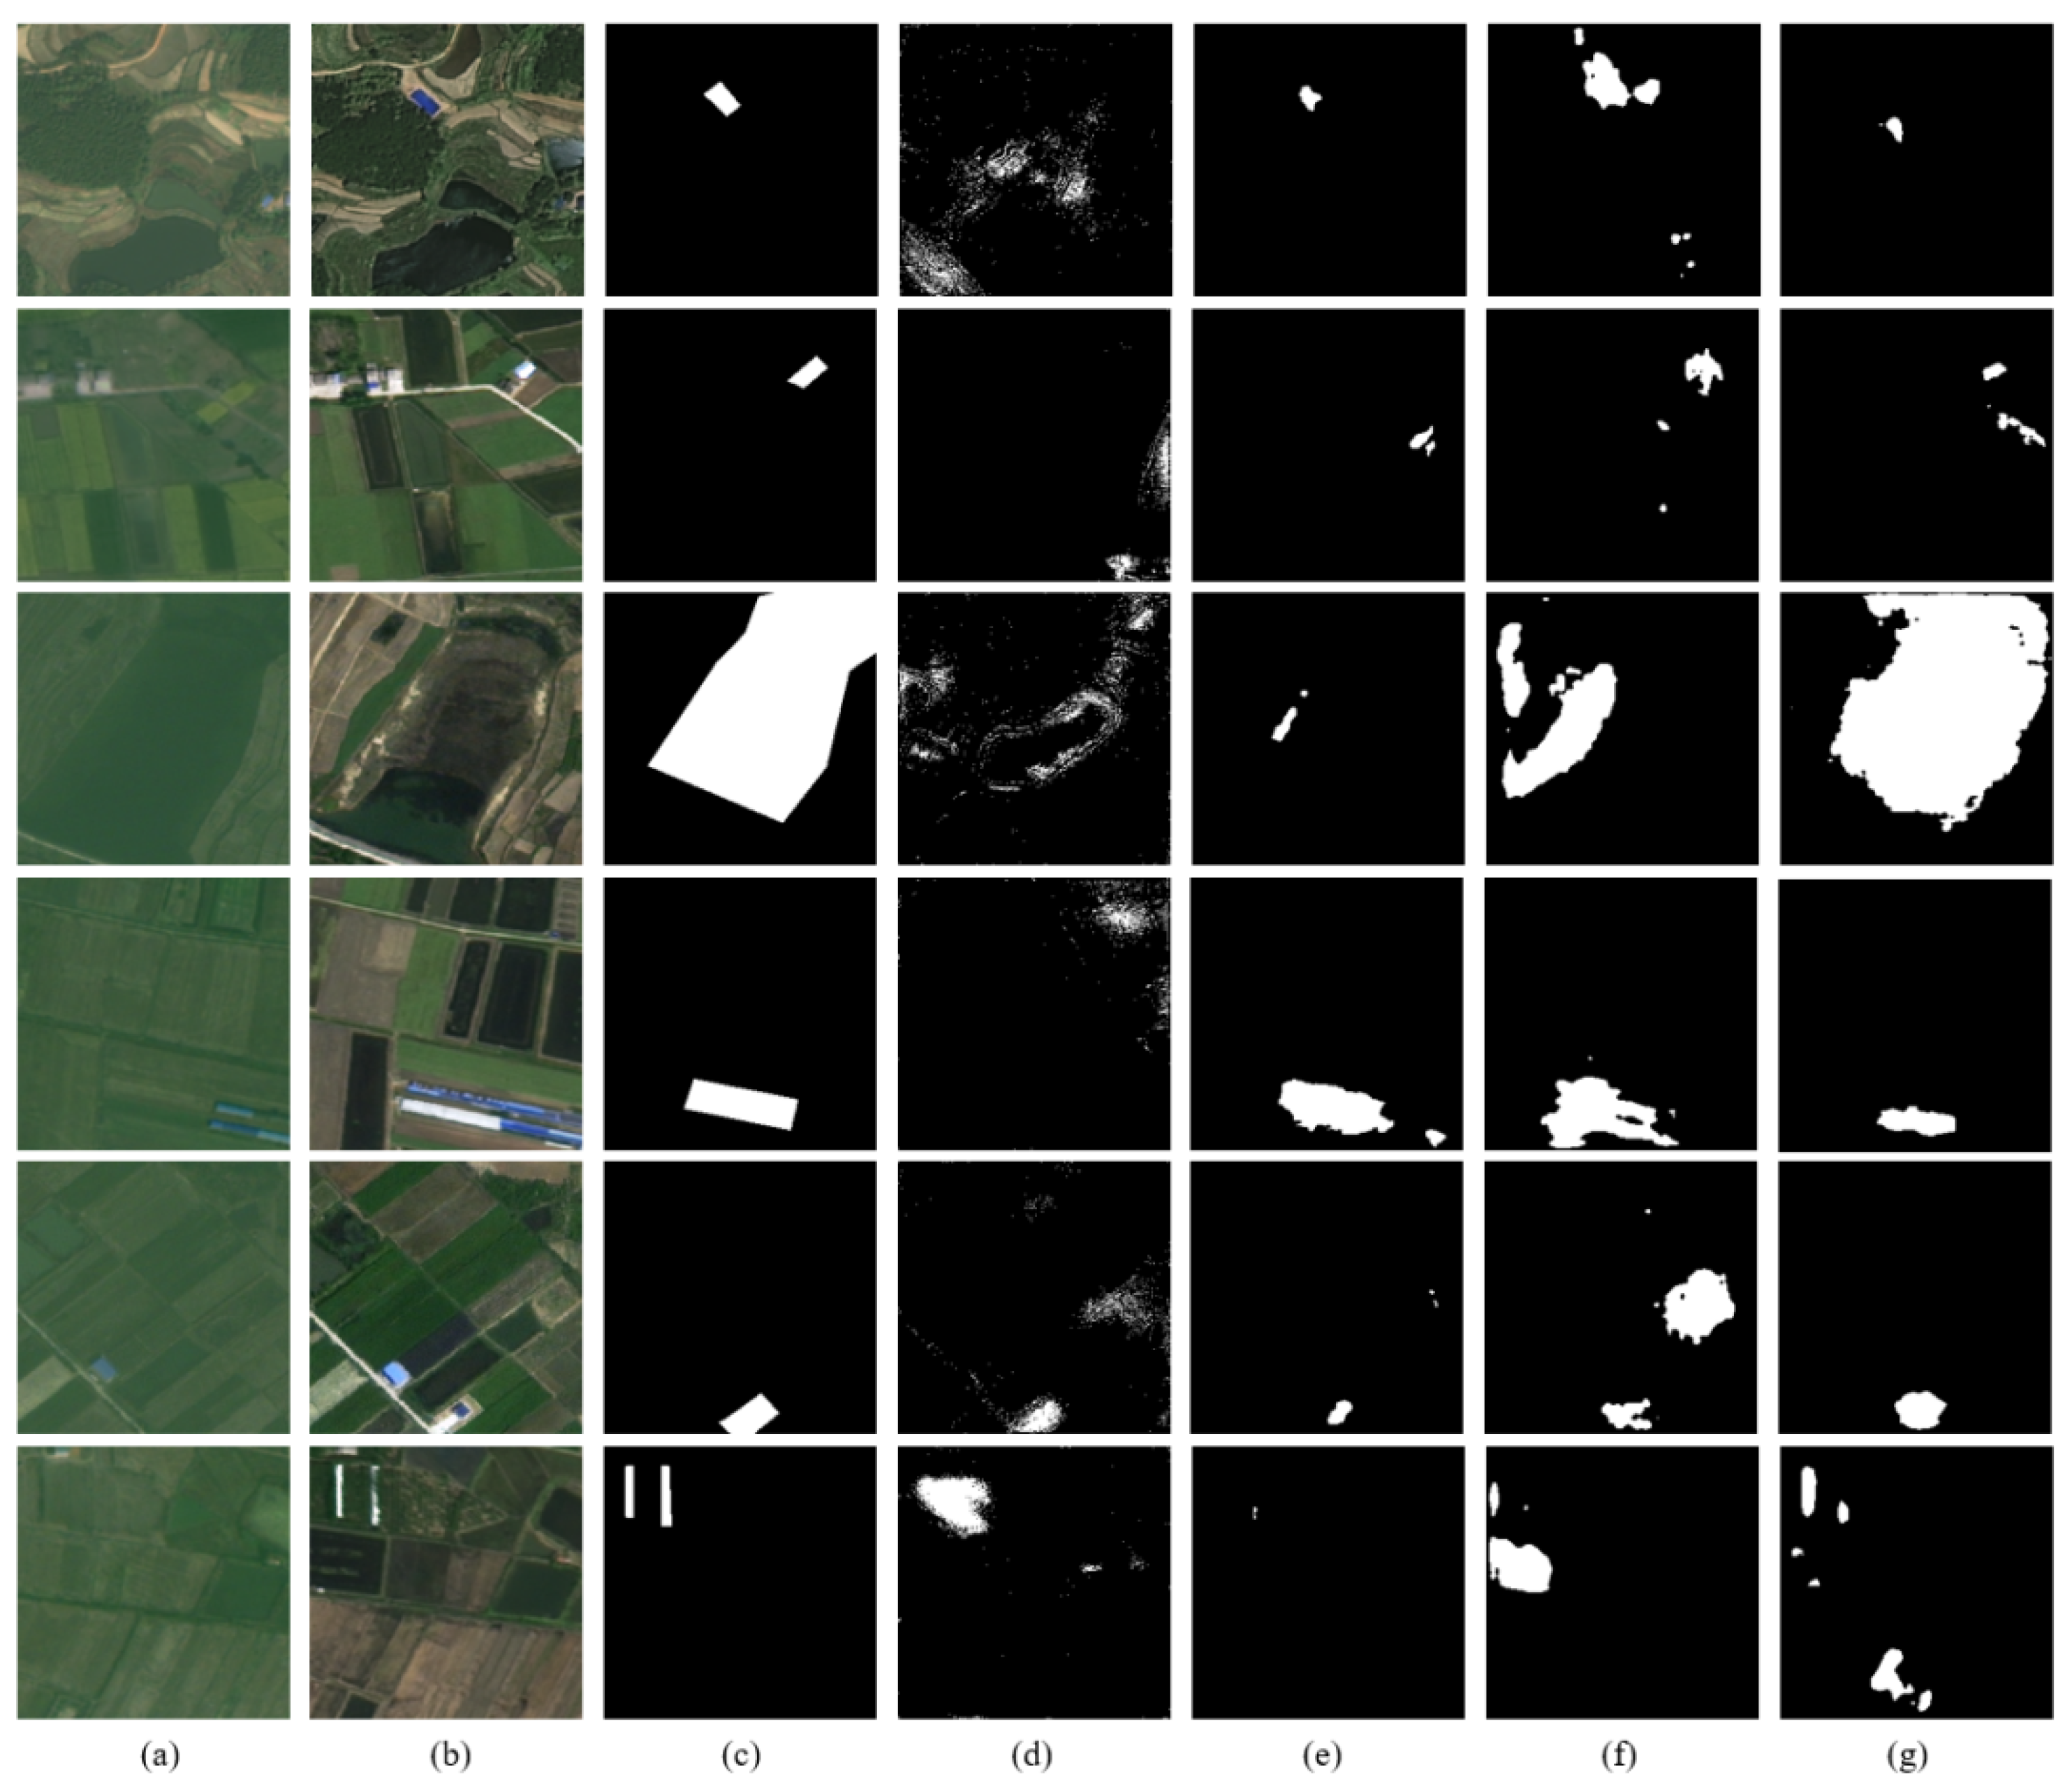
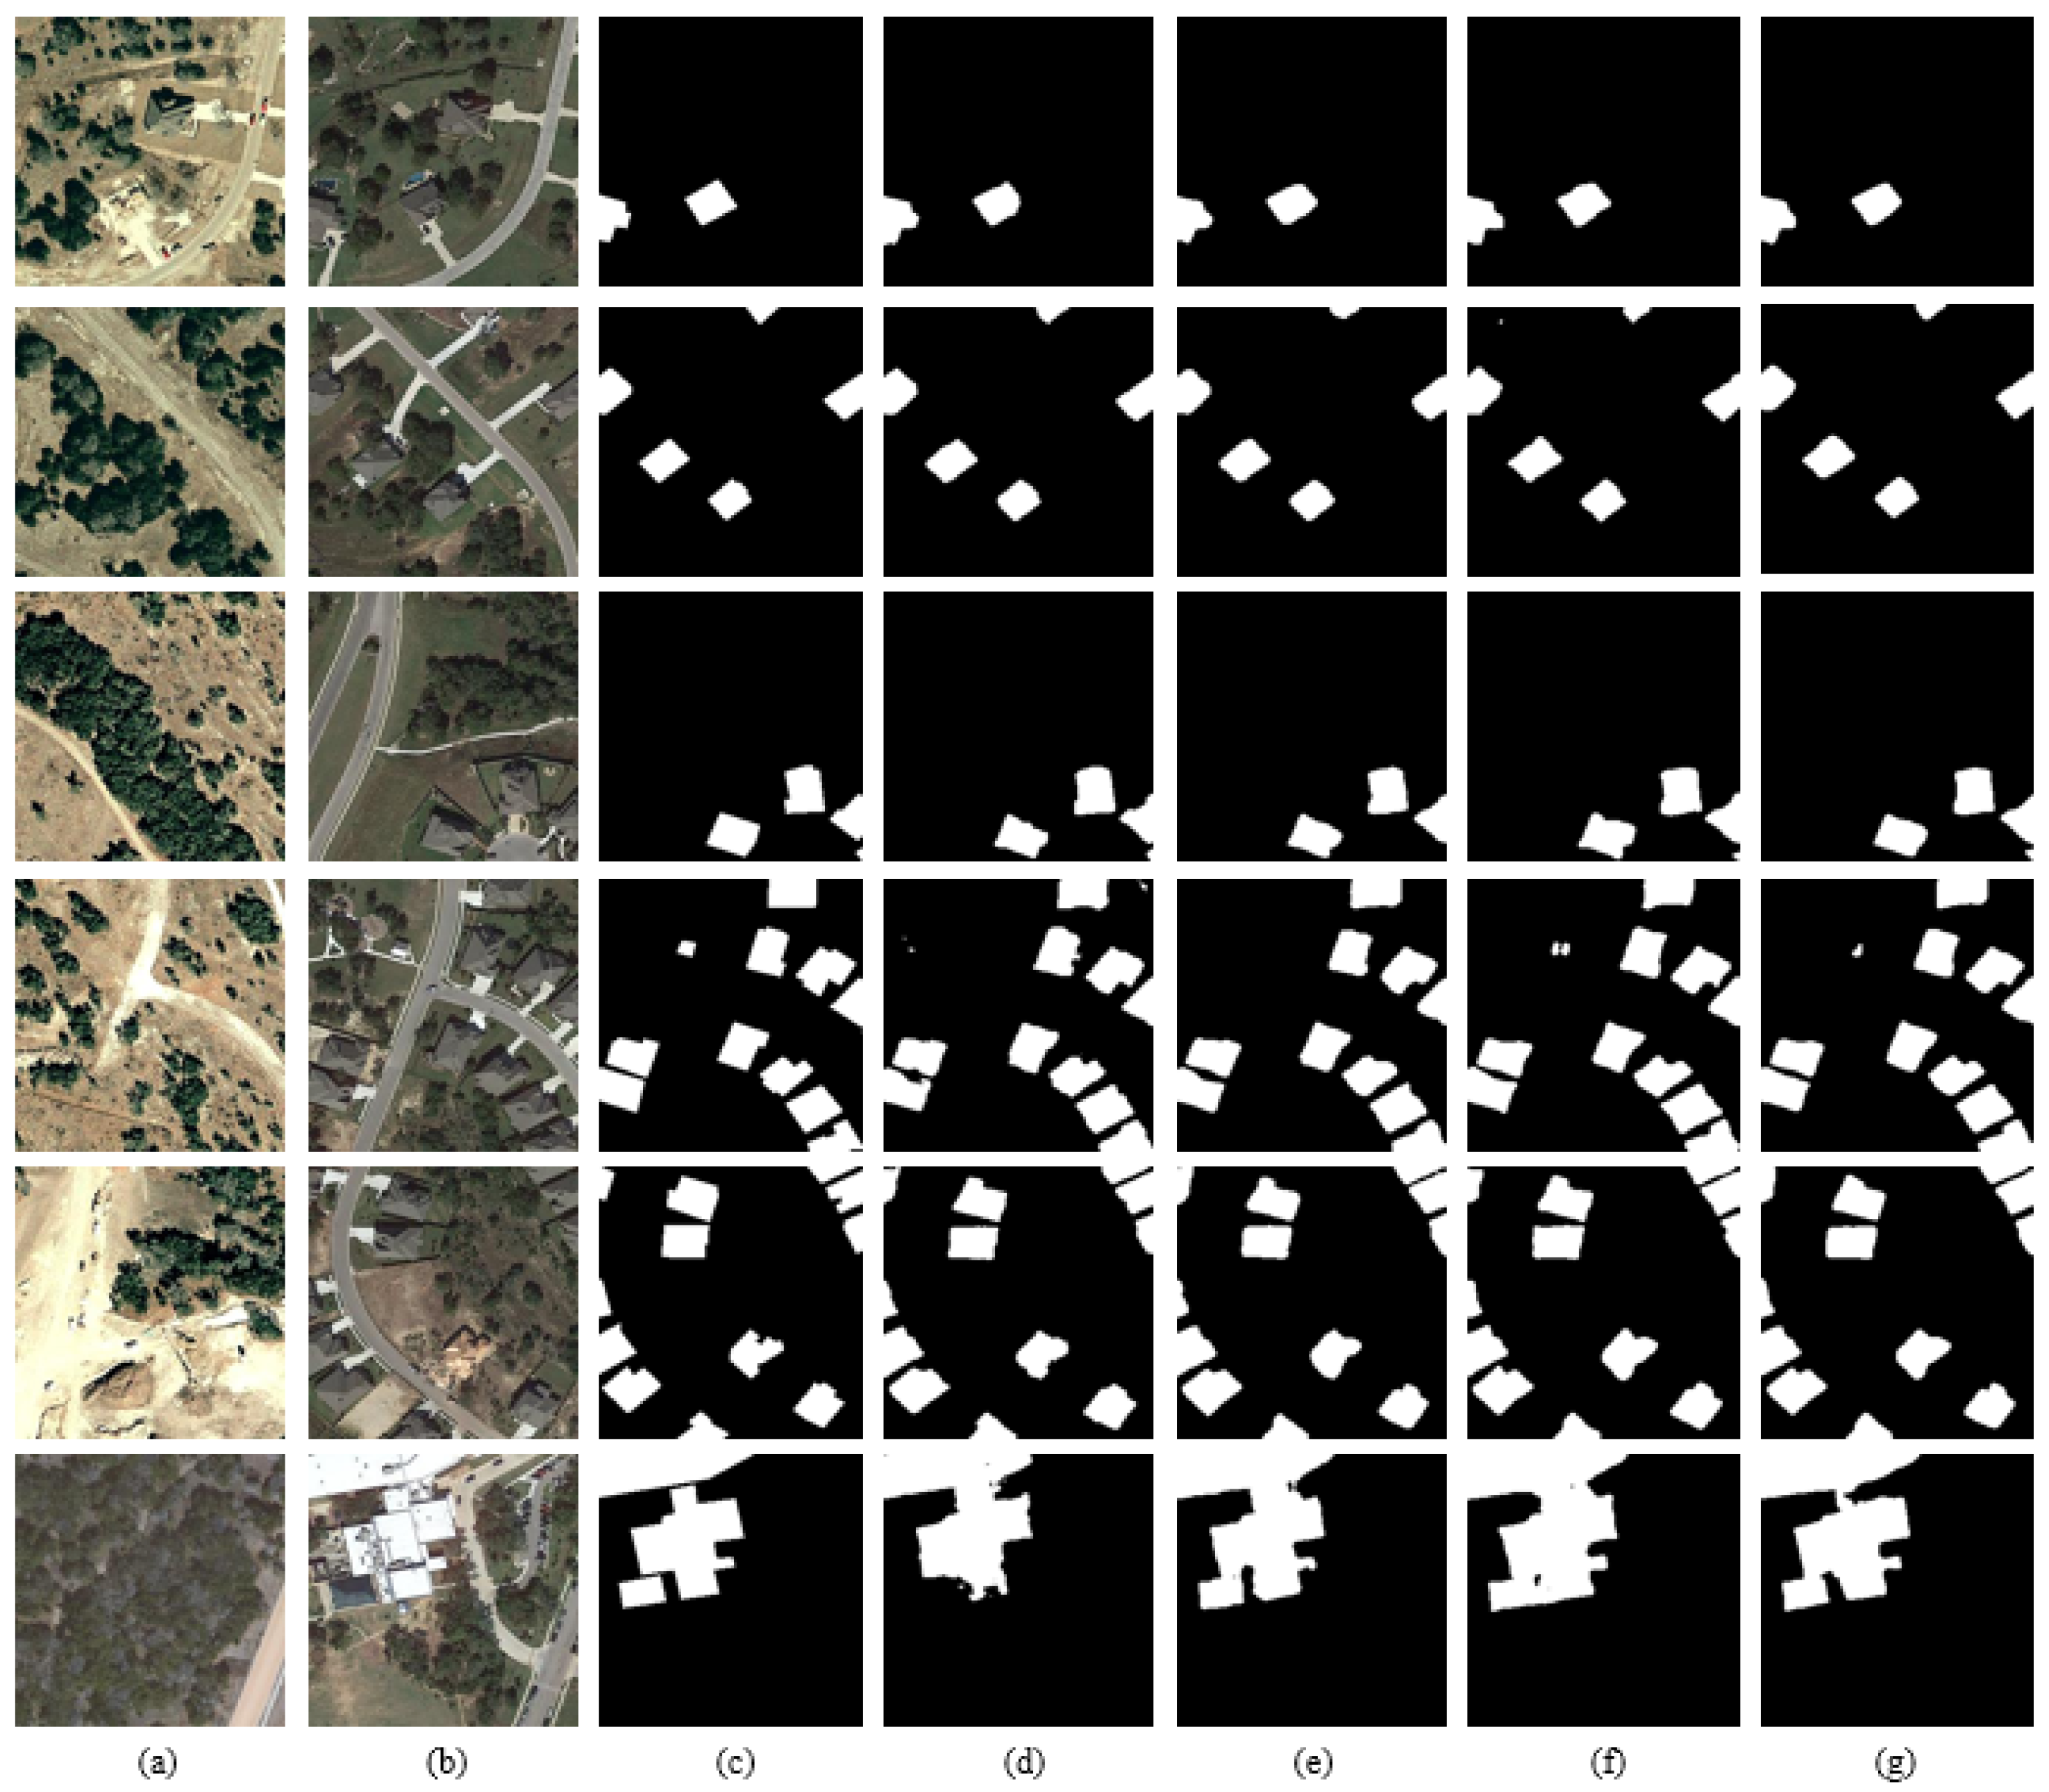
4.4. Experiments on Self-Built Dataset
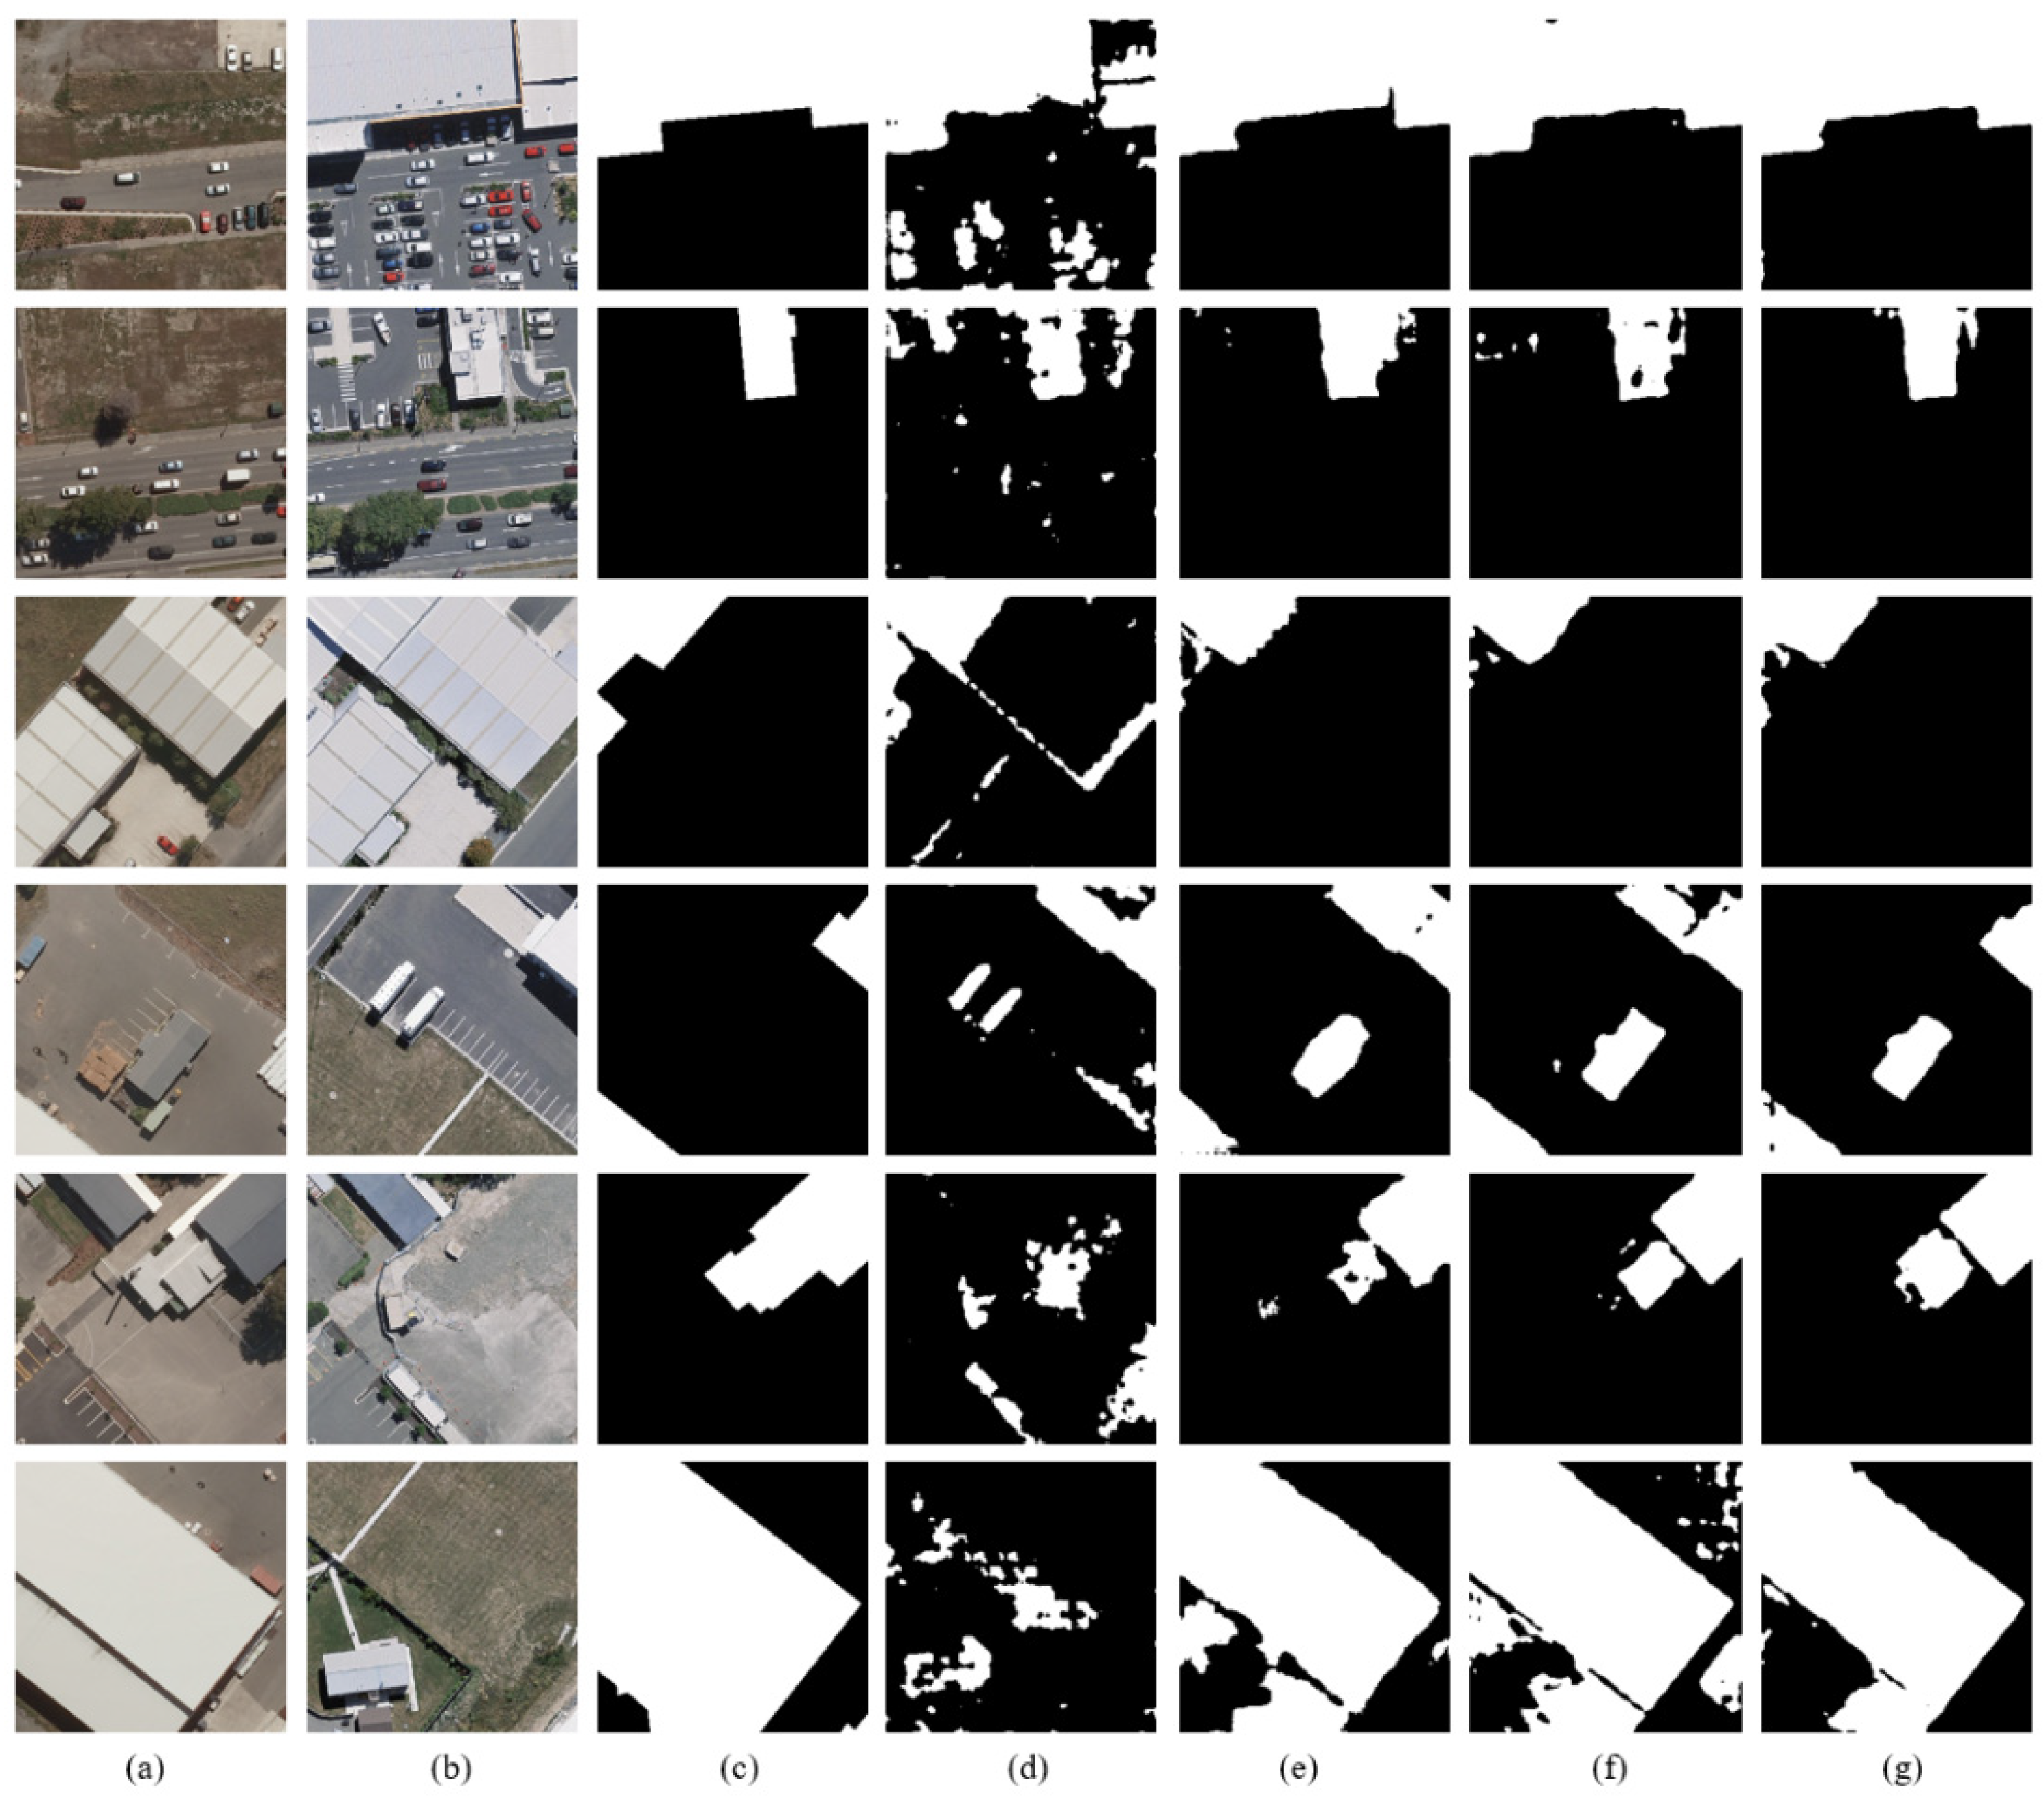
4.5. Experiments on LEVIR-CD Dataset and WHU-CD Dataset
5. Discussion
6. Conclusions
Author Contributions
Funding
Data Availability Statement
Acknowledgments
Conflicts of Interest
References
- Zhou, Y.; Zhong, Z.; Cheng, G. Cultivated Land Loss and Construction Land Expansion in China: Evidence from National Land Surveys in 1996, 2009 and 2019. Land Use Policy 2023, 125, 106496. [Google Scholar] [CrossRef]
- Liu, S.; Xiao, W.; Ye, Y.; He, T.; Luo, H. Rural Residential Land Expansion and Its Impacts on Cultivated Land in China between 1990 and 2020. Land Use Policy 2023, 132, 106816. [Google Scholar] [CrossRef]
- Li, H.; Song, W. Spatial Transformation of Changes in Global Cultivated Land. Sci. Total Environ. 2023, 859, 160194. [Google Scholar] [CrossRef] [PubMed]
- Wu, Y.; Wang, Y.; Li, Y.; Xu, Q. Optical Satellite Image Change Detection Via Transformer-Based Siamese Network. In Proceedings of the International Geoscience and Remote Sensing Symposium (IGARSS), Kuala Lumpur, Malaysia, 17–22 July 2022; Institute of Electrical and Electronics Engineers Inc.: Danvers, MA, USA, 2022; Volume 2022-July, pp. 1436–1439. [Google Scholar]
- Abbott, R.; Robertson, N.M.; Martinez Del Rincon, J.; Connor, B. Unsupervised Object Detection via LWIR/RGB Translation. In Proceedings of the IEEE Computer Society Conference on Computer Vision and Pattern Recognition Workshops, Seattle, WA, USA, 14–19 June 2020; Volume 2020-June, pp. 407–415. [Google Scholar]
- Yang, L.; Chen, Y.; Song, S.; Li, F.; Huang, G. Deep Siamese Networks Based Change Detection with Remote Sensing Images. Remote Sens. 2021, 13, 3394. [Google Scholar] [CrossRef]
- Benedek, C.; Szirányi, T. Change Detection in Optical Aerial Images by a Multilayer Conditional Mixed Markov Model. IEEE Trans. Geosci. Remote Sens. 2009, 47, 3416–3430. [Google Scholar] [CrossRef]
- Bourdis, N.; Marraud, D.; Sahbi, H. Constrained Optical Flow for Aerial Image Change Detection. In Proceedings of the IEEE International Geoscience & Remote Sensing Symposium, Vancouver, BC, Canada, 24 July 2011. [Google Scholar]
- Ji, S.; Wei, S.; Lu, M. Fully Convolutional Networks for Multisource Building Extraction from an Open Aerial and Satellite Imagery Data Set. IEEE Trans. Geosci. Remote Sens. 2019, 57, 574–586. [Google Scholar] [CrossRef]
- Shi, Q.; Liu, M.; Li, S.; Liu, X.; Wang, F.; Zhang, L. A Deeply Supervised Attention Metric-Based Network and an Open Aerial Image Dataset for Remote Sensing Change Detection. IEEE Trans. Geosci. Remote Sens. 2022, 60, 5604816. [Google Scholar] [CrossRef]
- Chen, H.; Shi, Z. A Spatial-Temporal Attention-Based Method and a New Dataset for Remote Sensing Image Change Detection. Remote Sens. 2020, 12, 1662. [Google Scholar] [CrossRef]
- Zhang, C.; Yue, P.; Tapete, D.; Jiang, L.; Shangguan, B.; Huang, L.; Liu, G. A Deeply Supervised Image Fusion Network for Change Detection in High Resolution Bi-Temporal Remote Sensing Images. ISPRS J. Photogramm. Remote Sens. 2020, 166, 183–200. [Google Scholar] [CrossRef]
- Peng, D.; Bruzzone, L.; Zhang, Y.; Guan, H.; DIng, H.; Huang, X. SemiCDNet: A Semisupervised Convolutional Neural Network for Change Detection in High Resolution Remote-Sensing Images. IEEE Trans. Geosci. Remote Sens. 2021, 59, 5891–5906. [Google Scholar] [CrossRef]
- Daudt, R.C.; Saux, B.; Boulch, A.; Gousseau, Y. Urban Change Detection for Multispectral Earth Observation Using Convolutional Neural Networks. In Proceedings of the IEEE International Geoscience and Remote Sensing Symposium, Valencia, Spain, 22–27 July 2018. [Google Scholar]
- Zhang, J.; Shao, Z.; Ding, Q.; Huang, X.; Wang, Y.; Zhou, X.; Li, D. AERNet: An Attention-Guided Edge Refinement Network and a Dataset for Remote Sensing Building Change Detection. IEEE Trans. Geosci. Remote Sens. 2023, 61, 5617116. [Google Scholar] [CrossRef]
- Shen, L.; Lu, Y.; Chen, H.; Wei, H.; Xie, D.; Yue, J.; Chen, R.; Lv, S.; Jiang, B. S2looking: A Satellite Side-Looking Dataset for Building Change Detection. Remote Sens. 2021, 13, 5094. [Google Scholar] [CrossRef]
- Li, S.; Wang, Y.; Cai, H.; Lin, Y.; Wang, M.; Teng, F. MF-SRCDNet: Multi-Feature Fusion Super-Resolution Building Change Detection Framework for Multi-Sensor High-Resolution Remote Sensing Imagery. Int. J. Appl. Earth Obs. Geoinf. 2023, 119, 103303. [Google Scholar] [CrossRef]
- Lebedev, M.A.; Vizilter, Y.V.; Vygolov, O.V.; Knyaz, V.A.; Rubis, A.Y. Change Detection in Remote Sensing Images Using Conditional Adversarial Networks. In Proceedings of the International Archives of the Photogrammetry, Remote Sensing and Spatial Information Sciences—ISPRS Archives, Riva del Garda, Italy, 30 May 2018; International Society for Photogrammetry and Remote Sensing: Riva del Garda, Italy, 2018; Volume 42, pp. 565–571. [Google Scholar]
- Zhang, Z.; Vosselman, G.; Gerke, M.; Tuia, D.; Yang, M.Y. Change Detection between Multimodal Remote Sensing Data Using Siamese CNN. arXiv 2018, arXiv:1807.09562. [Google Scholar]
- Song, L.; Xia, M.; Weng, L.; Lin, H.; Qian, M.; Chen, B. Axial Cross Attention Meets CNN: Bibranch Fusion Network for Change Detection. IEEE J. Sel. Top. Appl. Earth Obs. Remote Sens. 2023, 16, 32–43. [Google Scholar] [CrossRef]
- Lei, G.; Li, A.; Bian, J.; Naboureh, A.; Zhang, Z.; Nan, X. A Simple and Automatic Method for Detecting Large-Scale Land Cover Changes without Training Data. IEEE J. Sel. Top. Appl. Earth Obs. Remote Sens. 2023, 16, 7276–7292. [Google Scholar] [CrossRef]
- Shi, S.; Zhong, Y.; Zhao, J.; Lv, P.; Liu, Y.; Zhang, L. Land-Use/Land-Cover Change Detection Based on Class-Prior Object-Oriented Conditional Random Field Framework for High Spatial Resolution Remote Sensing Imagery. IEEE Trans. Geosci. Remote Sens. 2022, 60, 5600116. [Google Scholar] [CrossRef]
- Lv, Z.; Huang, H.; Gao, L.; Benediktsson, J.A.; Zhao, M.; Shi, C. Simple Multiscale UNet for Change Detection with Heterogeneous Remote Sensing Images. IEEE Geosci. Remote Sens. Lett. 2022, 19, 2504905. [Google Scholar] [CrossRef]
- Fang, S.; Li, K.; Shao, J.; Li, Z. SNUNet-CD: A Densely Connected Siamese Network for Change Detection of VHR Images. IEEE Geosci. Remote Sens. Lett. 2022, 19, 8007805. [Google Scholar] [CrossRef]
- Huang, L.; Tian, Q.; Tang, B.H.; Le, W.; Wang, M.; Ma, X. Siam-EMNet: A Siamese EfficientNet–MANet Network for Building Change Detection in Very High Resolution Images. Remote Sens. 2023, 15, 3972. [Google Scholar] [CrossRef]
- Hosseinpour, H.; Samadzadegan, F.; Javan, F.D. CMGFNet: A Deep Cross-Modal Gated Fusion Network for Building Extraction from Very High-Resolution Remote Sensing Images. ISPRS J. Photogramm. Remote Sens. 2022, 184, 96–115. [Google Scholar] [CrossRef]
- Varghese, A.; Gubbi, J.; Ramaswamy, A.; Balamuralidhar, P. ChangeNet: A Deep Learning Architecture for Visual Change Detection. In Proceedings of the Lecture Notes in Computer Science (Including Subseries Lecture Notes in Artificial Intelligence and Lecture Notes in Bioinformatics), Munich, Germany, 8–14 September 2018; Springer: Munich, Germany, 2019; Volume 11130 LNCS, pp. 129–145. [Google Scholar]
- Chen, J.; Yuan, Z.; Peng, J.; Chen, L.; Huang, H.; Zhu, J.; Liu, Y.; Li, H. DASNet: Dual Attentive Fully Convolutional Siamese Networks for Change Detection in High-Resolution Satellite Images. IEEE J. Sel. Top. Appl. Earth Obs. Remote Sens. 2021, 14, 1194–1206. [Google Scholar] [CrossRef]
- Chen, C.-P.; Hsieh, J.-W.; Chen, P.-Y.; Hsieh, Y.-K.; Wang, B.-S. SARAS-Net: Scale and Relation Aware Siamese Network for Change Detection. In Proceedings of the AAAI Conference on Artificial Intelligence, Online, 22 February–1 March 2022. [Google Scholar]
- Han, C.; Wu, C.; Guo, H.; Hu, M.; Li, J.; Chen, H. Change Guiding Network: Incorporating Change Prior to Guide Change Detection in Remote Sensing Imagery. IEEE J. Sel. Top. Appl. Earth Obs. Remote Sens. 2023, 16, 8395–8407. [Google Scholar] [CrossRef]
- Zhu, S.; Song, Y.; Zhang, Y.; Zhang, Y. ECFNet: A Siamese Network with Fewer FPs and Fewer FNs for Change Detection of Remote-Sensing Images. IEEE Geosci. Remote Sens. Lett. 2023, 20, 6001005. [Google Scholar] [CrossRef]
- Li, X.; Yan, L.; Zhang, Y.; Mo, N. SDMNet: A Deep-Supervised Dual Discriminative Metric Network for Change Detection in High-Resolution Remote Sensing Images. IEEE Geosci. Remote Sens. Lett. 2022, 19, 5513905. [Google Scholar] [CrossRef]
- Bandara, W.G.C.; Nair, N.G.; Patel, V.M. DDPM-CD: Remote Sensing Change Detection Using Denoising Diffusion Probabilistic Models. arXiv 2022, arXiv:2206.11892. [Google Scholar]
- Codegoni, A.; Lombardi, G.; Ferrari, A. TINYCD: A (Not So) Deep Learning Model for Change Detection. Neural Comput. Appl. 2022, 35, 8471–8486. [Google Scholar] [CrossRef]
- Zhao, C.; Tang, Y.; Feng, S.; Fan, Y.; Li, W.; Tao, R.; Zhang, L. High-Resolution Remote Sensing Bitemporal Image Change Detection Based on Feature Interaction and Multitask Learning. IEEE Trans. Geosci. Remote Sens. 2023, 61, 5511514. [Google Scholar] [CrossRef]
- Lv, Z.; Zhong, P.; Wang, W.; You, Z.; Falco, N. Multiscale Attention Network Guided with Change Gradient Image for Land Cover Change Detection Using Remote Sensing Images. IEEE Geosci. Remote Sens. Lett. 2023, 20, 2501805. [Google Scholar] [CrossRef]
- Zhang, H.; Ma, G.; Zhang, Y.; Wang, B.; Li, H.; Fan, L. MCHA-Net: A Multi-End Composite Higher-Order Attention Network Guided with Hierarchical Supervised Signal for High-Resolution Remote Sensing Image Change Detection. ISPRS J. Photogramm. Remote Sens. 2023, 202, 40–68. [Google Scholar] [CrossRef]
- Chen, H.; Song, J.; Wu, C.; Du, B.; Yokoya, N. Exchange Means Change: An Unsupervised Single-Temporal Change Detection Framework Based on Intra- and Inter-Image Patch Exchange. ISPRS J. Photogramm. Remote Sens. 2023, 206, 87–105. [Google Scholar] [CrossRef]
- Chen, H.; Qi, Z.; Shi, Z. Remote Sensing Image Change Detection with Transformers. IEEE Trans. Geosci. Remote Sens. 2022, 60, 5607514. [Google Scholar] [CrossRef]
- Bandara, W.G.C.; Patel, V.M. A Transformer-Based Siamese Network for Change Detection. In Proceedings of the International Geoscience and Remote Sensing Symposium (IGARSS), Kuala Lumpur, Malaysia, 17–22 July 2022; Institute of Electrical and Electronics Engineers Inc.: Danvers, MA, USA, 2022; Volume 2022-July, pp. 207–210. [Google Scholar]
- Cheng, H.; Wu, H.; Zheng, J.; Qi, K.; Liu, W. A Hierarchical Self-Attention Augmented Laplacian Pyramid Expanding Network for Change Detection in High-Resolution Remote Sensing Images. ISPRS J. Photogramm. Remote Sens. 2021, 182, 52–66. [Google Scholar] [CrossRef]
- Shu, Q.; Pan, J.; Zhang, Z.; Wang, M. DPCC-Net: Dual-Perspective Change Contextual Network for Change Detection in High-Resolution Remote Sensing Images. Int. J. Appl. Earth Obs. Geoinf. 2022, 112, 102940. [Google Scholar] [CrossRef]
- Liu, W.; Lin, Y.; Liu, W.; Yu, Y.; Li, J. An Attention-Based Multiscale Transformer Network for Remote Sensing Image Change Detection. ISPRS J. Photogramm. Remote Sens. 2023, 202, 599–609. [Google Scholar] [CrossRef]
- Guo, H.; Du, B.; Zhang, L.; Su, X. A Coarse-to-Fine Boundary Refinement Network for Building Footprint Extraction from Remote Sensing Imagery. ISPRS J. Photogramm. Remote Sens. 2022, 183, 240–252. [Google Scholar] [CrossRef]
- Yin, H.; Ma, C.; Weng, L.; Xia, M.; Lin, H. Bitemporal Remote Sensing Image Change Detection Network Based on Siamese-Attention Feedback Architecture. Remote Sens. 2023, 15, 4186. [Google Scholar] [CrossRef]
- Ma, C.; Yin, H.; Weng, L.; Xia, M.; Lin, H. DAFNet: A Novel Change-Detection Model for High-Resolution Remote-Sensing Imagery Based on Feature Difference and Attention Mechanism. Remote Sens. 2023, 15, 3896. [Google Scholar] [CrossRef]
- He, K.; Zhang, X.; Ren, S.; Sun, J. Deep Residual Learning for Image Recognition. In Proceedings of the IEEE Conference on Computer Vision and Pattern Recognition, Las Vegas, NV, USA, 27–30 June 2016. [Google Scholar] [CrossRef]
- Wu, B.; Xu, C.; Dai, X.; Wan, A.; Zhang, P.; Tomizuka, M.; Keutzer, K.; Vajda, P. Visual transformers: Token-based image representation and processing for computer vision. arXiv 2020, arXiv:2006.03677. [Google Scholar]
- Woo, S.; Park, J.; Lee, J.Y.; Kweon, I.S. CBAM: Convolutional Block Attention Module; Springer: Cham, Switzerland, 2018. [Google Scholar] [CrossRef]


| Dataset | Image Size | Resolution | Number of Images Pairs | Tasks and Change Types | Data Source | Time Span |
|---|---|---|---|---|---|---|
| SZTAKI [7] | 952 × 640 | 1.5 m | 13 | Built-up regions, buildings, planting of trees, etc. | Aerial image, FOMI, Google Earth | 2000–2005, 2000–2007, 1984–2007 |
| AICD [8] | 800 × 600 | 0.5 m | 1000 | trees and buildings, etc. | Aerial images | / |
| WHU-Building [9] | 32,207 × 15,354 | 0.2 m | 16,077 | Buildings | Aerial images | 2012–2016 |
| SYSU-CD [10] | 256 × 256 | 0.5 m | 20,000 | Urban buildings, change of vegetation | Aerial Images | 2007–2014 |
| LEVIR_CD [11] | 1024 × 1021 | 0.5 m | 637 | BCD tasks | Google Earth | 2002–2018 |
| DSIFN [12] | 512 × 512 | 2 m | 442 | City Area change | Google Earth | 2001–2018 |
| GZCD [13] | 1006 × 1168–4936 × 5224 | 0.55 m | 19 | BCD tasks | Google Earth | 2013–2017 |
| OSCD [10,14] | 600 × 600 | 10 m | 24 | Urban growth changes | Sentinel-2 satellites Multispectral images | 2015–2018 |
| HRCUS-CD [15] | 256 × 256 | 0.5 m | 11,388 | Built-up areas and new urban areas. BCD tasks | Satellite image | 2010–2018 2019–2022 |
| S2Looking-CD [16] | 1024 × 1024 | 0.5–0.8 m | 5000 | BCD tasks | Satellite image | 10 years |
| WXCD [17] | 7840 × 6160 | 0.2/0.5 m | / | BCD tasks | UAV/SuperView-1 | 2012–2018 |
| SVCD [18] | 256 × 256 | 0.03–1 m | 16,000 | Object detection | Synthetic and real images | / |
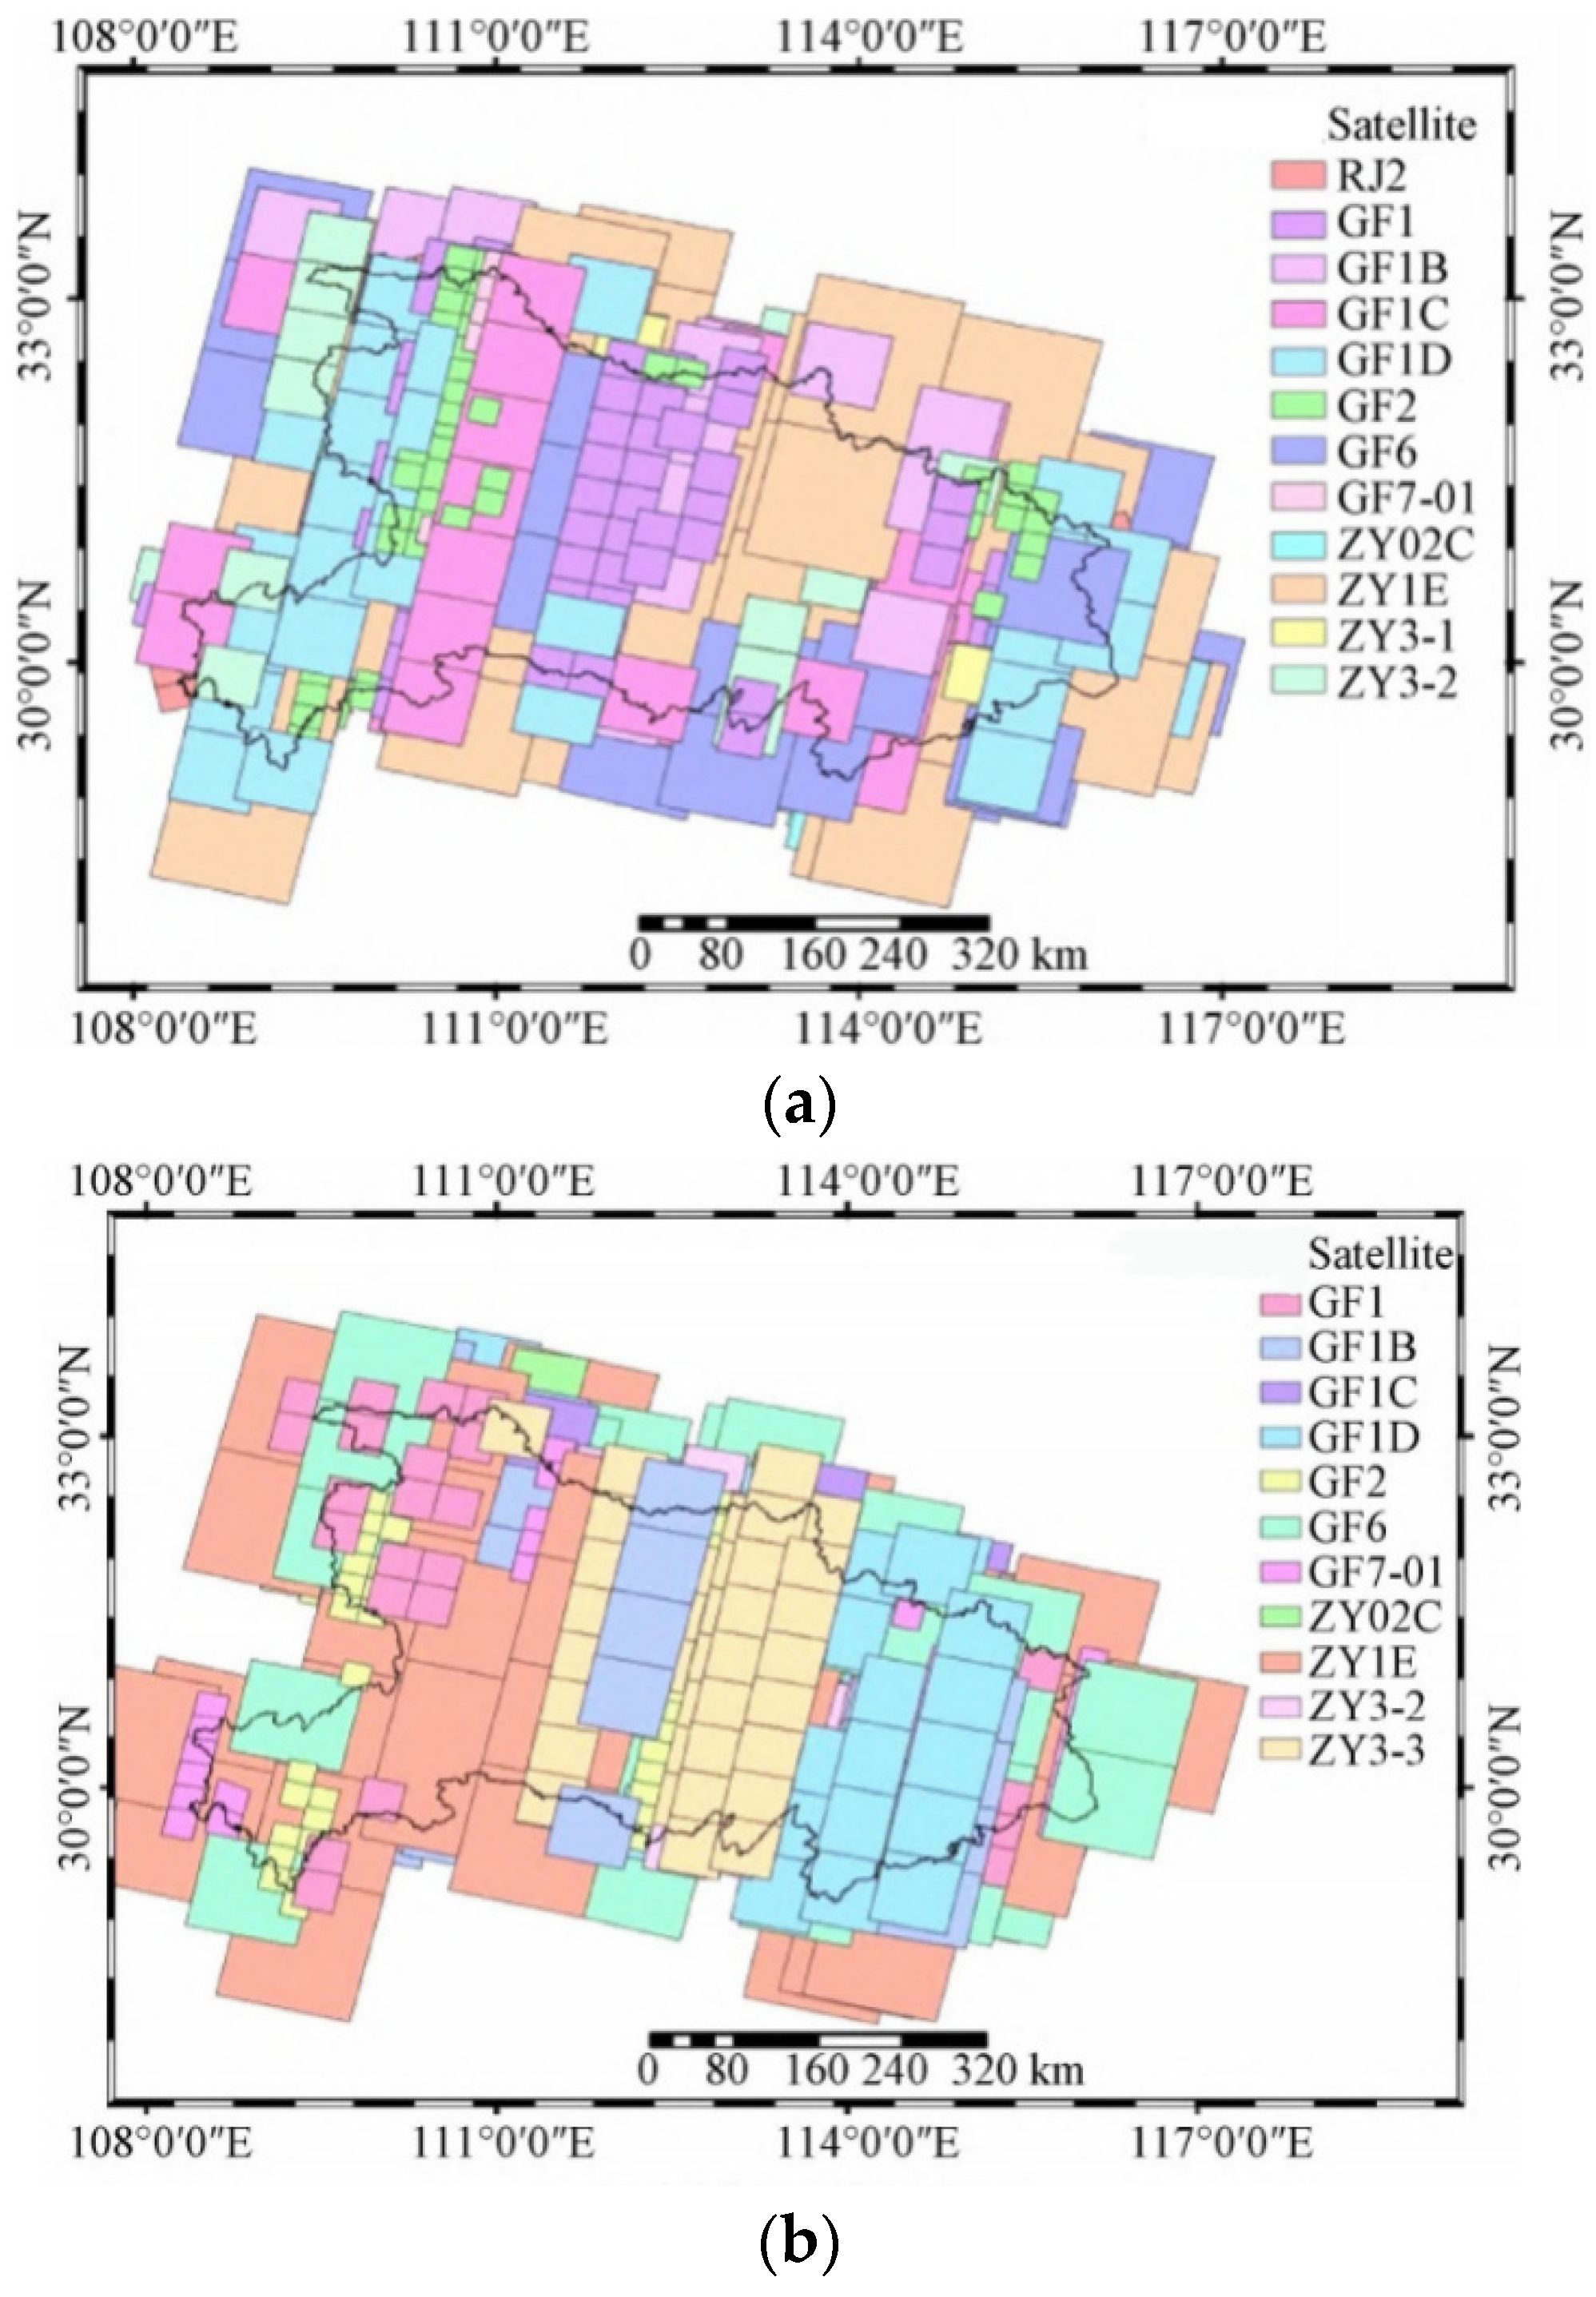
| Satellite Name | Launch Time | Spectral Bands | Resolution (m) | Coverage Area | Orbit Information |
|---|---|---|---|---|---|
| ZY-3 | January 2012 | Visible, Near-Infrared | 2.1–5.8 | Global | Sun-synchronous orbit |
| GF-1 | April 2013 | Visible, Near-Infrared | 2–16 | Global | Sun-synchronous orbit |
| GF-2 | August 2014 | Visible, Near-Infrared | 1–4 | Global | Sun-synchronous orbit |
| GF-6 | June 2018 | Visible, Near-Infrared, Mid-Infrared | 2–8 | Global | Sun-synchronous orbit |
| GF-7 | November 2019 | Visible, Near-Infrared, Mid-Infrared | 0.8–3.2 | Global | Sun-synchronous orbit |
| BJ-1 | September 2008 | Visible, Near-Infrared | 4 | Global | Sun-synchronous orbit |
| No. | Class I | Class II | |
|---|---|---|---|
| 1 | Buildings | Multi-story house building area, low house building area, abandoned house building area, multi-story and above independent house building, low building | Urban construction land |
| 2 | Railroads and Roads | Railroads, highways, city roads, country roads, ramps | Urban construction land |
| 3 | Structures | Hardened surfaces, hydraulic facilities, transportation facilities, city walls, | Urban construction land |
| 4 | Manually excavated land | Open-pit extraction sites, stockpiles Construction sites, other man-made stockpiles Paddy fields | Urban construction land |
| 5 | Cultivated Land | early land, orchards, tea plantations, mulberry plantations, rubber plantations, seedling paintings, flower weeks, other economic seedlings | Ecological living land |
| 6 | Forest and Grass Cover | Tree forests, shrub forests, mixed tree and shrub forests, bamboo forests, open forests, young planted forests, sparse shrubs and grasslands, natural grasslands, artificial grasslands | Ecological land |
| 7 | Water | Rivers, canals, lakes, reservoirs, lakes, glaciers and permanent snow cover | Ecological land |
| 8 | Deserts and Bare Ground | Deserts and bare ground Saline surface, clay surface, sandy surface, rocky surface Rocky surface | Ecological land |
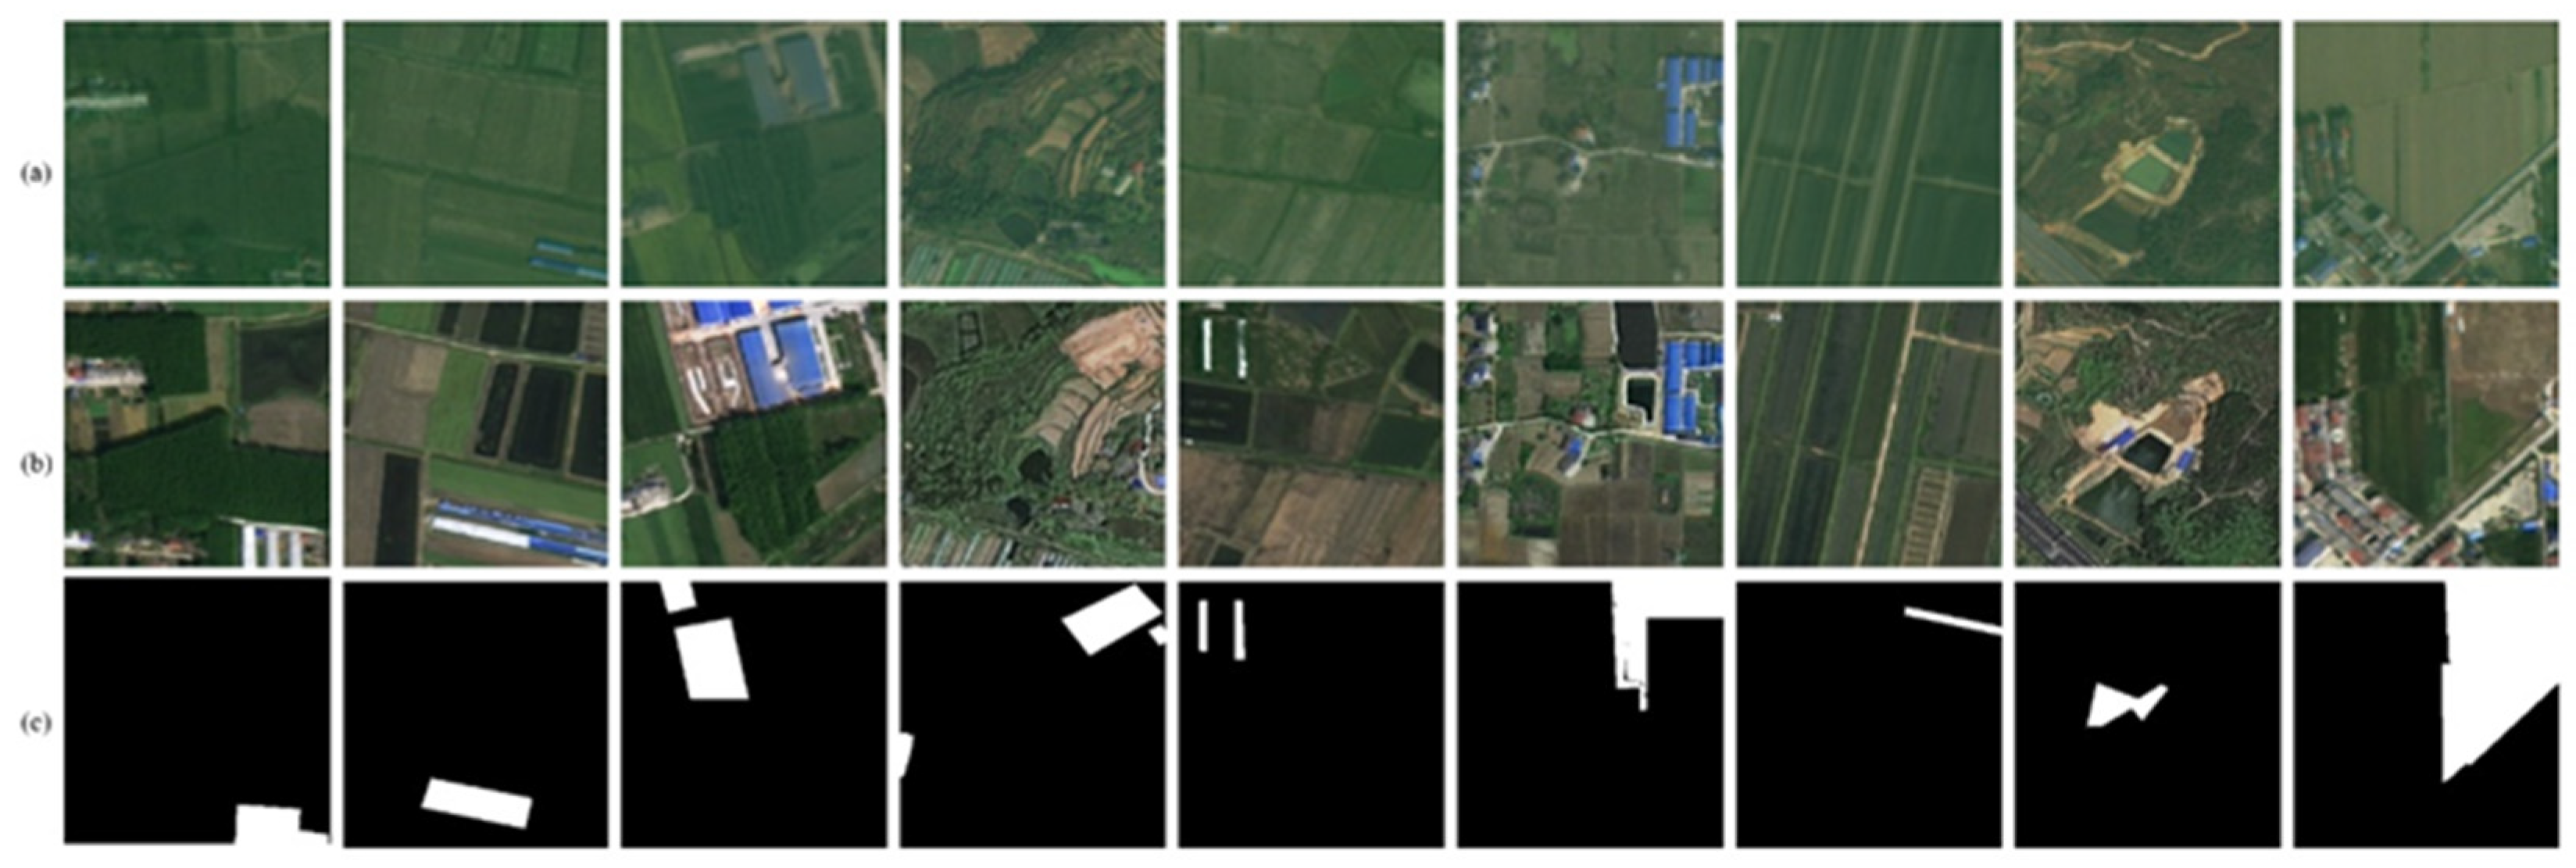
| Sample Type | Pre-Image | Post-Image | Ground Truth |
|---|---|---|---|
| To Forest and Grassland |  |  |  |
| To Greenhouse |  |  |  |
| To Buildings |  |  |  |
| To Traffic Roads |  | 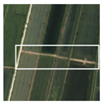 |  |
| To Filling Land |  |  |  |
| To Lake or Water |  | 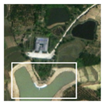 |  |
| To Photovoltaic Power Station |  |  |  |
| To Park |  | 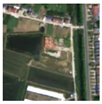 |  |
| To Other Agricultural Facility Land |  |  |  |
| Method | Pre (%) | Rec (%) | F1 (%) | IoU (%) | OA (%) |
|---|---|---|---|---|---|
| SNUNet | 64.88 | 66.30 | 60.09 | 57.96 | 92.76 |
| DTCDSCN | 72.82 | 64.33 | 65.32 | 58.16 | 93.05 |
| BIT | 73.64 | 63.11 | 66.51 | 57.67 | 93.23 |
| BaseLine | 74.24 | 63.51 | 67.41 | 58.27 | 93.31 |
| +CBAM | 77.33 | 63.73 | 68.31 | 59.14 | 93.42 |
| +CBAM + AM | 77.96 | 63.76 | 68.50 | 59.29 | 93.56 |
| Method | Pre (%) | Rec (%) | F1 (%) | IoU (%) | OA (%) |
|---|---|---|---|---|---|
| SNUNet | 89.14 | 87.40 | 87.72 | 78.37 | 98.75 |
| DTCDSCN | 88.16 | 86.50 | 87.32 | 77.35 | 98.02 |
| BIT | 88.67 | 88.66 | 87.63 | 79.51 | 98.61 |
| BaseLine | 88.72 | 88.76 | 87.86 | 79.62 | 98.69 |
| +CBAM | 88.89 | 88.85 | 88.55 | 79.83 | 98.79 |
| +CBAM + AM | 89.14 | 88.83 | 88.56 | 79.84 | 98.83 |
| Method | Pre (%) | Rec (%) | F1 (%) | IoU (%) | OA (%) |
|---|---|---|---|---|---|
| SNUNet | 78.37 | 82.20 | 73.34 | 71.09 | 97.62 |
| DTCDSCN | 80.74 | 81.20 | 78.32 | 70.77 | 97.25 |
| BIT | 84.98 | 82.64 | 83.77 | 72.90 | 97.21 |
| BaseLine | 85.08 | 83.64 | 84.07 | 73.09 | 98.11 |
| +CBAM | 85.45 | 83.50 | 84.16 | 73.25 | 98.32 |
| +CBAM + AM | 85.55 | 83.54 | 84.29 | 73.41 | 98.39 |
| Method | Self-Built | LEVIR-CD | WHU-CD |
|---|---|---|---|
| SNUNet | 1 h 02 min | 13 h 42 min | 11 h 10 min |
| DTCDSCN | 2 h 47 min | 15 h 21 min | 9 h 39 min |
| BIT | 1 h 43 min | 17 h 15 min | 11 h 58 min |
| BaseLine | |||
| +CBAM | 1 h 38 min | 15 h 56 min | 11 h 28 min |
| +CBAM + AM | 1 h 41 min | 16 h 32 min | 11 h 42 min |
Disclaimer/Publisher’s Note: The statements, opinions and data contained in all publications are solely those of the individual author(s) and contributor(s) and not of MDPI and/or the editor(s). MDPI and/or the editor(s) disclaim responsibility for any injury to people or property resulting from any ideas, methods, instructions or products referred to in the content. |
© 2024 by the authors. Licensee MDPI, Basel, Switzerland. This article is an open access article distributed under the terms and conditions of the Creative Commons Attribution (CC BY) license (https://creativecommons.org/licenses/by/4.0/).
Share and Cite
Li, F.; Zhou, F.; Zhang, G.; Xiao, J.; Zeng, P. HSAA-CD: A Hierarchical Semantic Aggregation Mechanism and Attention Module for Non-Agricultural Change Detection in Cultivated Land. Remote Sens. 2024, 16, 1372. https://doi.org/10.3390/rs16081372
Li F, Zhou F, Zhang G, Xiao J, Zeng P. HSAA-CD: A Hierarchical Semantic Aggregation Mechanism and Attention Module for Non-Agricultural Change Detection in Cultivated Land. Remote Sensing. 2024; 16(8):1372. https://doi.org/10.3390/rs16081372
Chicago/Turabian StyleLi, Fangting, Fangdong Zhou, Guo Zhang, Jianfeng Xiao, and Peng Zeng. 2024. "HSAA-CD: A Hierarchical Semantic Aggregation Mechanism and Attention Module for Non-Agricultural Change Detection in Cultivated Land" Remote Sensing 16, no. 8: 1372. https://doi.org/10.3390/rs16081372
APA StyleLi, F., Zhou, F., Zhang, G., Xiao, J., & Zeng, P. (2024). HSAA-CD: A Hierarchical Semantic Aggregation Mechanism and Attention Module for Non-Agricultural Change Detection in Cultivated Land. Remote Sensing, 16(8), 1372. https://doi.org/10.3390/rs16081372