1. Introduction
Research on urban growth and ecological environment protection carries significant global implications. Urban growth exerts a profound impact on climate change and biodiversity, while ecological environment protection plays a crucial role in global ecological balance and sustainable development [
1,
2,
3]. Rapid urban growth results in reduced habitat comfort in cities, elevated CO
2 concentrations, and nitrogen deposition in urban ecosystems, leading to the deterioration of urban environments [
4,
5]. Urban expansion further encroaches on natural habitats, resulting in significant habitat loss for wildlife [
6,
7]. Studying urban growth helps in comprehending its global environmental impacts, facilitating climate change response, safeguarding wildlife habitats, effectively managing resources, and fostering international cooperation for harmonious natural, social, and economic development world-wide.
China’s urban growth, distinguished by its rapid development and vast scale, features government-led planning and includes interconnections between urban and rural areas, as well as significant land-use changes. Policies geared towards supporting urbanization and ecological environmental research in China encompass multiple areas. The “National New Urbanization Plan (2014–2020)” outlines paths and goals for urban development, emphasizing the importance of sustainable urban development and ecological environmental protection. This plan directs policies on urban spatial layout and resource and environmental protection, as well as urban ecosystem construction. Furthermore, the “Ecological Civilization Construction Assessment and Evaluation System” is dedicated to assessing local governments’ performance in ecological environment protection, underscoring China’s commitment to a development model that harmonizes urbanization with ecological environment protection.
Nighttime light remote sensing data, in contrast to traditional research methods, provide a more straightforward and intuitive approach, aptly reflecting the changes in urban and economic spatiotemporal patterns on a large scale. Consequently, these data are extensively utilized in researching urban growth and economic development. This approach offers an innovative perspective on analyzing the complex dynamics of urban growth and economic changes.
Studies such as Liu et al.’s (2012) analyzed the dynamics of urban expansion in China from 1992 to 2008, demonstrating the utility of nighttime light data in dissecting urban sprawl dynamics [
8]. Similarly, Zhang et al., (2011) employed nighttime light data to map urbanization dynamics at both regional and global scales [
9]. In addition, the correlation analyses conducted by Huang et al., (2016) revealed a significant relationship between urbanization levels and nighttime light intensity, bolstering the argument for luminosity data as a reliable indicator of urban expansion [
10]. Furthermore, Fang et al., (2022) explored future scenarios of urban nighttime lights and linked it to urban expansion and carbon emission estimations, providing a forward-looking perspective on urban growth and its environmental implications [
11].
In general, these findings underscore the indispensable role of nighttime light remote sensing data in urban studies, which highlight the potential of nighttime light data as a scalable, timely, and cost-effective tool for monitoring urbanization patterns and understanding socio–economic and environmental ramifications.
Existing research based on nighttime light remote sensing data in urban areas primarily unfolds in the following aspects: investigating the spatiotemporal changes and urban built-up area data in various urban development conditions [
10,
12], revealing urban expansion dynamics and spatiotemporal evolution patterns in China’s urbanization [
13,
14,
15]; exploring urbanization and economic development, discovering varying growth trends in nighttime illumination areas in cities of different types at national and city levels [
16,
17,
18,
19]; assessing urban economic activities and environmental pollution, [
20,
21,
22], exploring relationships between nighttime light data, urban built-up area density, human activities, and evaluating urban environmental pollution like light pollution [
23,
24,
25]; and studying humanitarian disasters and armed conflict damages, applying nighttime light data to large-scale civil wars in countries like Russia, Ukraine, Syria, Iraq, and Yemen, obtaining spatiotemporal information about wars and disasters that is difficult to acquire through traditional means, with findings supporting international peace efforts [
26,
27,
28].
From the analysis of existing research, it becomes clear that current studies utilizing nighttime light remote sensing data on urbanization in China rarely consider the spatiotemporal distribution and evolution trends of nighttime lights across multiple regions within China. Furthermore, the application of nighttime light data in urban ecological environmental research frequently focuses solely on the study of light pollution, neglecting the integration of other remote sensing data for comprehensive analysis.
To address the aforementioned gaps, this study employs NPP/VIIRS nighttime light data alongside analytical methods such as standard deviation ellipses to investigate the spatiotemporal trends of nighttime lights in China from 2013 to 2021. Additionally, this research integrates Landsat 8 remote sensing data to calculate remote sensing ecological index models, thereby examining the impact of urban expansion on the ecological environment. Moreover, it assesses the economic development and ecological environmental quality of various regions and major cities in China, offering a scientific basis for cities to achieve a balance between economic growth and environmental protection. This approach contributes to a more nuanced understanding of the interplay between urbanization and environmental sustainability.
3. Methods
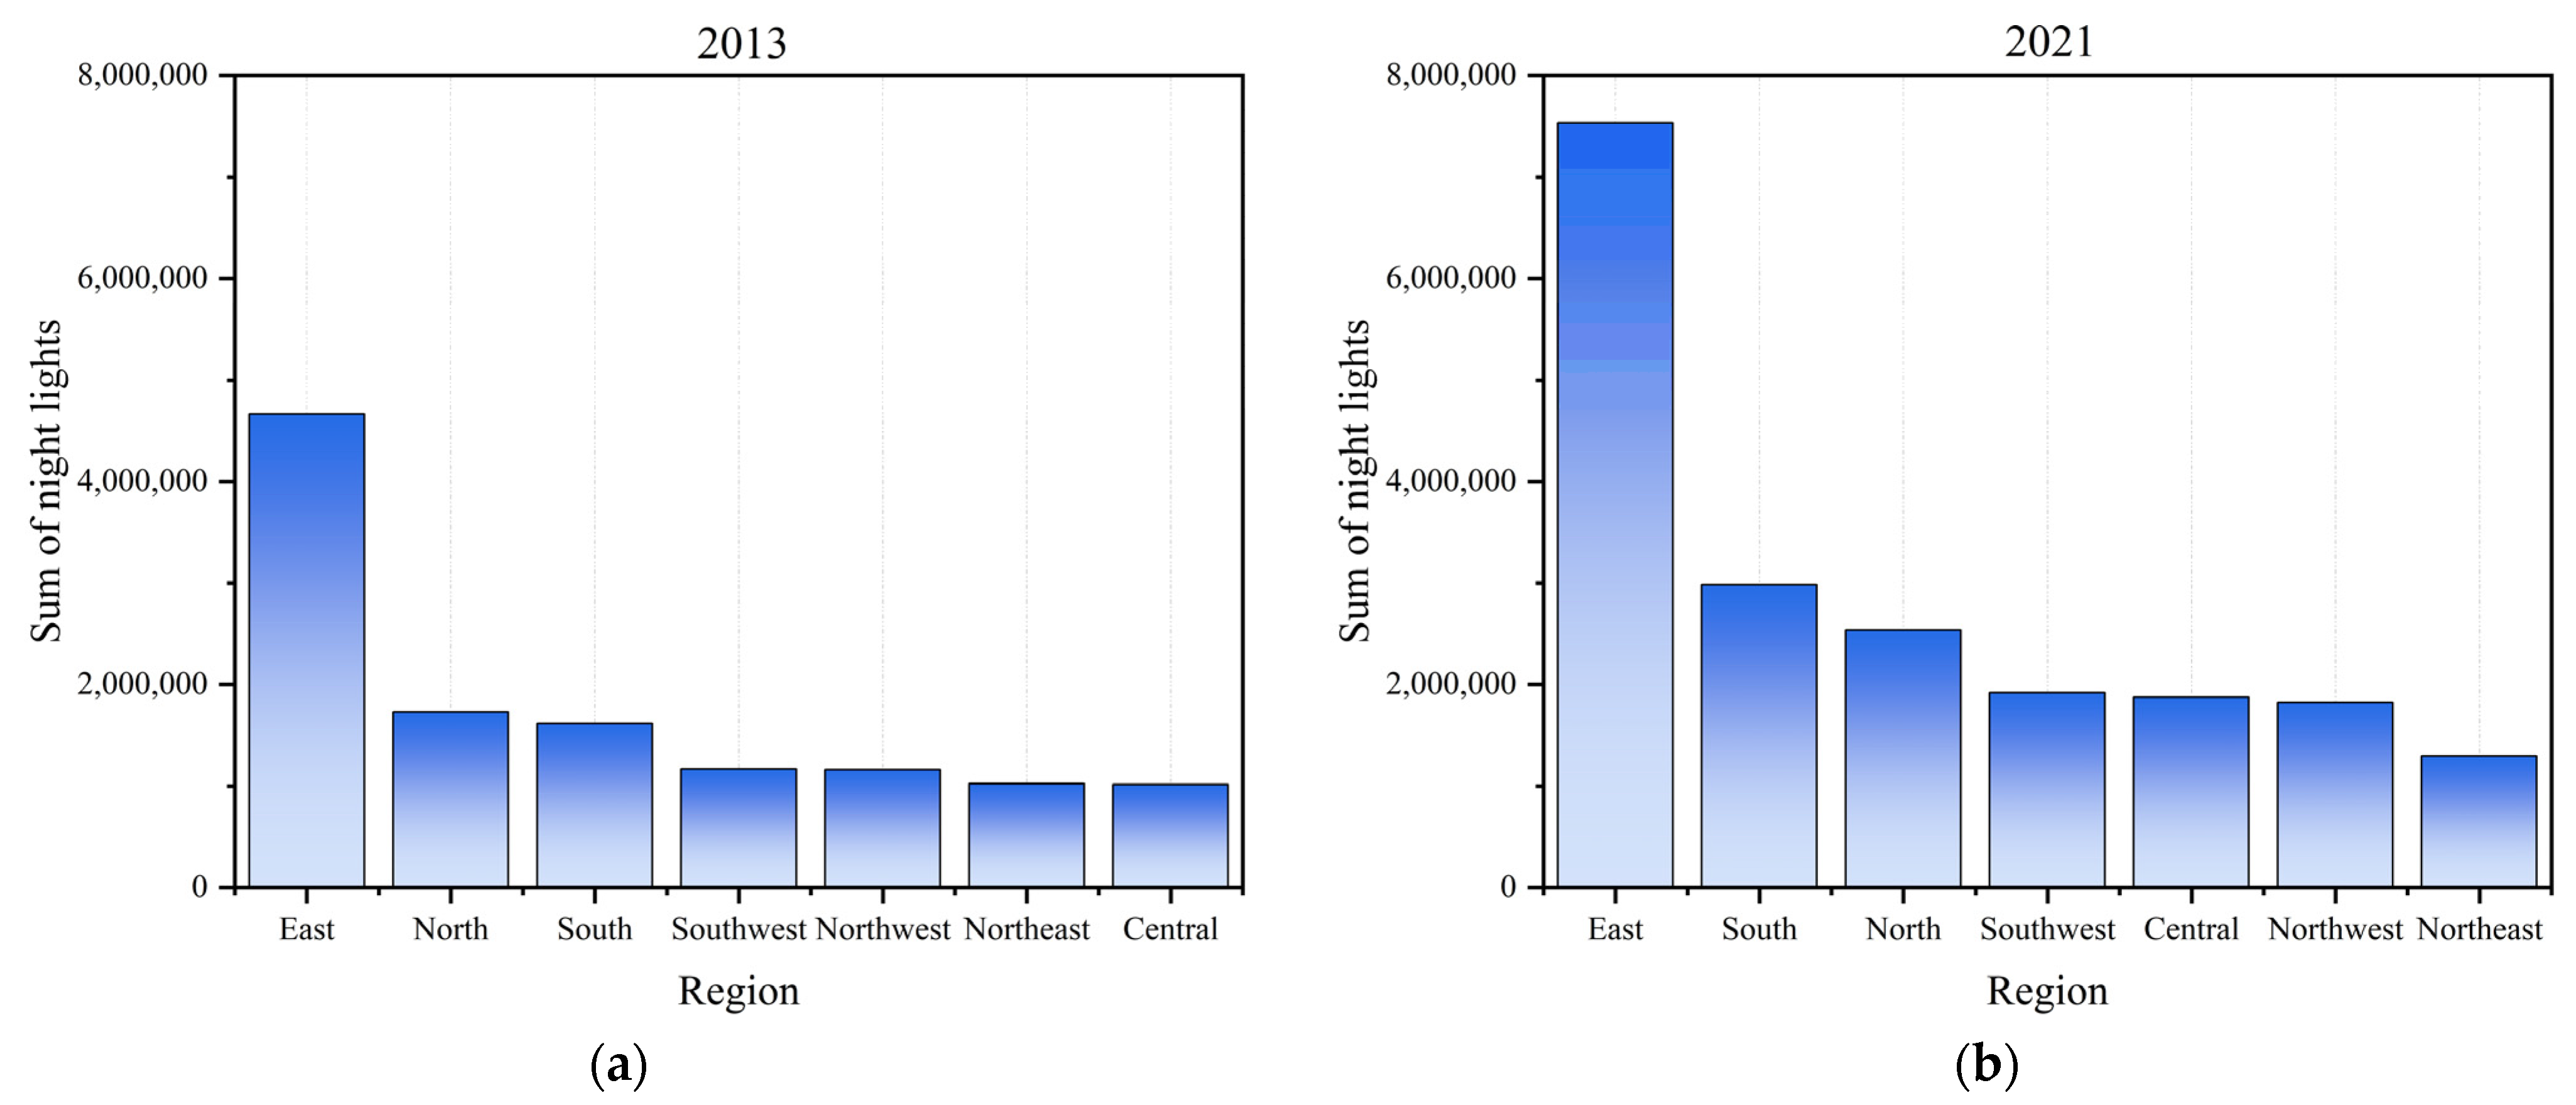
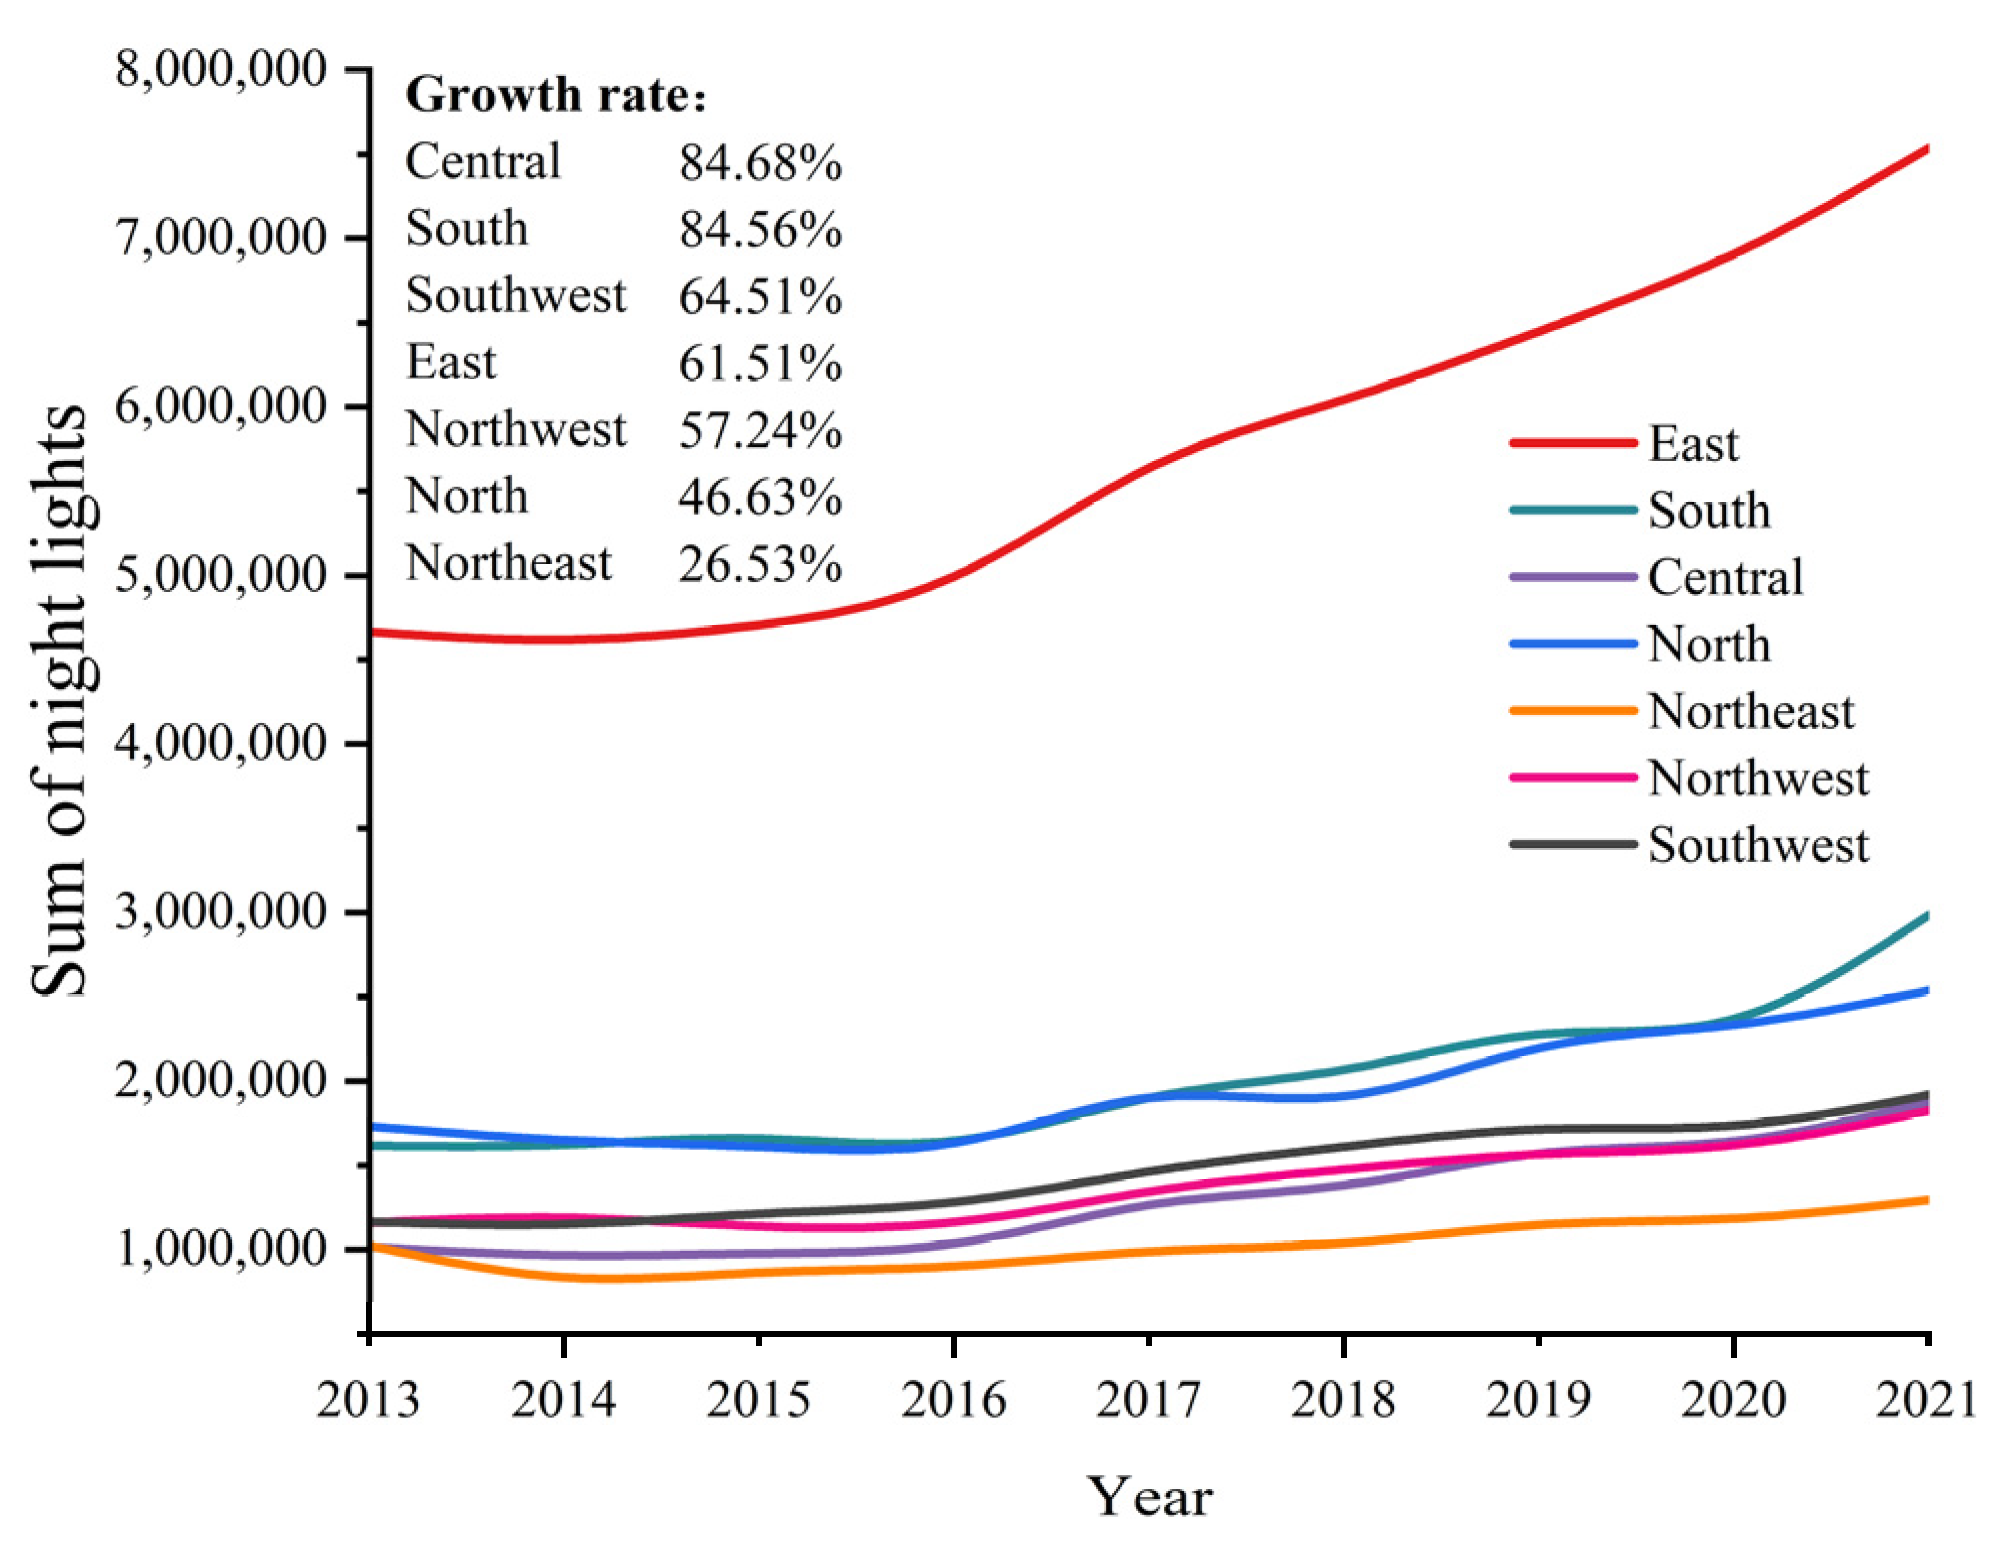
Initially, a statistical analysis of the total amount and growth rate of nighttime light data across various regions of China from 2013 to 2021 was performed. Subsequently, the evolution trends of nighttime lights in these regions and across China were discussed utilizing the standard deviation ellipse method. Finally, changes in ecological environmental quality in selected representative cities were analyzed through the application of a remote sensing ecological model, offering insights into the interplay between urban development and ecological sustainability.
3.1. Statistics for Total Nighttime Light and Growth Rate
Referring to the method described by Gao et al. [
30], the total nighttime light (
T) and the growth rate of nighttime lights (
r) were calculated according to a specific formula:
In the formula, represents the digital number of the i-th pixel. is the total brightness of lights in 2021, and represents the total brightness of lights in 2013.
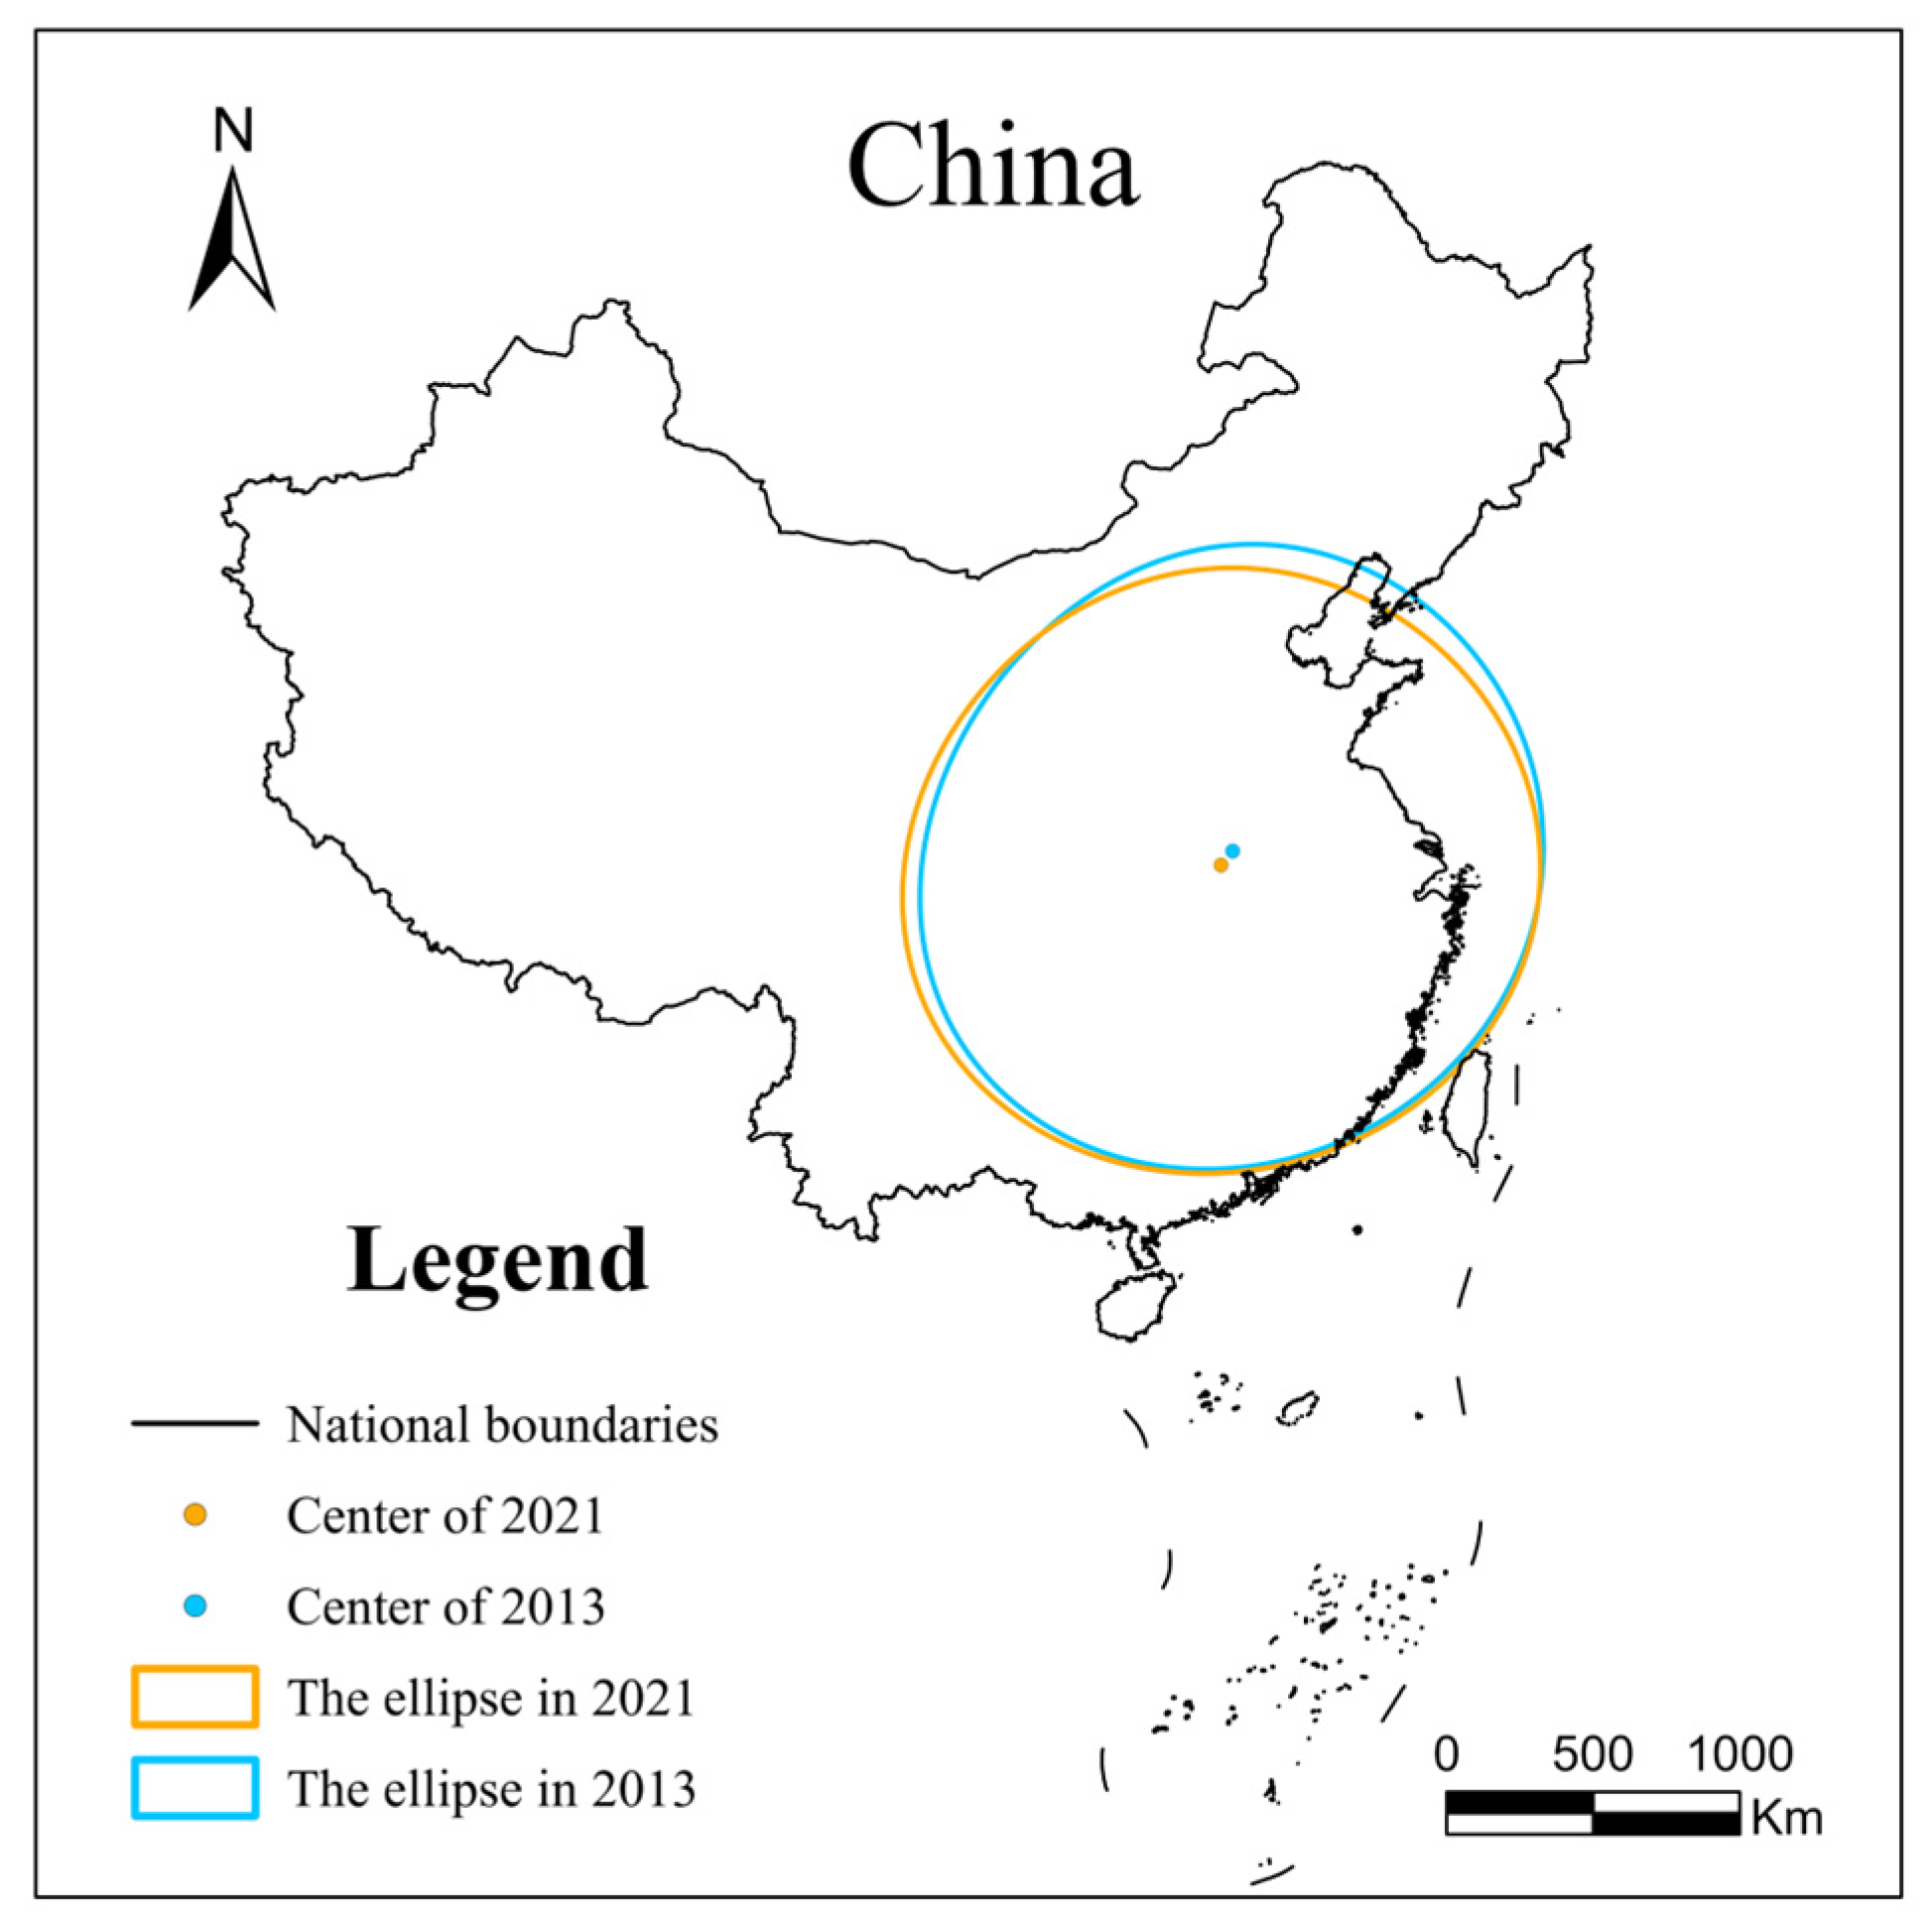
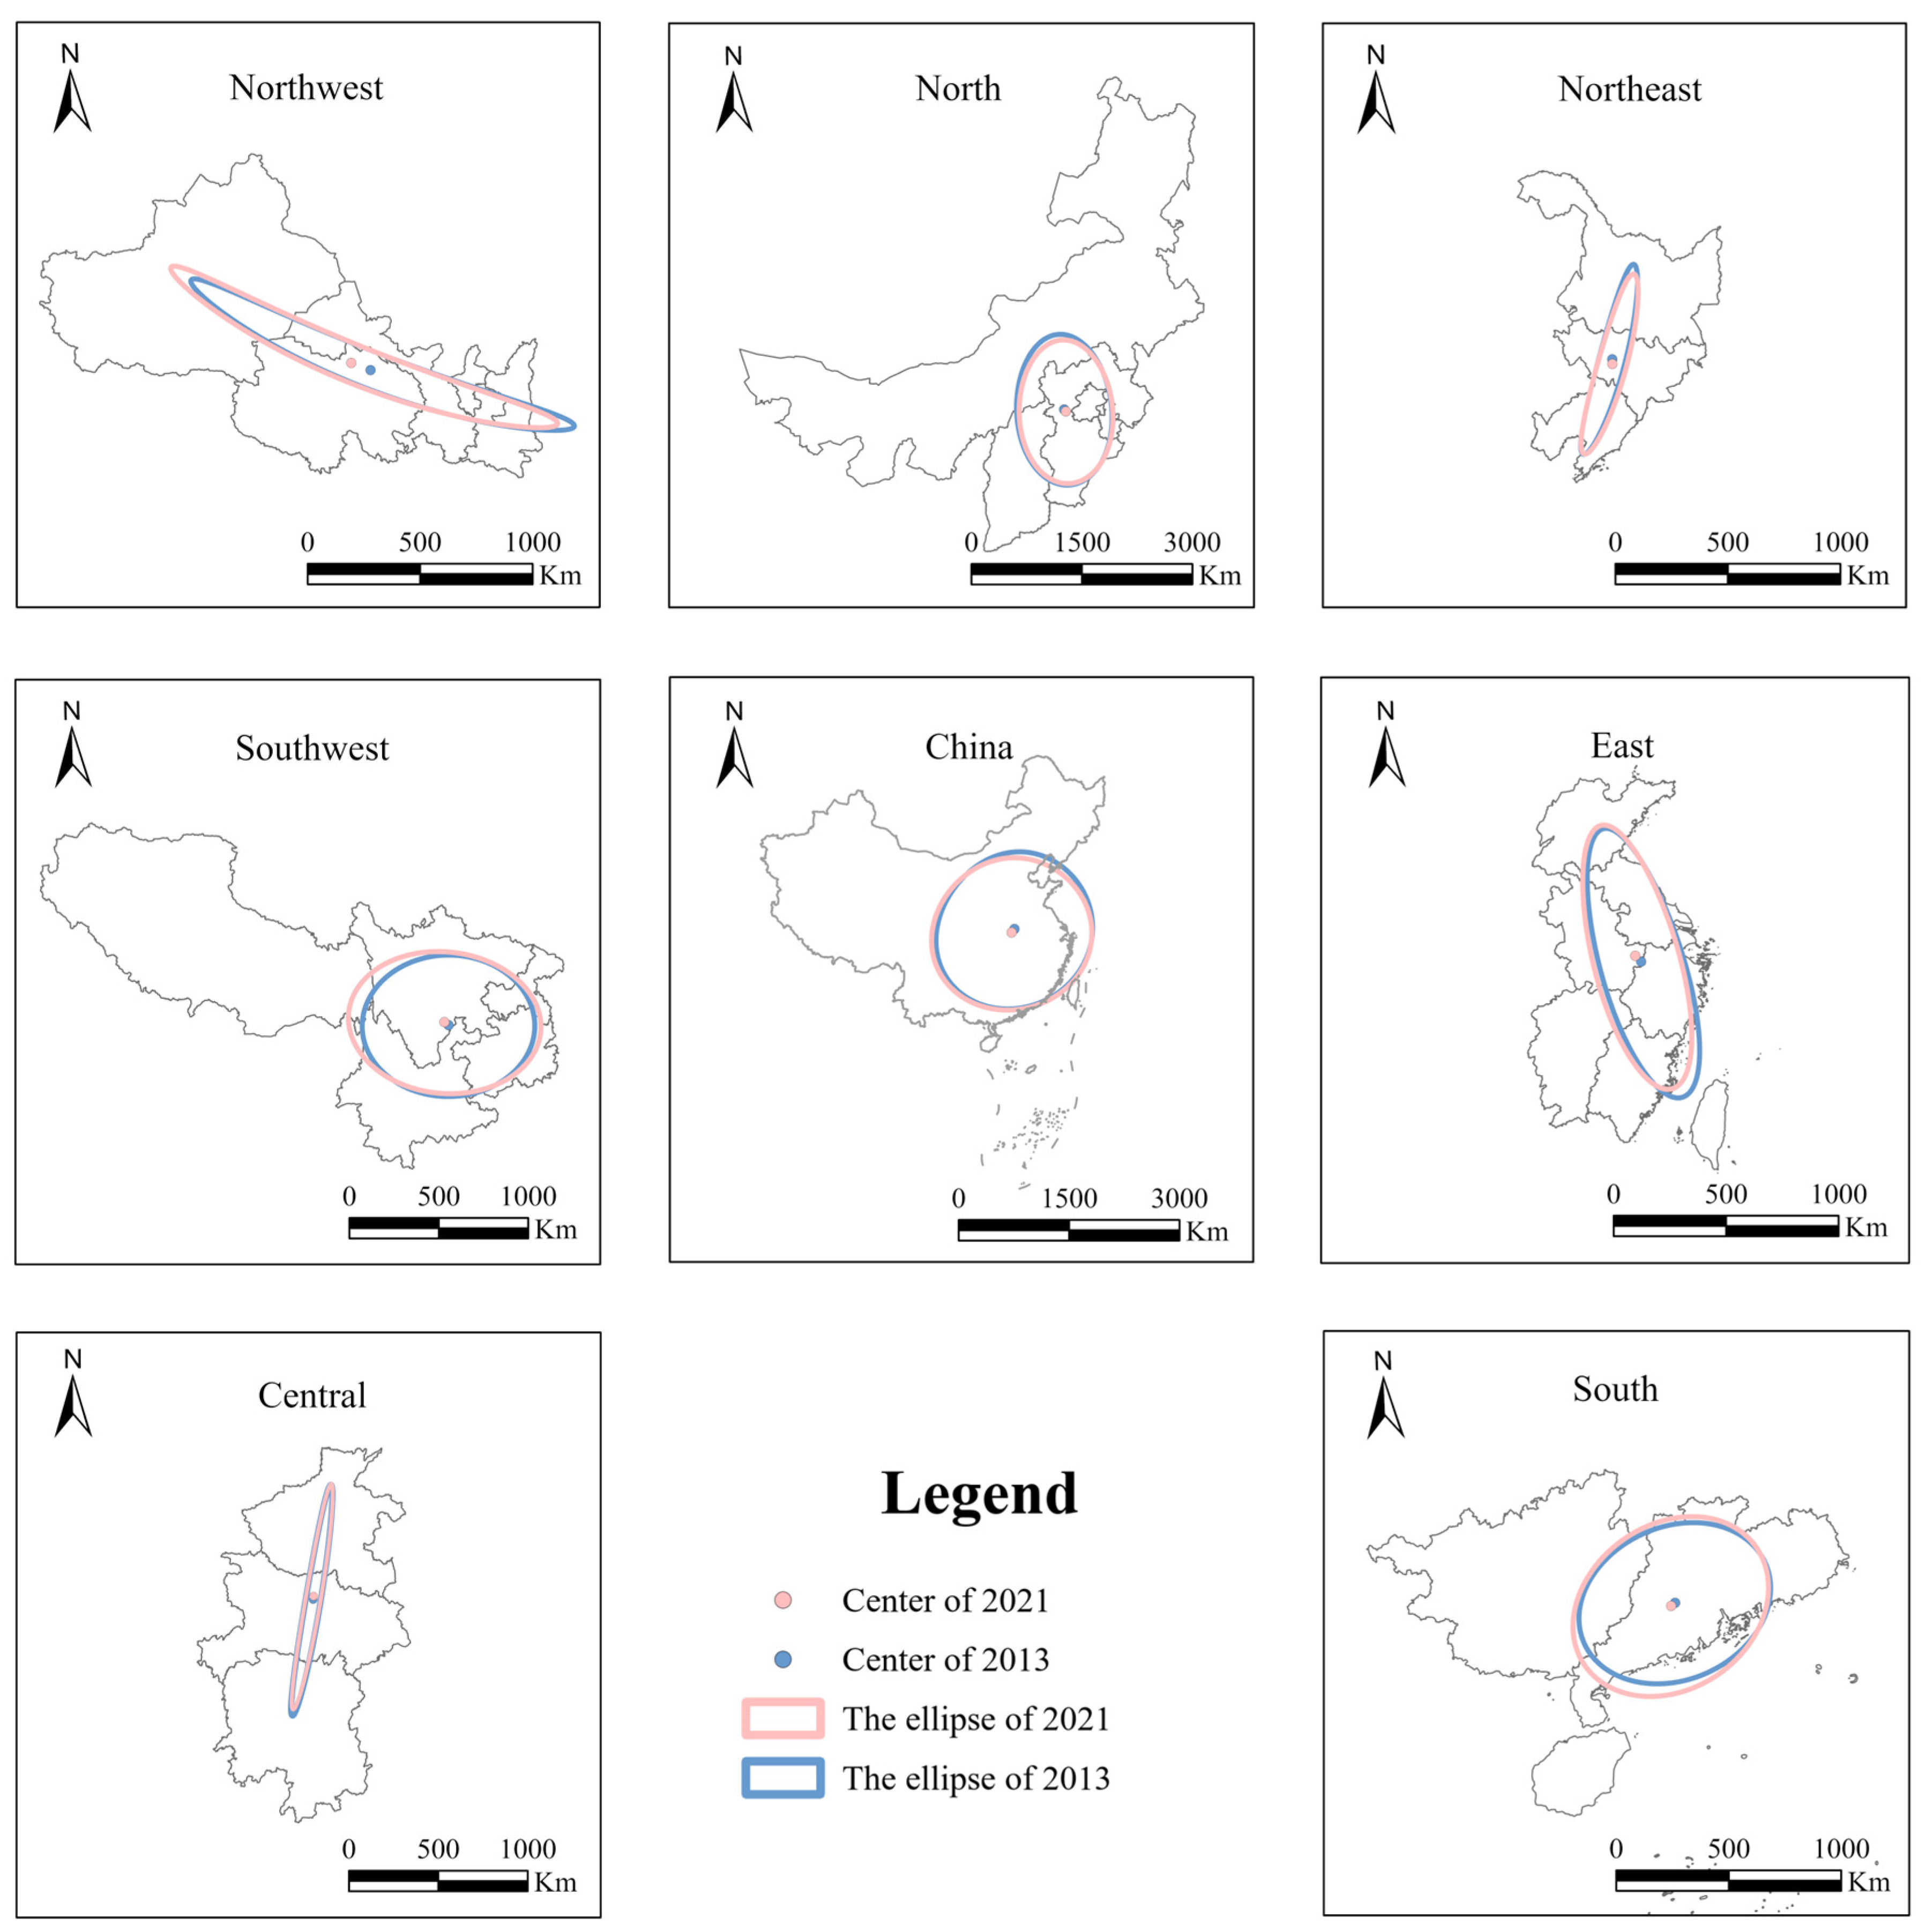
3.2. Standard Deviation Ellipse Method
The standard deviation ellipse method can unveil the spatial distribution of specific geographic characteristics. The standard deviation ellipse model is composed of four key parameters: the centroid, the major axis, the orientation angle, and the area. The centroid acts as the center of the standard deviation ellipse. The major axis is used to demonstrate the trend of spatial distribution. The orientation angle reflects the dominant direction of change in the distribution of the target geographic feature within a given geographic space. The area indicates the spatial distribution scope of the geographic feature being studied. Scholars have widely employed this method to analyze geographical elements, urban patterns, and the distribution of economic development, making it a valuable tool in the fields of geography and urban studies [
31,
32,
33].
The standard deviation ellipse model consists of four primary parameters: centroid, major axis, orientation, and area. The centroid serves as the center of the ellipse; the major axis denotes the trend of spatial distribution; orientation indicates the dominant direction of the target geographic element in a specific geographic space; and the area depicts the spatial distribution range of the studied geographic element. The centroid
of the standard deviation ellipse model can be obtained through the following formula:
The calculation method for the orientation angle (
α) is as follows:
The calculation methods for the standard deviations along the x-axis and y-axis (
and
) are as follows:
In the formula, represents the weight corresponding to the light data; and indicate the coordinate deviations of the ωth pixel unit from the centroids and .
3.3. Remote Sensing Ecological Index Model
Xu Hanqiu et al. employed the principal component analysis method to develop a Remote Sensing Ecological Index (RSEI) model, which effectively captures changes in the ecological environment [
34]. Owing to its ease of data acquisition and capacity for spatial–temporal analysis visualization, this model has seen extensive applications in studies of ecological environments in urban areas, wetlands, nature reserves, and deserts. Its broad applicability underscores its value in environmental monitoring and management [
35,
36,
37].
The RSEI originates from four key factors: the Normalized Difference Vegetation Index (NDVI), the Wetness Index (WET), the calculation of the Heat Index (Land Surface Temperature, LST), and the Dryness Index (Normalized Differential Build-up and Bare Soil Index, NDBSI). This model integrates these indicators through principal component analysis, thus overcoming the limitations of single indicators and enabling a more rational composite assessment. Furthermore, it facilitates the visualization of evaluation results, thereby providing a clearer observation of the spatial–temporal changes in regional ecological environments, making it a valuable tool for ecological analysis.
3.3.1. Normalized Difference Vegetation Index (NDVI)
In the Equation below as presented
In the formula, NIR represents the reflectance in the near-infrared band, and RED represents the reflectance in the red band.
3.3.2. Wetness Index (WET)
The Wetness Index (
WET) is obtained through a Tasseled Cap Transformation, and its calculation method is as follows:
In the formula, represent the sensor parameters for the Landsat 8 OLI, which are 0.1511, 0.1972, 0.3283, 0.3407, 0.7117, and 0.4559. BLUE denotes the reflectance for the blue band; GREEN for the green band; RED for the red band; NIR for the near-infrared band; SWIR1 for the short-wave infrared band 1; and SWIR2 for the short-wave infrared band 2.
3.3.3. Heat Index (LST)
The Heat Index (Land Surface Temperature,
LST) is derived from the thermal infrared band in the Level 2 products of the Landsat 8 satellite, and its calculation method is as follows:
In the formula, Band10 represents the pixel value of the thermal infrared band.
3.3.4. Dryness Index (NDBSI)
The Dryness Index (
NDBSI) is derived from the average of the Urban Building Index (
IBI) and the Bare Soil Index (
SI). The range of this index is between −1 and 1, where higher values indicate greater dryness. Its calculation method is as follows:
In the formula, SWIR1 represents the reflectance in the mid-infrared band 1; RED is the reflectance in the red band; NIR denotes the reflectance in the near-infrared band; BLUE is the blue band reflectance; and GREEN is the green band reflectance.
3.3.5. The Construction of the Remote Sensing Ecological Index
The process involves conducting a principal component analysis on the four key factors extracted. The first principal component (
PC1) is used, processed through a specific calculation method, to obtain the unnormalized Remote Sensing Ecological Index (
RSEI0):
The calculated
RSEI0 is normalized to obtain the
RSEI, and the normalization method is as follows:
5. Discussion
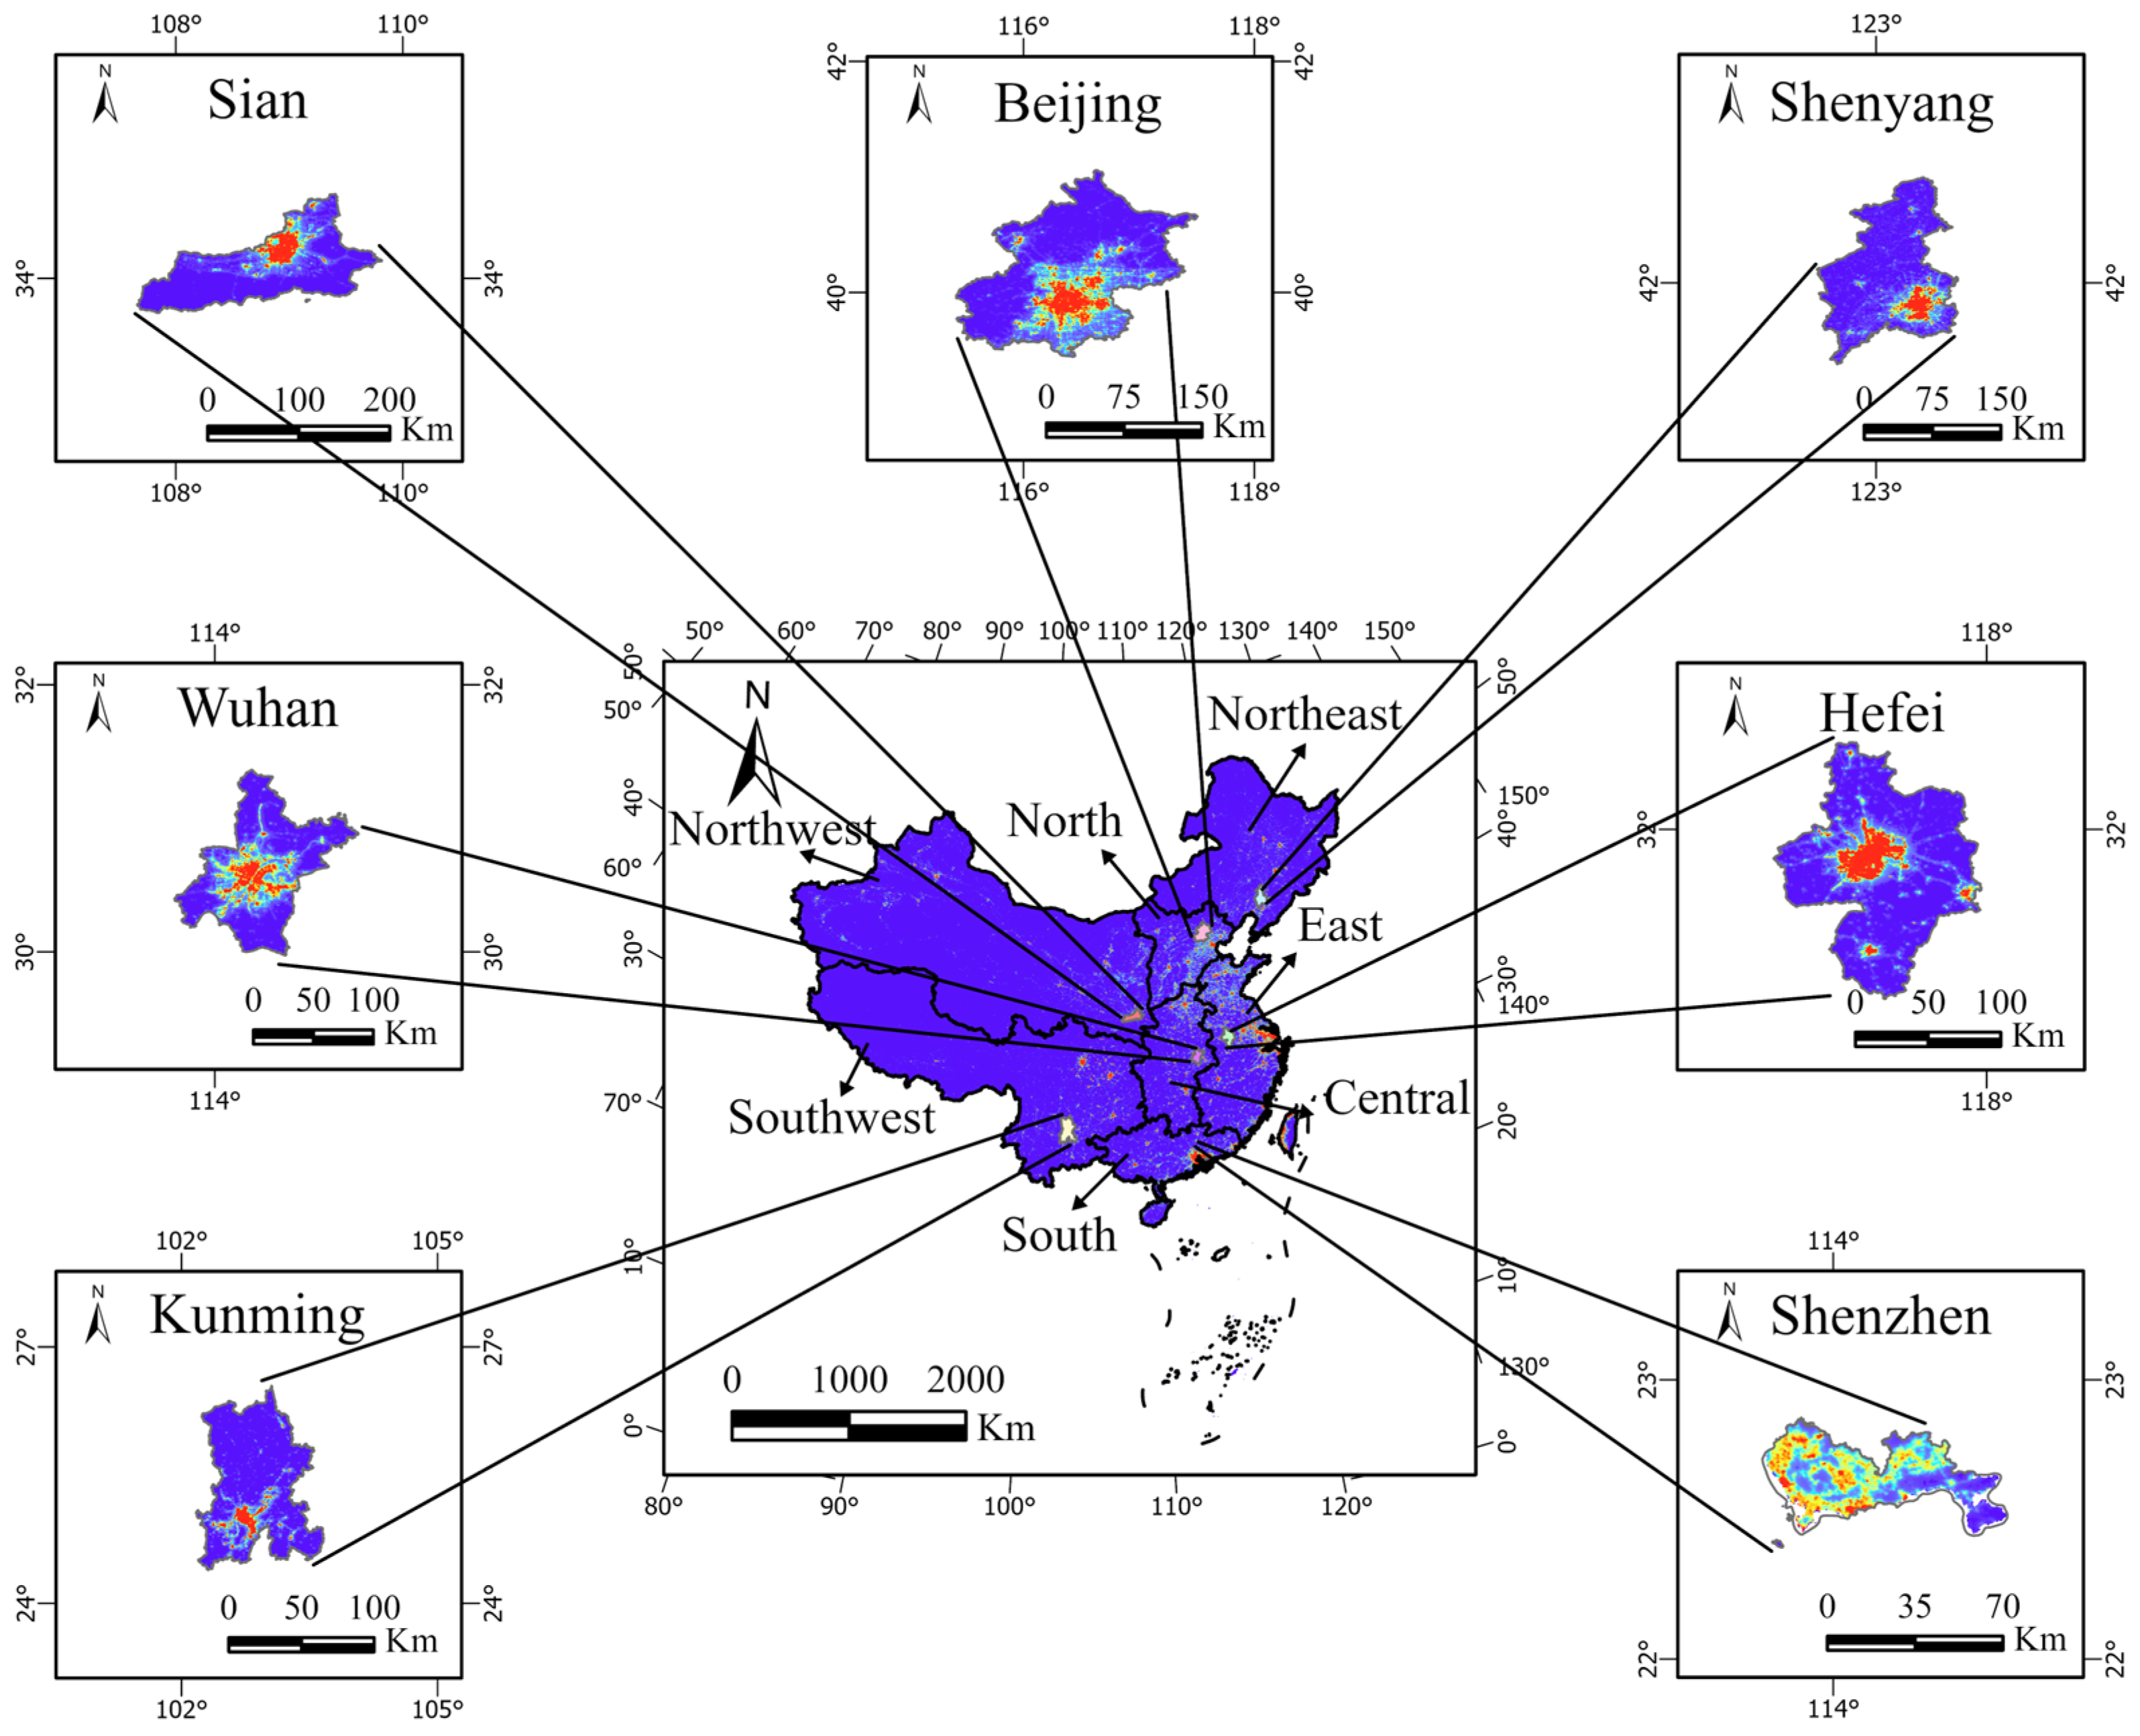
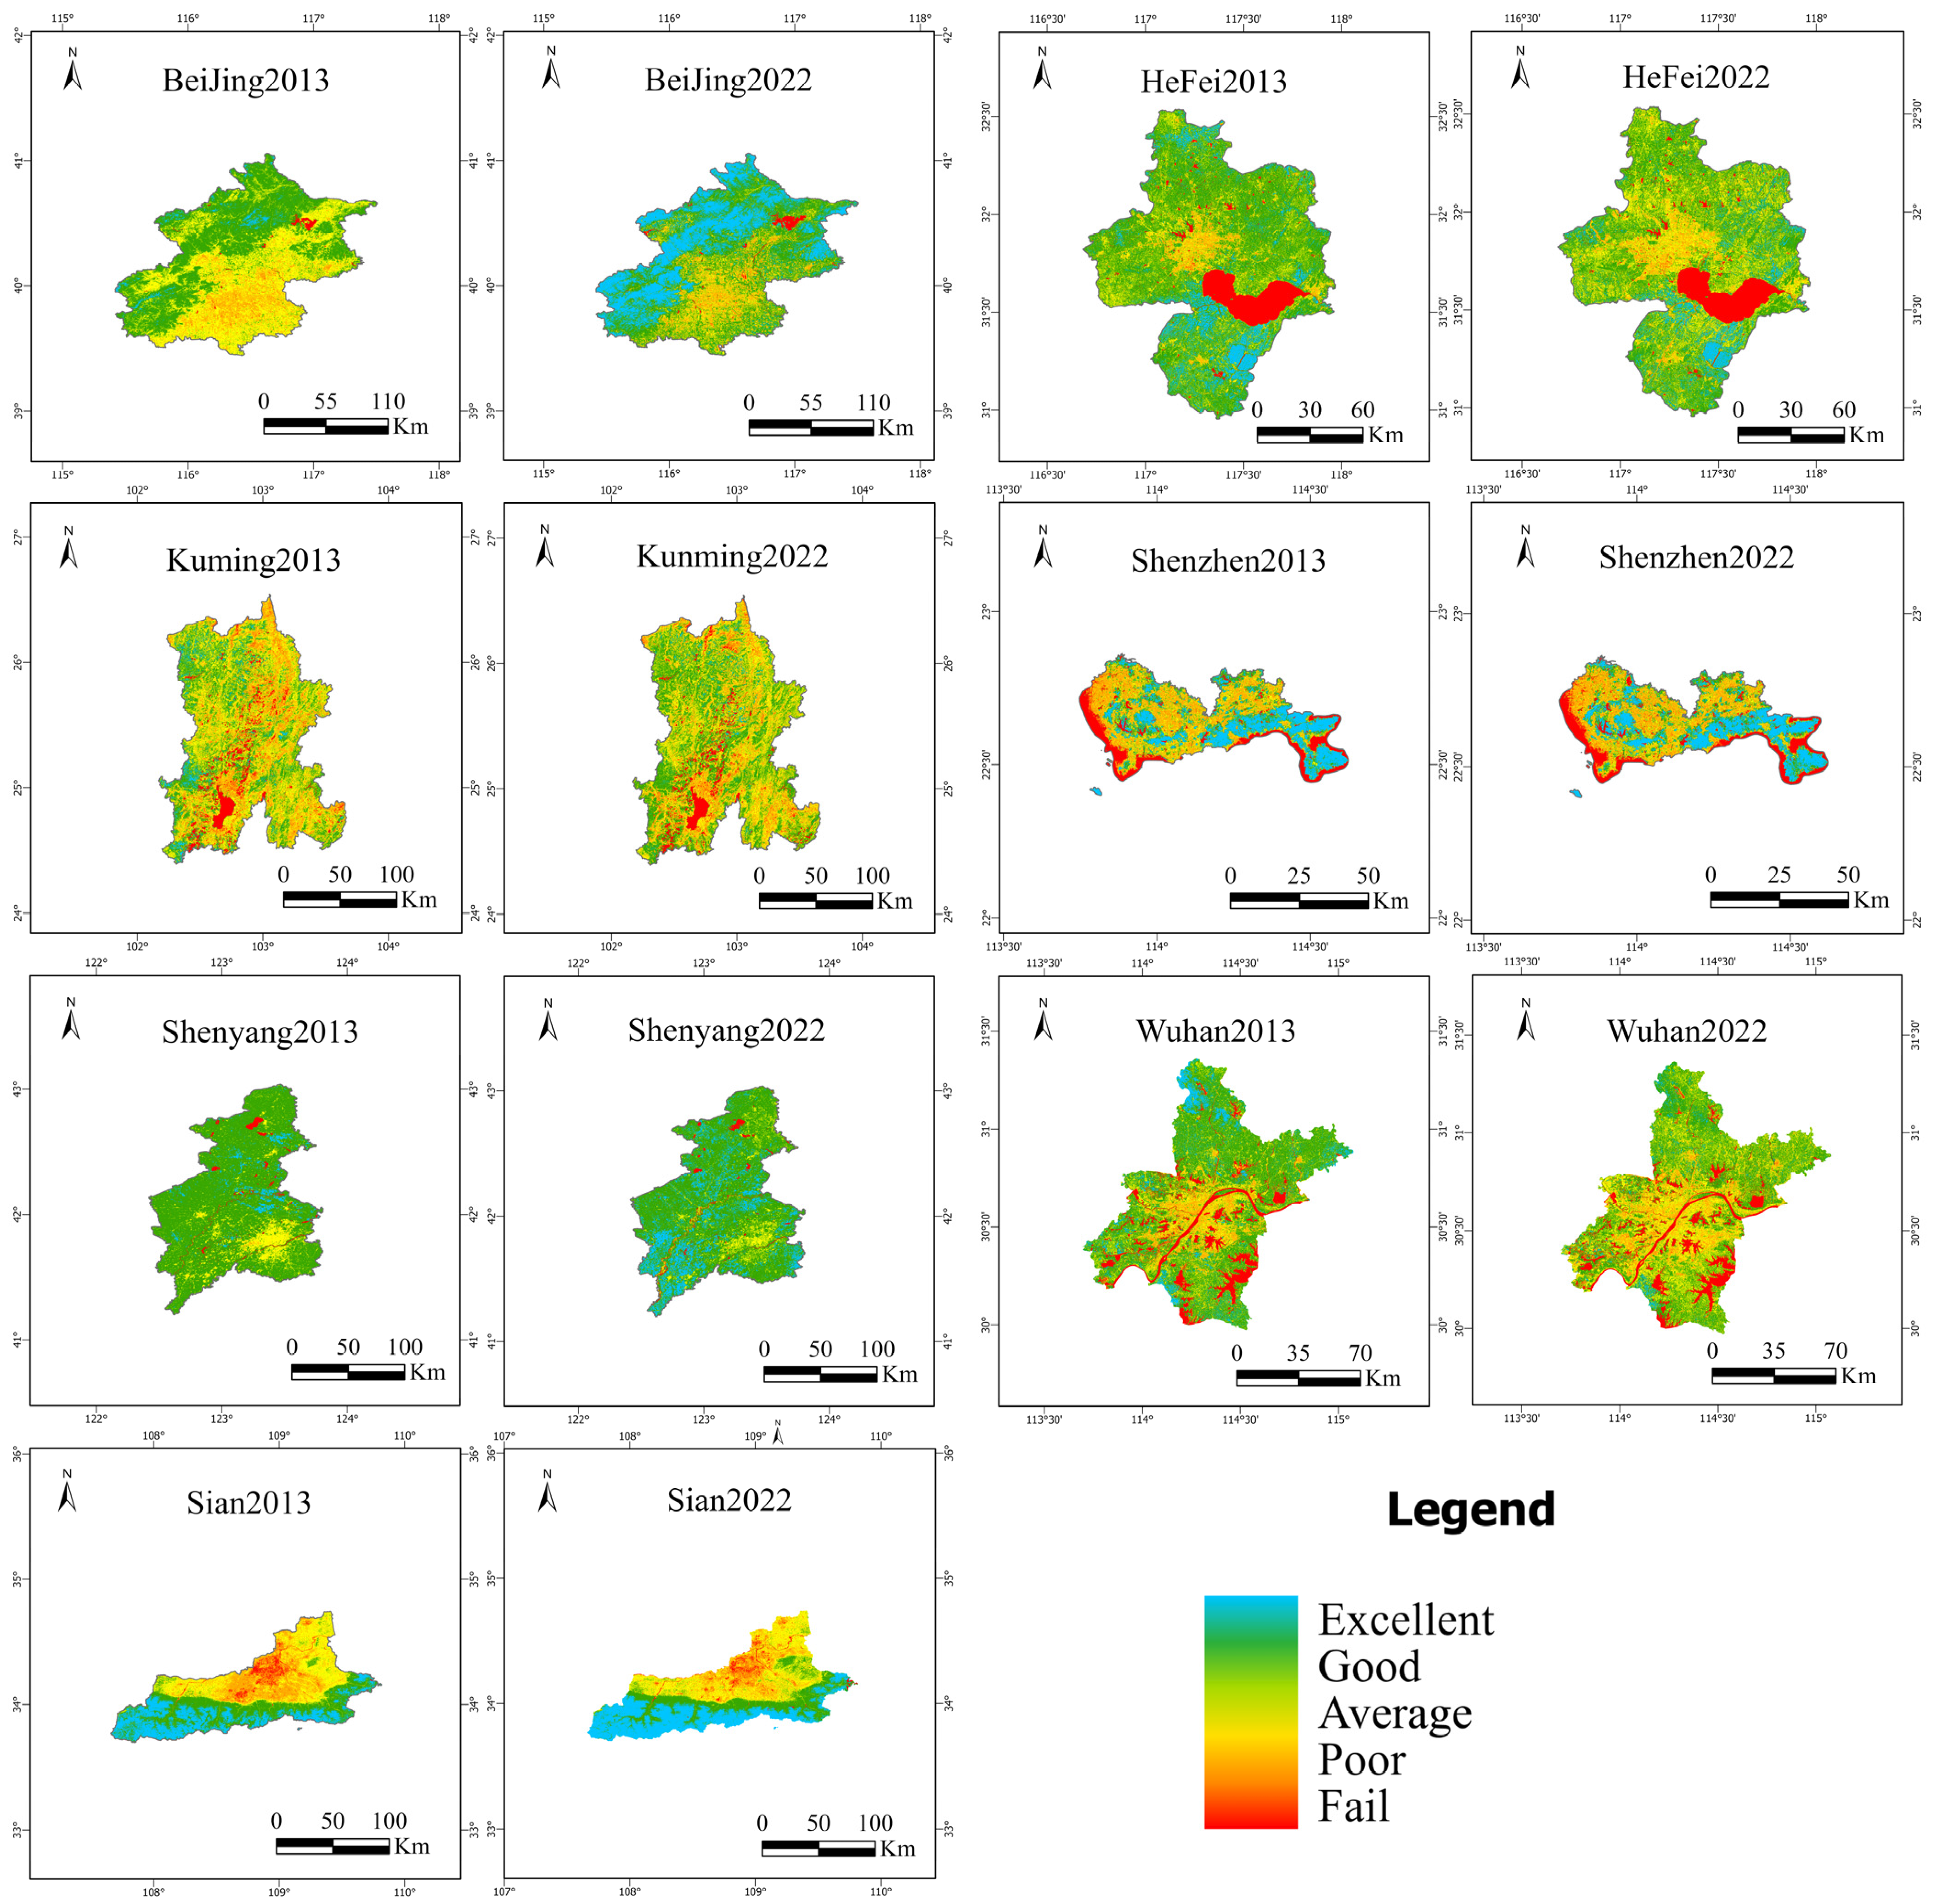
Focusing on China, this article selects Shenyang, Beijing, Wuhan, Xi’an, Hefei, Kunming, and Shenzhen to represent seven major regions. The study explores the interplay between urban development and its environmental impacts, thereby enriching existing research on economic development and environmental protection. The key findings are as follows: (1) From 2013 to 2021, nighttime light intensity, a marker of urban development, increased across all regions, most notably in the central region, followed by the east and south. (2) Urban development is not invariably detrimental to the ecological environment. In the period from 2013 to 2022, the ecological quality improved in Beijing, Xi’an, and Shenyang, while it declined in Wuhan and Hefei and stayed constant in Kunming and Shenzhen.
5.1. The Regional Differences and Southward Shift of Nighttime Lights
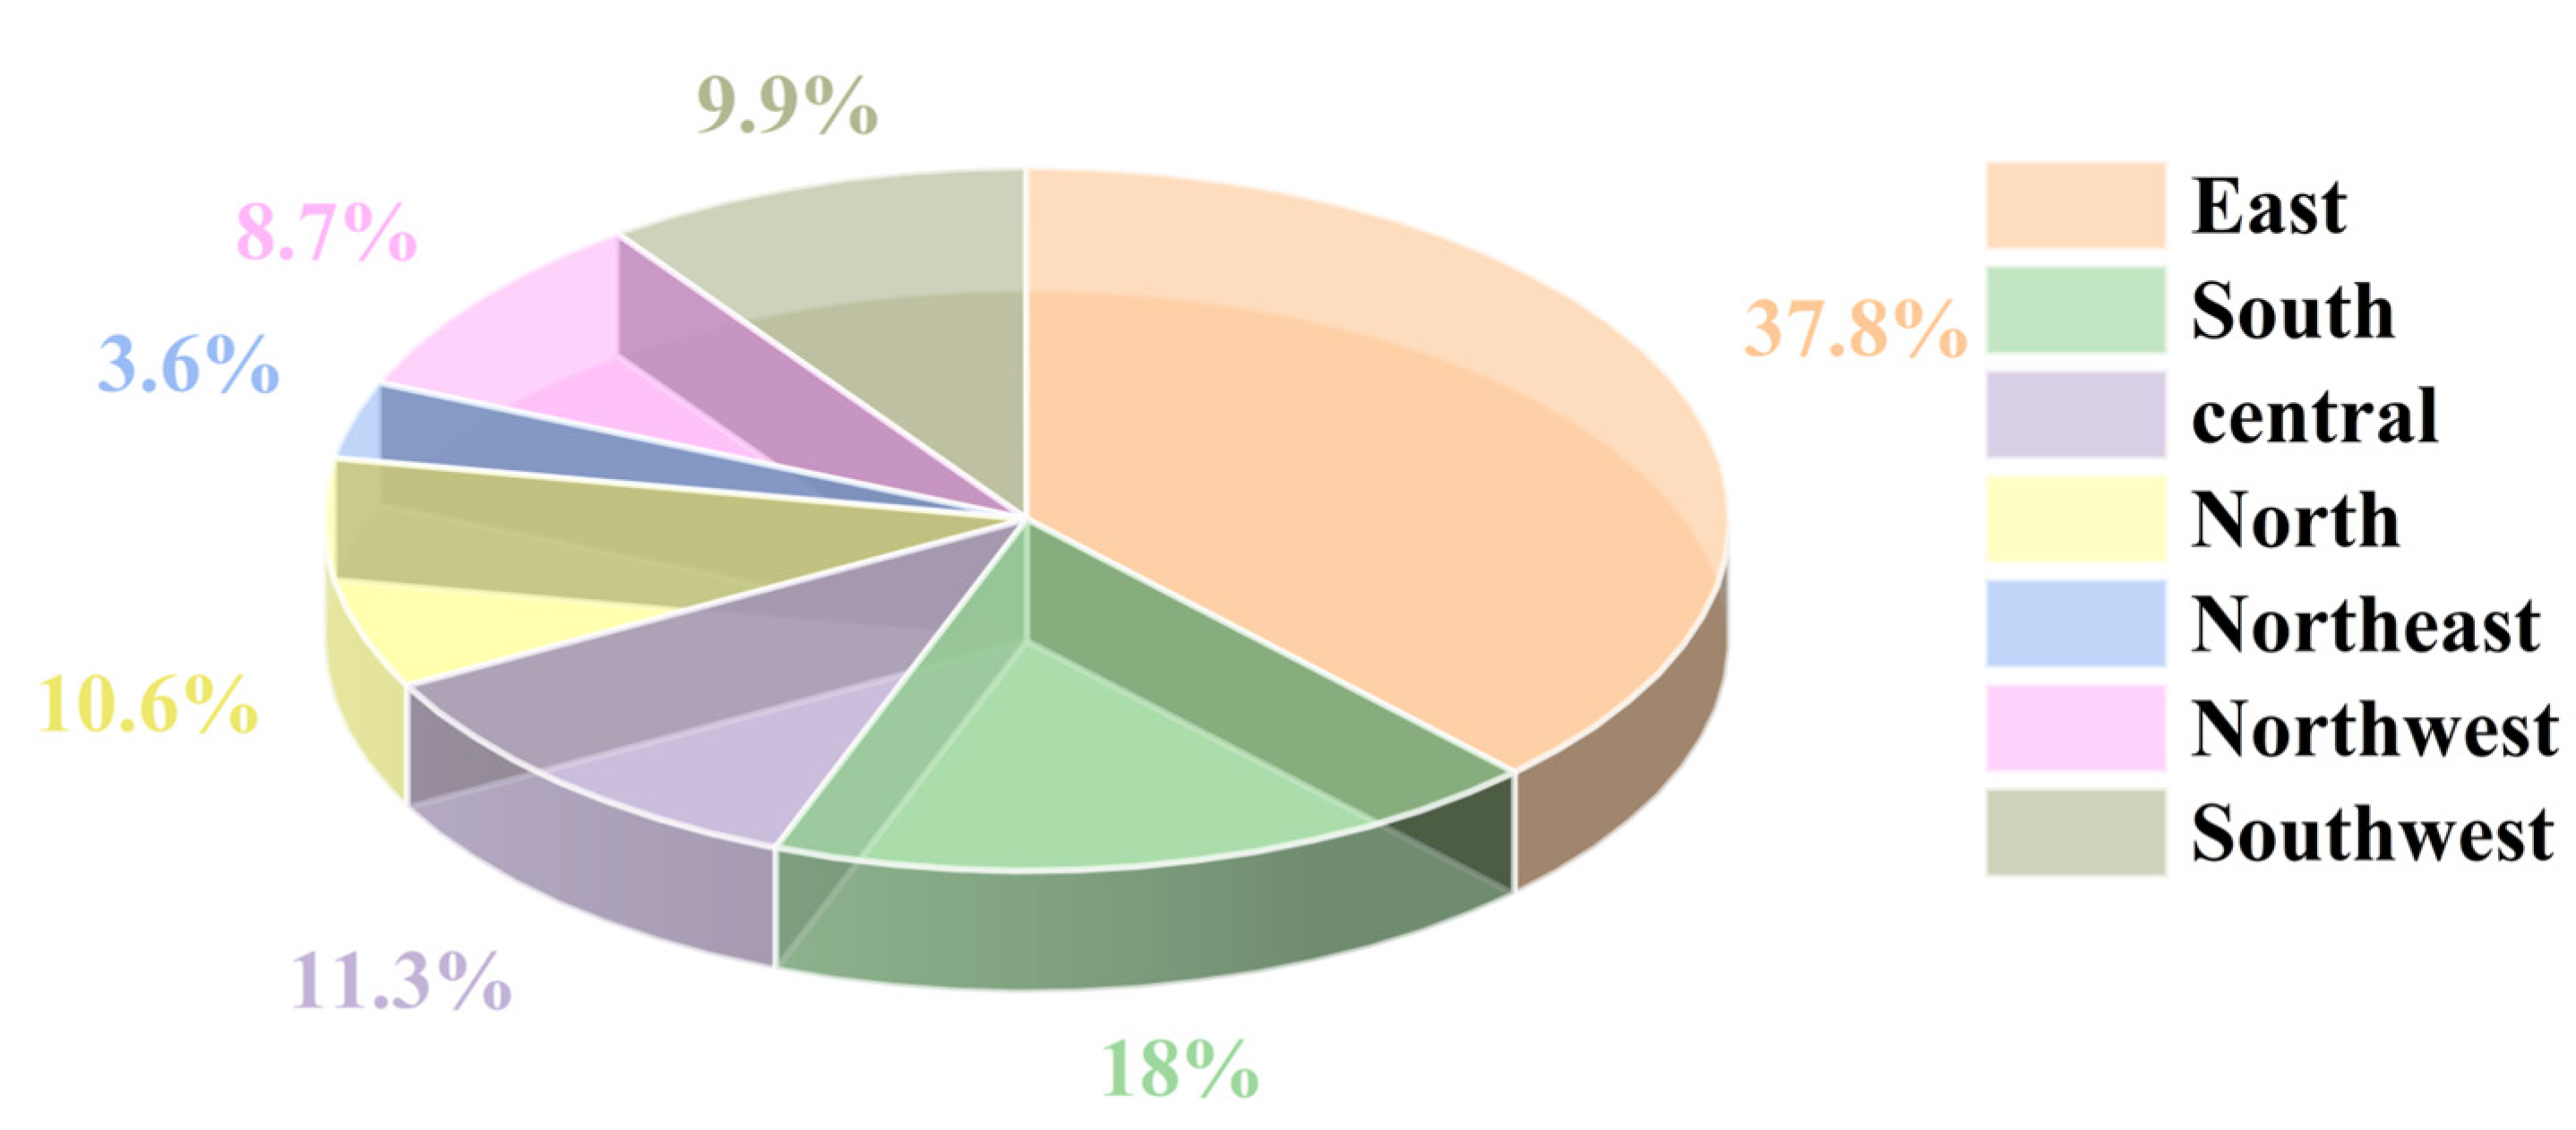
The distribution and growth of nighttime light in China display clear regional differences. In the eastern region, correlating with its economic development, there is dense nighttime lighting, whereas the western region exhibits comparatively less lighting. From 2013 to 2021, the increase in nighttime lights was mainly from the eastern, southern, and central regions, with the eastern region accounting for 37.80% of the growth. The geographic center of nighttime lights moved approximately 62 km southwest in this timeframe. An analysis of the elliptical area changes across various regions indicated expansion in the east, south, northwest, northeast, and southwest, and contraction in the central and northern regions.
The observed elliptical changes in urban areas, including variations in area and shifts in the centroid position, signify key trends in urban development and expansion. The alteration in the ellipse’s size, in particular, can be interpreted as an indicator of urban sprawl or concentration, a phenomenon of significant importance to urban planning, environmental sustainability, and socio–economic dynamics.
The expansion of the ellipse indicates a widening urban footprint, suggesting a trend towards urban sprawl. This outward growth may be driven by factors such as population increase, economic development, and the pursuit of lower land costs outside urban cores. While it may foster economic opportunities and residential space, sprawl could put strain on the infrastructure, increase transportation emissions, and encroach on natural habitats. Moreover, the dispersion of urban areas might exacerbate socio–economic disparities by creating a more pronounced division between urban and suburban areas. Conversely, a contraction of the ellipse implies a more concentrated urban form, potentially indicating efforts towards densification and sustainable urban development. This trend could be driven by policies aimed at curbing sprawl, such as land-use regulations, investment in public transportation, and the development of mixed-use communities. Urban concentration can enhance resource use efficiency, reduce per capita environmental impacts, and foster vibrant, walkable communities. However, without careful management, it may also lead to challenges like housing affordability issues and congestion.
The movement of the centroid reflects the directional bias of urban expansion, providing insight into regional development priorities and the geographical redistribution of economic activities. This shift may be influenced by infrastructure projects, regional development policies, or environmental constraints, highlighting the dynamic interaction between human endeavors and the natural landscape.
Understanding these trends and the driving forces behind them is crucial for formulating wise urban policies that balance growth with sustainability. This requires a multidisciplinary approach, integrating insights from geography, urban planning, economics, and environmental science, to ensure that urban expansion aligns with broader goals of social well-being and ecological resilience.
The findings are similar to the results of the existing literature [
38,
39,
40]. Combining previous research, it can be understood that the regional differences in nighttime light may be the result of the interplay of multiple complex factors [
41]. Understanding the developmental disparities between different regions can facilitate more balanced growth. To achieve coordinated development between eastern and western regions, it may be necessary for governments to increase investments in the west to reduce regional development gaps, formulate more precise policies and strategies, and promote balanced and sustainable economic growth.
This revelation underscores the importance of comprehending developmental disparities among regions in facilitating more balanced development. To achieve coordinated development between the eastern and western regions, guiding the government to augment investments in the western areas is crucial to mitigate regional development gaps, culminate more precise policies and strategies, and foster more balanced and sustainable economic growth. Furthermore, the study’s conclusions offer insightful guidance on the direction of economic growth, assisting businesses and investors in pinpointing regions with greater potential for investment and expansion.
5.2. The Non-Synergistic Impact of China’s Urbanization on Regional Ecological Environments
From 2013 to 2022, there was considerable variation in the impact of urban development on ecological environments in China. During this period, metropolises such as Beijing, Xi’an, and Shenyang witnessed enhancements in ecological environmental quality, while Wuhan and Hefei endured declines. In contrast, the ecological environments of Kunming and Shenzhen demonstrated minimal alterations.
Specifically, Wuhan’s RSEI witnessed a decrease of 9.18%, while Hefei’s experienced a reduction of 5.86%. Shenzhen’s RSEI change was minimal, registering a slight increase of 0.34%. In contrast, Shenyang’s and Kunming’s RSEI increased by 3.59% and 3.98%, respectively, whereas Xi’an and Beijing recorded increases of 6.52% and 19.55%. According to the literature [
42,
43,
44,
45,
46,
47,
48], some studies have noted a decline in RSEI correlating with urban development, while others reported an increasing trend. Additionally, several studies identified fluctuating RSEI patterns in line with urban growth [
49,
50,
51]. This suggests a complex interplay between urban development and ecological environments, characterized by an asynchronous relationship.
This variability could be attributed to diverse influences of urban development strategies, adjustments in industrial structures, and variations in environmental protection policies. Some cities may place greater emphasis on environmental protection and sustainable development, adopting effective policies to enhance ecological conditions. Conversely, other cities facing pressures of rapid development and economic expansion may neglect the ecological environment, resulting in its deterioration.
These research findings underscore that the relationship between urban development and the ecological environment is not simply linear but rather a complex interplay. It highlights the necessity of balancing economic growth with environmental protection amidst urban development. This necessitates prioritizing ecological conservation and sustainable development, coupled with the implementation of effective measures to harmonize the relationship between economic growth and environmental conservation. For rapidly developing cities like Hefei and Shenzhen, it is advisable to incorporate more green infrastructure into urban planning and development, which will improve the ecological quality and the quality of life. In cities with a heavy industrial background, such as Shenyang, formulating and implementing stricter environmental emission standards to promote the optimization and upgrading of industrial structures can reduce the environmental impact of industrial activities. Each city should establish an evaluation system for balancing urban development with environmental protection, taking into consideration the rate of economic development and urban expansion and the quality of the ecological environment.
6. Conclusions
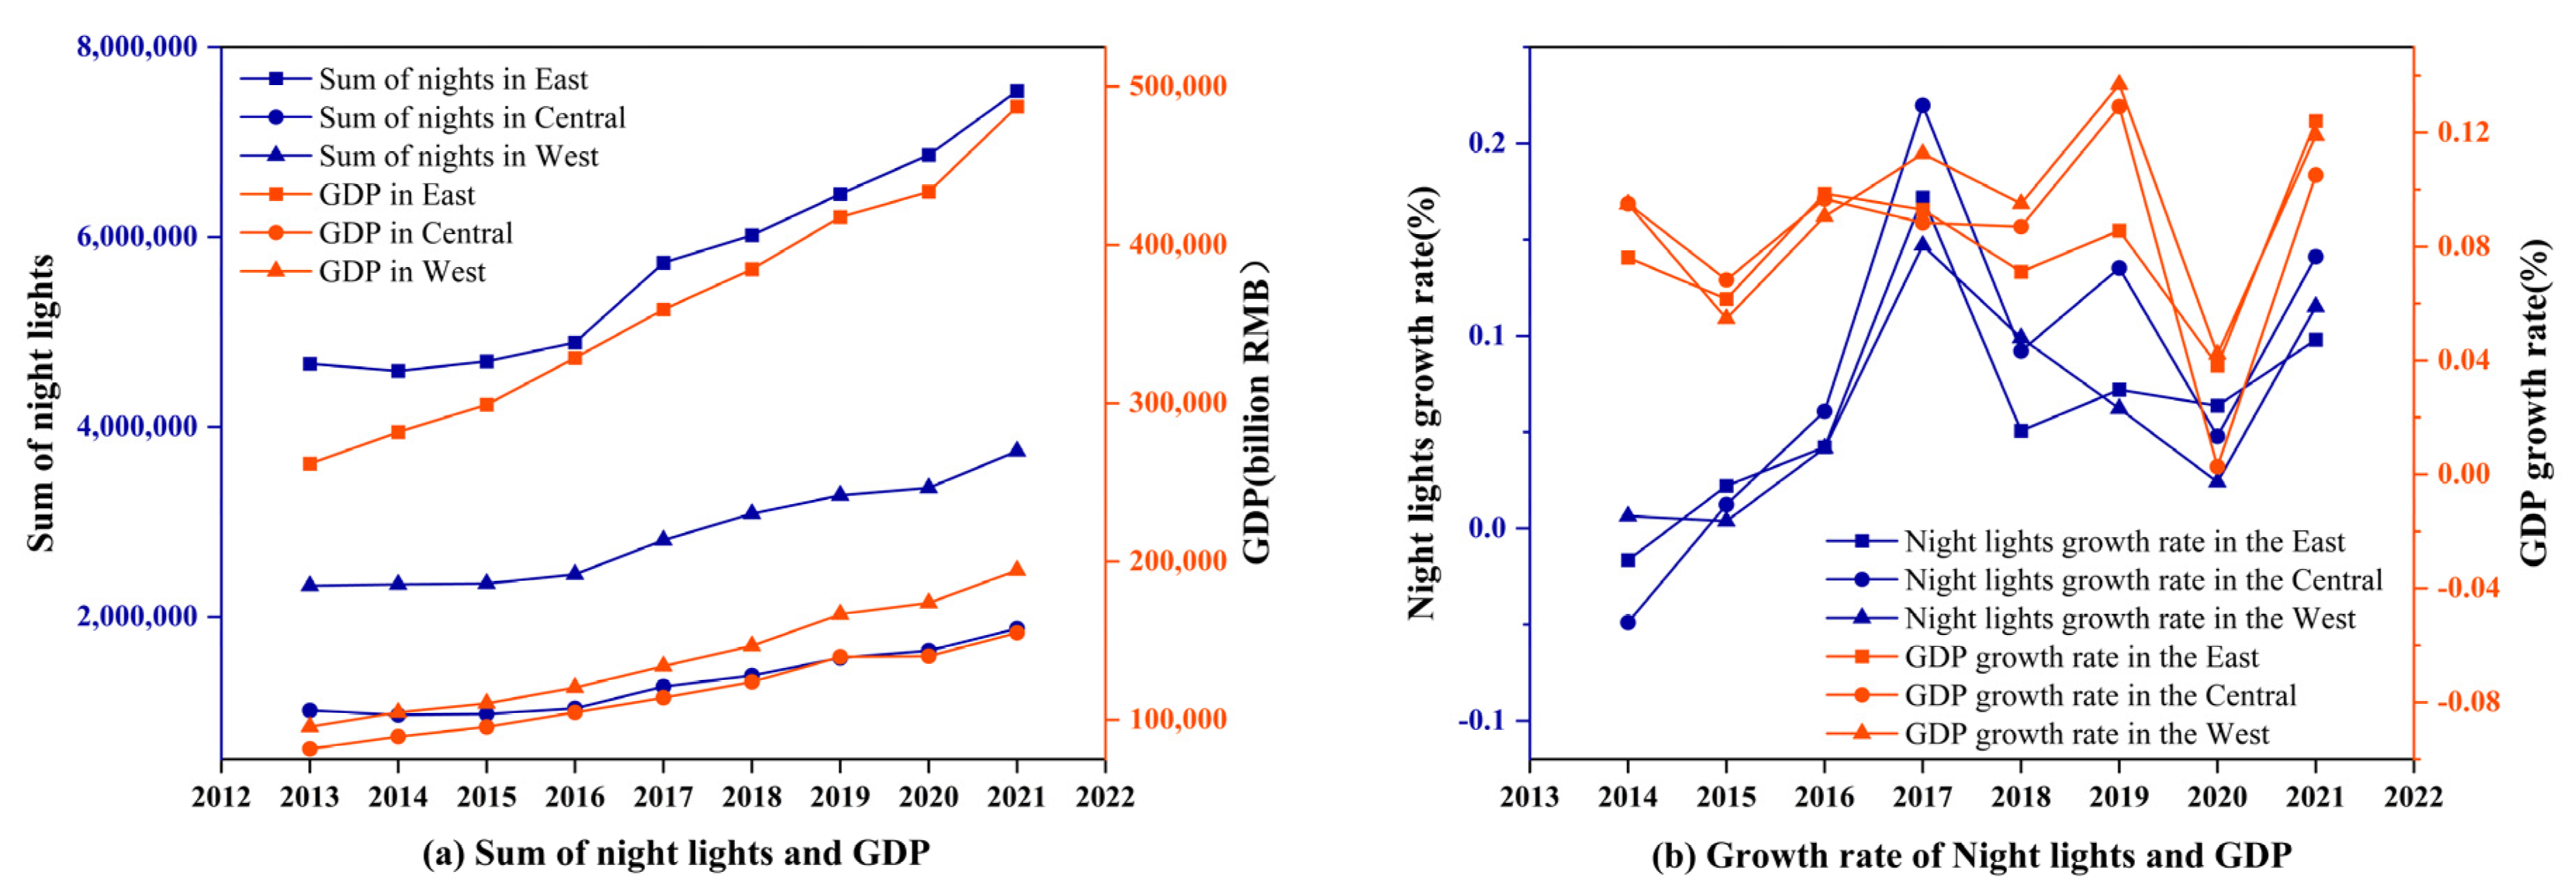
This article utilizes Landsat 8 satellite remote sensing data and NPP/VIIRS nighttime light remote sensing imagery, combined with the standard deviation ellipse method and the remote sensing ecological index model, to examine the spatiotemporal dynamics of urban development in China and its impact on the ecological environment. In summary, the eastern region exhibited dense nighttime lights, reflecting its economic development, whereas the western region showed fewer lights. Secondly, a general increase in total nighttime brightness was observed across all seven regions, with an average growth rate of 60.89%. The growth in nighttime lights primarily originated from the eastern, southern, and central regions, with the east contributing the largest portion at 37.80%. From 2013 to 2021, the centroid of nighttime lights in China shifted approximately 62 km southwest. Elliptical areas in the east, south, northwest, northeast, and southwest regions expanded, while those in the central and northern regions contracted. The nighttime light growth rate in the central region surpassed that of the east, with the west nearly equaling the east. In terms of GDP growth rate, the eastern region was outpaced by the central and western regions. Lastly, the impact of urban development on the ecological environmental quality varied across regions, indicating improvement in Beijing, Shenyang, and Xi’an; stable conditions in Kunming and Shenzhen; and reductions in Hefei and Wuhan, suggesting a complex interaction between urban development and ecological changes.
This study acknowledges the existence of certain limitations, which are mainly manifested in three aspects. Firstly, the research has, so far, only compared nighttime light data with GDP, without comparing it with population numbers or levels of development. Secondly, the RSEI used to assess the quality of the ecological environment does not fully cover all dimensions of an area’s ecological environment, lacking the capability to assess elements such as water quality and biodiversity. Lastly, the nighttime light remote sensing data and Landsat data used cover a relatively short period, which hinders the analysis of long-term evolution. Future research will require more robust data sources, including satellite or drone data with higher resolutions and more timeliness, and the development of more comprehensive models to produce more objective and reliable analysis results.


