Abstract
In the context of climate change, vineyard monitoring to better understand spatiotemporal patterns of grapevine development is of utter importance for precision viticulture. We present a time series analysis of hyperspectral in situ and multispectral UAV data for different irrigation systems in Lower Franconia and correlate results with sensor data for soil moisture, temperature, and precipitation. Analysis of Variance (ANOVA) and a Tukey’s HSD test were performed to see whether Vegetation Indices (VIs) are significantly different with respect to irrigation systems as well as topographic position in the vineyard. Correlation between in situ measurements and UAV data for selected VIs is also investigated for upscaling analysis. We find significant differences with respect to irrigation, as well as for topographic position for most of the VIs investigated, highlighting the importance of adapted water management. Correlation between in situ and UAV data is significant only for some indices (NDVI and CIRedEdge, of 0.33 and 0.49, respectively), while shallow soil moisture patterns correlate well with in situ-derived VIs such as the CIRedEdge and RG index ( of 0.34 and 0.46).
Keywords:
irrigation systems; vegetation indices; UAVs; multispectral; hyperspectral; time series; viticulture 1. Introduction
The cultivation of grapes is an important economic sector in global agriculture, as well as a cultural legacy in many regions [1]. The German wine-growing region of Franconia is known for the production of quality wine. The region in northern Bavaria has more than 6000 hectares of vineyards and a production of around 450,000 hectolitres of wine. In the context of climate change, strategies to adapt to changing precipitation and temperature patterns and to mitigate risks from drought and grape diseases is of utter importance for sustainable viticulture [2,3]. Water deficit produces diverse effects, such as reduced berry size or the failure of fruit maturation, depending on the plant’s growth stage [4]. Severe water stress triggers partial or complete stomatal closure, resulting in a reduction in photosynthetic activity [5]. Extended periods of excessive drought stress can lead to vine losses in both the present and upcoming year and lead to bud break in the following year. Thus, irrigation is an important measure for enhanced vine growth and productivity, even though a slight hydric deficit is essential for a high quality of vine [6], as too much water might have negative effects on factors such as excessive growth of the vines, low sugar content, high acidity, and reduced pigment synthesis. Thus, ideal soil moisture is key to sustainable viticulture and monitoring plant development; soil moisture and climate variables are crucial for precision viticulture [7,8].
In this study, our objectives are as follows: (1) We evaluate multitemporal data derived in situ hyperspectral plant measurements and UAV-based multispectral times series with respect to different irrigation systems and topography. (2) Several Vegetation Indices (VIs) are calculated, and a correlation between UAV data and in situ measurements are analyzed together with data from soil moisture sensors and a climate station. (3) Patterns of soil moisture at different depth levels are investigated and correlated with patterns of VIs over time. As drought events are becoming more frequent due to climate change, investigating spatial and temporal patterns of soil moisture and plant development with respect to different irrigation strategies can contribute to improving water management in vineyards. In the following, we first give a brief overview of remote sensing and sensor data for precision viticulture and then proceed to the methods used in this study.
1.1. State-of-the-Art Remote Sensing for Precision Viticulture
Due to the typical trellis pattern of grapevines, satellite remote sensing using decameter resolutions (such as Landsat or Sentinel-2 series) is not well-suited for plant monitoring, as pixel information at this resolution consists of the spectral signatures of vines, as well as of the space between plant rows that might be cover crops, other plants, or soil. There are several studies comparing satellite imagery and spatially high-resolution UAV or airborne data using different vegetation indices (e.g., [9,10]). Due to their flexibility and high spatial resolution, UAVs show a high potential for agricultural monitoring tasks. The use of UAVs is therefore a feasible tool for precision viticulture (PV) and has been studied in various agricultural applications such as olive groves [11,12,13], almond plantations [14,15,16,17], citrus fruits [14,18,19], and as vineyards [20,21,22]. In viticulture, multi- and hypterspectral data from UAVs (or other airborne data) are investigated for early detection of grape diseases, such as Flavescene dorée [23], Phylloxera [24], leafroll disease [25], Esca [26], and water stress [22,27,28,29], as it offers a low-cost and highly flexible tool for monitoring. The basis for many applications in agriculture and viticulture are Vegetation Indices (VIs) derived from multi- or hypserspectral systems and are investigated with respect to structural aspects of the grapevines, biochemical composition, physiological processes, and foliar symptoms [29,30,31]. In the present study, we investigate the time series of multispectral data derived from a UAV-based system with hyperspectral data from i -situ measurements and derived vegetation indices, as well as sensor data, and evaluate results with respect to different irrigation patterns. Such multisensor and multitemporal approaches contribute to a better understanding of the vineyard as a dynamic system and, thus, lead to better monitoring and management options.
1.2. Additional Sensor Systems for Precision Viticulture
With precision agriculture and, in particular, precision viticulture (PV) as evolving fields in science, the use of sensor systems and wireless technology is increasingly investigated for vineyards [32]. Sensor systems can be used for early detection of diseases and pests, for aquiring temperature and precipitation data (climate stations), and for monitoring soil moisture [33] and temperature. The latter can be performed using regular field measurement approaches such as Time-Domain Reflectometry (TDR) or Frequency-Domain Reflectometry (FDR), as in the present study with a Diviner 2000 system, or by using low-cost wireless IoT devices, as in the study by [32]. Constant monitoring contributes to a better understanding of plant development in changing conditions and the development of low-cost monitoring approaches. Thus, correlating multisensor data is crucially important for advancing methods in PV.
2. Materials and Methods
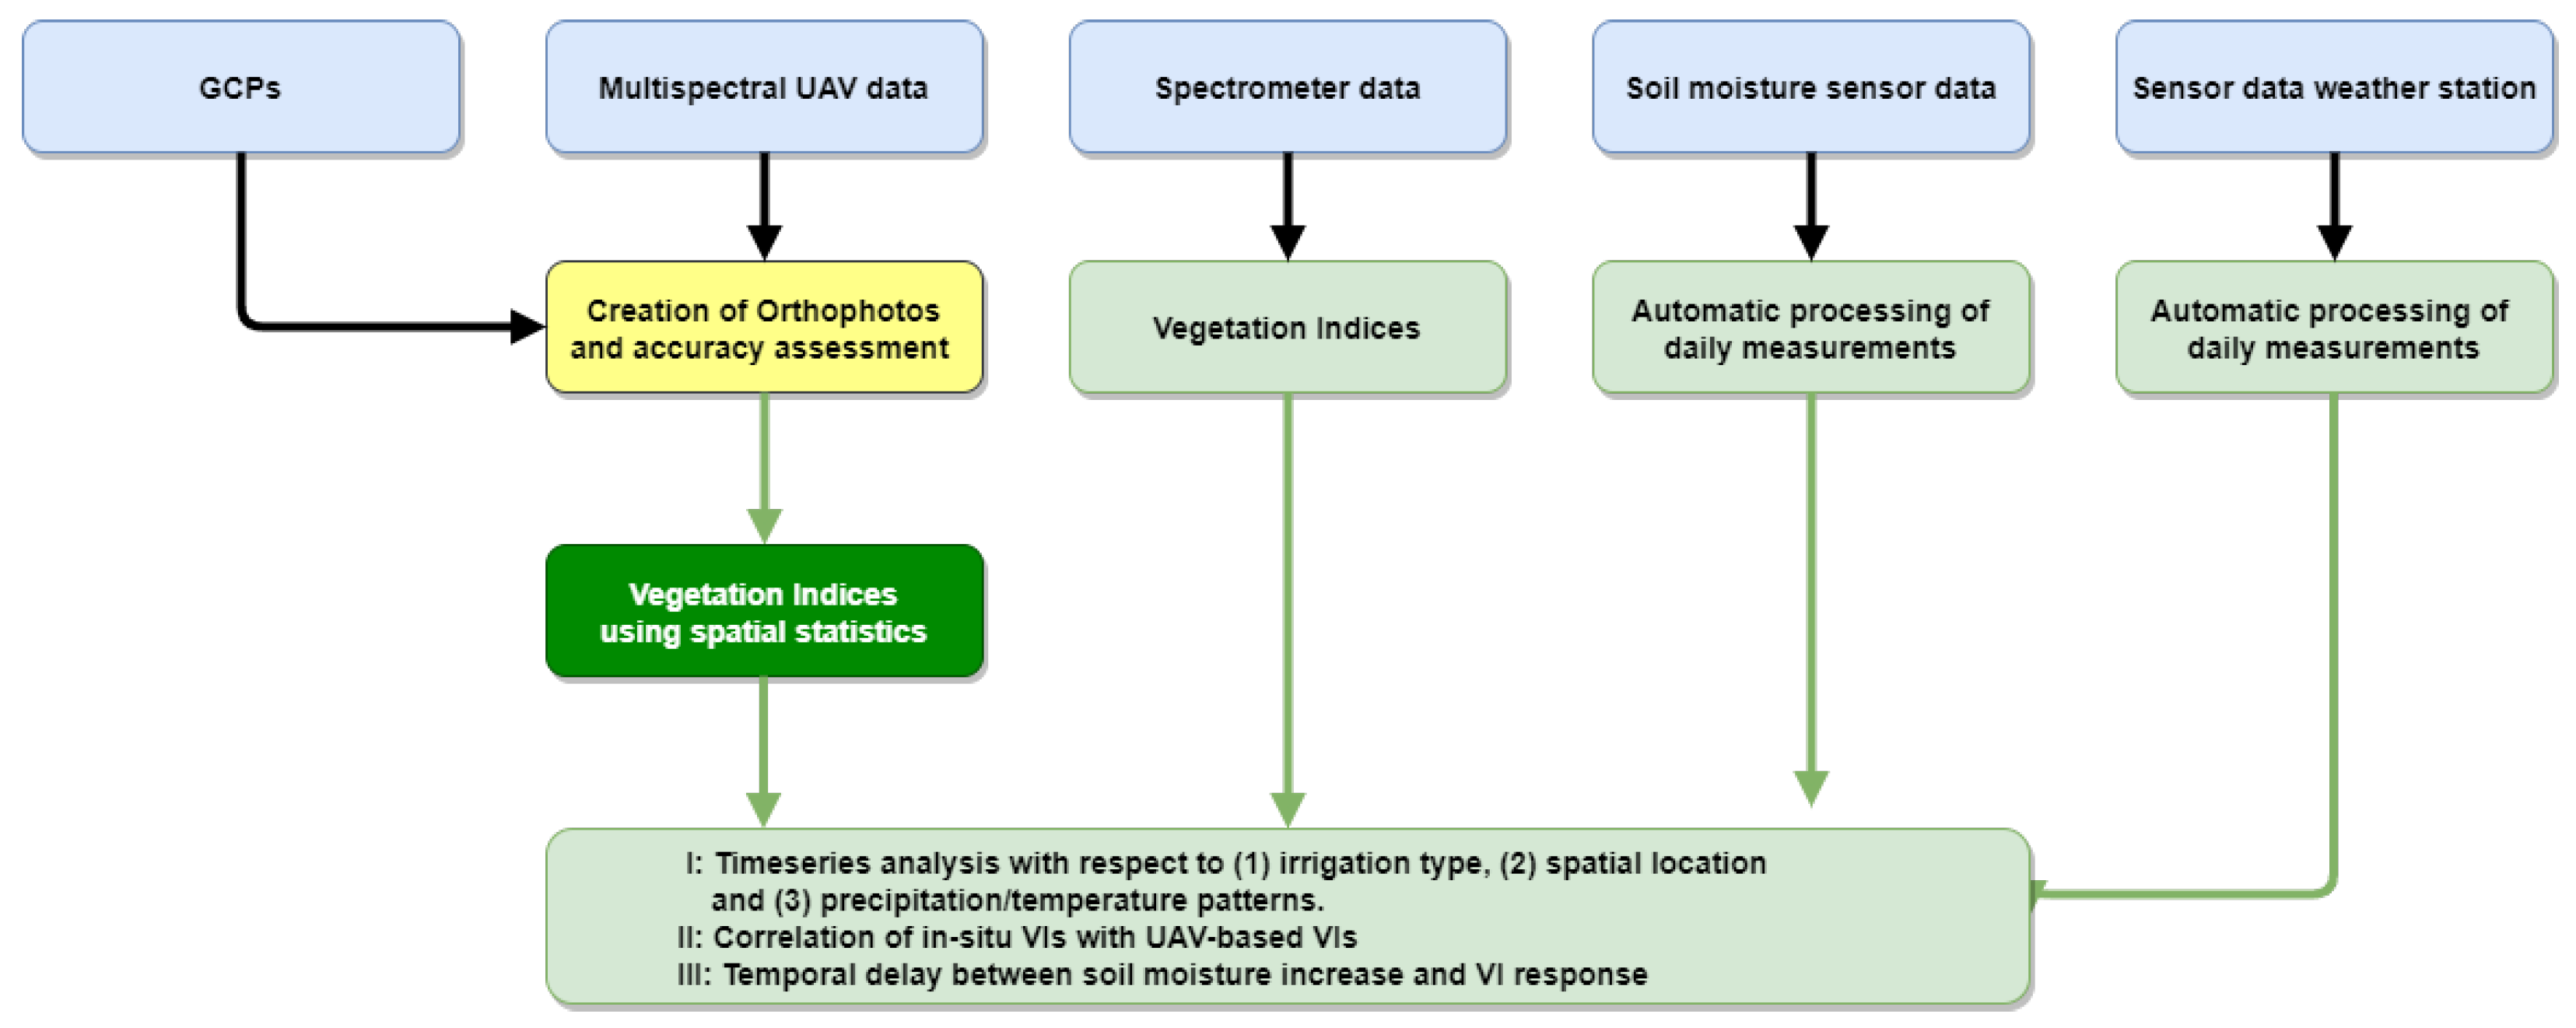
In this section, we first give details about the study area, the flight campaign, and fieldwork, and subsequently, the analytical workflow applied on the collected data. The flowchart in Figure 1 shows the overall workflow of this study.
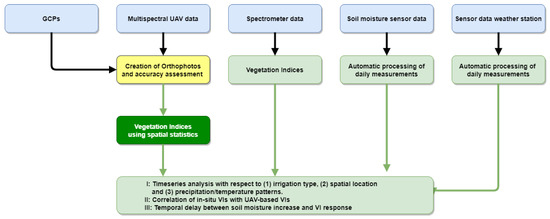
Figure 1.
Overall workflow of this study. For more information, refer to the text.
2.1. Study Area
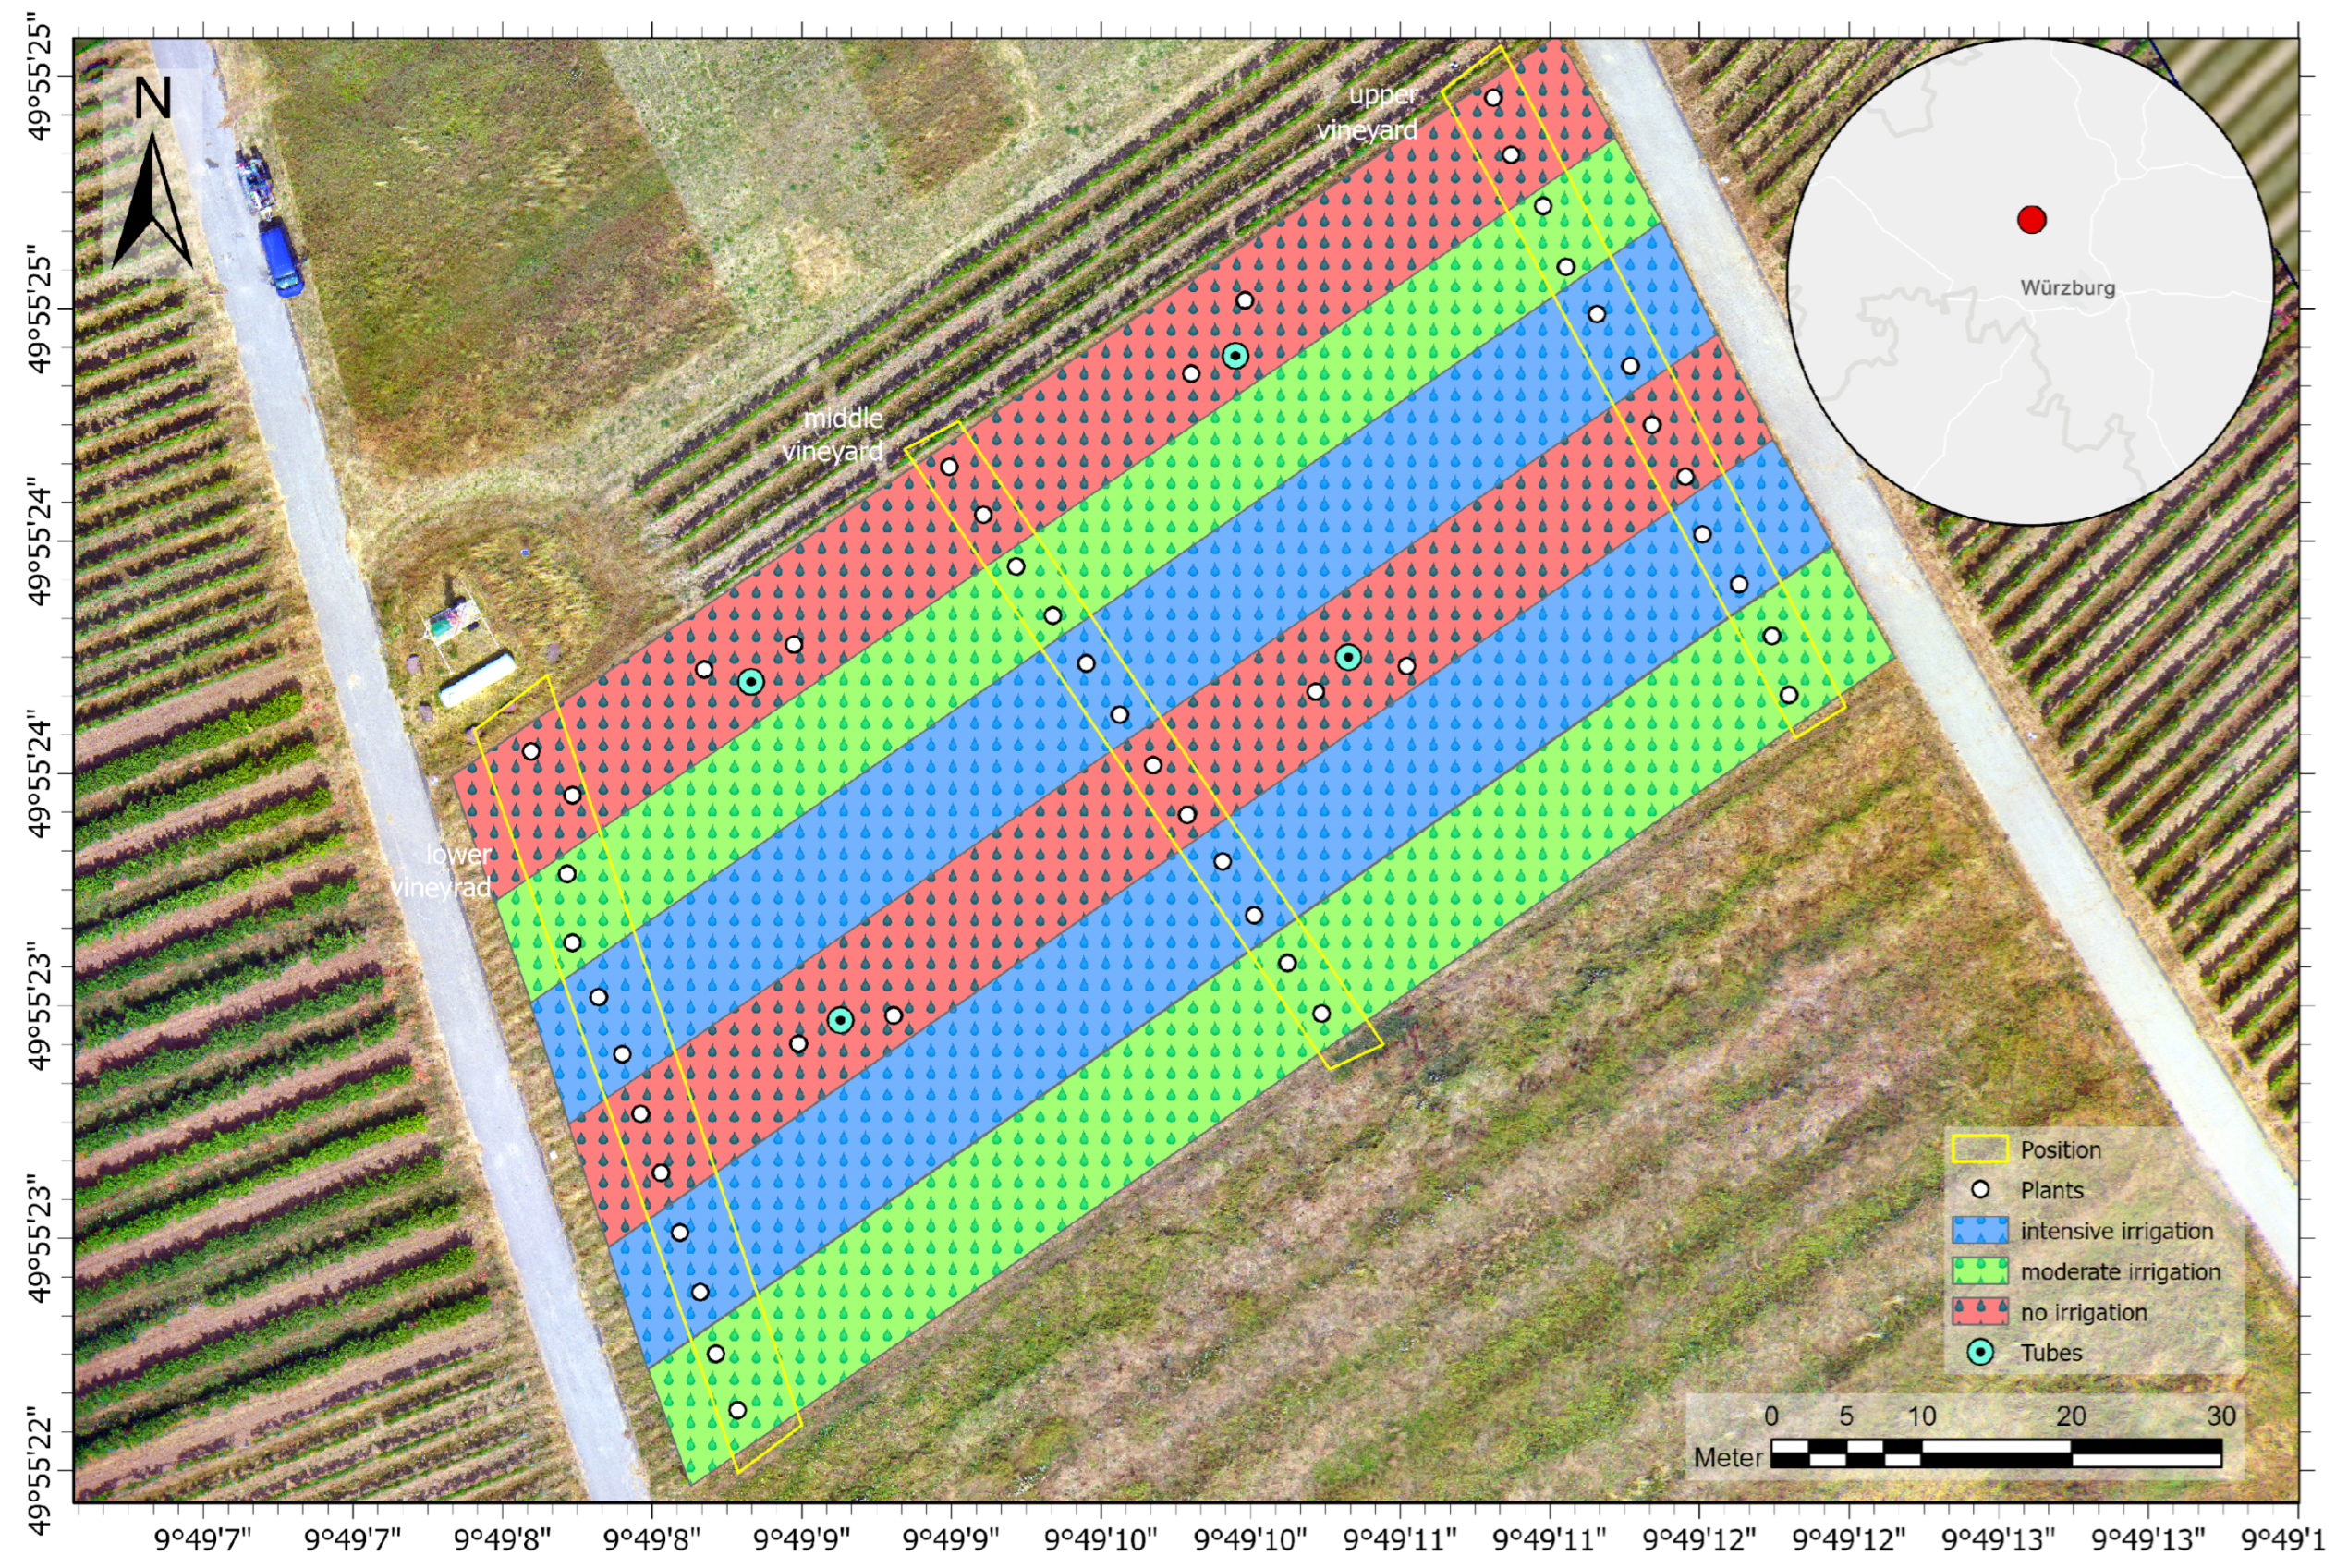
The study area is located near Himmelstadt (Franconia, Germany; see Figure 2) at ca. 200 m above sea level with a southwest orientation. It is an experimental vineyard managed by the Bavarian State Institute for Viticulture and Horticulture (LWG) and encompasses approximately 1000 m2. Franconia has a humid cool temperate transitional climate with average monthly temperatures varying depending on the area between about −1 and −2 °C in January and 17 and 19 °C in August. The climate is generally sunny and relatively warm and therefore well-suited for viticulture. The average annual rainfall in the study area is about 425 mm. The soil’s grain size is described as loamy sands, and the underlying geology is the Upper Muschelkalk formation. The cultivated grape variety is Müller-Thurgau, grafted on SO4 rootstock that was planted in 2015 at a row spacing of 2 m and a vine spacing of 1.3 m (equivalent to approximately 3850 vines per hectare). To investigate the impact of drought stress on grapevines, the vineyard is divided into experimental plots with different irrigation systems: (1) moderate irrigation, (2) intensive irrigation, and (3) no irrigation as control plots. Moderate irrigation was started as required three weeks after flowering at an predawn water potential of −0.25 megapascals. Within the intensive irrigation treatment, it was ensured that the vines did not fall below the −0.20 megapascals predawn water potential during the entire vegetation period. All water potential determinations were carried out using a Scholander chamber [34]. The vines were irrigated using drip irrigation with a flow rate of 1.6 liters per dripper and a weekly water application of 8 L per vine as required. Additionally, we distinguish between upper (ca. 211 m asl.), middle (ca 206 m asl.), and lower parts (ca. 199 m asl.) of the vineyard to take into account the relief and therefore waterflow of the area (compare Figure 2).
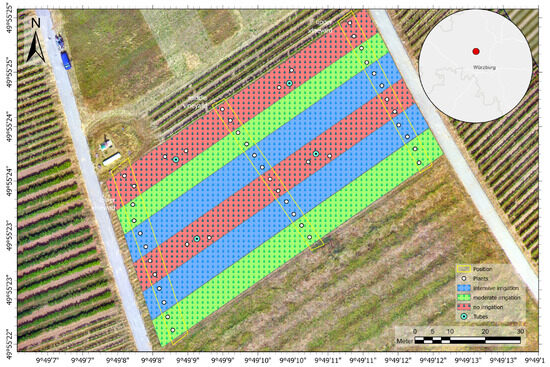
Figure 2.
Study area near Himmelstadt, Bavaria. Different irrigation systems are shown in red, green, and blue. Locations for hyperspectral measurements on plants are shown depending on their location in the vineyard (yellow outline). Locations of tubes for soil moisture readings are shown in blue. RGB of the flight on 13 July as basemap. The climate station is visible north of the vineyard.
2.2. UAV Flight Campaign and In Situ Measurements
The flight campaign was conducted during the vegetation period of 2023 using a DJI M300 RTK (DJI, Shenzhen, China) equipped with an Agrowing Alpha 7Riv multispectral system (Agrowing Ltd., Rishon LeZion, Israel) with 10 bands in the visible and near-infrared part of the electromagnetic spectrum. The wavelengths are centered at 405 nm, 430 nm, 450 nm, 550 nm, 560 nm, 570 nm, 650 nm, 685 nm, 710 nm, and 850 nm with a spectral bandwidth of 30 nm. The average ground sampling distance at a flight altitude of 100 m is 1.5 cm. All flights were conducted at an elevation of 50 m with longitudinal and transverse overlaps of 90% and 80%. The resulting spatial resolution was 2.38 cm, and the total area covered 19,183 m2. As GCPs, 12 checkerboard targets were placed in the vineyard. Calibration panels were used after takeoff for spectral calibration of the sensor system of the UAV. Our goal was to conduct one flight in fair weather conditions around noon each week to minimize the effect of shadows. Table 1 shows the date, weather conditions, and related in situ spectrometer measurement campaigns. Especially in July/August, weather conditions in the study area were quite rainy, and mixtures of sunshine and clouds dominated for weeks. The two flights in September were conducted after the grape harvest to examine plant reaction after harvest and without application of pesticides. In situ hyperspectral measurements were conducted using a Spectral Evolution PSR+ 3500 spectroradiometer (Spectral Evolution, Haverhill, MA, USA) equipped with a contact probe that was tailored to work as leafclip. The instrument measures the electromagenetic spectrum from 350 nm to 2500 nm at a spectral resolution of 1 nm. A spectralon white reference was used for calibration. We took measurements on 44 individual plants (Figure 2), representative for all irrigation types and the topographic location within the vineyard. Each measurement consisted of averaging five individual measurements (setup of the spectroradiometer), as well as averaging five separate measurements on a plant level.

Table 1.
Flight campaign, weather conditions, and field measurements. Note that due to weather conditions, plant development, and logistics, timing of measurements has some shift. Refer to text for more information.
In addition to spectral measurements, soil moisture and climate variables (mean daily temperature, precipitation) were collected from sensor data. Soil moisture measurements were collected by the Bavarian State Institute for Viticulture and Horticulture (LWG) using a Diviner 2000 portable soil moisture monitoring system (Sentek Technologies, Stepney, Australia) designed to assess volumetric soil moisture by Frequency Domain Reflectometry from eight PVC access tubes at different depth levels (max. −120 cm, depending on regolith depth). All tubes are located in the non-irrigated parts of the vineyard to assess drought stress. Measurements were collected 1–2 times per week.
Daily temperature and precipitation measurements were downloaded from the Bavarian AgrarMeteology website (www.wetter-by.de (accessed on 7 July 2023)) from the climate station located next to the vineyard (weather station WB-Himmelstadt).
2.3. Data Preprocessing and Calculation of Vegetation Indices
The multispectral UAV data were processed using the Agrowing Basic software (Agrowing Ltd., Rishon LeZion, Israel) for calibration and tile export for each spectral band. Pix4D Software (Pix4D S.A., Prilly, Switzerland) was then used to calculate orthophotos for all spectral bands by applying bundle block adjustment and alignment of the images. The accuracy of georeferencing of all bands was checked, comparing the coordinates of the GCP panels showing high spatial accuracies with only slight vertical and horizontal misplacement in the range of 0.3 cm to max. 2 cm.
Vegetation indices (see Table 2) were then calculated from (1) the UAV data (compare Figure 3) and (2) from the in situ measurements of all 44 plants using python scripts to automate the process. This was performed for all timestamps listed in Table 1.
Table 2.
List of VIs used in this study.
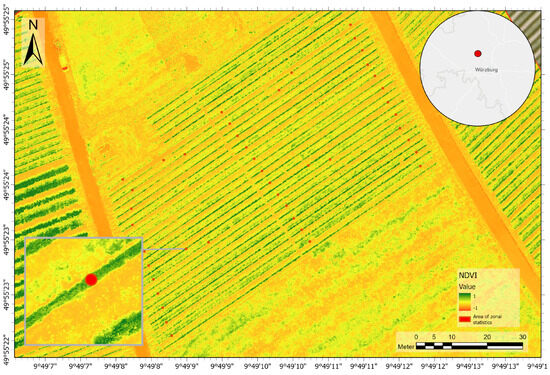
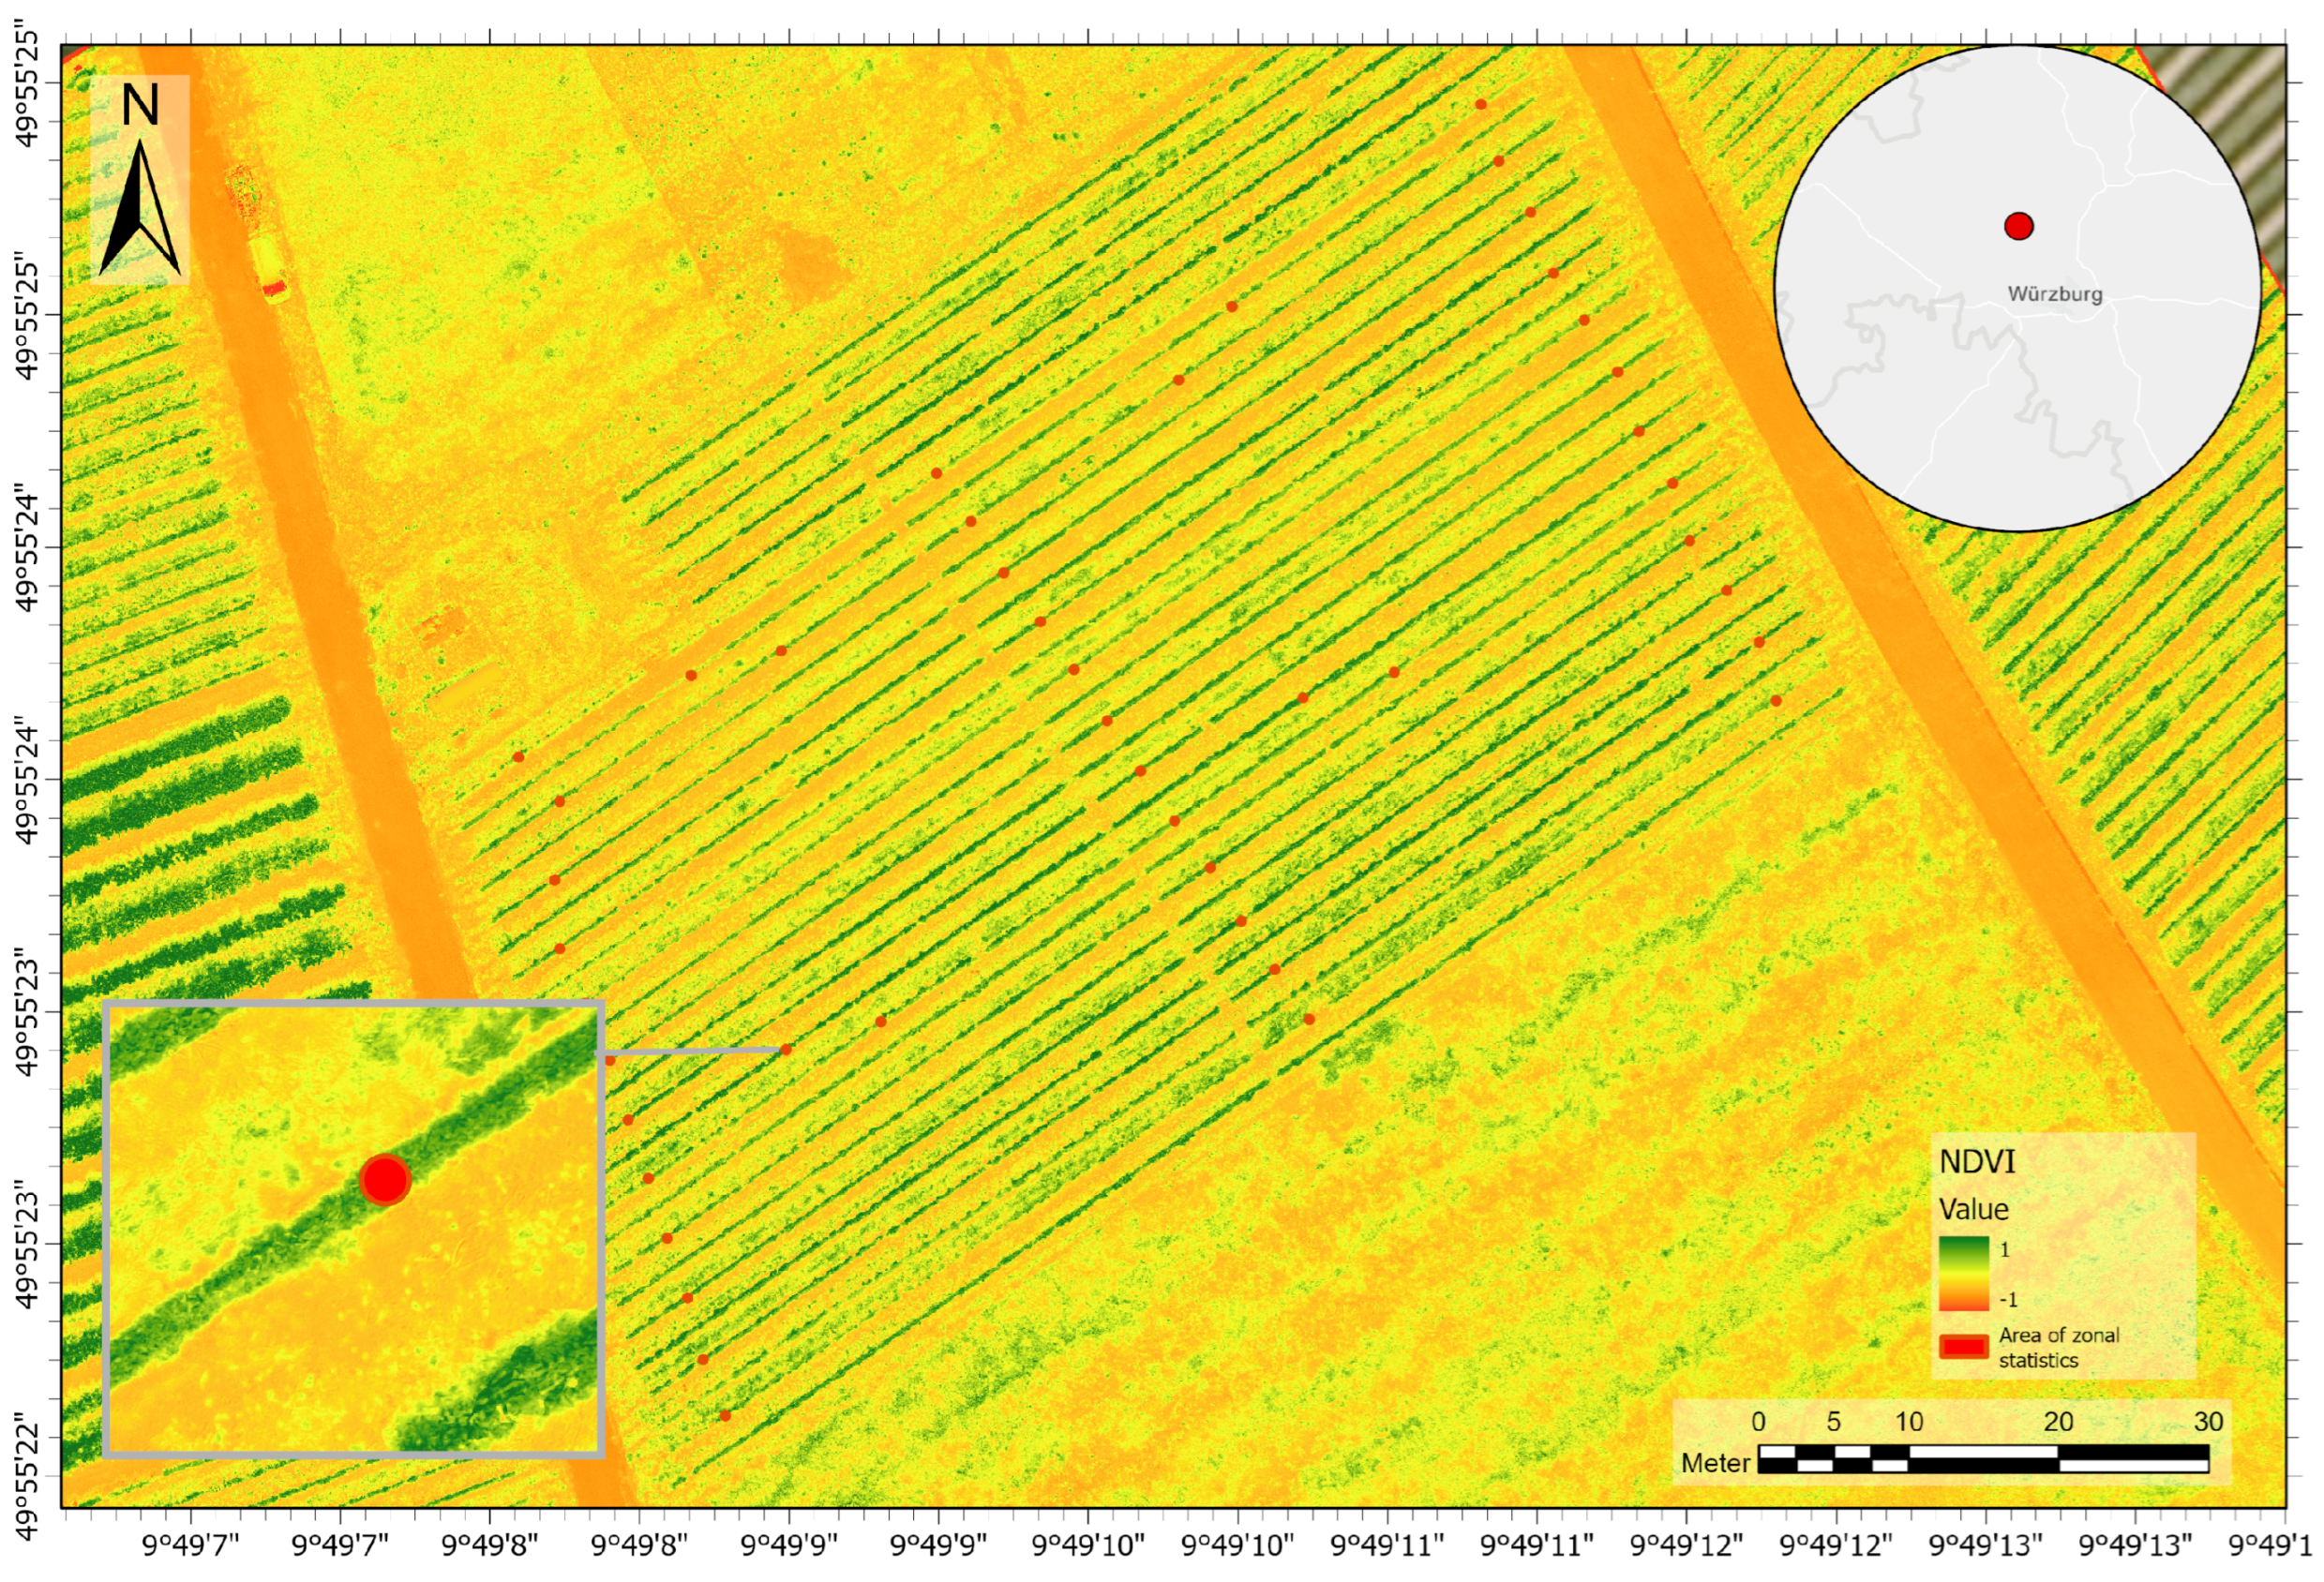
Figure 3.
Example of one NDVI calculation (17 July 2023) showing the plant locations and zonal statistics areas used for correlation with spectroradiometer measurements. As vines are aligned along wires, it is important to automatically derive the maximum VI value locations (for some indices minimum) and avoid sampling erroneous pixels (such as bare soil or stem areas), as can be seen in the zoomed-in location.
VIs from in situ data were calculated by using resampled bands for RGB, NIR, and RedEdge bands to match the Sentinel 2 bands for better comparison with other studies and to UAV spectral resolution for correlation analysis. For the CIRedEdge and the CIGreen index, however, the narrow spectral bands defined by the indices were used. For the UAV data, the following bands were used: G: 550, B: 450, R: 650, NIR: 850, Red edge: 710.
2.4. Time Series Analysis of In Situ-Derived VIs with Respect to Different Irrigation Patterns and Topography
To assess the differences in soil moisture and plant development during the course of the year, nonirrigated parcels were compared with the two different irrigation systems, and time series of the different vegetation indices calculated from in situ measurements were analyzed. For each irrigation type, we calculate the mean and standard deviation. Next, we calculate test statistics to see whether differences are significant using ANOVA analysis on all samples from the respective classes (nonirrigated, moderate, and intensive irrigation), followed by the Tukey’s HSD (Honestly Significant Difference) test. HSD is a post hoc test commonly used after performing ANOVA to determine which specific groups differ from each other significantly. The same was performed for different topographic classes (compare Figure 3). For interpretation, climate information was also added to the data in order to investigate differences and/or similarities between the parcels. A better understanding of the impact of topology and amount of irrigation is crucial for better planning to save resources in viticulture. We used python to automatically calculate and plot the indices for the different irrigation classes (nonirrigated, moderate irrigation, and strong irrigation) and topographical classes (upper, middle, and lower vineyard) to calculate statistical tests, as well as to add temperature and precipitation data for comparison and interpretation. The same workflow was also applied to UAV-derived indices for comparison. In the following section, we describe the analytical workflow for statistical comparison.
2.5. Correlation of UAV-Derived VIs and Hyperspectral In Situ Measurements
In situ spectral measurements provide highly accurate spectral information but are not a practical way for vineyard monitoring. Thus, deriving accurate information from UAV-based systems is very important for large-scale monitoring tasks. Due to variability in atmospheric conditions, as well as leaf orientation and movement, correlating UAV or even satellite-based measurements with in situ measurements is challenging. Sampling good pixels that represent well-oriented and illuminated leaves is required for comparison with in situ measurements. With respect to decameter satellite data, this is impossible, as pixels always represent mixtures. The spectral resolution of our satellite and UAV-based sensors is also different from the hyperspectral measurements. Thus, in order to compare UAV-derived with in situ spectral measurements, spectral resampling of hyperspectral data was conducted to match the spectral bands of the UAV data. Furthermore, as vines are aligned along wires, and most of the area consists of other spectral classes such as soil or grass, it is important to automatically derive the correct pixels of the vine leaves for VI calculation. This was performed by spatial statistics (searching the neighborhood of the central coordinate) in a GIS environment at the plant locations used for in situ data collection (compare Figure 3). We derived the location of the maximum (minimum for the RG index, CIRedEdge) VI values, indicating the leaf area of the plant. This was performed for all images automatically using python scripts, including the calculation of different VIs listed in Table 2 for further evaluation. In situ measurements were then correlated with UAV data in order to assess how well airborne data match highly accurate data from leaf-level measurements. Note that data collection was not always on exactly the same date and was sometimes delayed by a day or two.
2.6. Analysis of Soil Moisture Patterns during the Vegetation Period for Nonirrigated Plots and Changes in VIs
Soil moisture data from different depth levels was available from the sensor system as .csv files. We used python to automatically read the files for all measurement dates and visualized the development of soil moisture at different depth levels with respect to precipitation and vegetation indices from plants located at the measurement tube locations. Linear correlations were calculated for the GNDVI, RG index, and CIRededge index for shallow (30–40 cm) and deep levels (80–100 cm) to investigate whether there is a direct link between plant development as seen in VIs and soil moisture levels.
3. Results
3.1. Time Series Analysis of In Situ-Derived VIs for Different Irrigation Patterns and Topography
Results are summarized in Figure 4, Figure 5 and Figure 6. We first present results of in situ-derived time series for selected VIs with respect to irrigation, then with respect to topography, and finally, in a sense upscaling to UAV-derived results in Section 3.2. The time series of mean values and standard deviation for selected VIs derived from hyperspectral measurements for different irrigation patterns are shown in Figure 4.
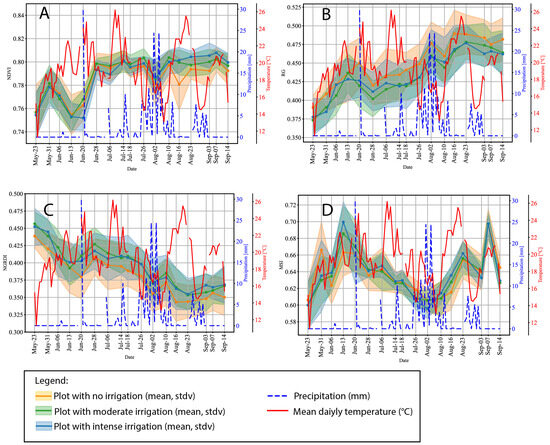
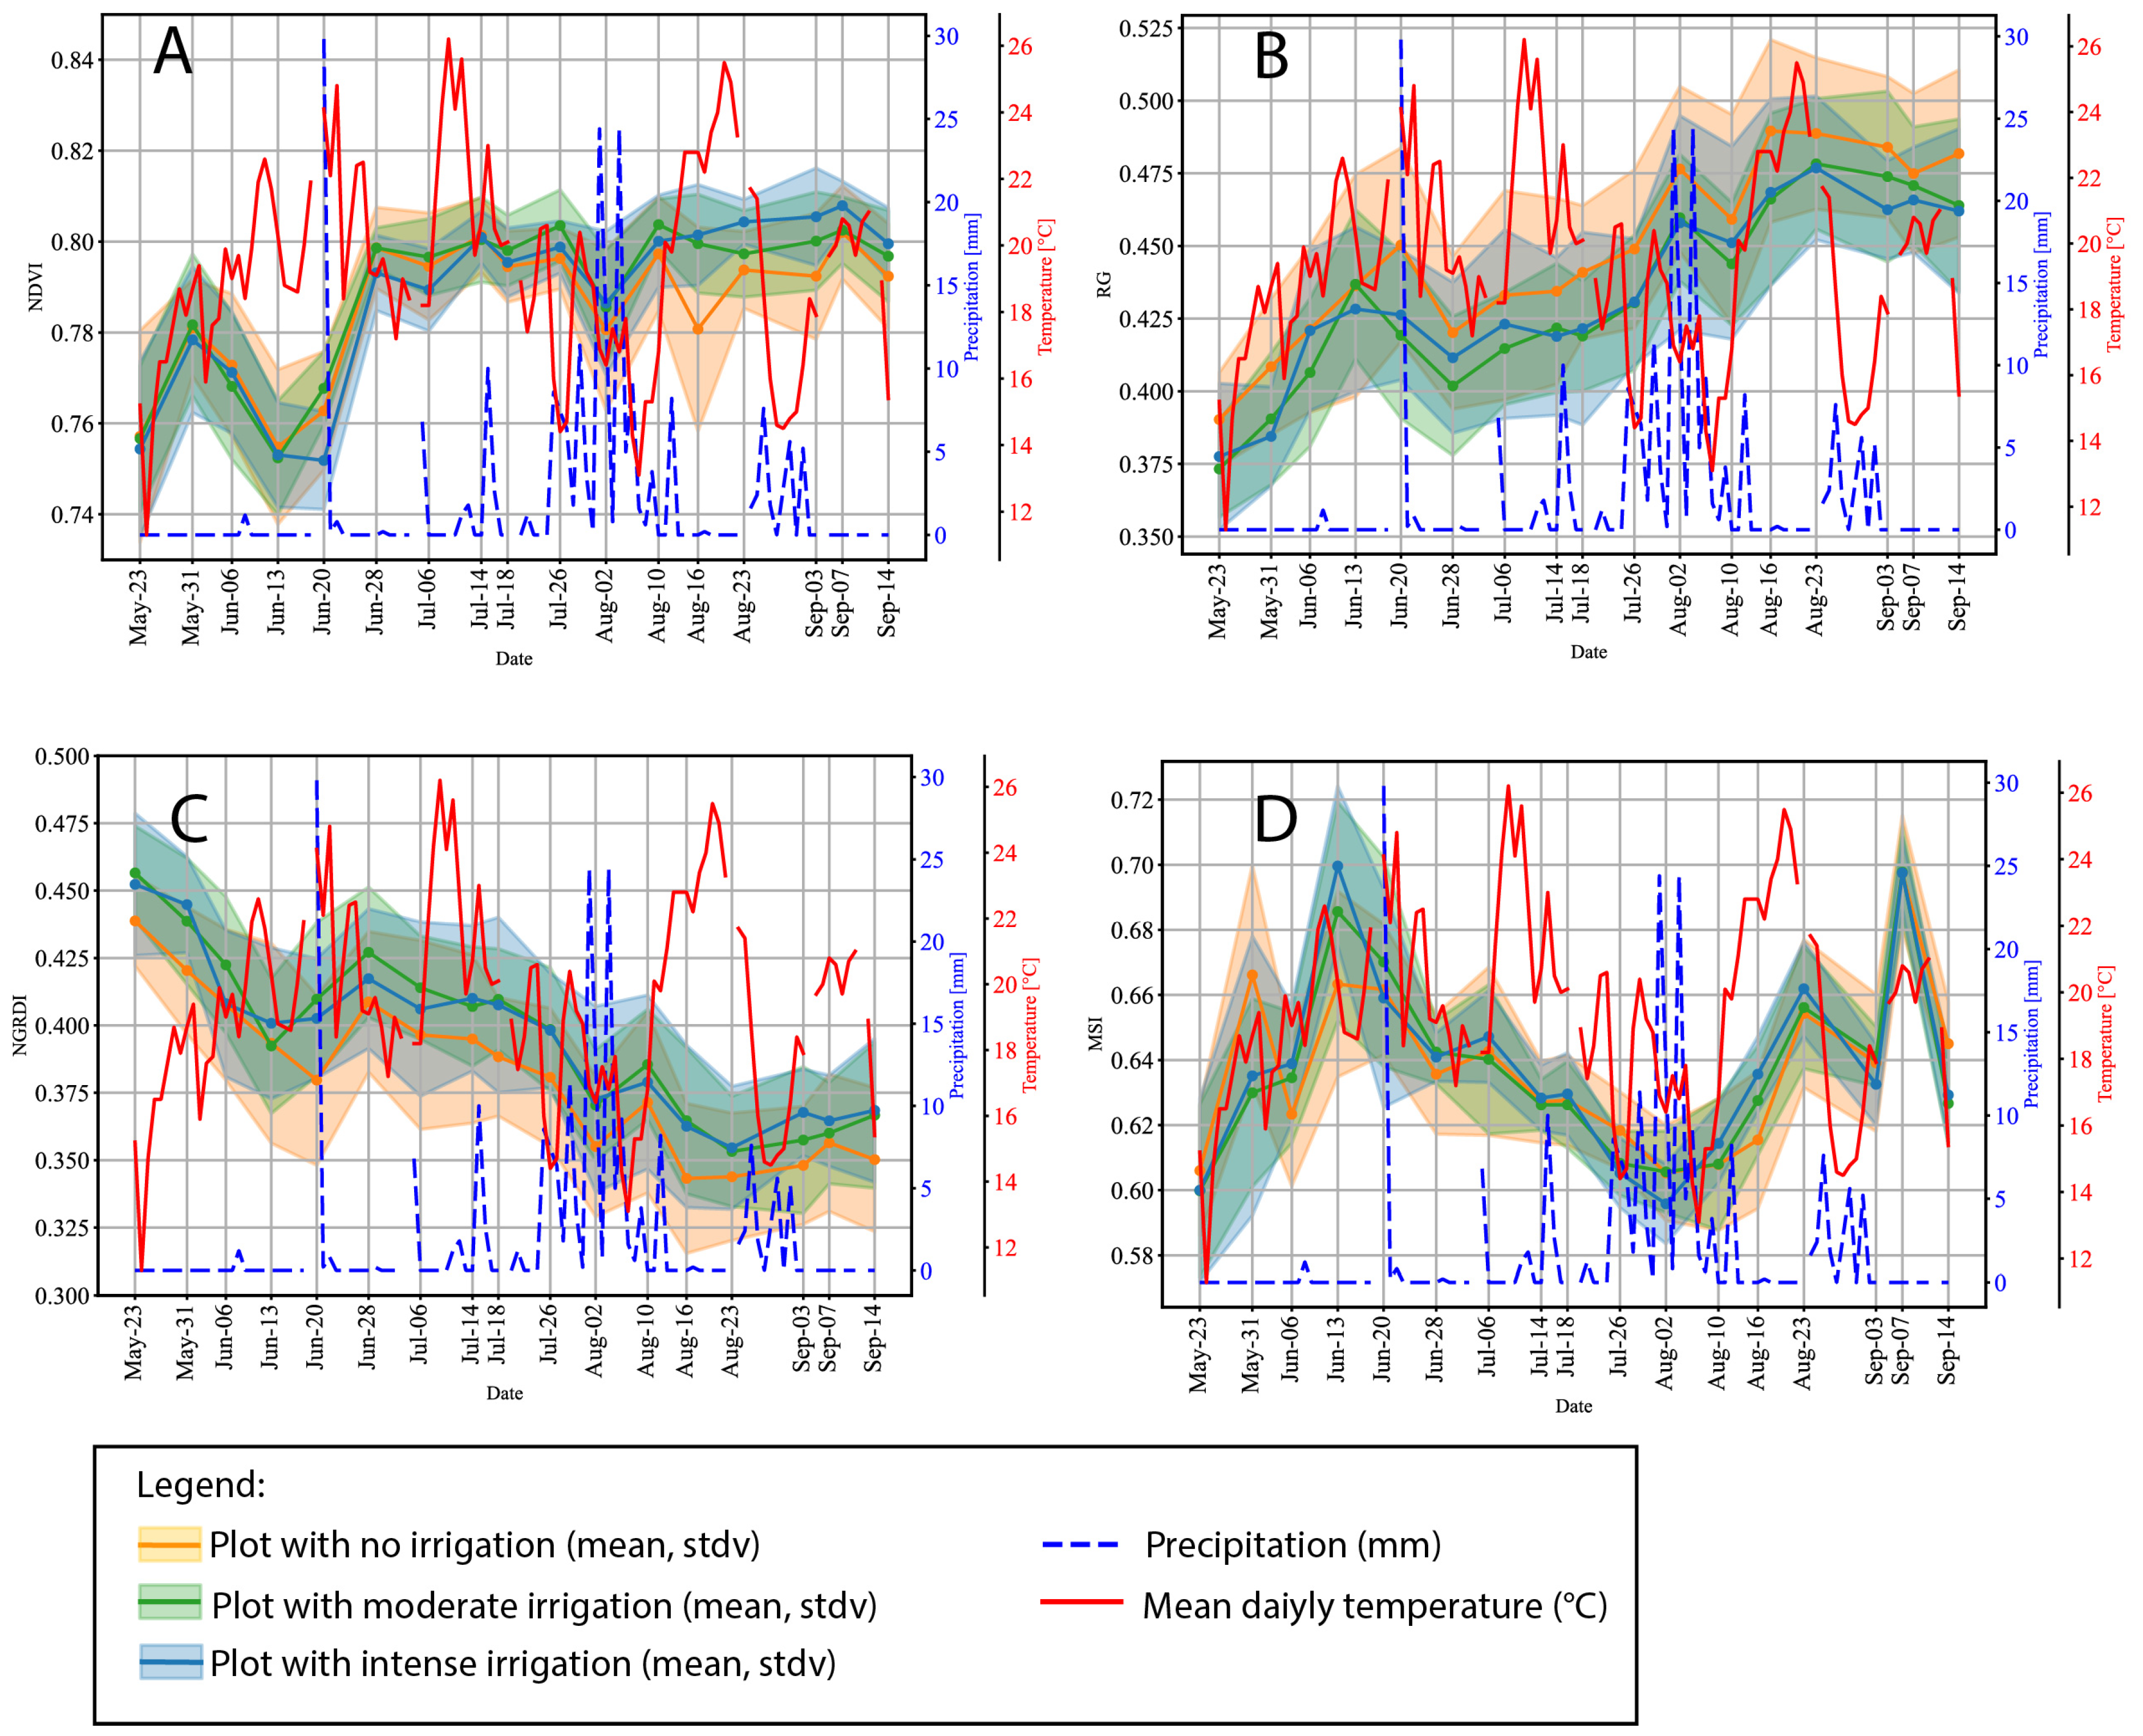
Figure 4.
Time series of (A) NDVI, (B) RG Index, (C) NGRDI, (D) MSI. NDVI and NGRDI show lower values for nonirrigated plants from June through to September (NGRDI) and are more pronounced in August for the NDVI. The RG index follows the same pattern with higher values for nonirrigated plants. The moisture stress index, MSI, on the other hand, shows slightly higher values for irrigated plants, especially after strong rainfall in August. Additional plots for VIs not shown here can be found in Appendix A.
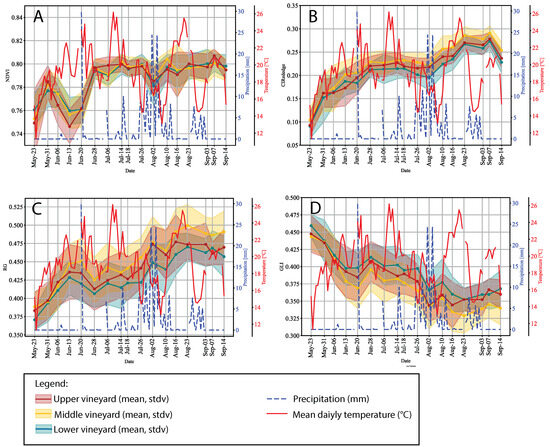
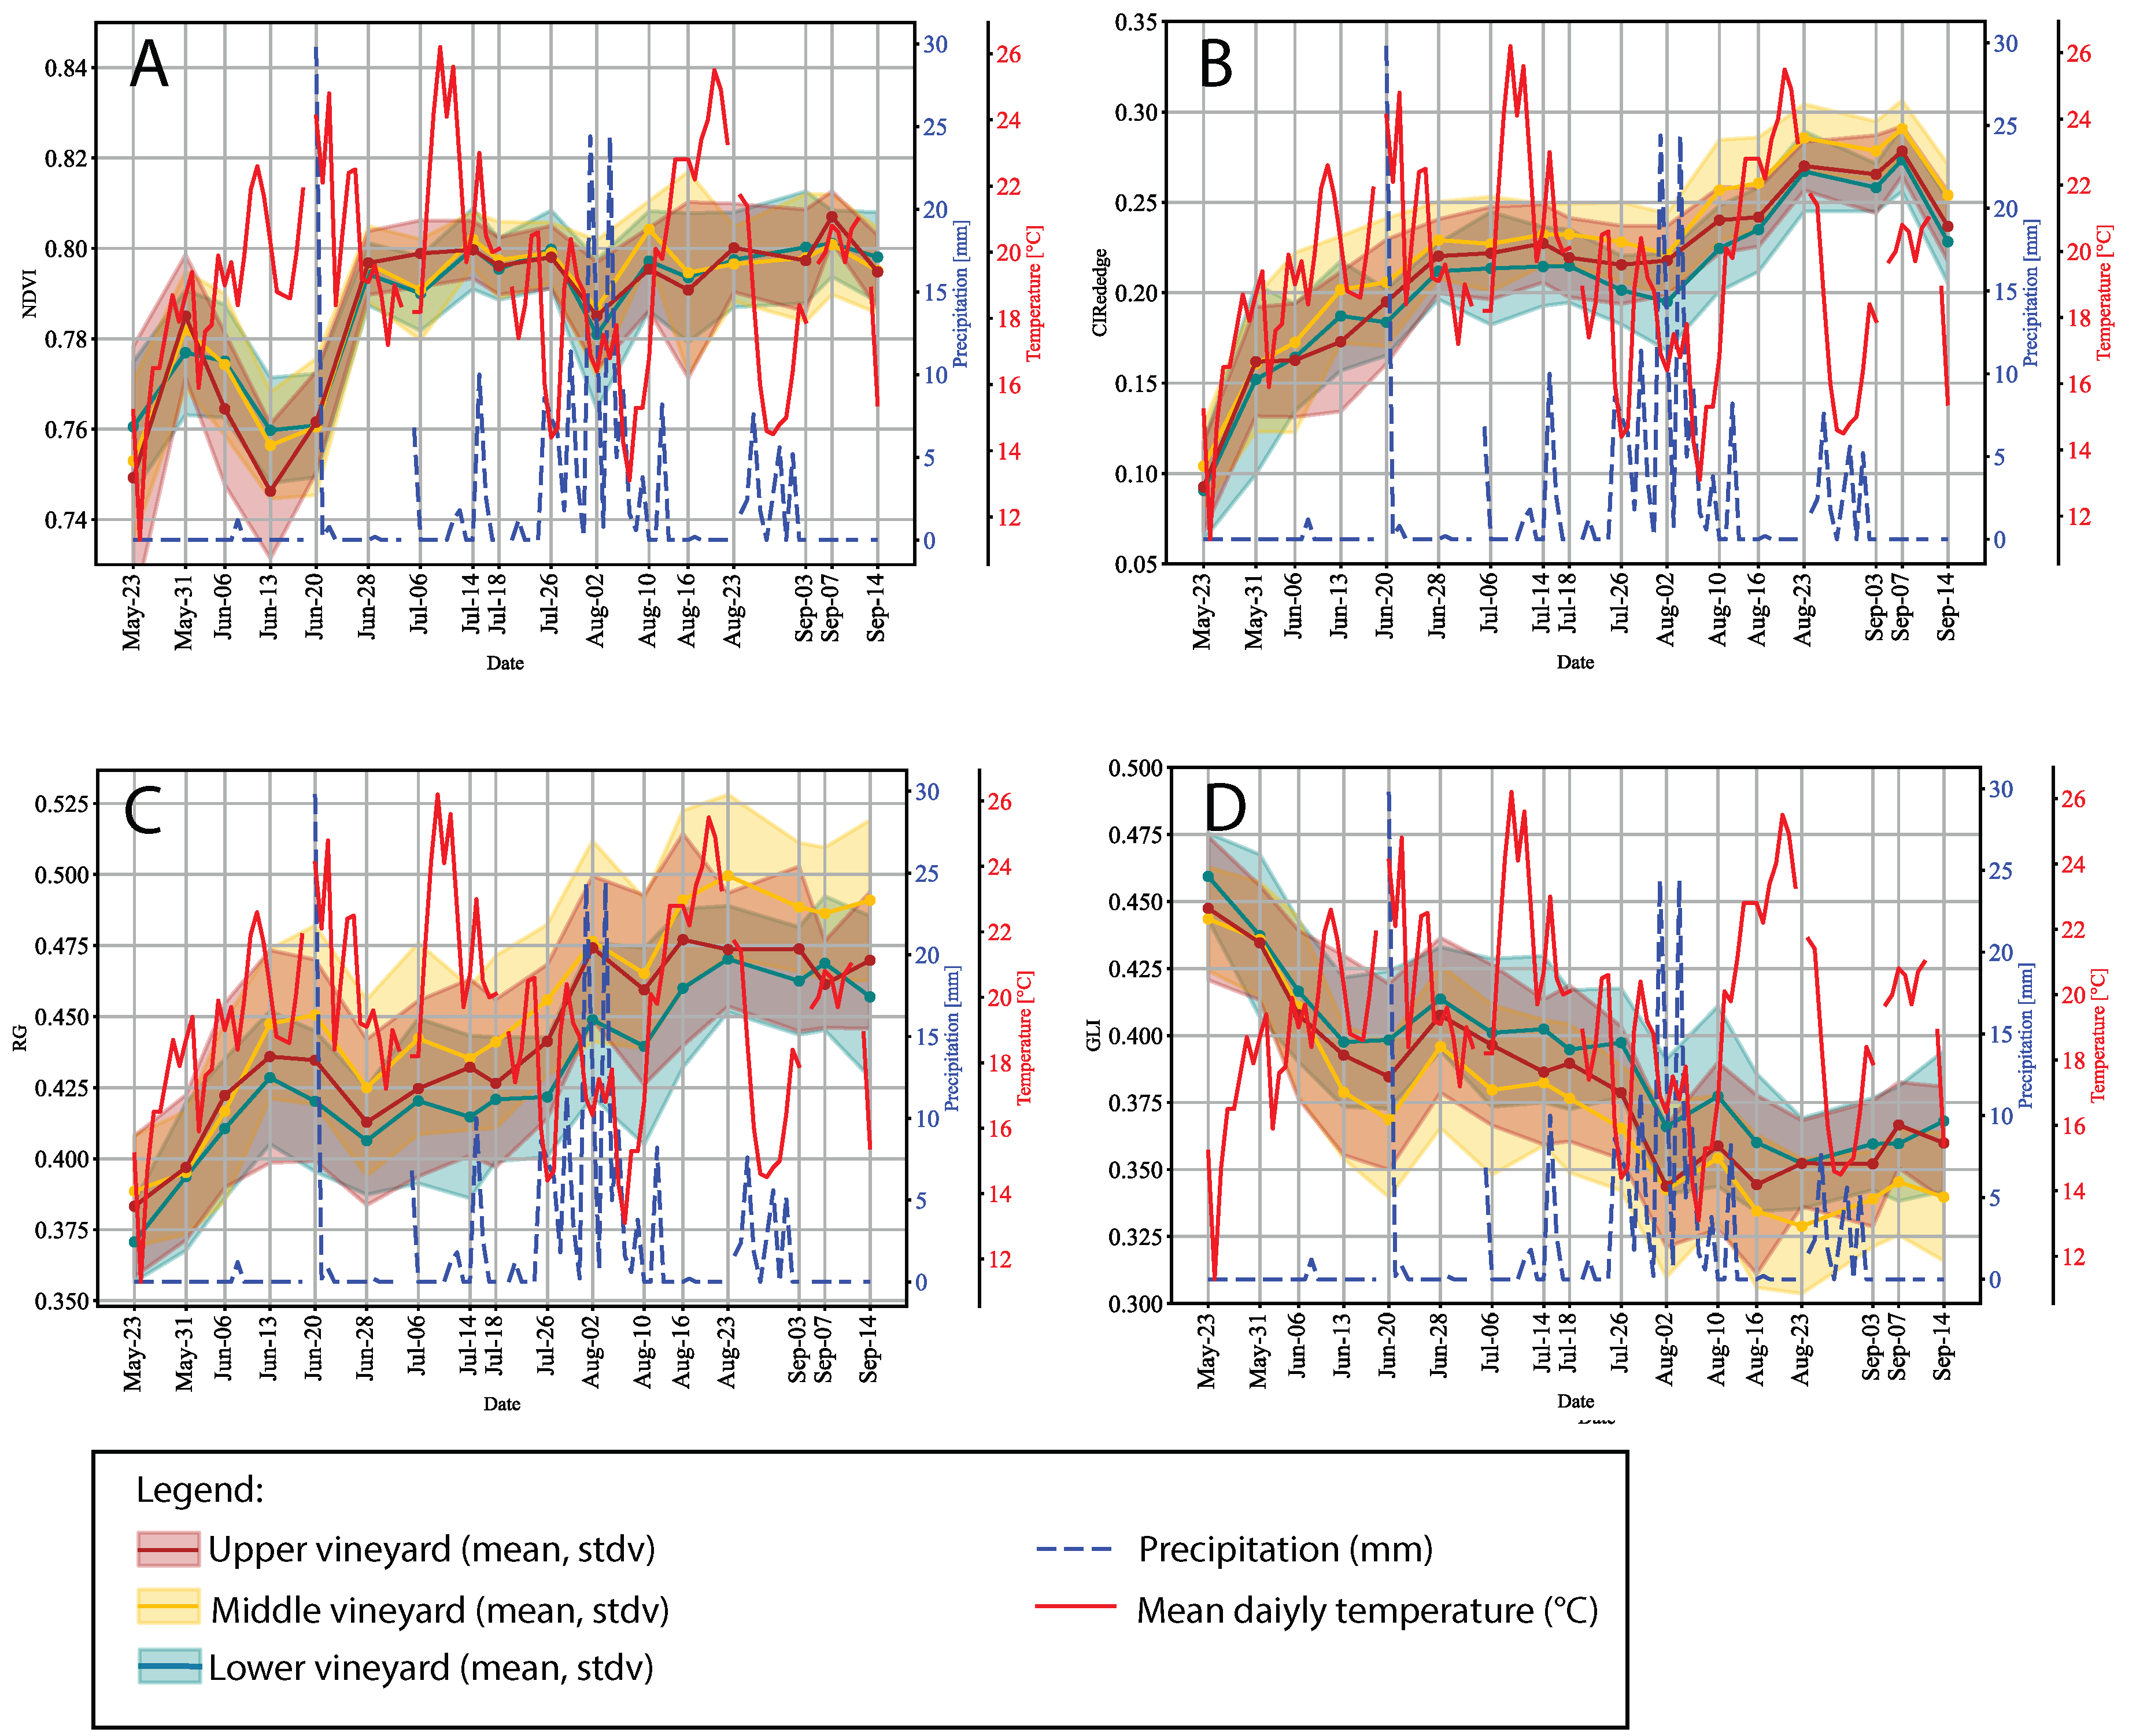
Figure 5.
Time series of (A) NDVI, (B) CIRedEdge Index, (C) RG Index, (D) GLI index. For NDVI, there are no significant differences with respect to topography, while the CIRedEdge index is less favorable for the lower part of the vineyard. The RG index is lower for the lower part of the vineyard, while the GLI is higher for most of the vegetation period. Additional plots for VIs not shown here can be found in Appendix A.
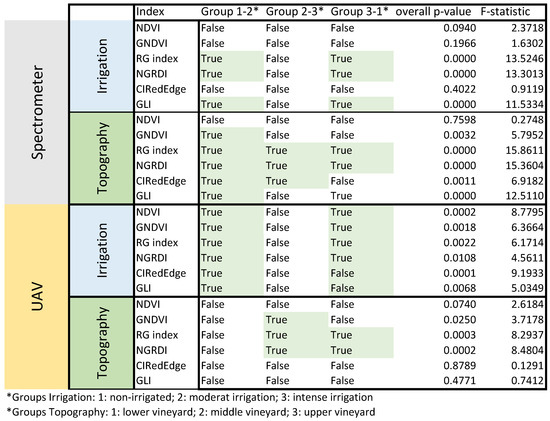
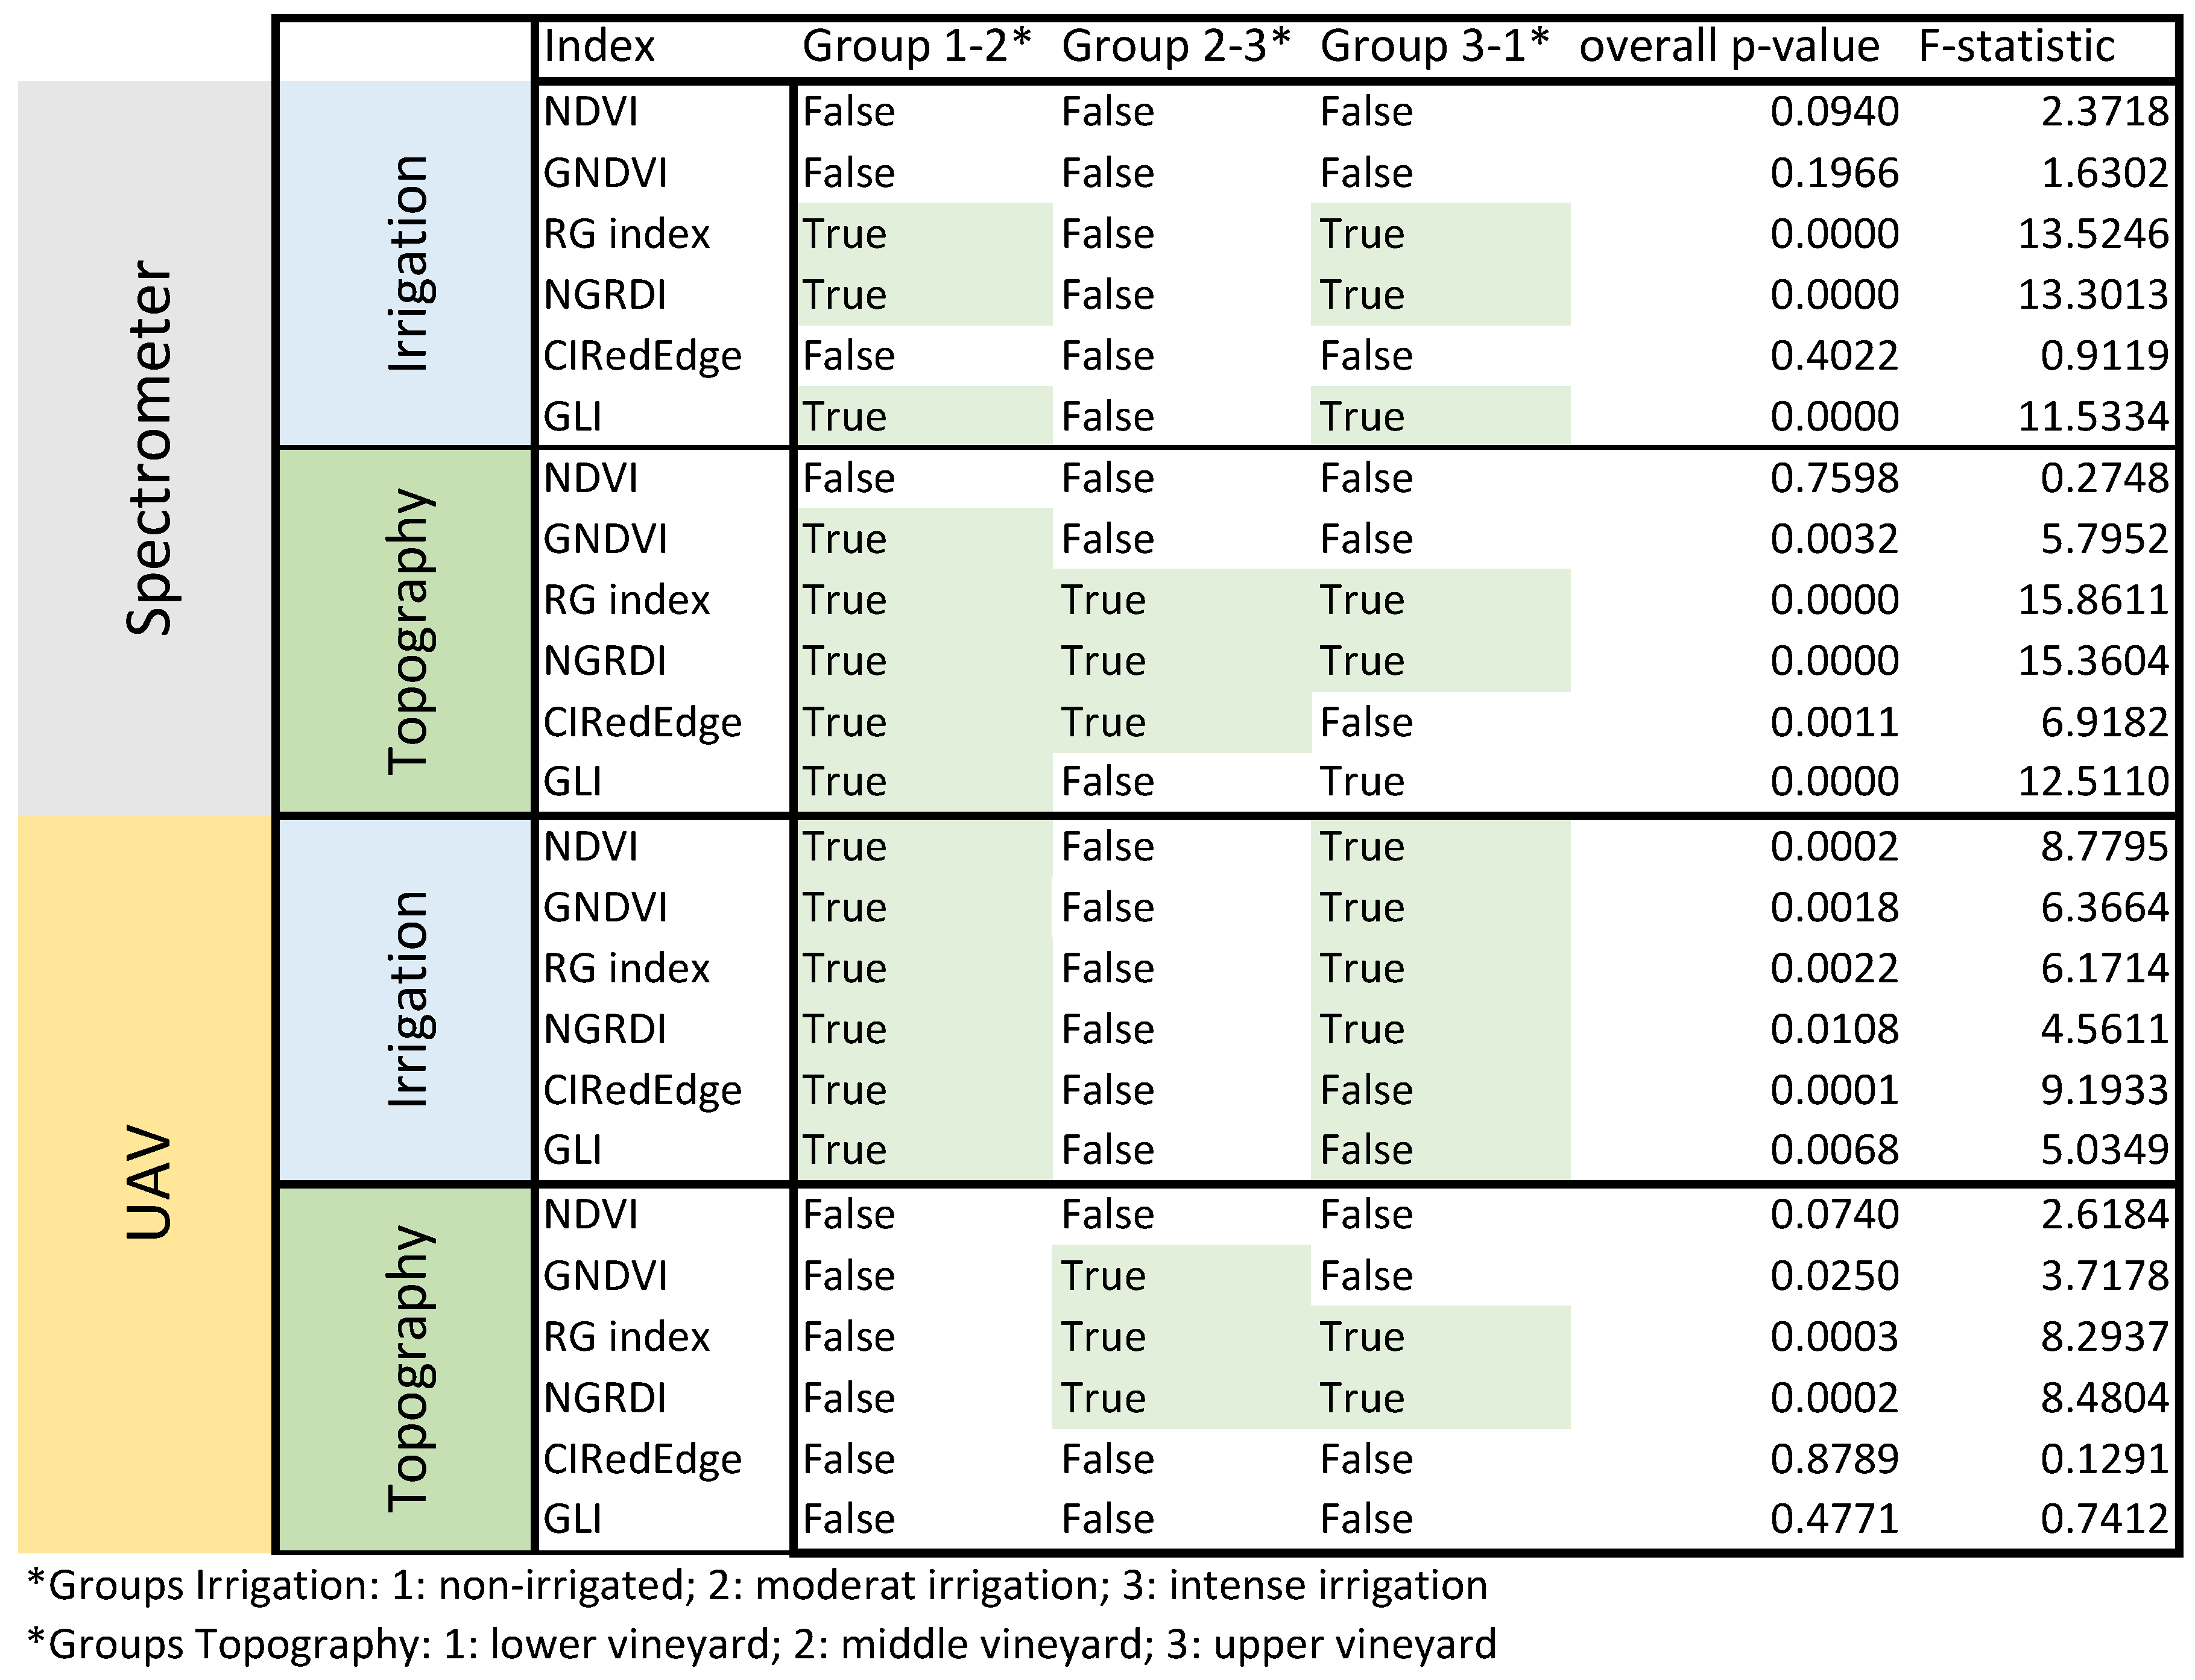
Figure 6.
Matrix showing results of the Tukey HSD test after performing ANOVA analysis for all indices with respect to topographic and irrigation classes. Test results are shown for in situ data as well as UAV-derived indices. Significant test results are highlighted in green.
The NDVI starts to increase during May with a decline during high temperatures at the beginning of June. There are no significant differences with respect to irrigation. This is also the case for the CIRededge and GNDVI indices. However, during the high-temperature period in August, we see a significant drop for the nonirrigated class. For the RG, GLI (Appendix A, additional graphs for Figure 4), and NGRDI indices, statistical analysis shows significant differences for the whole vegetation period (see Figure 6: patterns of lower (higher for the RG index)), and values for nonirrigated plants, especially in July and August, are clearly visible. For all three indices, there are significant differences between the irrigated classes and the nonirrigated class. There are no significant differences between the two irrigation classes (compare Figure 6). The moisture stress index, on the contrary, has lower values for irrigated plants after rainfall, though differences are not statistically significant for the whole vegetation period (not shown in the table as this index was only used once).
As topography and aspect are also important factors for soil moisture and plant development, we also analyzed the time series of VIs with respect to location in the vineyard (compare Figure 1). Results for four selected indices are shown in Figure 5 (additional plots for VIs not shown here can be found in Appendix A), and statistical significance test results are shown in Figure 6.
For the RG, NGRDI, and GLI indices, we see a pronounced lower/higher index through the whole vegetation period for the lower vineyard, indicating differences in plant development with respect to topography. Statistical test results indicate significant differences between all classes for the RG index and NGRDI index, as well as between the middle vineyard and lower and middle classes for GLI and CIRedEdge indices, but only for the CIRedEdge for lower and upper locations. This pattern is absent for the NDVI. The middle part of the vineyard exhibits the best overall values for all indices, which is also reflected in the test statistics. For the chlorophyll-sensitive indices, we observe a steady increase until August, with a slight decrease in September.
3.2. Correlation of UAV-Derived VIs and Hyperspectral In Situ Measurements
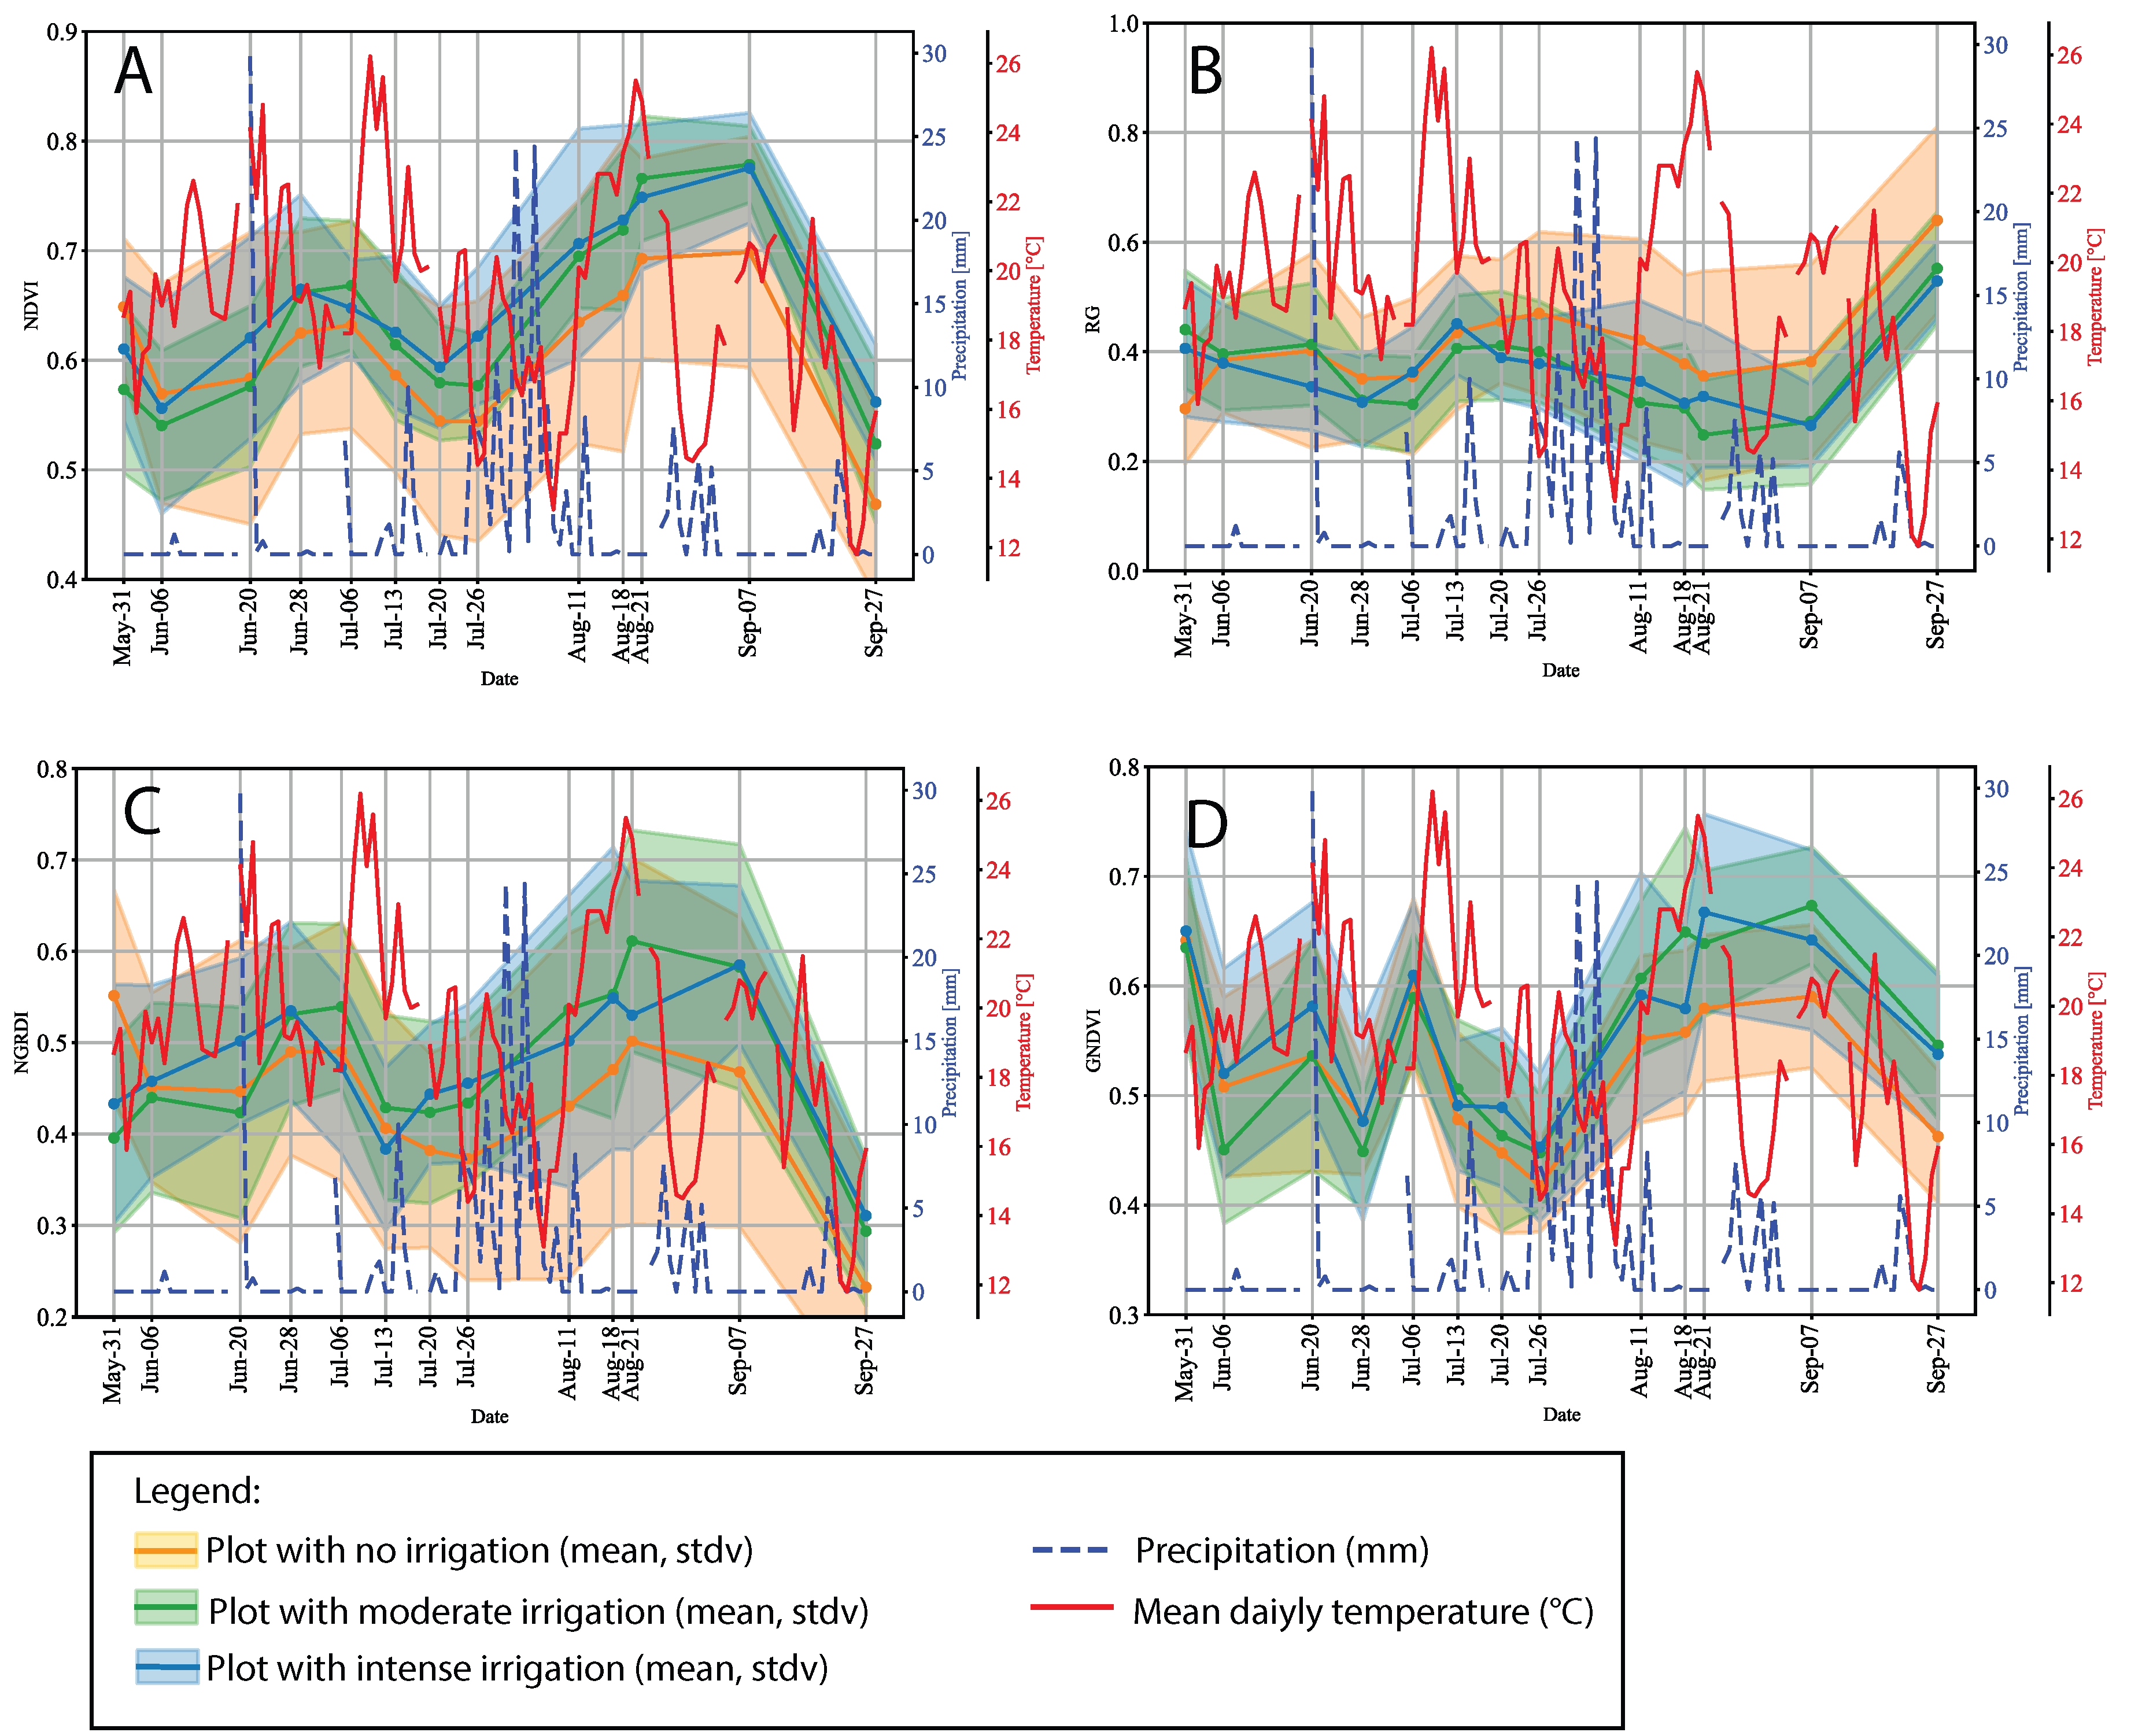
Time series for UAV-derived data are shown in Figure 7 (additional plots for VIs not shown here can be found in Appendix A), and statistical test results with respect to irrigation and topography are summarized in Figure 6. Interestingly, for all indices, we see significant differences between irrigated classes and the nonirrigated class, while this was only partially the case for the in situ measurements. On the other hand, with respect to topographic position, we only see differences between the middle and upper and lower and upper positions for the RG index and the NGRDI, while in situ data were significant for all indices (except for the NDVI) with respect to lower and middle positions, in addition to the results from UAV data.
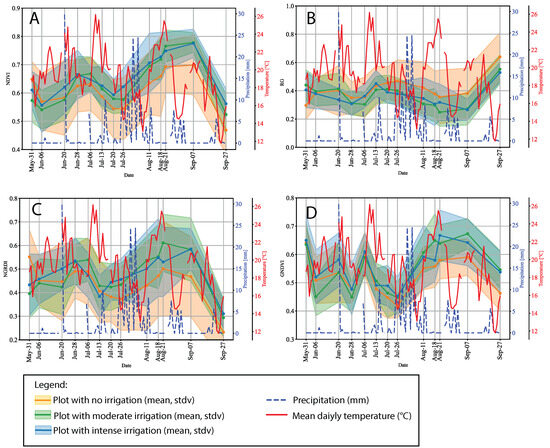
Figure 7.
Time series of (A) NDVI, (B) RG index, (C) NGRD index, (D) GNDVI index. Significant differences for nonirrigated plots are clearly pronounced for all indices shown. The steep drop (NDVI, NGRDI, GNDVI) at the end of September is not clearly visible in the spectrometer data, as the last measurement took place on the 14th of September. Additional plots for VIs not shown here can be found in Appendix A.
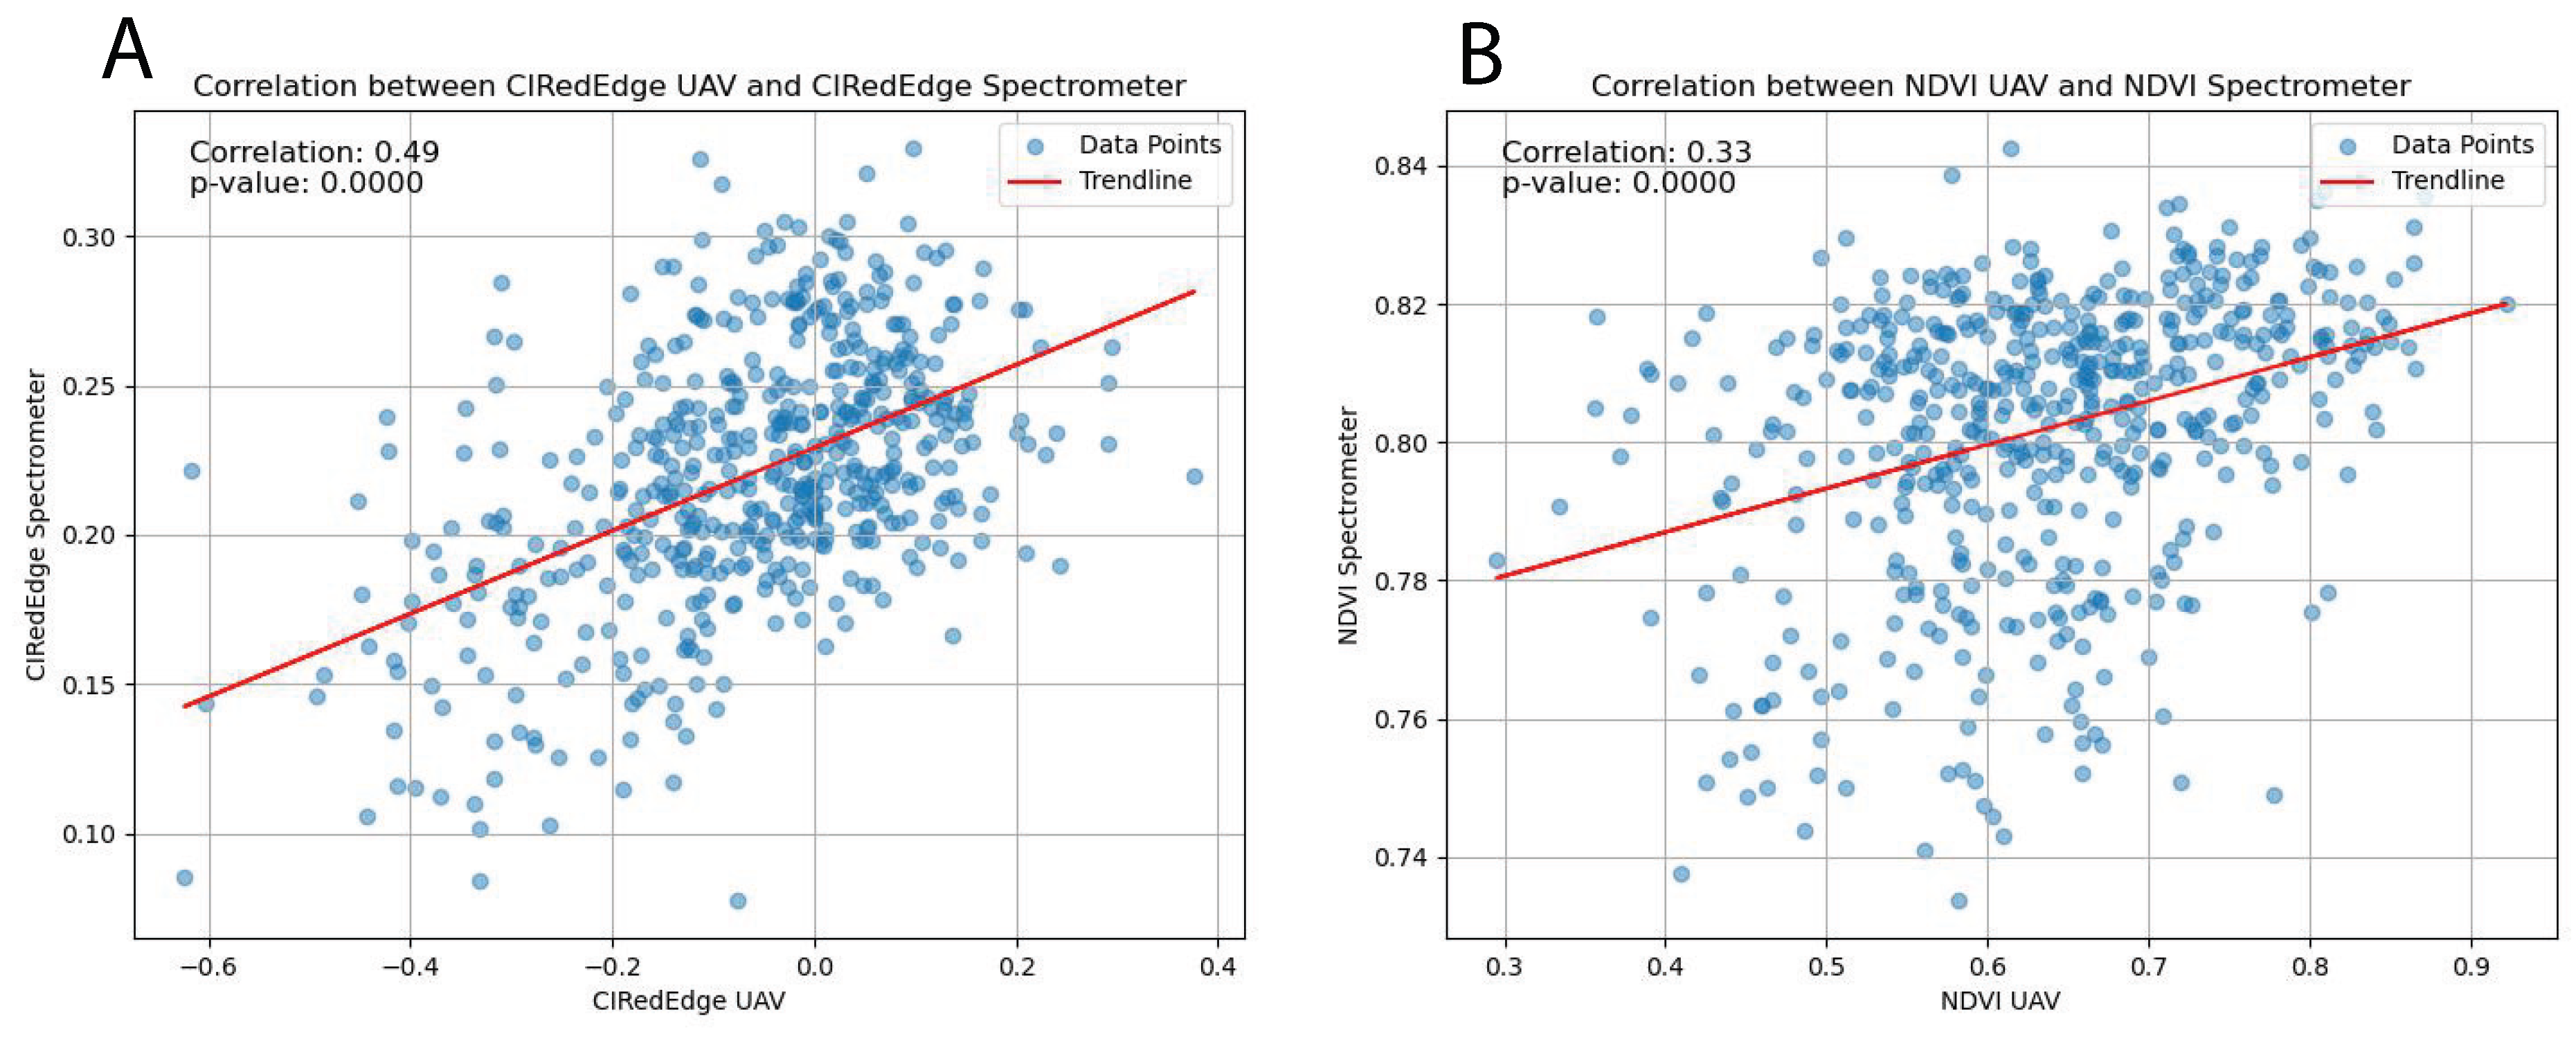
Correlation analysis for the NDVI, GNDVI, RG index, and GLI index resulted in a positive correlation with an of 0.49 and 0.33 for CIRedEdge and NDVI, respectively (compare Figure 8). The other investigated indices showed no significant correlation. This observation indicates that indices that include NIR information are better suited for correlation, while indices only based on the red and green part of the spectrum do not exhibit correlation.

Figure 8.
Correlation analysis of in situ data with UAV-derived VIs. (A) CIRedEdge, (B) NDVI.
3.3. Soil Moisture Patterns during the Vegetation Period for Nonirrigated Plots and Changes in VIs
Mean values and standard deviation of soil moisture at different depth levels are shown in Figure 9. While shallow soil levels react dynamically to rainfall events and show high fluctuations, depth levels greater than 80–90 cm are more stable until prolonged rainfall in July/August. During the whole vegetation period, we did not observe prolonged drought, only a relatively dry period during May and the beginning of June. In Figure 9B, we show the GNDVI mean value and standard deviation for the plants located at the measurement tubes. Patterns for NDVI, CIRedEdge, and RG index are similar and not shown. After a drop in values during rainy weather, we observe an increase, and at the end of July, a steep increase in GNDVI values. The for GNDVI is 0.27 when correlating the respective values (soil moisture at 20 to 40 cm), for CIRededge 0.34, and for the RG index an even 0.46, though some measurement dates do not match perfectly. At deeper levels, this correlation is not visible. Whether correlation is likely to be causation will be discussed in the following section.
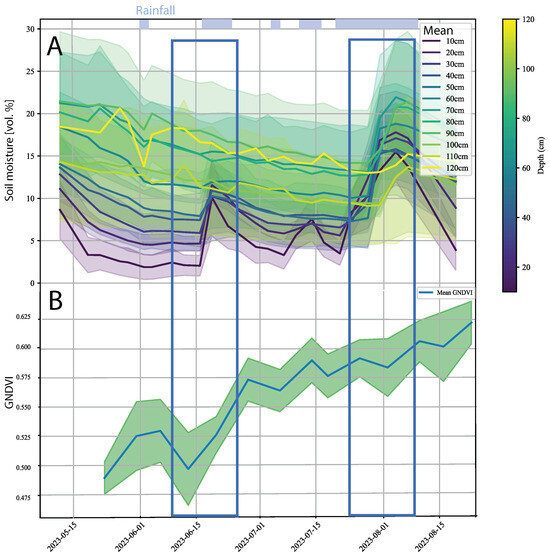
Figure 9.
(A) Mean soil moisture at different depth levels over the vegetation period. Stdv. is plotted in shaded colors. Rainfall events are shown in blue. We observe high fluctuations in shallow soil levels, while deeper levels mainly react to prolonged rainfall in July to August. (B) GNDVI mean values for plants located at soil moisture measurement tubes. Stdv. is shown in shaded colors. We observe a steep rise in GNDVI values after prolonged rainfall at the end of June and again in August.
4. Discussion
In this section, we first discuss results from the time series analysis with respect to irrigation systems and topographic position and then from correlating airborne data with in situ measurements. We finish with a comparison with other studies and an outlook for further investigations.
4.1. What Do We Learn from Time Series of VIs with Respect to Irrigation, Topography, and Climate—And What Remains to Debate?
The analysis of the time series of VIs with respect to irrigation showed a high potential of using VIs with information form the RedEdge region of the electromagnetic spectrum to monitor plant development. We see statistically significant differences between irrigated and nonirrigated patches for all investigated indices in UAV data and GLI, NGRDI, and RG index for in situ data. UAV data proved to be more suitable for distinguishing these groups, which might be due to our statistical approach of sampling the best pixel values from the plants. The UAV only sees the top leaves, while in situ measurements take place in lower plant levels, which might be less affected by lack of water. We also see that differences become more pronounced during prolonged dry and warm weather in June/July and late August for the RG, NGRDI, and CIRedEdge indices, making these indices suitable for monitoring potential drought stress. As water uptake from vines can be from rather deep levels, soil moisture development during 2023 was not critical with respect to drought, as only shallow levels show significant fluctuations during warm periods in May/June. These results indicate that UAV-based vineyard monitoring based on VIs could be leveraged for adapted irrigation. The correlation between VIs and shallow-level soil moisture levels shown in Section 3.3 might not be causal with respect to plant development (the vines show steady development over the vegetation period with some boost after rainfall paired with warm weather conditions) but might be related to the effect of rain on the surface of the leaves. Our analysis of the effect of the topographic position within the vineyard showed significant differences mostly between the lower part of the vineyard and the middle or upper part for in situ-derived VIs and middle and upper parts for UAV data (compare Figure 6). These results indicate that adapted treatment/irrigation of plants according to location in the vineyard might be a tool to save water.
4.2. Scaling up from In Situ to UAV—A Critical Assessment
Upscaling from in situ measurements to UAV data or even satellite sensors is a challenge in remote sensing. This is due to different spatial, spectral, and—for satellite systems—temporal resolutions, as well as atmospheric interference. To find best possible correlations, we applied spatial statistics to extract good pixel values from the same plants that were sampled in the field and resampled hyperspectral data to the UAV spectral resolution prior to calculating VIs. Our findings show a significant correlation for CIRededge, as well as for NDVI, but none for the other investigated indices. There are several reasons for mismatching observations: (1) sometimes measurements were taken with a temporal delay of one or two days, (2) the UAV sensor gets information of the top leaves while in situ measurements are taken from side leaves that might have slightly different characteristics due to different exposure to the sun, and (3) atmospheric conditions were not always ideal, with some intervening clouds (compare Table 1) that altered the UAV-derived data. Still, the correlation for two of the investigated indices is significant and indicates that the sensor used for this study is well-suited for monitoring tasks.
4.3. Comparison with Other Works
The use of VIs for detecting drought or other plant stress is widely investigated for in situ hyperspectral data, as well as from UAVs and satellites, as discussed in Section 1.1 [6] investigated VIs derived from hyperspectral measurements and stem water potential in detail for test sites in France and concluded that the main spectral domains for water deficiency are in the SWIR, NIR, and Red-Edge region of the electromagnetic spectrum. This agrees with our findings for VIs that include NIR and Red Edge bands showing significant differences with respect to irrigation systems for in situ but also for UAV data, even though in our study the RG index that only uses the red and green bands also showed significant differences with respect to irrigation and topography. Ref. [42] successfully used airborne NDVI information for correlation with vine size, anthocyanins, and color, as well as soil moisture, with similar results for the latter, as presented in this study ( of −0.89). For Australia, Gautam et al. [29] showed the use of multispectral UAV data for assessing grapevine crop coefficients by correlating in situ data with VIs. The authors also use the NDVI and an RG indices, among others, and show high correlation until véraison time point; otherwise, structural features were needed for good models. These findings agree somewhat with our findings of spectral indices from UAVs being a suitable, though somewhat limited, tool for optimizing irrigation within vineyards. With respect to the discrepancies between UAV and in situ-derived VIs, other authors also found similar problems (e.g., [43,44,45]) that might be related to the sensor, distance, or atmospheric influence, as well as different leaves sampled. A positive correlation between NDVI and soil moisture was also reported by [46], even though on a very different scale, between MODIS/TERRA satellite data. Pagay and Kidman (2019) [27] used several spectral indices calculated from thermal infrared for assessing vine water status and showed the potential of several indices, such as CWIS on a regional scale. Combining multispectral data, as shown in the present study, with data from a thermal sensor might, thus, be an interesting future line of research with respect to quantitatively assessing water stress response in grapevines.
5. Conclusions and Outlook
The presented results highlight the potential of multispectral UAV data for monitoring tasks for precision viticulture and thus the possibility of replacing time-consuming field measurements for plant water supply. In our controlled environment with different irrigation systems and soil moisture sensors, we were able to show significant differences in VIs over the vegetation period with respect to (1) irrigation and (2) topography. Further investigation is needed to find, for example, critical thresholds in VIs with respect to drought or water stress that was not observed in the wet vegetation period in 2023. Our findings show the potential for adapted irrigation strategies based on detailed knowledge of spatiotemporal variability that deliver just the right amount of water to each plant at the right time or stage of development. In our study, there were no significant differences between moderate and intense irrigation, indicating that water could be saved by monitoring plant health and adapting irrigation accordingly. As phases of prolonged heat will become more frequent due to climate change, such strategies are of utter importance for regions with water scarcity.
Author Contributions
Conceptualization, M.B. and D.H.; methodology, M.B., A.M.-S., P.S. and A.K.; formal analysis, M.B., A.M.-S., P.S. and A.K.; investigation, M.B. and D.H.; resources, M.B. and D.H.; data curation, M.B. and D.H.; writing—original draft preparation, M.B.; writing—review and editing, M.B., P.S. and D.H.; supervision, M.B. and D.H.; project administration, M.B.; funding acquisition, M.B. All authors have read and agreed to the published version of the manuscript.
Funding
Supported by the publication fund of the Technical University of Applied Sciences Würzburg-Schweinfurt.
Data Availability Statement
Data are not provided due to ongoing research.
Acknowledgments
We want to thank the IHK Würzburg-Schweinfurt for awarding this research with the “TH Advancement Award of the Mainfranken Economy”, and, above all, Wolfgang Probst from the AllTerra Deutschland GmbH for providing the UAV used in the project.
Conflicts of Interest
The authors declare no conflicts of interest.
Abbreviations
The following abbreviations are used in this manuscript:
| VI | Vegetation Index |
| UAV | Unmanned Aereal Vehicle |
| NDVI | Normalized Difference Vegetation Index |
| GNDVI | Green Normalized Difference Vegetation Index |
| RE index | Red/Green Index |
| CIRedEdge | Chlorophyll Index Rededge |
| GLI | Green Leaf Index |
| MSI | Moisture Stress Index |
| HSD | Honesty Significant Difference |
| ANOVA | Analysis of Variance |
Appendix A

Figure A1.
Additional plots for Figure 4 in the paper: Time series of spectrometer data with respect to irrigation systems for GLI and CIRedEdge.
Figure A1.
Additional plots for Figure 4 in the paper: Time series of spectrometer data with respect to irrigation systems for GLI and CIRedEdge.
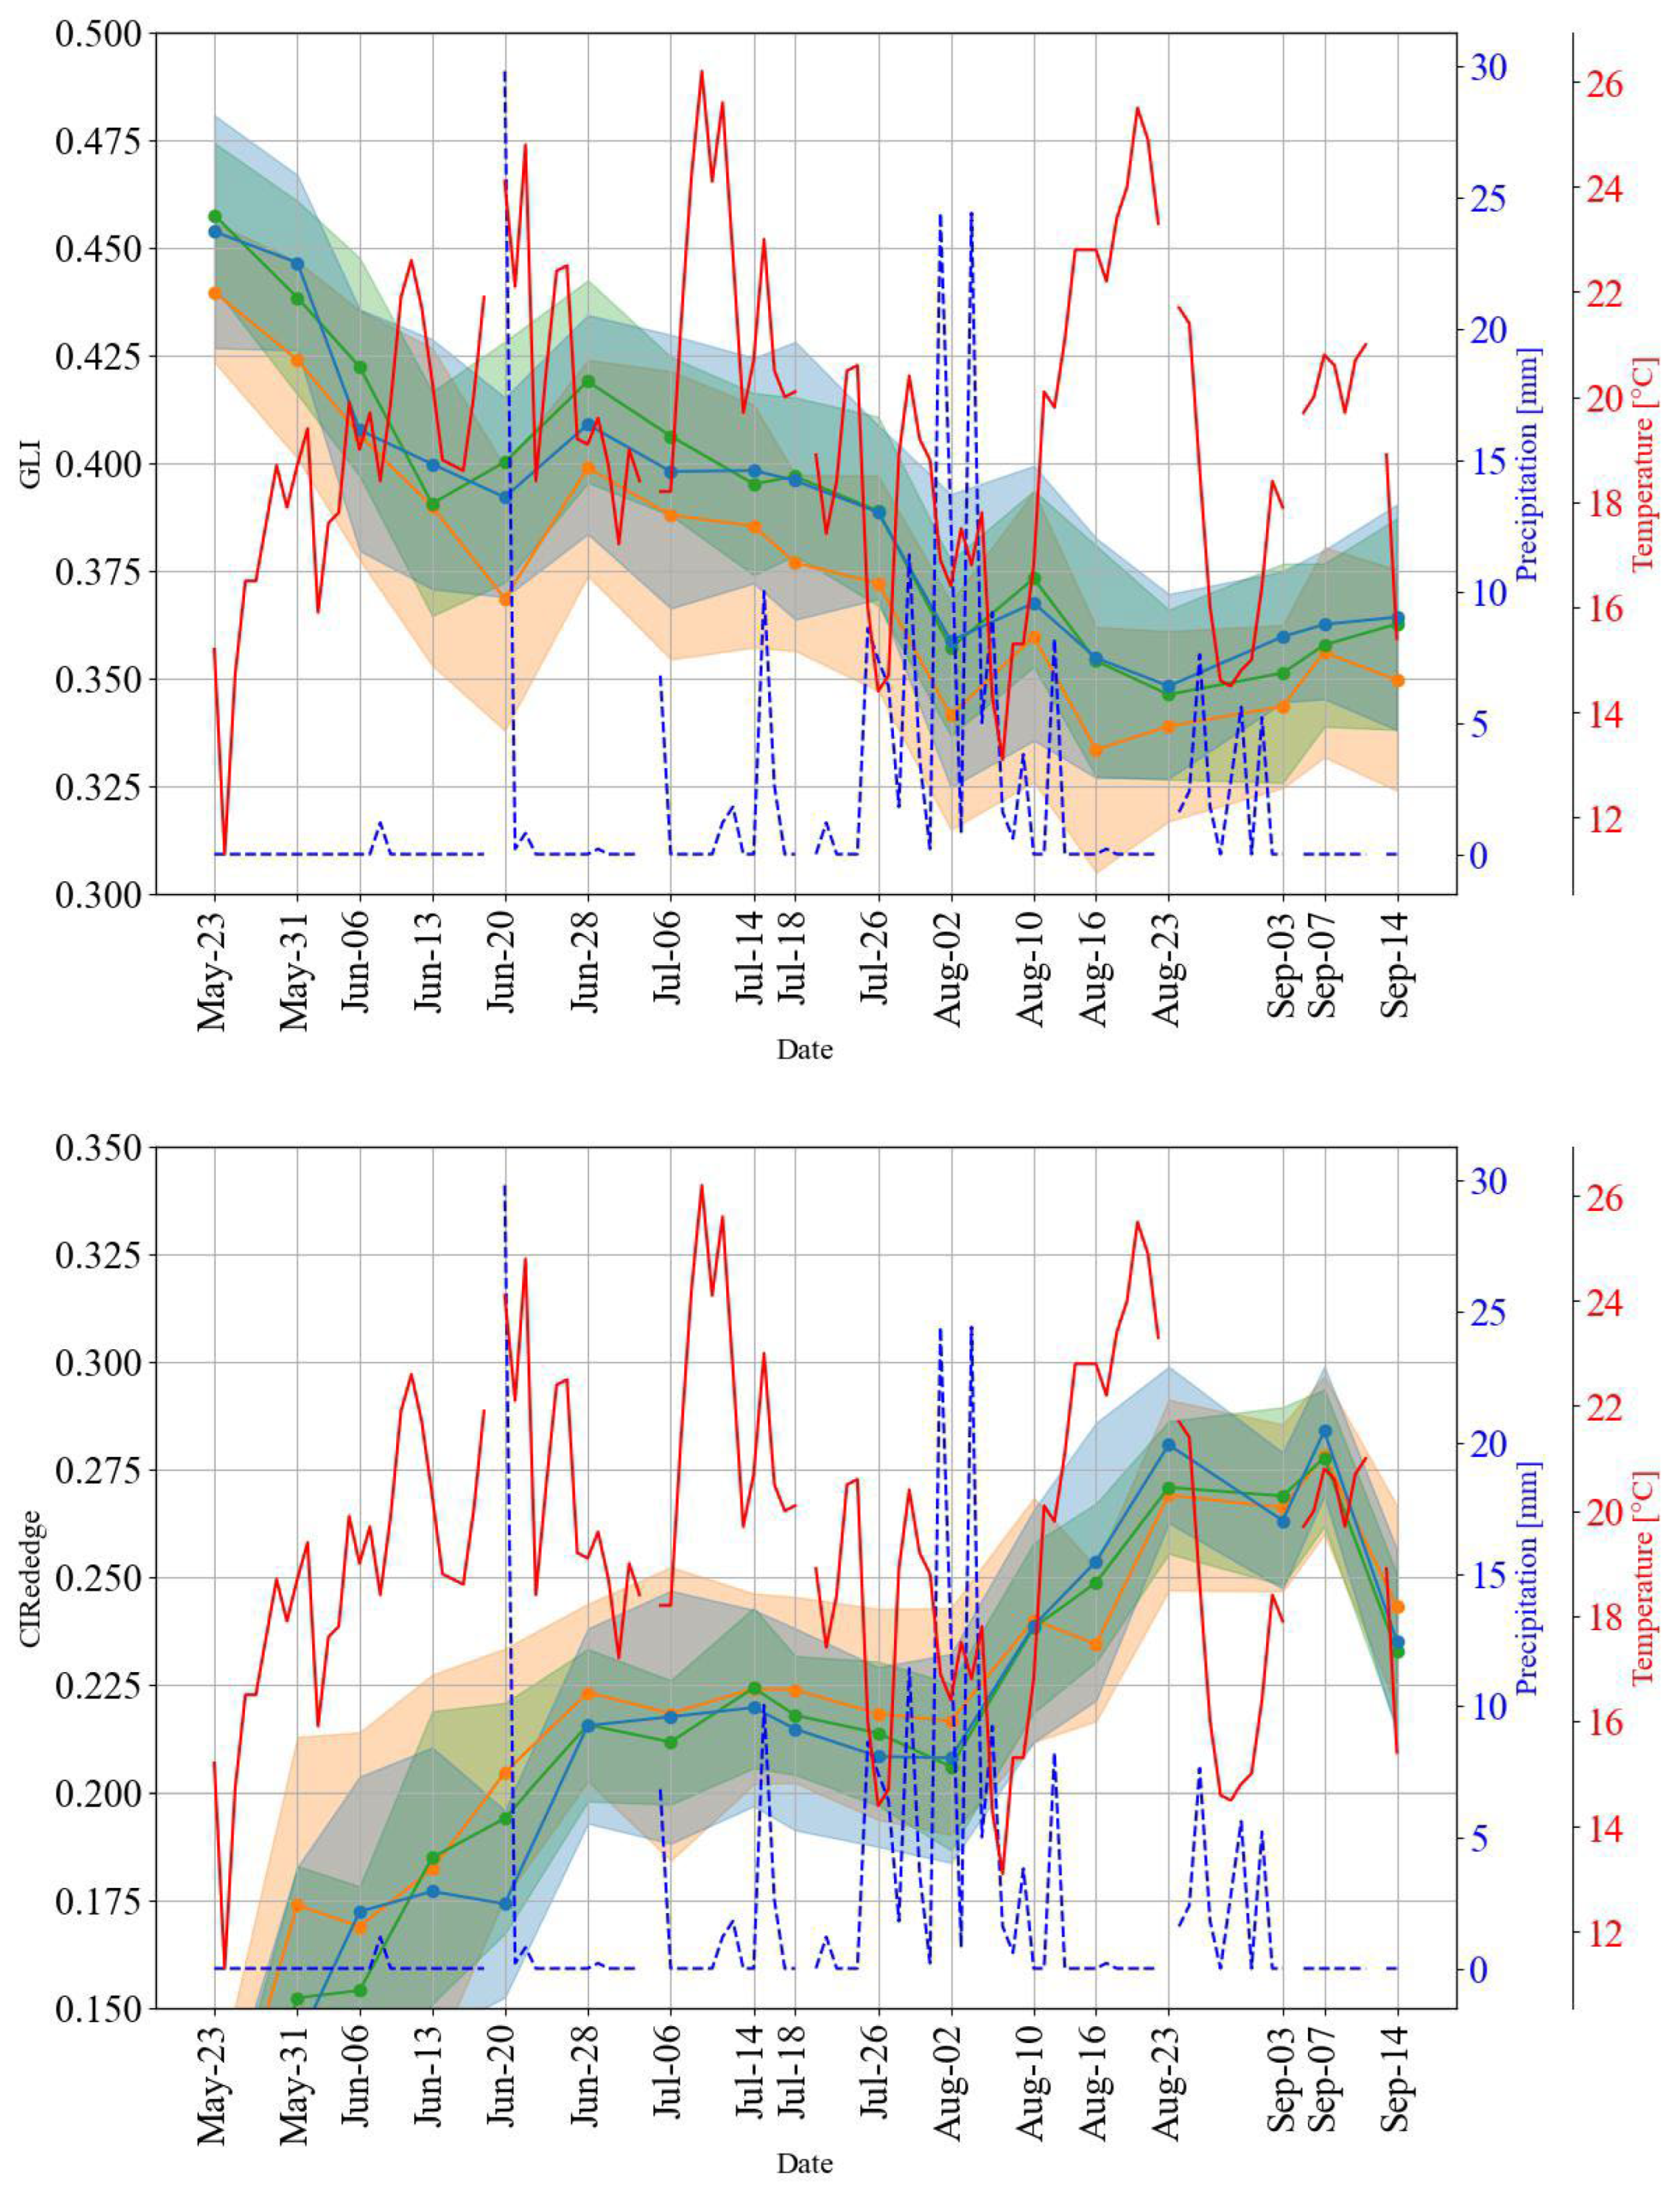
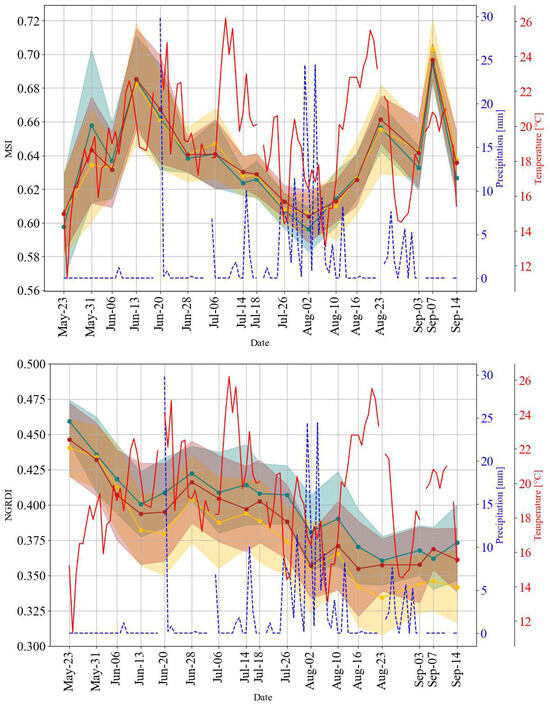
Figure A2.
Additional plots for Figure 5 in the paper: Time series of spectrometer data with respect to topography for MSI and NGRDI.
Figure A2.
Additional plots for Figure 5 in the paper: Time series of spectrometer data with respect to topography for MSI and NGRDI.

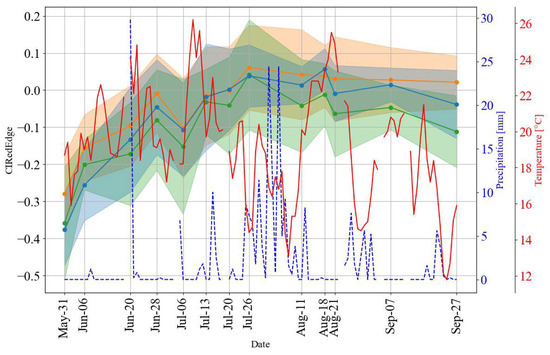
Figure A3.
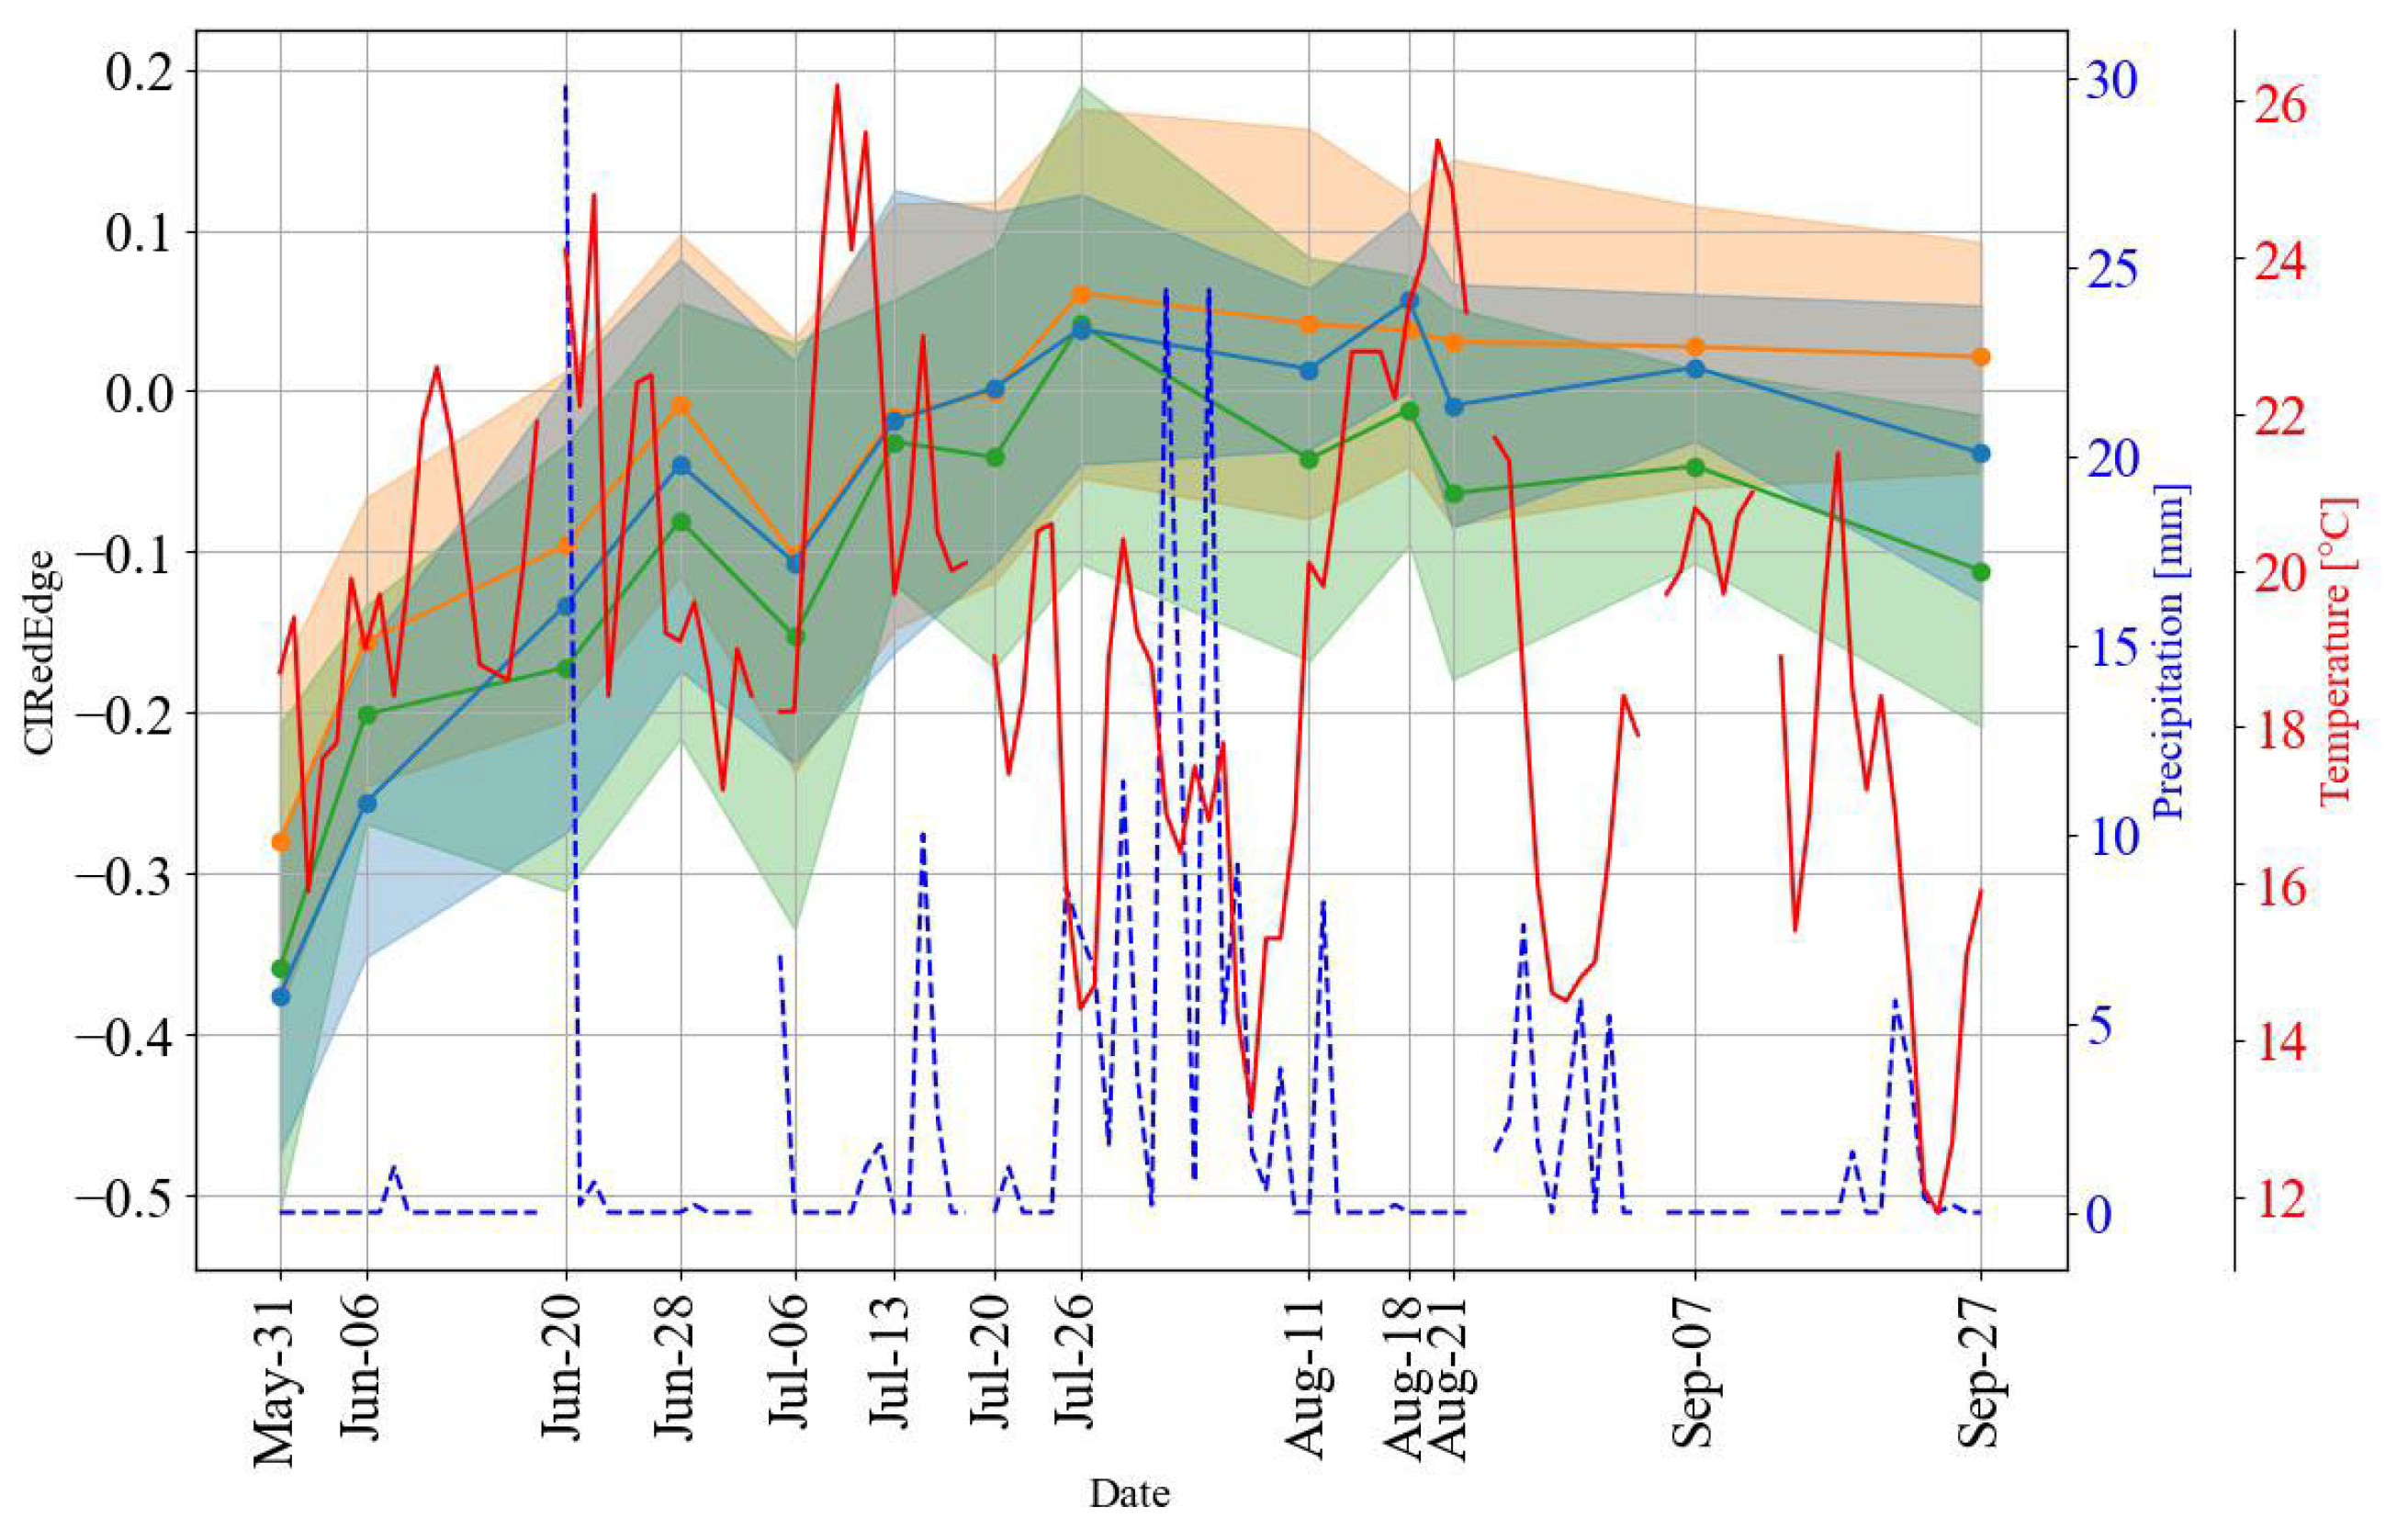
Additional plot for Figure 7 in the paper: Time series of UAV data with respect to irrigation for the CIRedEdge (MSI not calculated).
Figure A3.
Additional plot for Figure 7 in the paper: Time series of UAV data with respect to irrigation for the CIRedEdge (MSI not calculated).
References
- Fraga, H. Viticulture and Winemaking under Climate Change. Agronomy 2019, 9, 783. [Google Scholar] [CrossRef]
- Pertot, I.; Caffi, T.; Rossi, V.; Mugnai, L.; Hoffmann, C.; Grando, M.; Gary, C.; Lafond, D.; Duso, C.; Thiery, D.; et al. A critical review of plant protection tools for reducing pesticide use on grapevine and new perspectives for the implementation of IPM in viticulture. Crop Prot. 2017, 97, 70–84. [Google Scholar] [CrossRef]
- Rogiers, S.Y.; Greer, D.H.; Liu, Y.; Baby, T.; Xiao, Z. Impact of climate change on grape berry ripening: An assessment of adaptation strategies for the Australian vineyard. Front. Plant Sci. 2022, 13, 1094633. [Google Scholar] [CrossRef] [PubMed]
- Hardie, W.; Considine, J. Response of grapes to water-deficit stress in particular stages of development. Am. J. Enol. Vitic. 1976, 27, 55–61. [Google Scholar] [CrossRef]
- Romero, M.; Luo, Y.; Su, B.; Fuentes, S. Vineyard water status estimation using multispectral imagery from an UAV platform and machine learning algorithms for irrigation scheduling management. Comput. Electron. Agric. 2018, 147, 109–117. [Google Scholar] [CrossRef]
- Laroche-Pinel, E.; Albughdadi, M.; Duthoit, S.; Chéret, V.; Rousseau, J.; Clenet, H. Understanding Vine Hyperspectral Signature through Different Irrigation Plans: A First Step to Monitor Vineyard Water Status. Remote Sens. 2021, 13, 536. [Google Scholar] [CrossRef]
- Santos, J.A.; Fraga, H.; Malheiro, A.C.; Moutinho-Pereira, J.; Dinis, L.T.; Correia, C.; Moriondo, M.; Leolini, L.; Dibari, C.; Costafreda-Aumedes, S.; et al. A review of the potential climate change impacts and adaptation options for European viticulture. Appl. Sci. 2020, 10, 3092. [Google Scholar] [CrossRef]
- Oliver, M.A. An overview of geostatistics and precision agriculture. In Geostatistical Applications for Precision Agriculture; Springer: Berlin/Heidelberg, Germany, 2010; pp. 1–34. [Google Scholar]
- Khaliq, A.; Comba, L.; Biglia, A.; Ricauda Aimonino, D.; Chiaberge, M.; Gay, P. Comparison of Satellite and UAV-Based Multispectral Imagery for Vineyard Variability Assessment. Remote Sens. 2019, 11, 436. [Google Scholar] [CrossRef]
- Matese, A.; Toscano, P.; Di Gennaro, S.; Genesio, L.; Vaccari, F.; Primicerio, J.; Belli, C.; Zaldei, A.; Bianconi, R.; Gioli, B. Intercomparison of UAV, Aircraft and Satellite Remote Sensing Platforms for Precision Viticulture. Remote Sens. 2015, 7, 2971–2990. [Google Scholar] [CrossRef]
- Agam, N.; Cohen, Y.; Berni, J.; Alchanatis, V.; Kool, D.; Dag, A.; Yermiyahu, U.; Ben-Gal, A. An insight to the performance of crop water stress index for olive trees. Agric. Water Manag. 2013, 118, 79–86. [Google Scholar] [CrossRef]
- Berni, J.; Zarco-Tejada, P.; Sepulcre-Cantó, G.; Fereres, E.; Villalobos, F. Mapping canopy conductance and CWSI in olive orchards using high resolution thermal remote sensing imagery. Remote Sens. Environ. 2009, 113, 2380–2388. [Google Scholar] [CrossRef]
- Jorge, J.; Vallbé, M.; Soler, J.A. Detection of irrigation inhomogeneities in an olive grove using the NDRE vegetation index obtained from UAV images. Eur. J. Remote Sens. 2019, 52, 169–177. [Google Scholar] [CrossRef]
- García-Tejero, I.; Rubio, A.; Viñuela, I.; Hernández, A.; Gutiérrez-Gordillo, S.; Rodríguez-Pleguezuelo, C.; Durán-Zuazo, V. Thermal imaging at plant level to assess the crop-water status in almond trees (cv. Guara) under deficit irrigation strategies. Agric. Water Manag. 2018, 208, 176–186. [Google Scholar] [CrossRef]
- Martínez-Casasnovas, J.A.; Sandonís-Pozo, L.; Escolà, A.; Arnó, J.; Llorens, J. Delineation of Management Zones in Hedgerow Almond Orchards Based on Vegetation Indices from UAV Images Validated by LiDAR-Derived Canopy Parameters. Agronomy 2022, 12, 102. [Google Scholar] [CrossRef]
- Torres-Sánchez, J.; De Castro, A.I.; Peña, J.M.; Jiménez-Brenes, F.M.; Arquero, O.; Lovera, M.; López-Granados, F. Mapping the 3D structure of almond trees using UAV acquired photogrammetric point clouds and object-based image analysis. Biosyst. Eng. 2018, 176, 172–184. [Google Scholar] [CrossRef]
- Zhao, T.; Doll, D.; Wang, D.; Chen, Y. A new framework for UAV-based remote sensing data processing and its application in almond water stress quantification. In Proceedings of the 2017 International Conference on Unmanned Aircraft Systems (ICUAS), Miami, FL, USA, 13–16 June 2017; pp. 1794–1799. [Google Scholar] [CrossRef]
- Ampatzidis, Y.; Partel, V. UAV-Based High Throughput Phenotyping in Citrus Utilizing Multispectral Imaging and Artificial Intelligence. Remote Sens. 2019, 11, 410. [Google Scholar] [CrossRef]
- Gonzalez-Dugo, V.; Zarco-Tejada, P.; Fereres, E. Applicability and limitations of using the crop water stress index as an indicator of water deficits in citrus orchards. Agric. For. Meteorol. 2014, 198–199, 94–104. [Google Scholar] [CrossRef]
- Baluja, J.; Diago, M.P.; Balda, P.; Zorer, R.; Meggio, F.; Morales, F.; Tardaguila, J. Assessment of vineyard water status variability by thermal and multispectral imagery using an unmanned aerial vehicle (UAV). Irrig. Sci. 2012, 30, 511–522. [Google Scholar] [CrossRef]
- Bellvert, J.; Zarco-Tejada, P.J.; Girona, J.; Fereres, E. Mapping crop water stress index in a ‘Pinot-noir’ vineyard: Comparing ground measurements with thermal remote sensing imagery from an unmanned aerial vehicle. Precision Agric. 2014, 15, 361–376. [Google Scholar] [CrossRef]
- Matese, A.; Baraldi, R.; Berton, A.; Cesaraccio, C.; Di Gennaro, S.; Duce, P.; Facini, O.; Mameli, M.; Piga, A.; Zaldei, A. Estimation of Water Stress in Grapevines Using Proximal and Remote Sensing Methods. Remote Sens. 2018, 10, 114. [Google Scholar] [CrossRef]
- Albetis, J.; Jacquin, A.; Goulard, M.; Poilvé, H.; Rousseau, J.; Clenet, H.; Dedieu, G.; Duthoit, S. On the Potentiality of UAV Multispectral Imagery to Detect Flavescence dorée and Grapevine Trunk Diseases. Remote Sens. 2019, 11, 23. [Google Scholar] [CrossRef]
- Lobitz, B.; Johnson, L.; Hlavka, C.; Armstrong, R.; Bell, C. Grapevine Remote Sensing Analysis of Phylloxera Early Stress (GRAPES): Remote Sensing Analysis Summary; Technical Report; NASA: Washington, DC, USA, 1997. [Google Scholar]
- MacDonald, S.L.; Staid, M.; Staid, M.; Cooper, M.L. Remote hyperspectral imaging of grapevine leafroll-associated virus 3 in cabernet sauvignon vineyards. Comput. Electron. Agric. 2016, 130, 109–117. [Google Scholar] [CrossRef]
- Al-Saddik, H.; Laybros, A.; Billiot, B.; Cointault, F. Using image texture and spectral reflectance analysis to detect Yellowness and Esca in grapevines at leaf-level. Remote Sens. 2018, 10, 618. [Google Scholar] [CrossRef]
- Pagay, V.; Kidman, C.M. Evaluating Remotely-Sensed Grapevine (Vitis vinifera L.) Water Stress Responses Across a Viticultural Region. Agronomy 2019, 9, 682. [Google Scholar] [CrossRef]
- Singh, A.P.; Yerudkar, A.; Mariani, V.; Iannelli, L.; Glielmo, L. A Bibliometric Review of the Use of Unmanned Aerial Vehicles in Precision Agriculture and Precision Viticulture for Sensing Applications. Remote Sens. 2022, 14, 1604. [Google Scholar] [CrossRef]
- Gautam, D.; Ostendorf, B.; Pagay, V. Estimation of Grapevine Crop Coefficient Using a Multispectral Camera on an Unmanned Aerial Vehicle. Remote Sens. 2021, 13, 2639. [Google Scholar] [CrossRef]
- Giovos, R.; Tassopoulos, D.; Kalivas, D.; Lougkos, N.; Priovolou, A. Remote Sensing Vegetation Indices in Viticulture: A Critical Review. Agriculture 2021, 11, 457. [Google Scholar] [CrossRef]
- Matese, A.; Di Gennaro, S.F. Beyond the traditional NDVI index as a key factor to mainstream the use of UAV in precision viticulture. Sci. Rep. 2021, 11, 2721. [Google Scholar] [CrossRef]
- Spachos, P. Towards a Low-Cost Precision Viticulture System Using Internet of Things Devices. IoT 2020, 1, 5–20. [Google Scholar] [CrossRef]
- Viani, F.; Bertolli, M.; Salucci, M.; Polo, A. Low-Cost Wireless Monitoring and Decision Support for Water Saving in Agriculture. IEEE Sens. J. 2017, 17, 4299–4309. [Google Scholar] [CrossRef]
- Scholander, P.F.; Bradstreet, E.D.; Hemmingsen, E.A.; Hammel, H.T. Sap Pressure in Vascular Plants. Science 1965, 148, 339–346. [Google Scholar] [CrossRef] [PubMed]
- Rouse, J.W., Jr.; Haas, R.H.; Schell, J.A.; Deering, D.W. Monitoring Vegetation Systems in the Great Plains with Erts. NASA Spec. Publ. 1974, 351, 309. [Google Scholar]
- Gitelson, A.A.; Kaufman, Y.J.; Merzlyak, M.N. Use of a Green Channel in Remote Sensing of Global Vegetation from EOS-MODIS. Remote Sens. Environ. 1996, 58, 289–298. [Google Scholar] [CrossRef]
- Gamon, J.A.; Surfus, J.S. Assessing leaf pigment content and activity with a reflectometer. New Phytol. 1999, 143, 105–117. [Google Scholar] [CrossRef]
- Gitelson, A.A.; Kaufman, Y.J.; Rundquist, D.C.; Stark, R. Novel algorithms for remote estimation of vegetation fraction. Remote Sens. Environ. 2002, 80, 76–87. [Google Scholar] [CrossRef]
- Gitelson, A.A.; Viña, A.; Arkebauer, T.J.; Rundquist, D.C.; Keydan, G.; Leavitt, B. Remote estimation of leaf area index and green leaf biomass in maize canopies. Geophys. Res. Lett. 2003, 30. [Google Scholar] [CrossRef]
- Louhaichi, M.; Borman, M.M.; Johnson, D.E. Spatially Located Platform and Aerial Photography for Documentation of Grazing Impacts on Wheat. Geocarto Int. 2001, 16, 65–70. [Google Scholar] [CrossRef]
- Hunt, E., Jr.; Rock, B. Detection of changes in leaf water content using Near- and Middle-Infrared reflectances. Remote Sens. Environ. 1989, 30, 43–54. [Google Scholar] [CrossRef]
- Ledderhof, D.; Brown, R.; Reynolds, A.; Jollineau, M. Using remote sensing to understand Pinot noir vineyard variability in Ontario. Can. J. Plant Sci. 2016, 96, 89–108. [Google Scholar] [CrossRef]
- Di Gennaro, S.F.; Toscano, P.; Gatti, M.; Poni, S.; Berton, A.; Matese, A. Spectral Comparison of UAV-Based Hyper and Multispectral Cameras for Precision Viticulture. Remote Sens. 2022, 14, 449. [Google Scholar] [CrossRef]
- Stow, D.; Nichol, C.J.; Wade, T.; Assmann, J.J.; Simpson, G.; Helfter, C. Illumination geometry and flying height influence surface reflectance and NDVI derived from multispectral UAS imagery. Drones 2019, 3, 55. [Google Scholar] [CrossRef]
- Mamaghani, B.; Salvaggio, C. Multispectral sensor calibration and characterization for sUAS remote sensing. Sensors 2019, 19, 4453. [Google Scholar] [CrossRef] [PubMed]
- Sharma, M.; Bangotra, P.; Gautam, A.S.; Gautam, S. Sensitivity of normalized difference vegetation index (NDVI) to land surface temperature, soil moisture and precipitation over district Gautam Buddh Nagar, UP, India. Stoch. Environ. Res. Risk Assess. Res. J. 2022, 36, 1779–1789. [Google Scholar] [CrossRef] [PubMed]

Disclaimer/Publisher’s Note: The statements, opinions and data contained in all publications are solely those of the individual author(s) and contributor(s) and not of MDPI and/or the editor(s). MDPI and/or the editor(s) disclaim responsibility for any injury to people or property resulting from any ideas, methods, instructions or products referred to in the content. |
© 2024 by the authors. Licensee MDPI, Basel, Switzerland. This article is an open access article distributed under the terms and conditions of the Creative Commons Attribution (CC BY) license (https://creativecommons.org/licenses/by/4.0/).