
Spatial and Temporal Variation Patterns of NO 5.3 µm Infrared Radiation during Two Consecutive Auroral Disturbances
 , , and
Abstract
: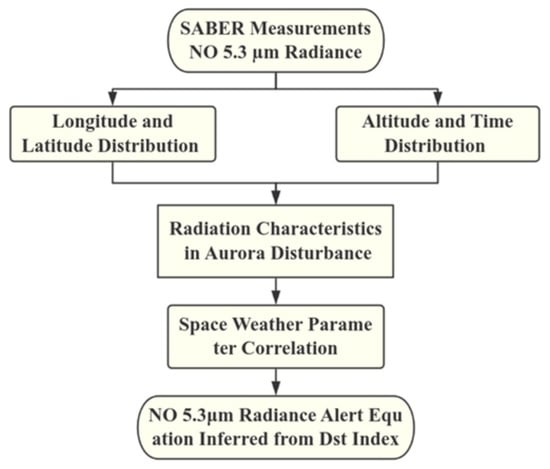
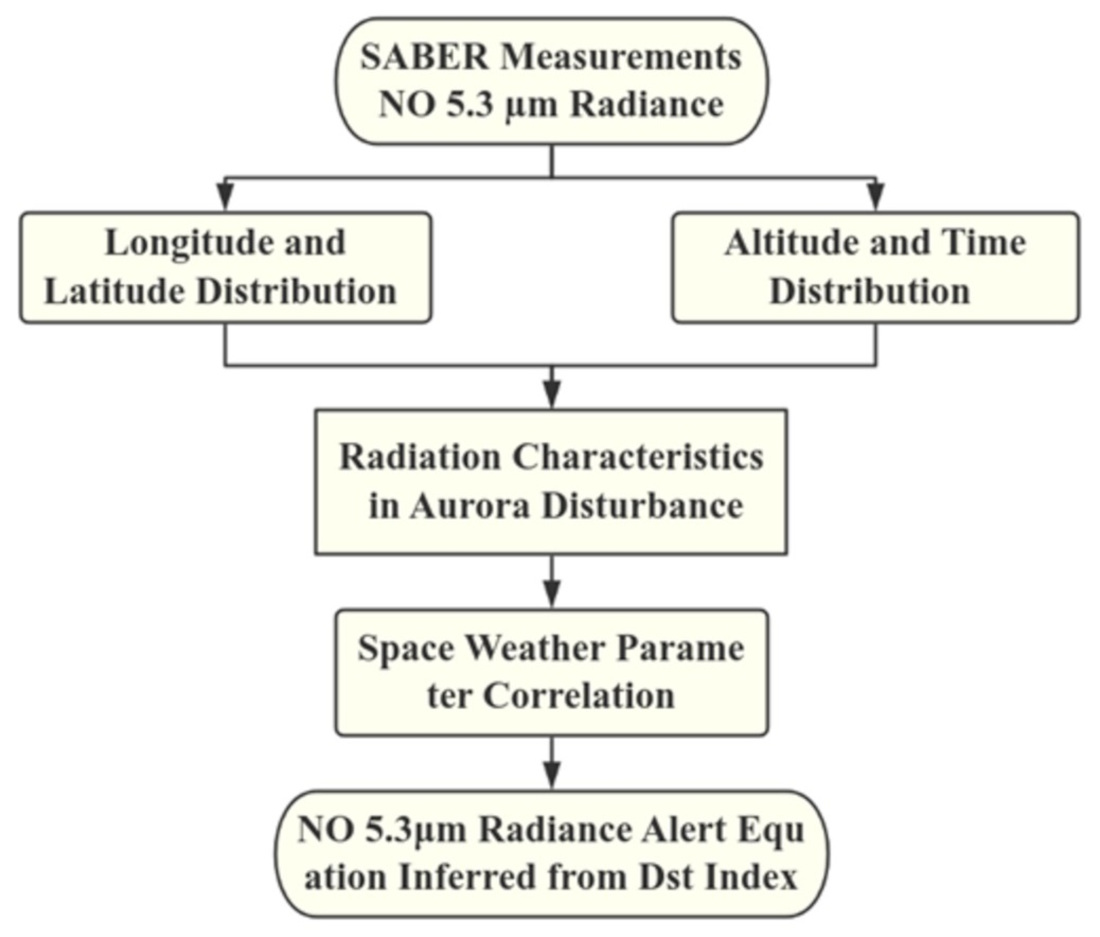
1. Introduction
2. Data Description
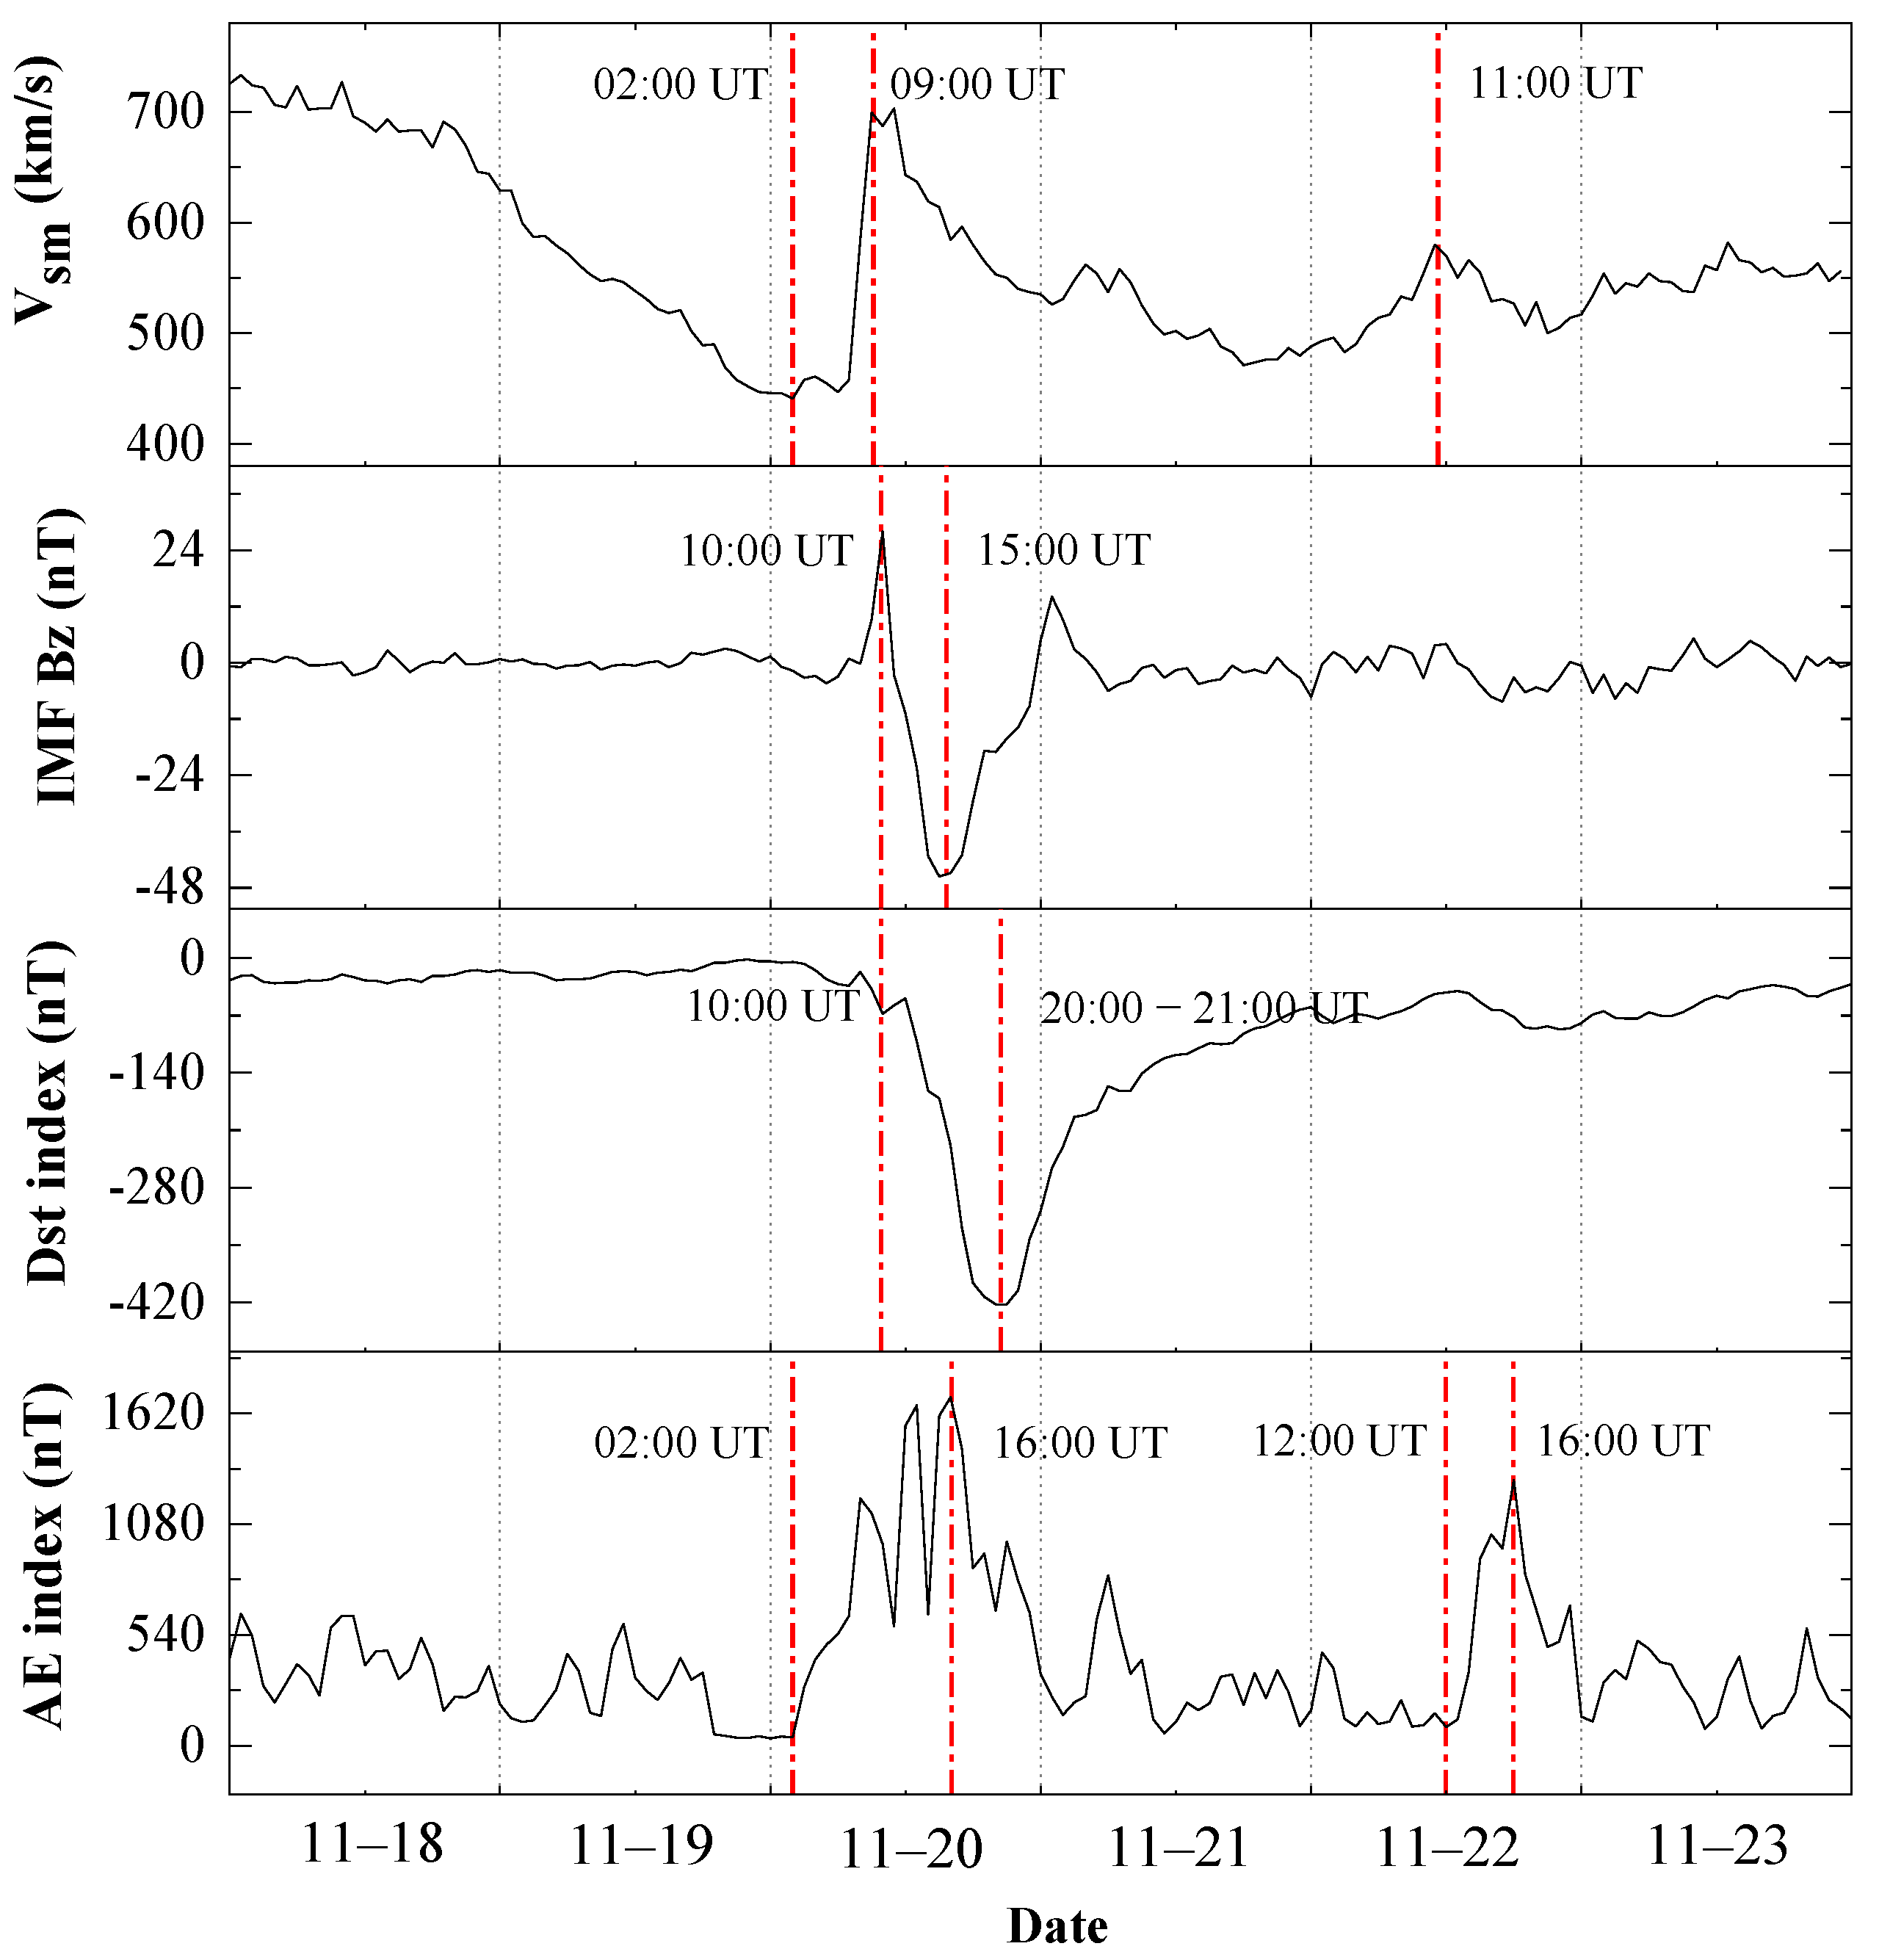
2.1. Solar–Terrestrial Space Environmental Parameters
2.2. Nitric Oxide Infrared Radiative Emission
3. Results
3.1. The Aurora Event during 18–23 November 2003
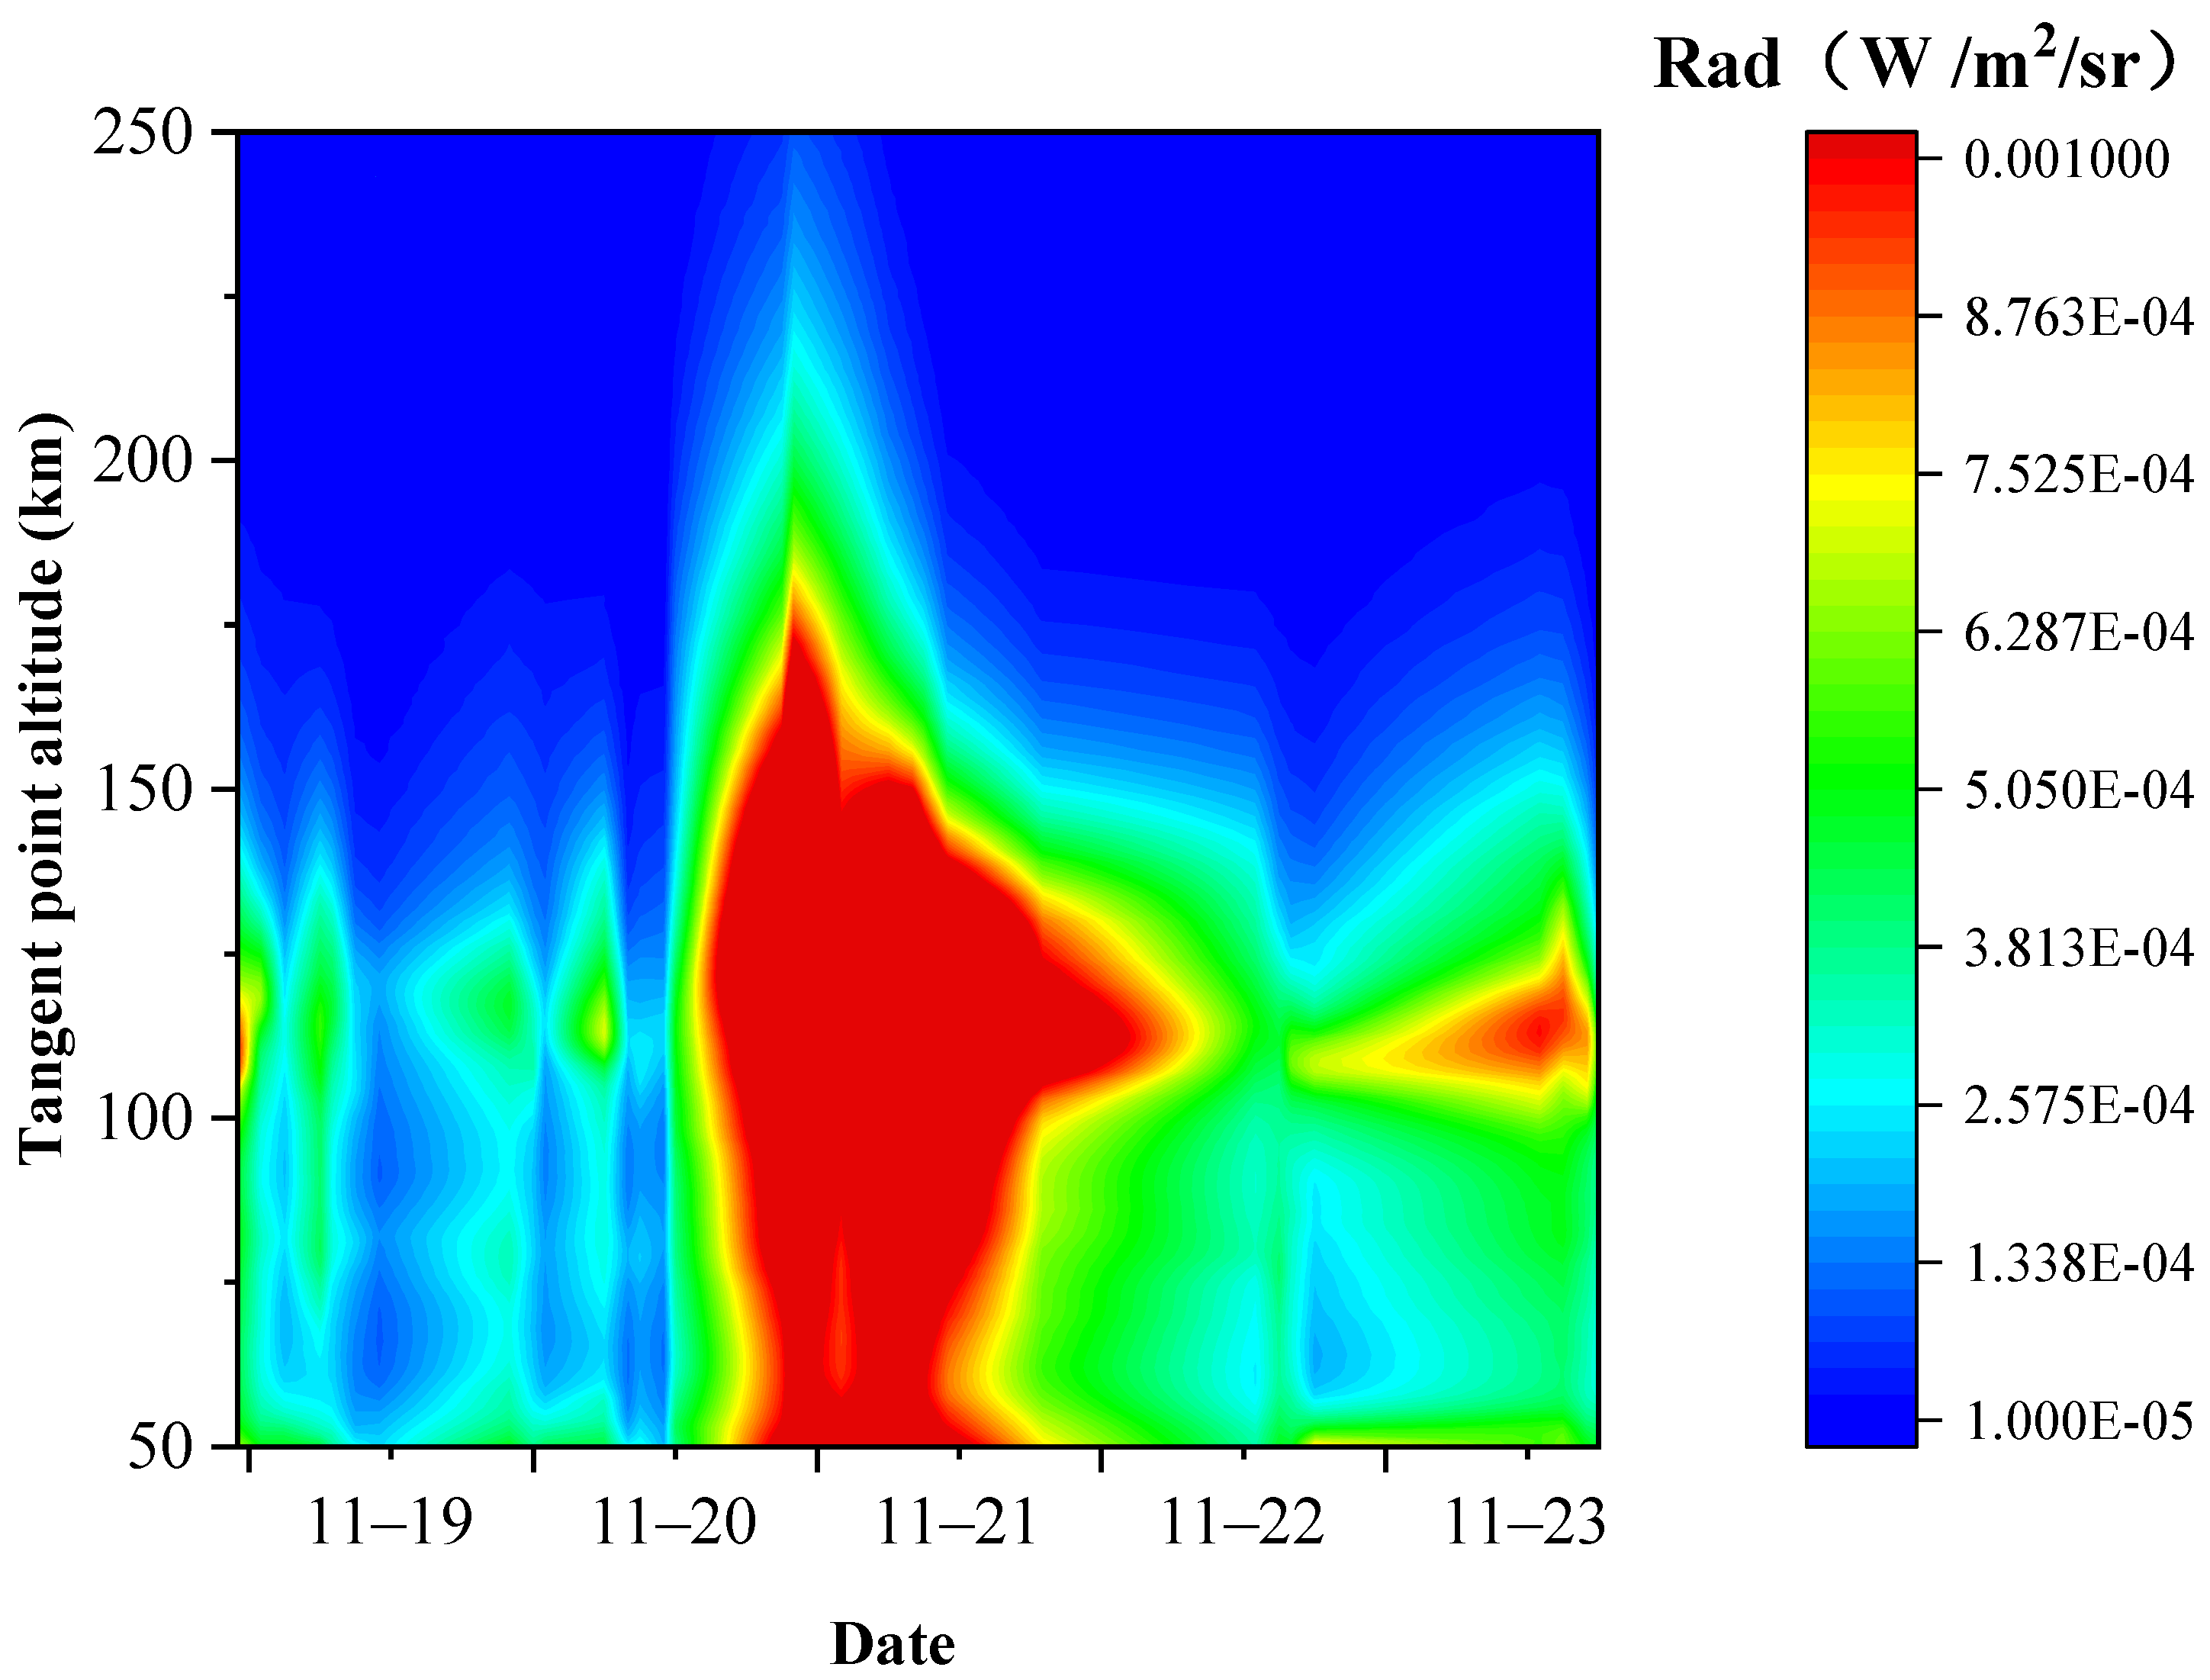
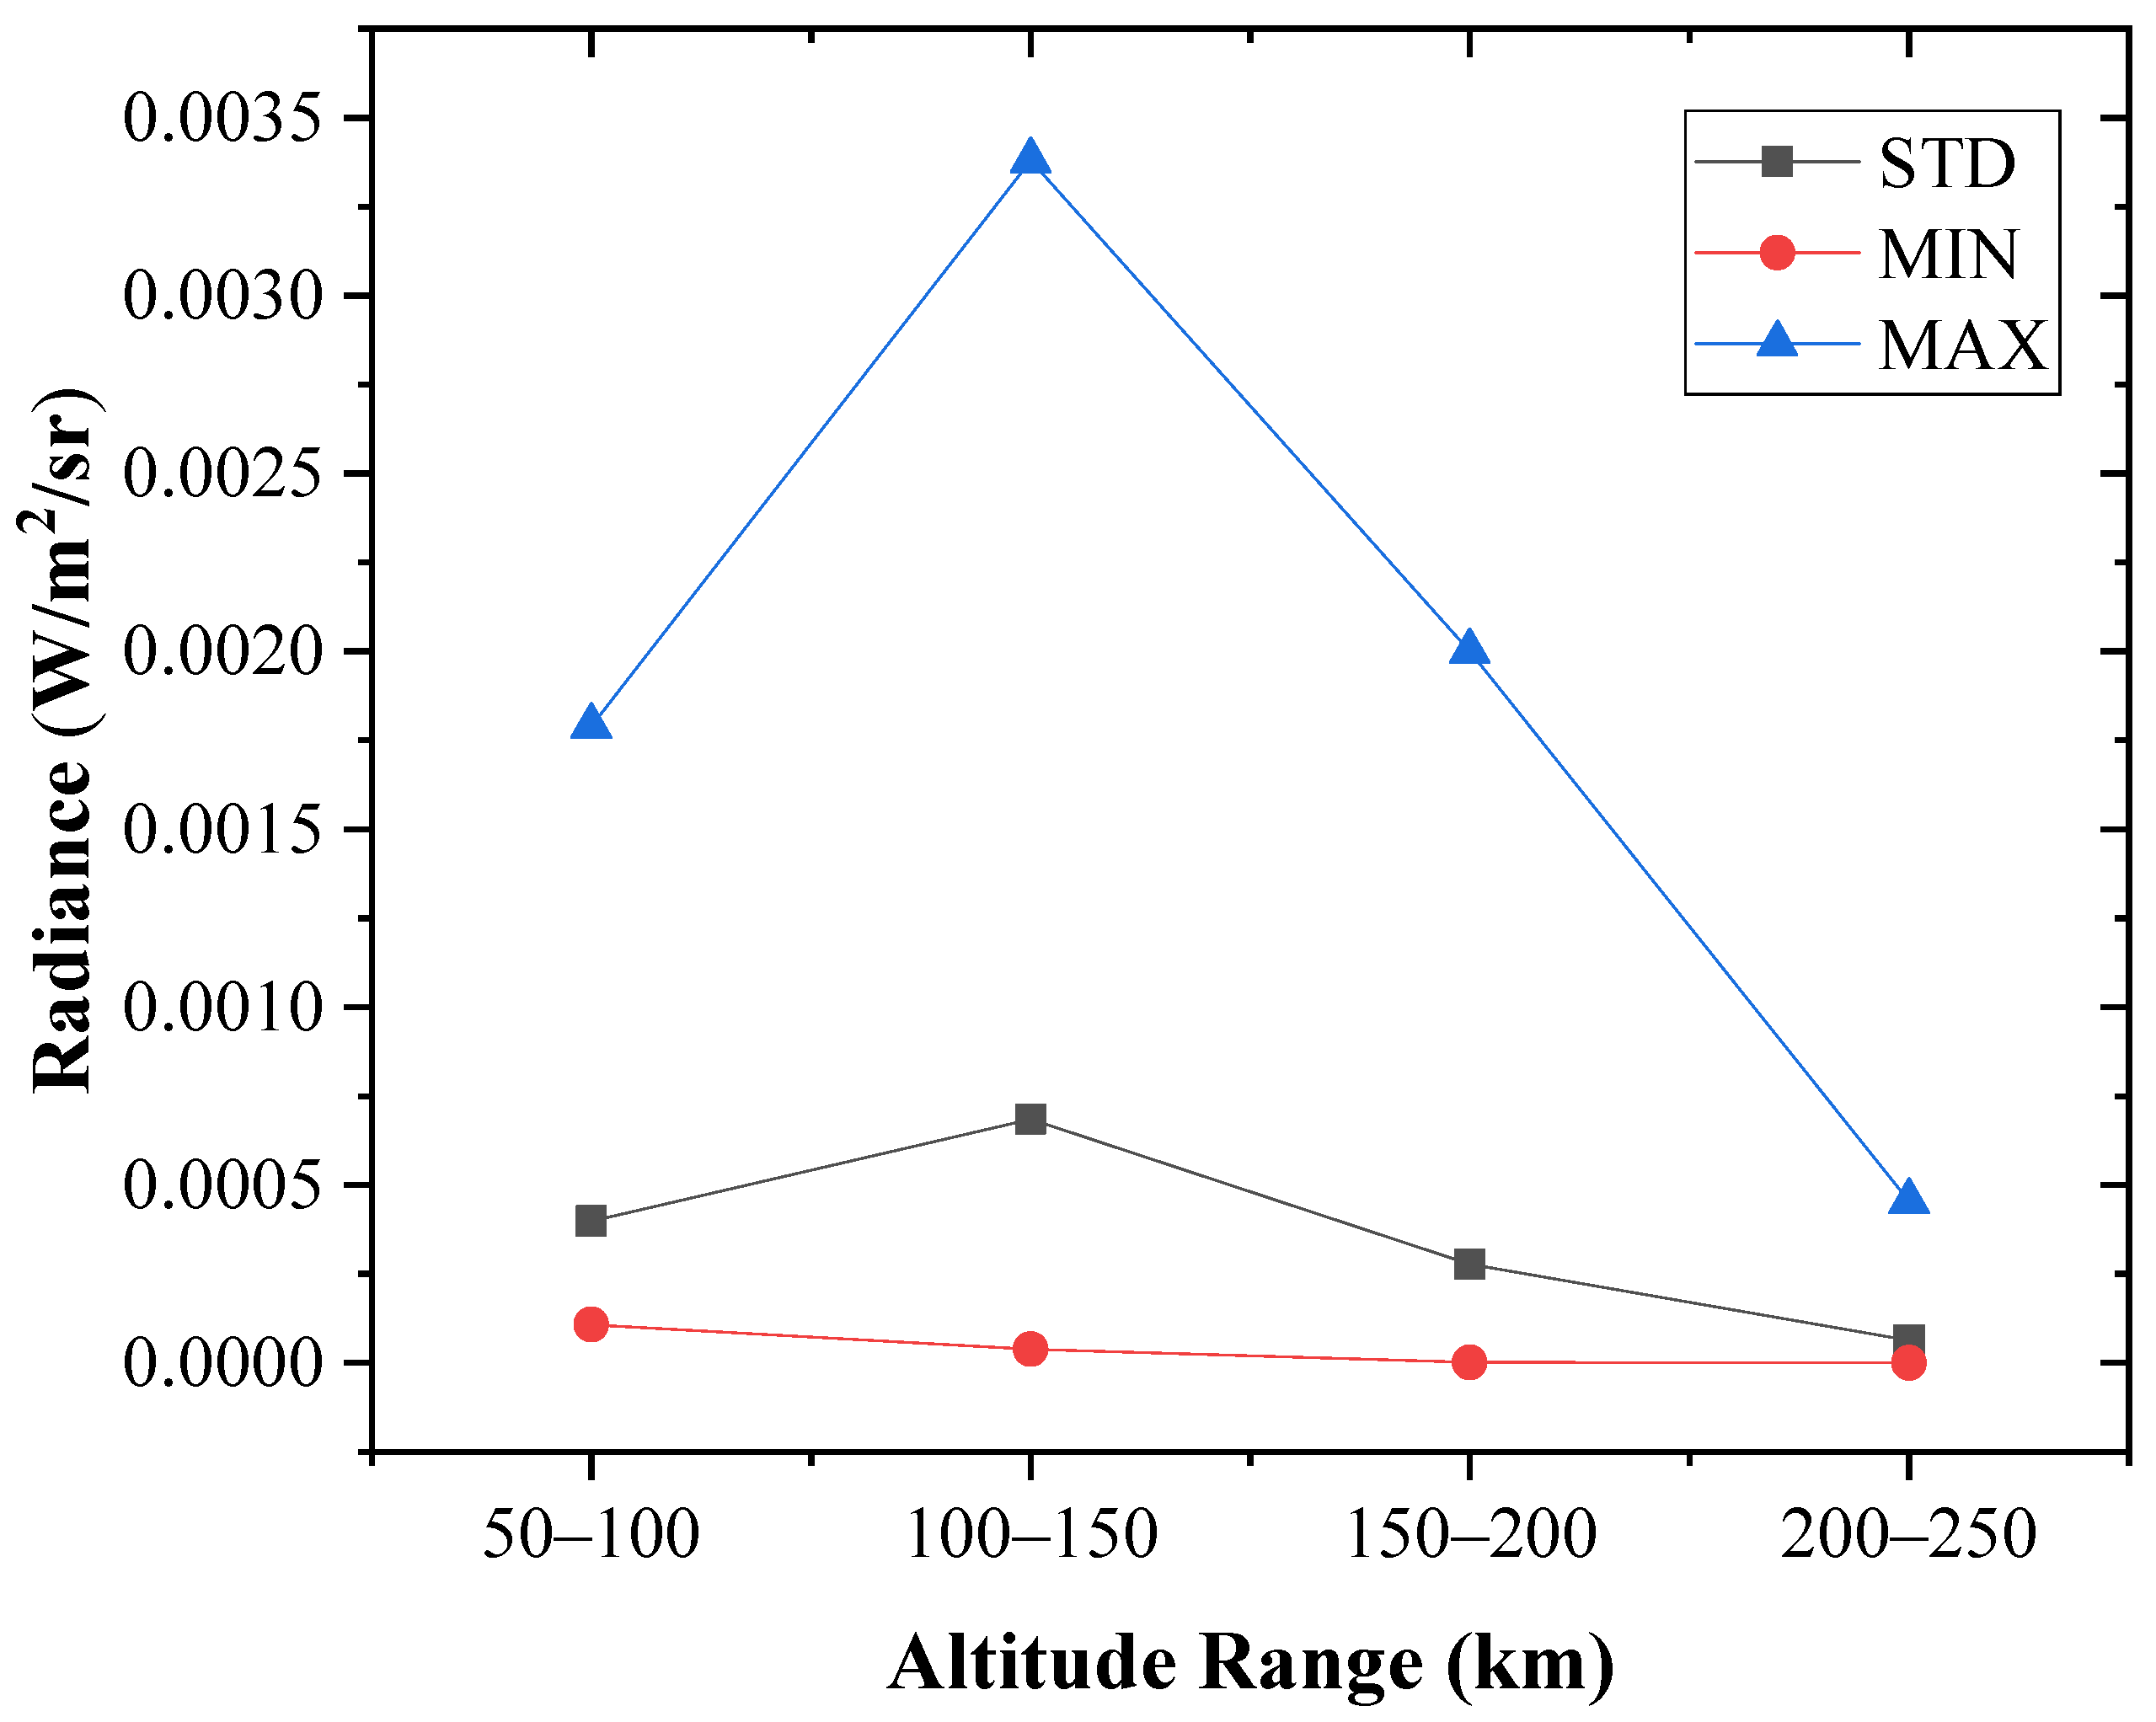
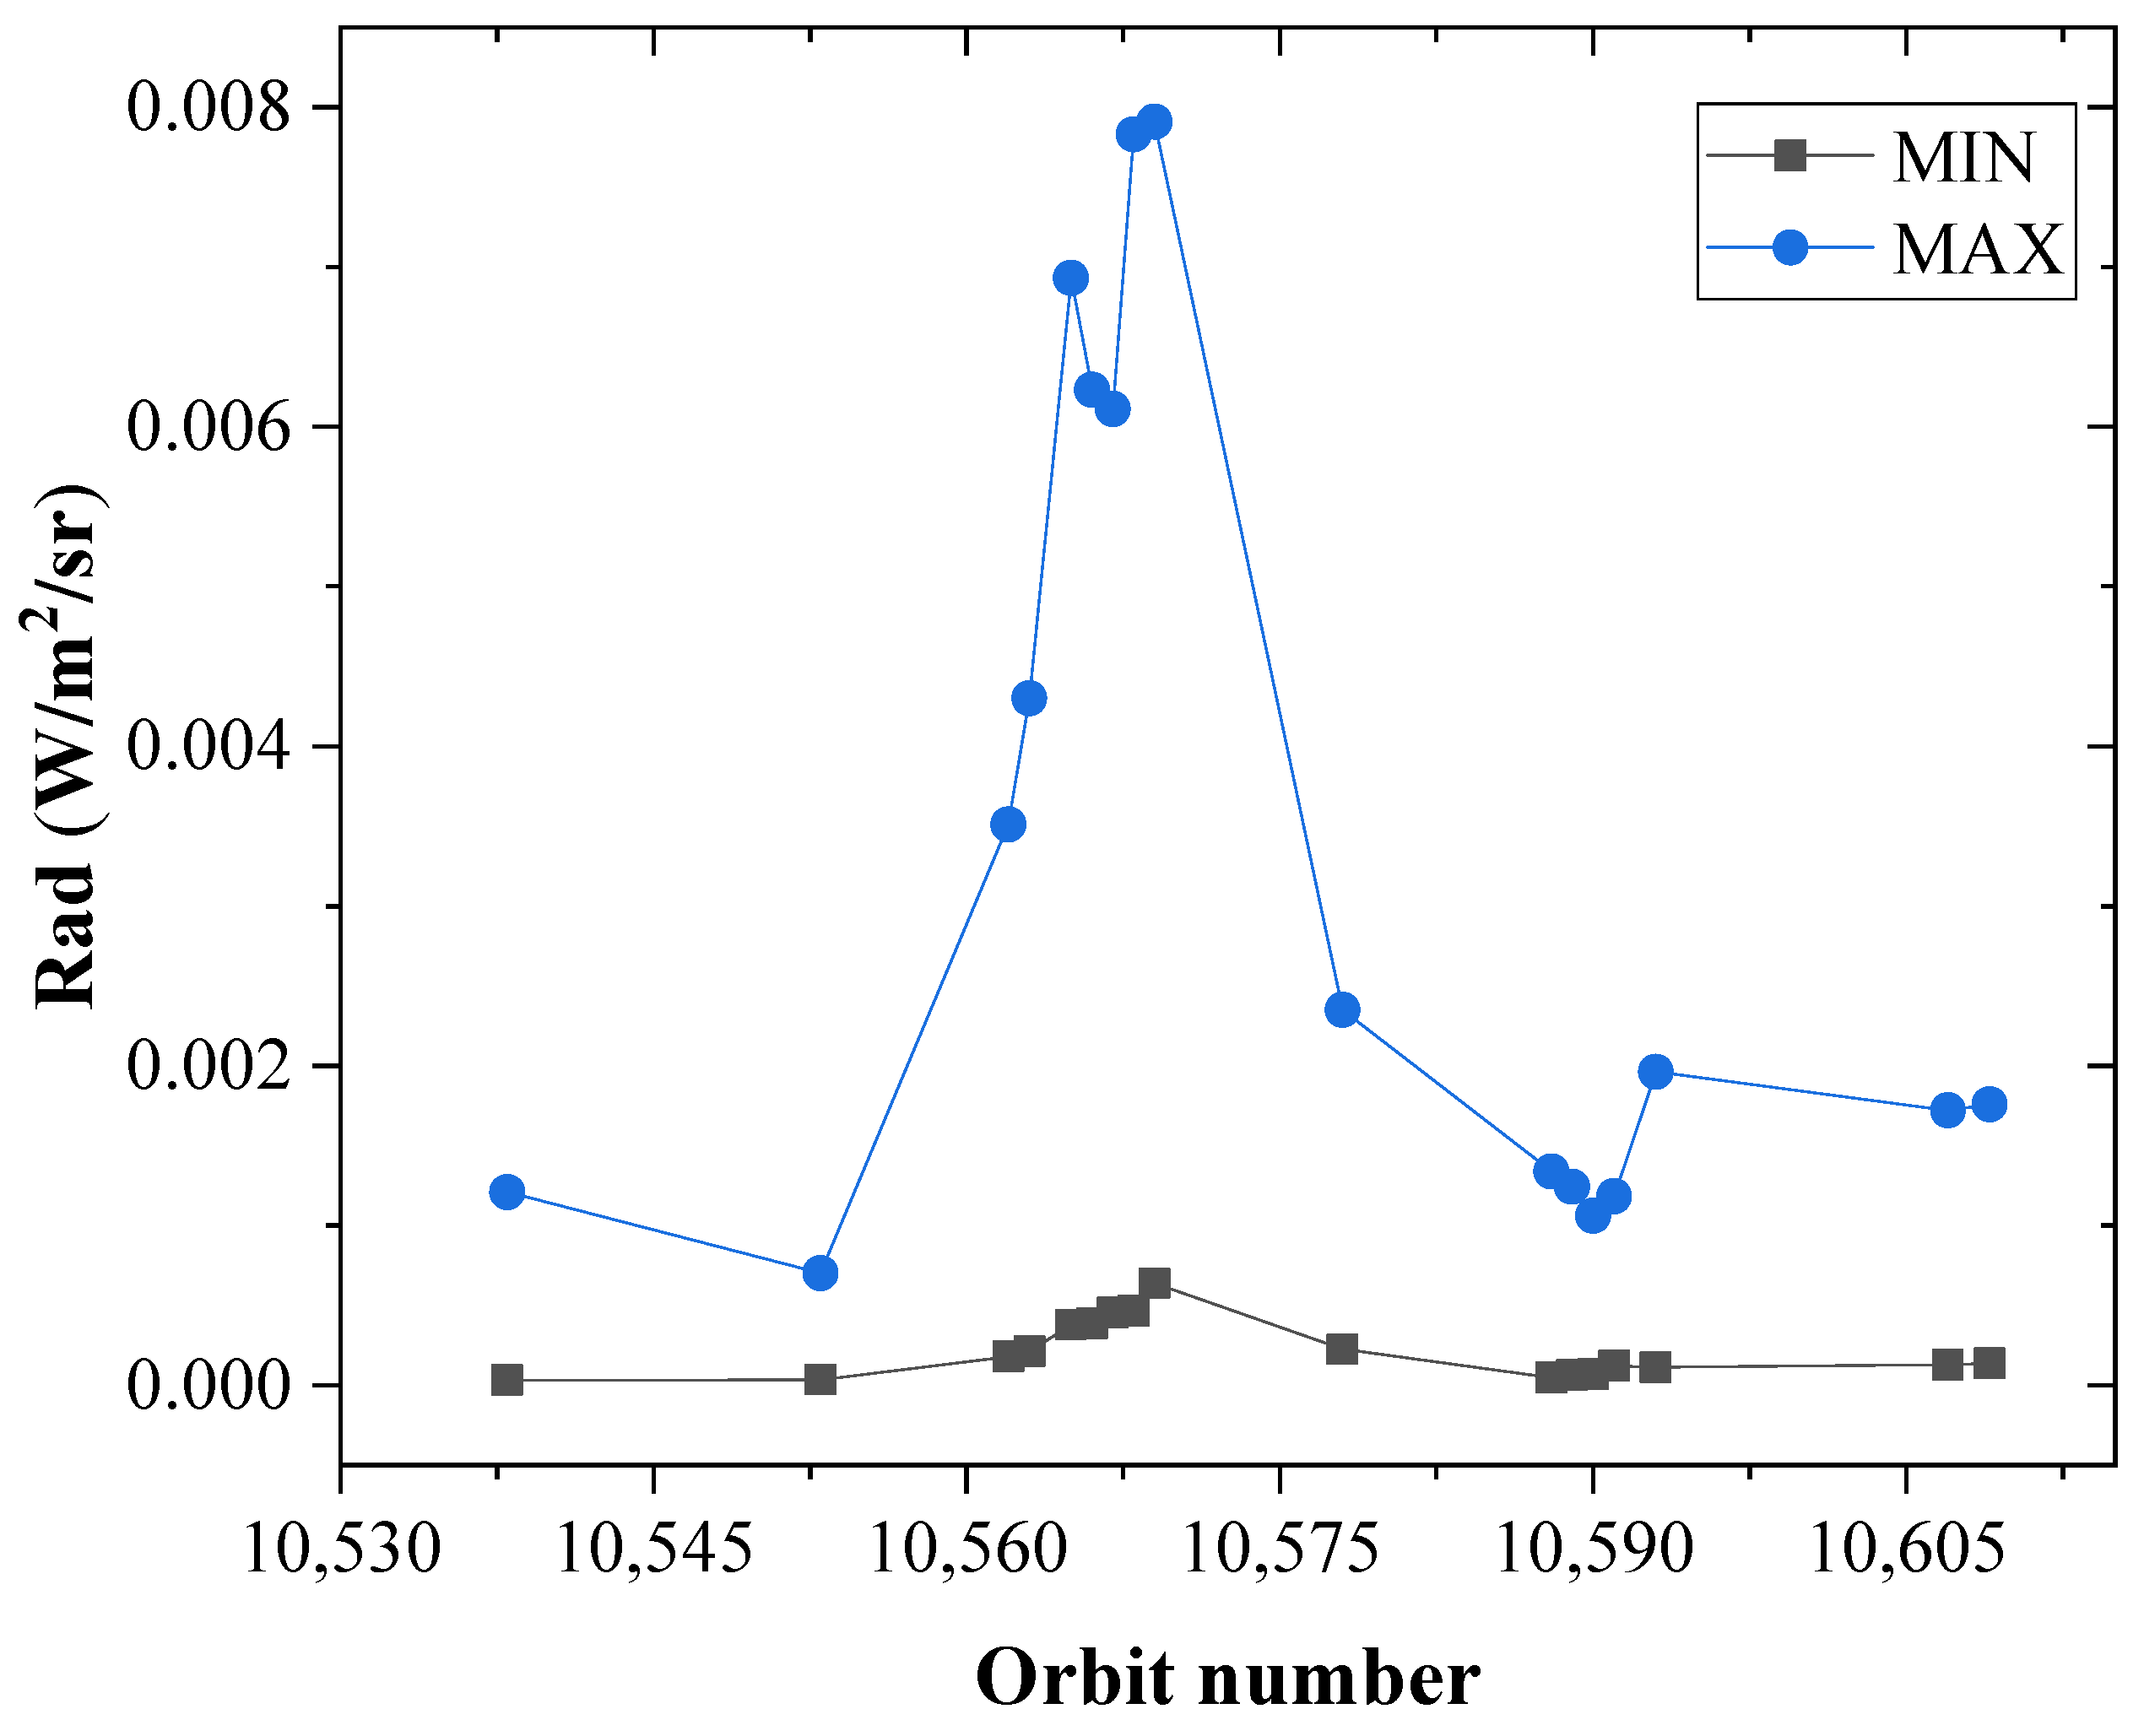
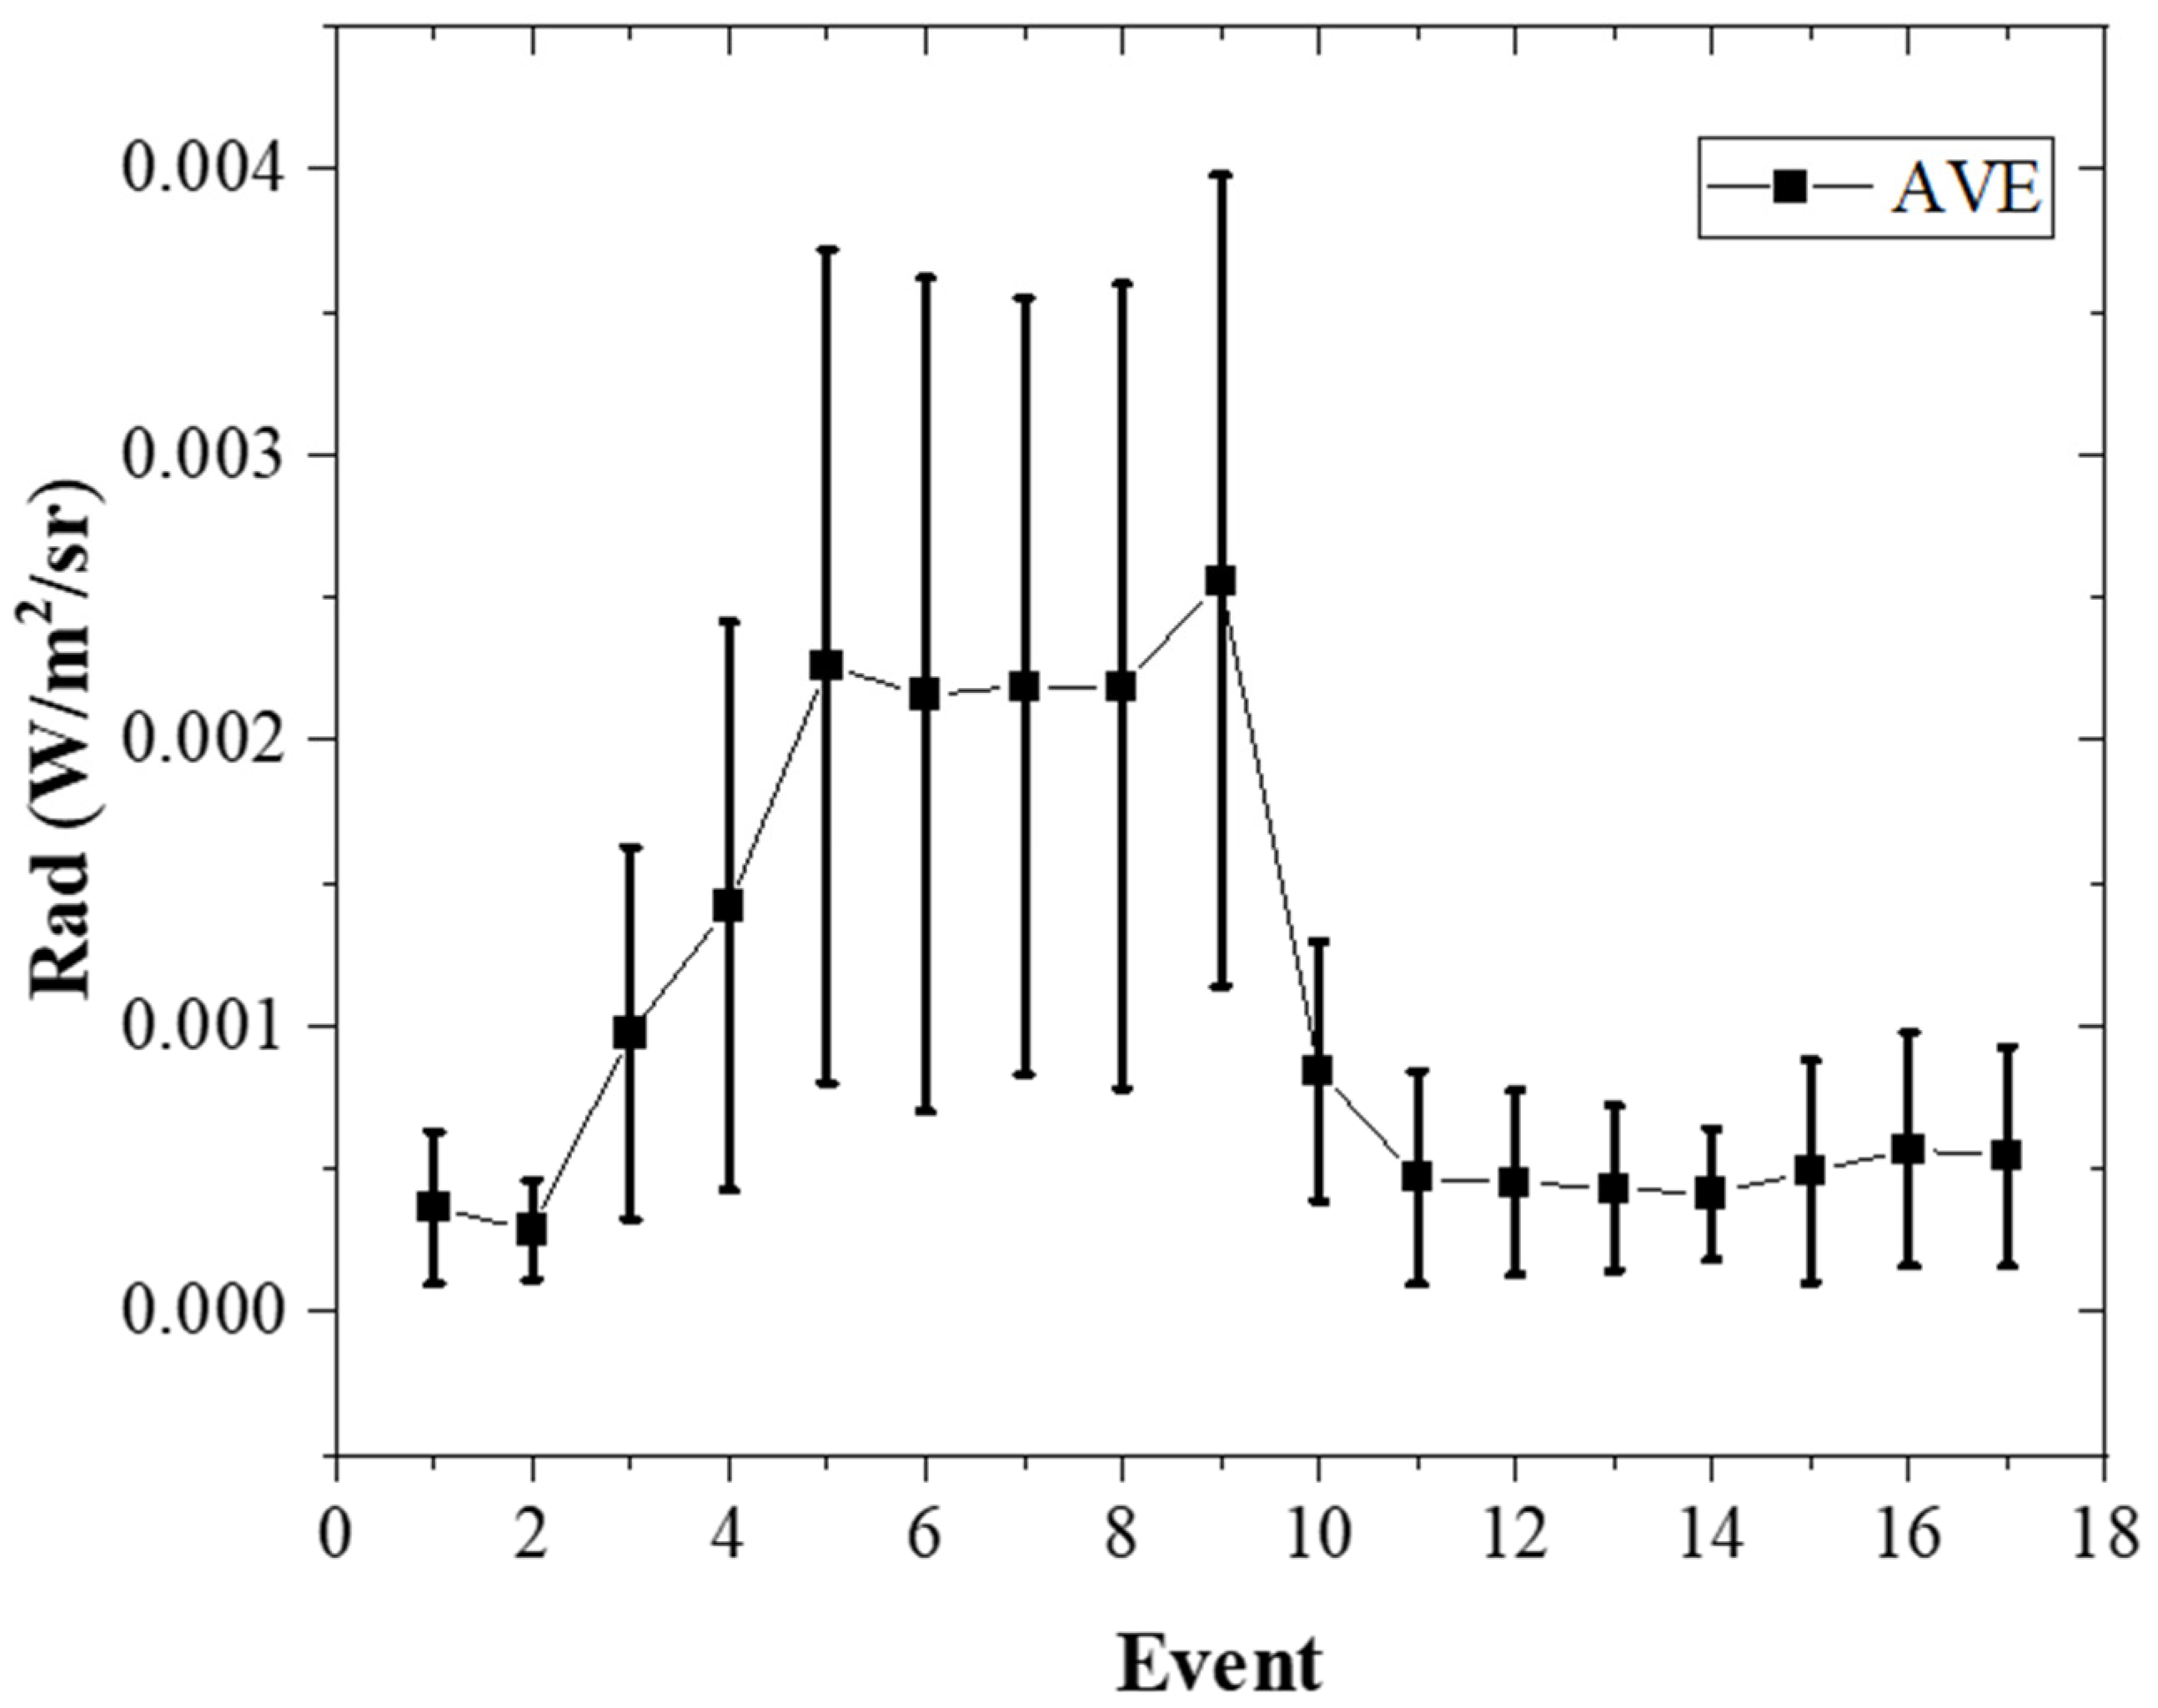
3.2. Variations in Infrared Radiance at NO 5.3 µm
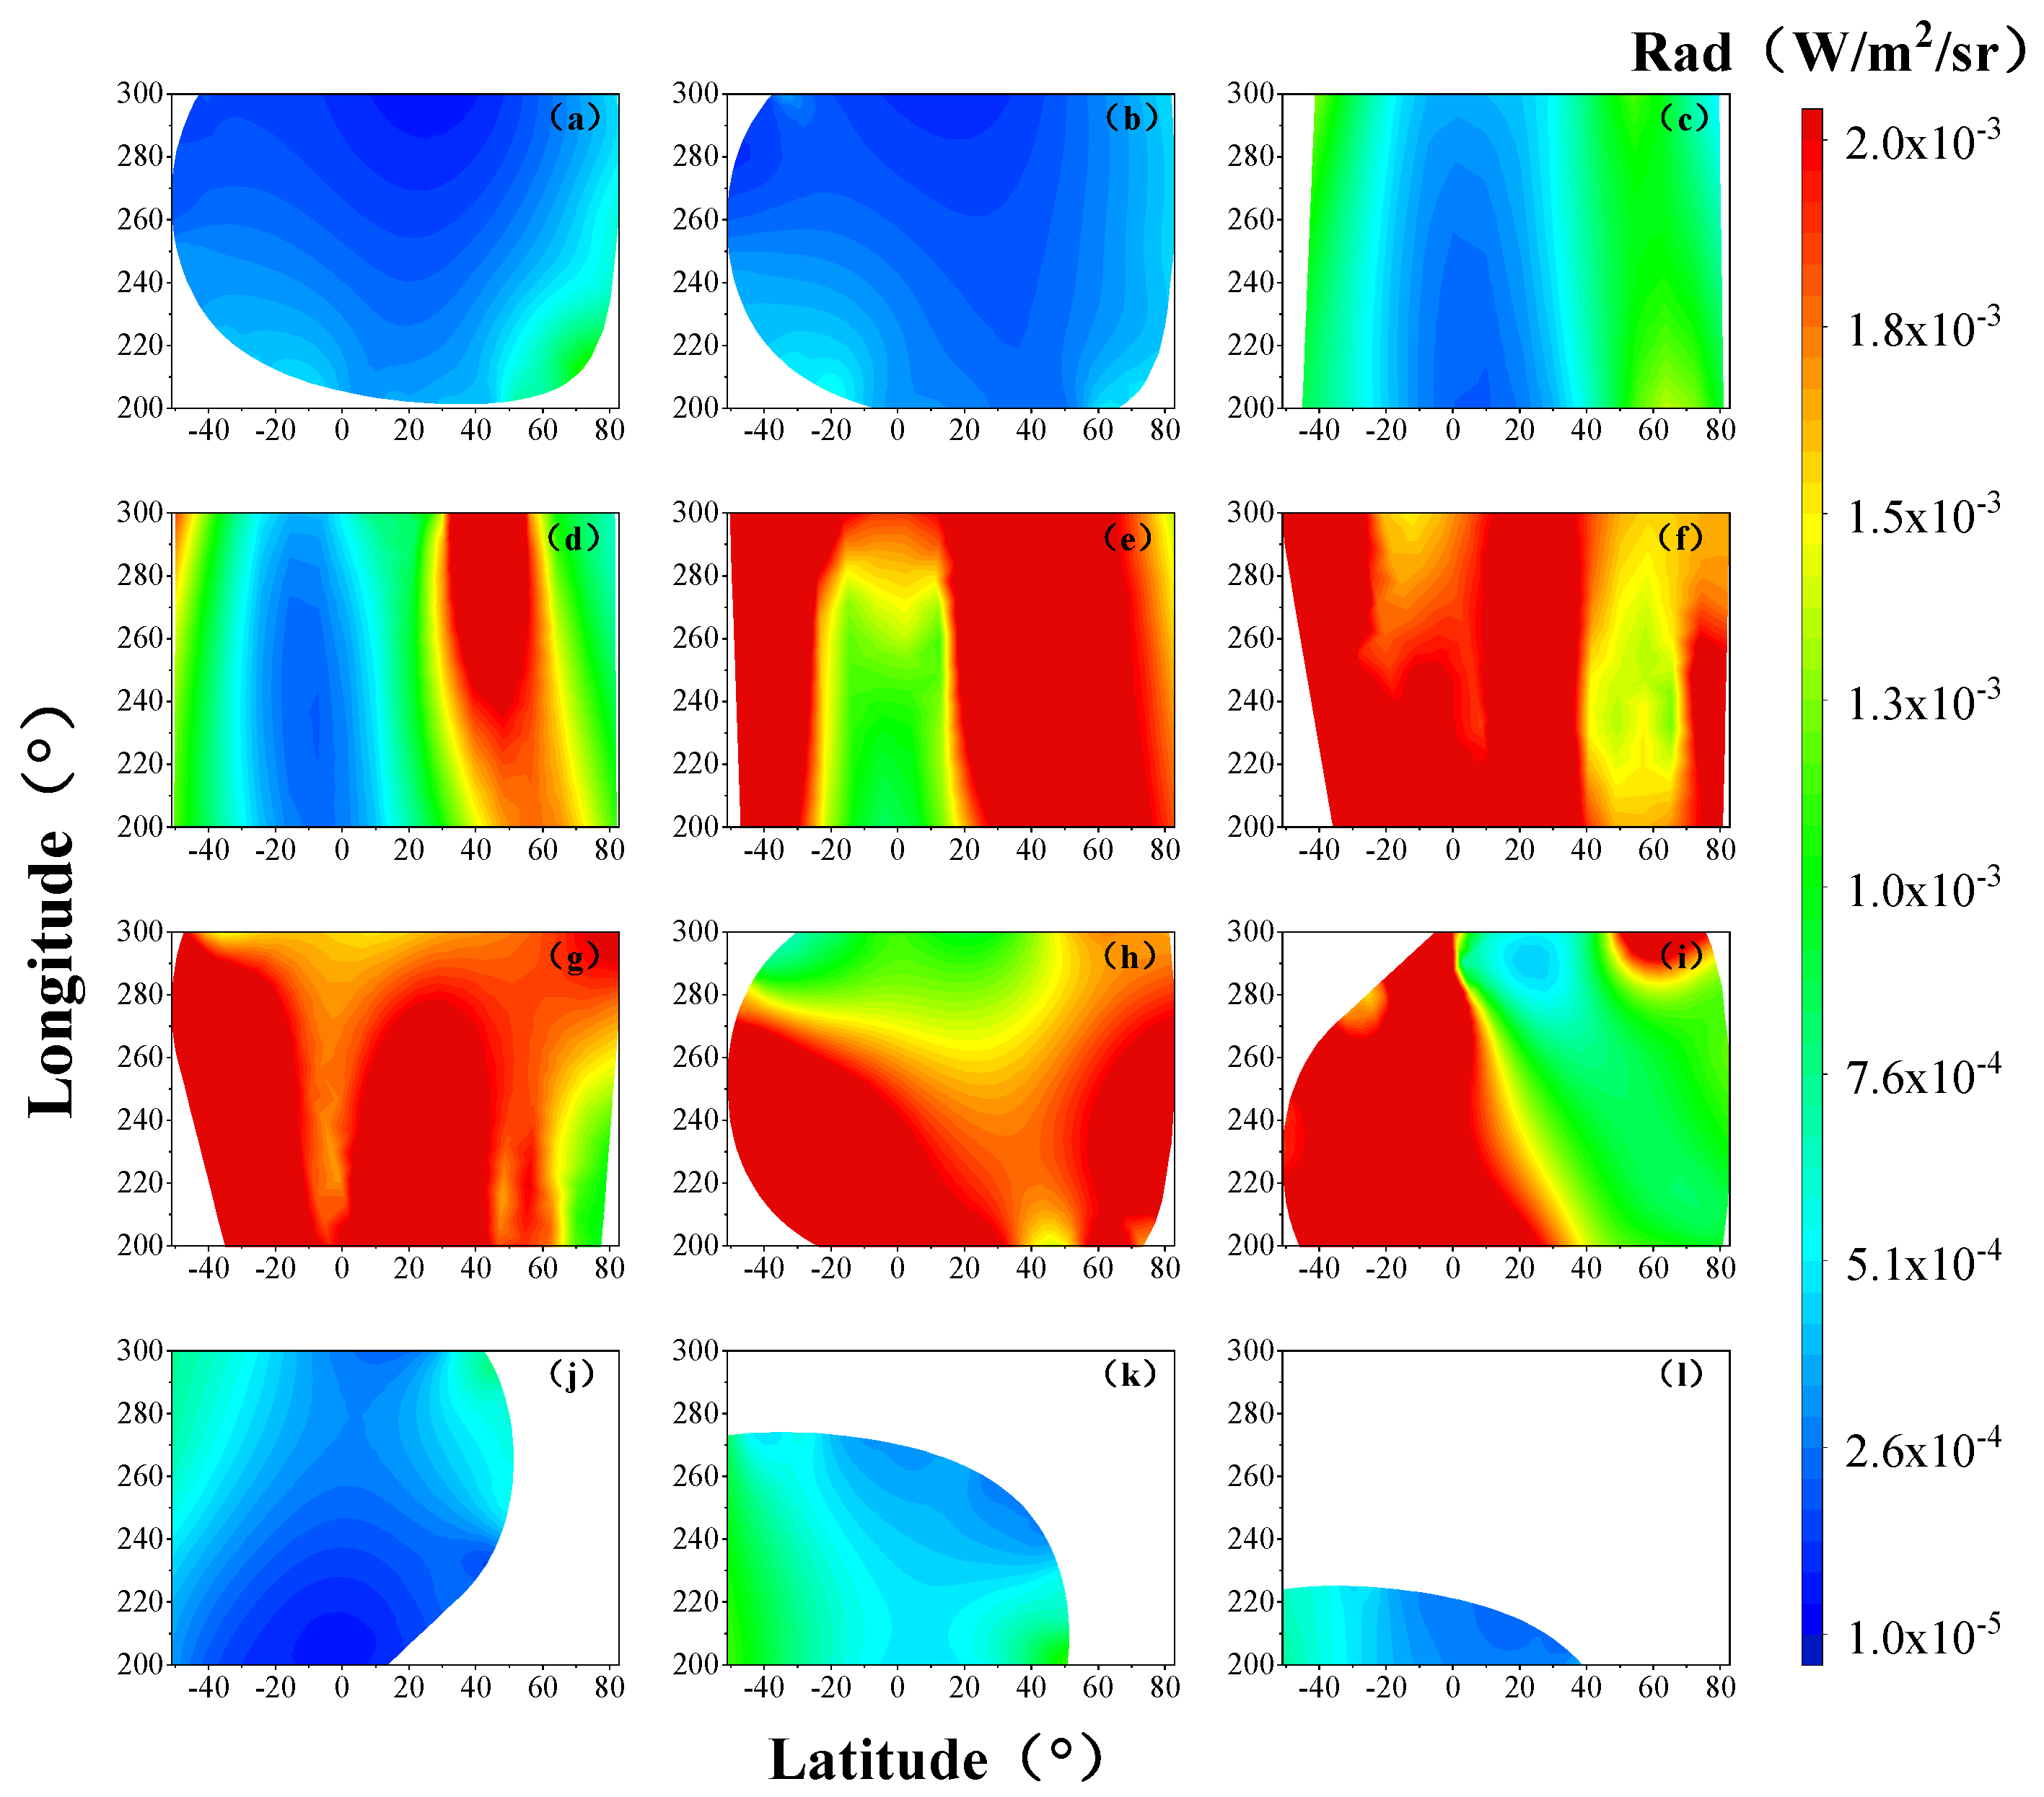
3.3. Longitudinal and Latitudinal Distribution Characteristics of NO 5.3 μm Limb Radiance Values at a 120 km Tangent Point Height
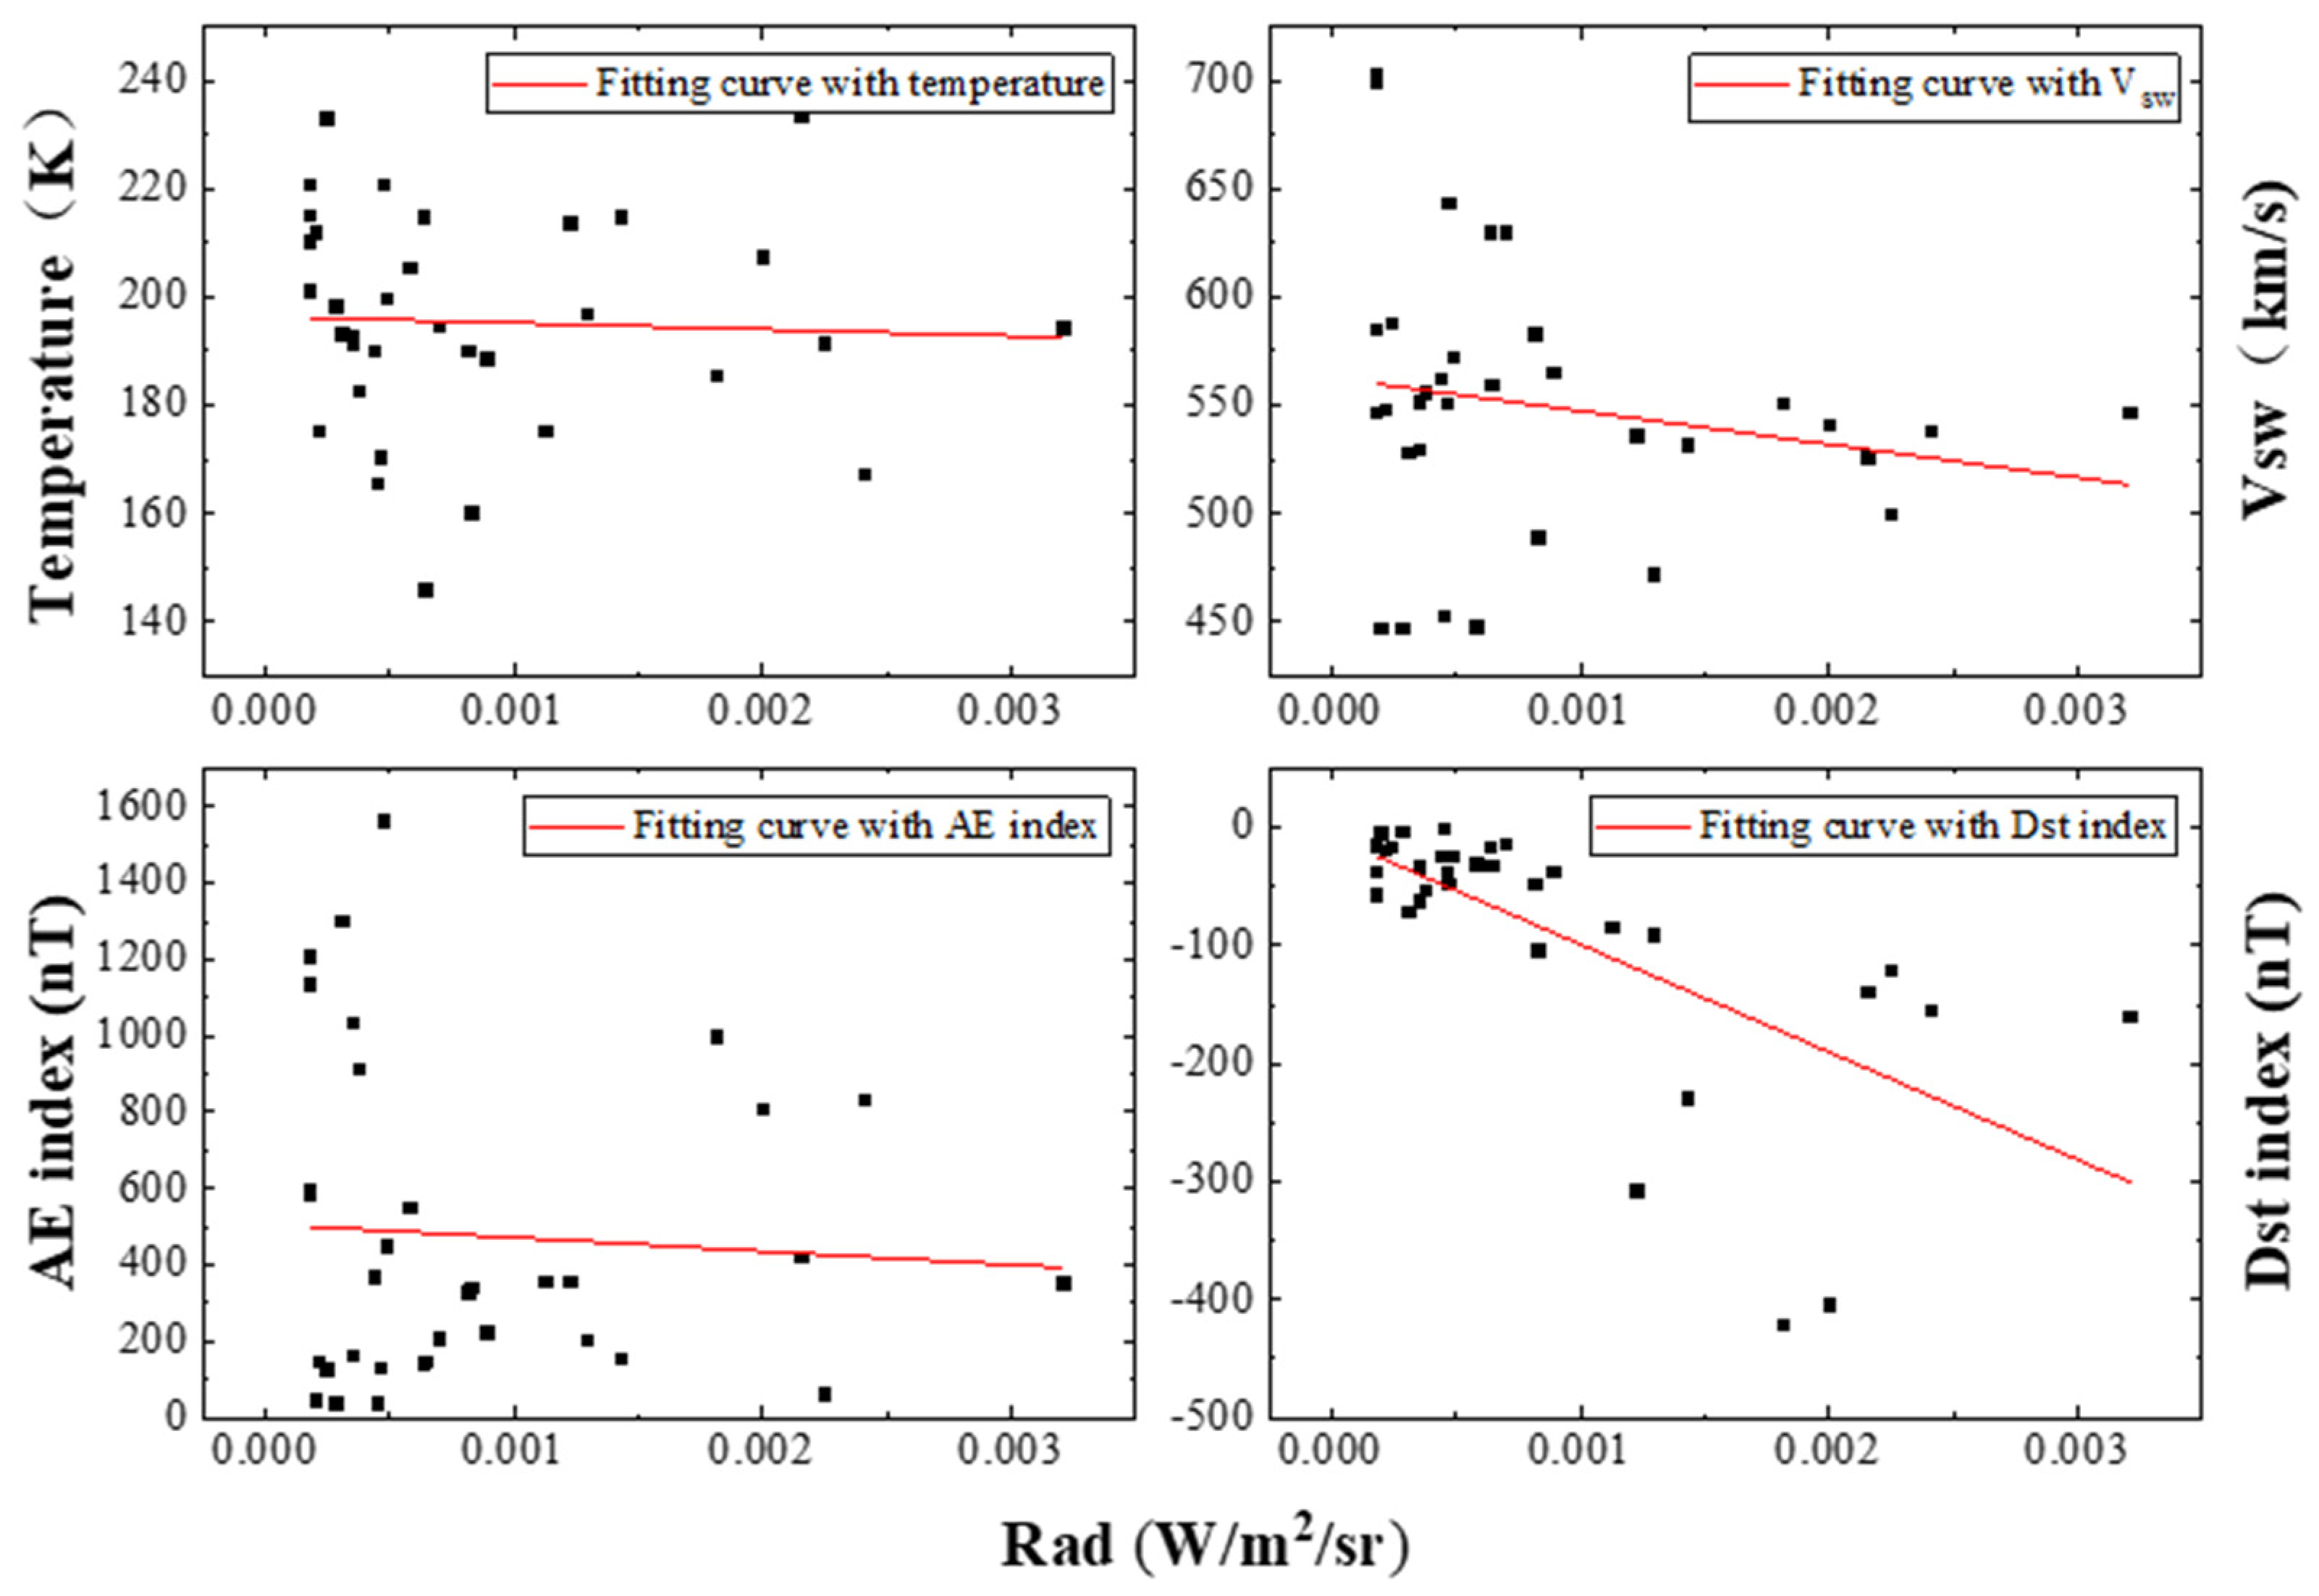
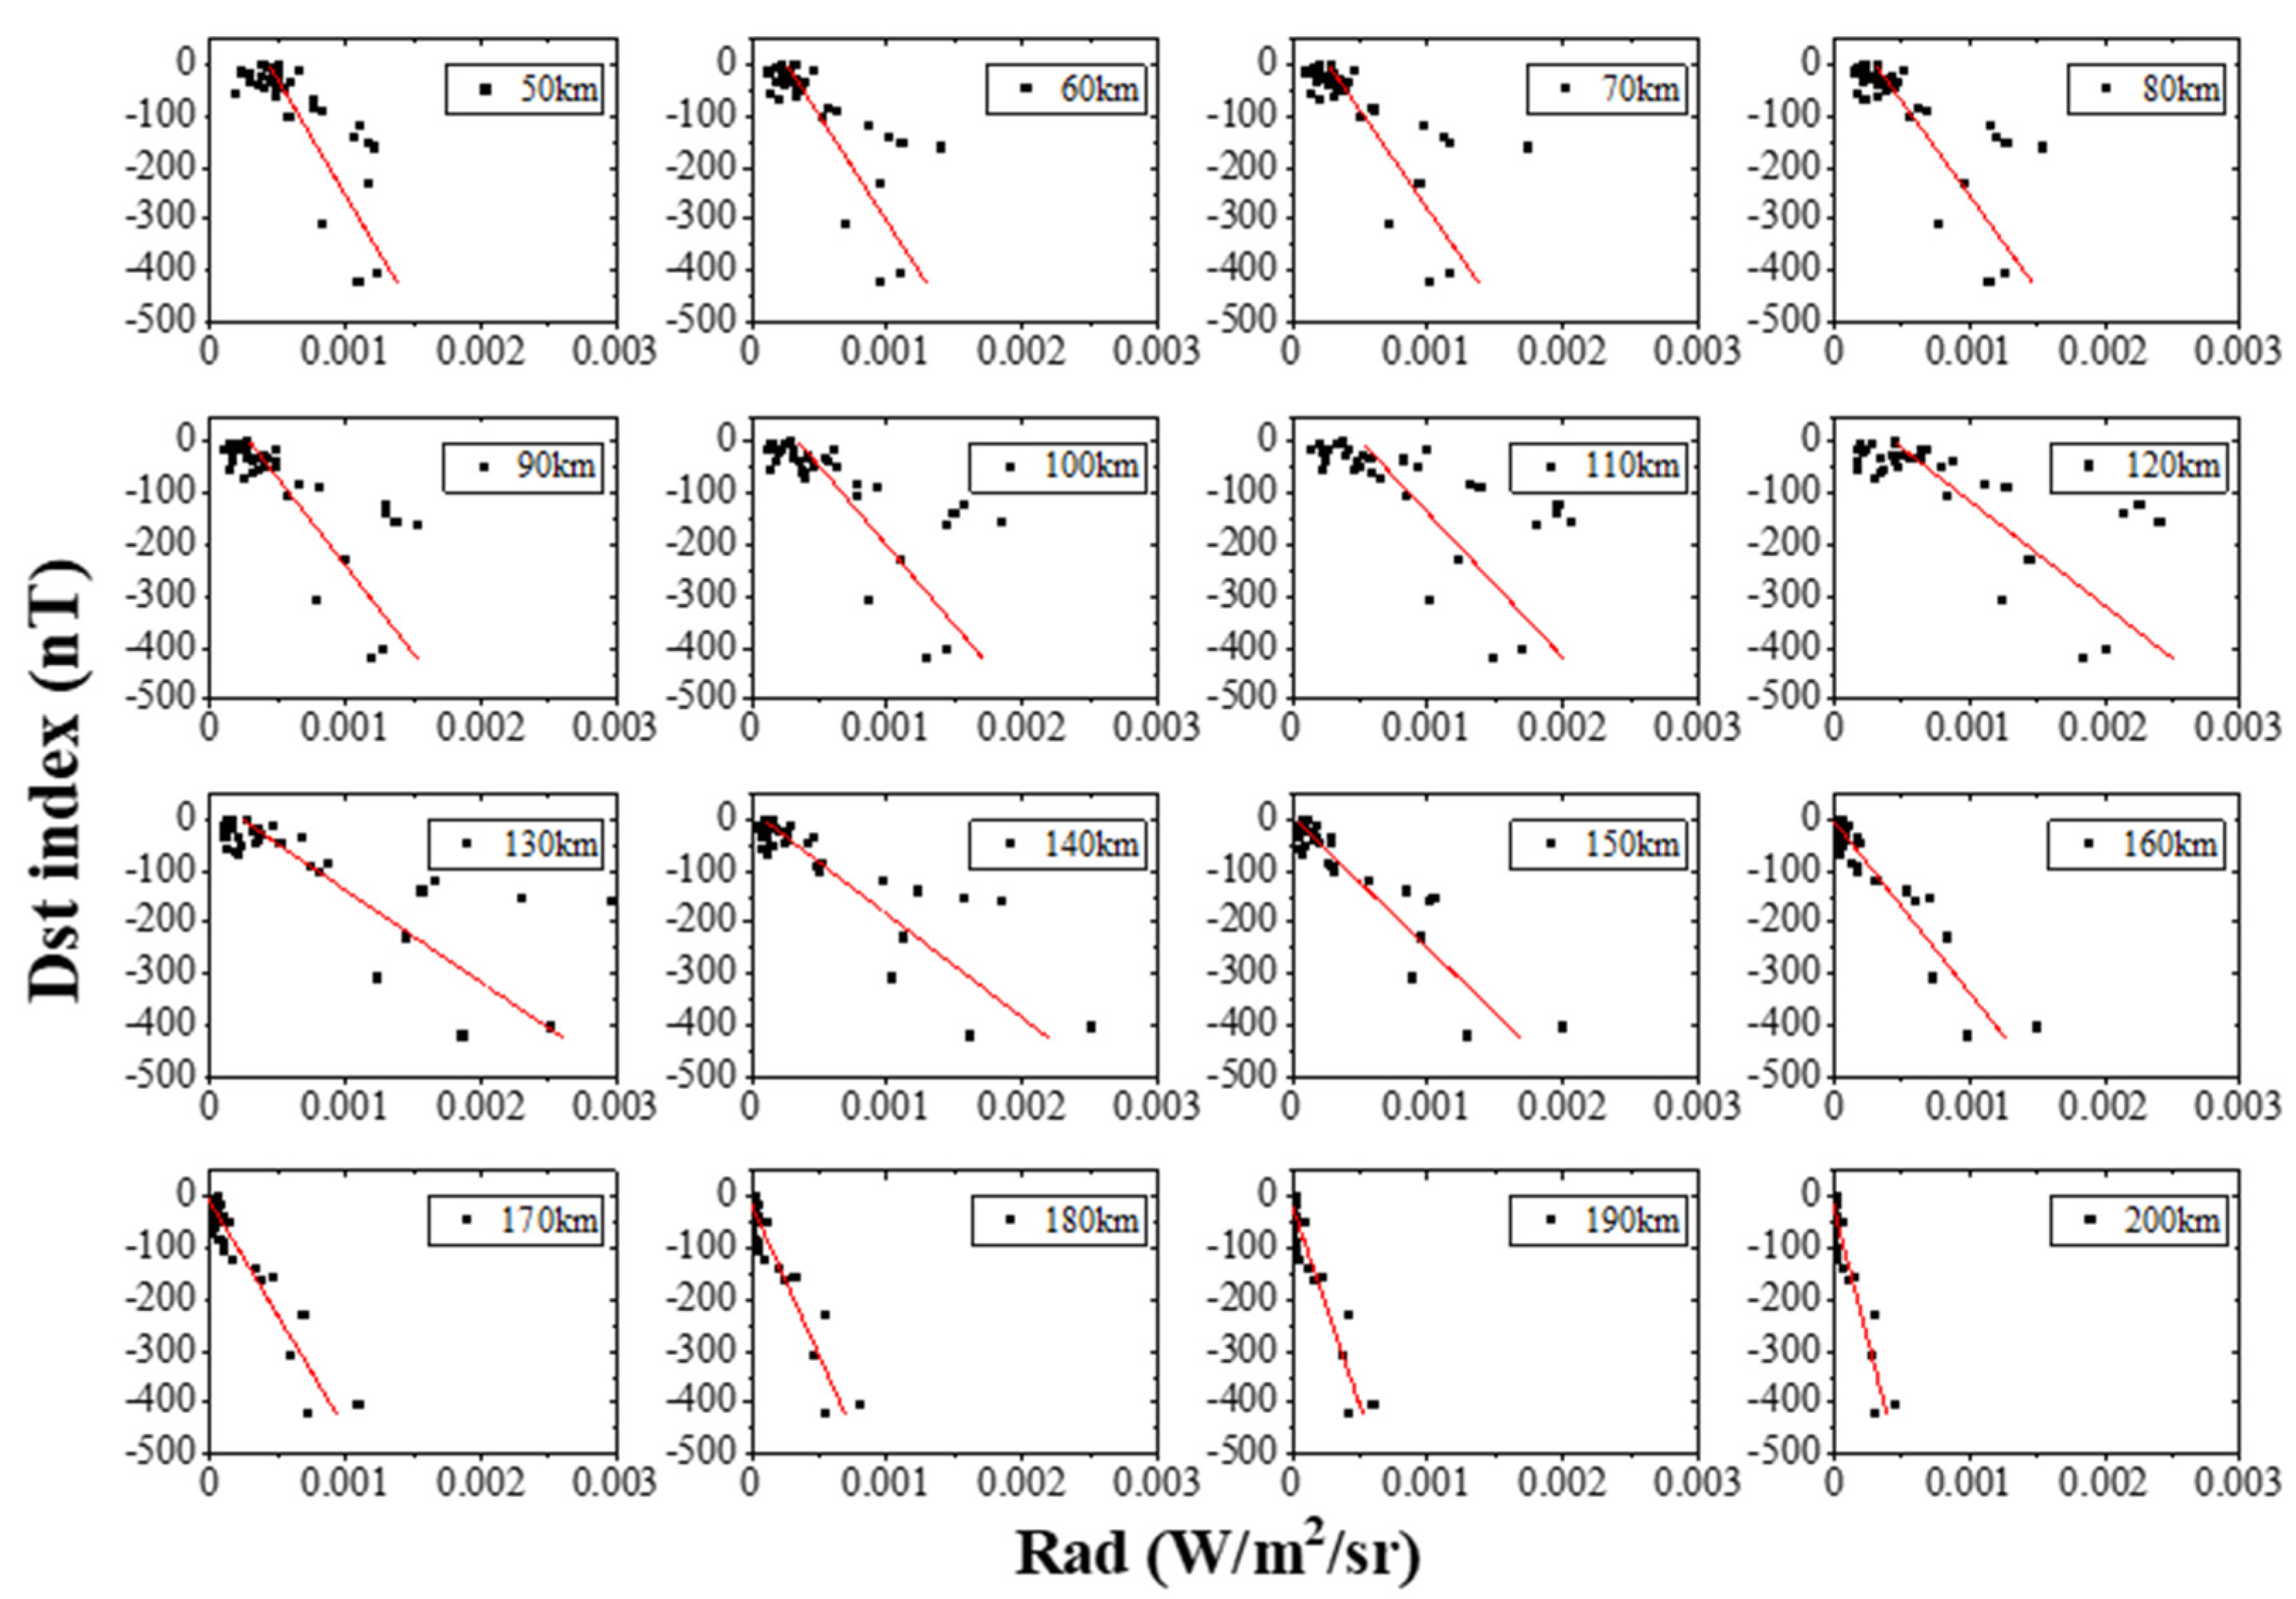
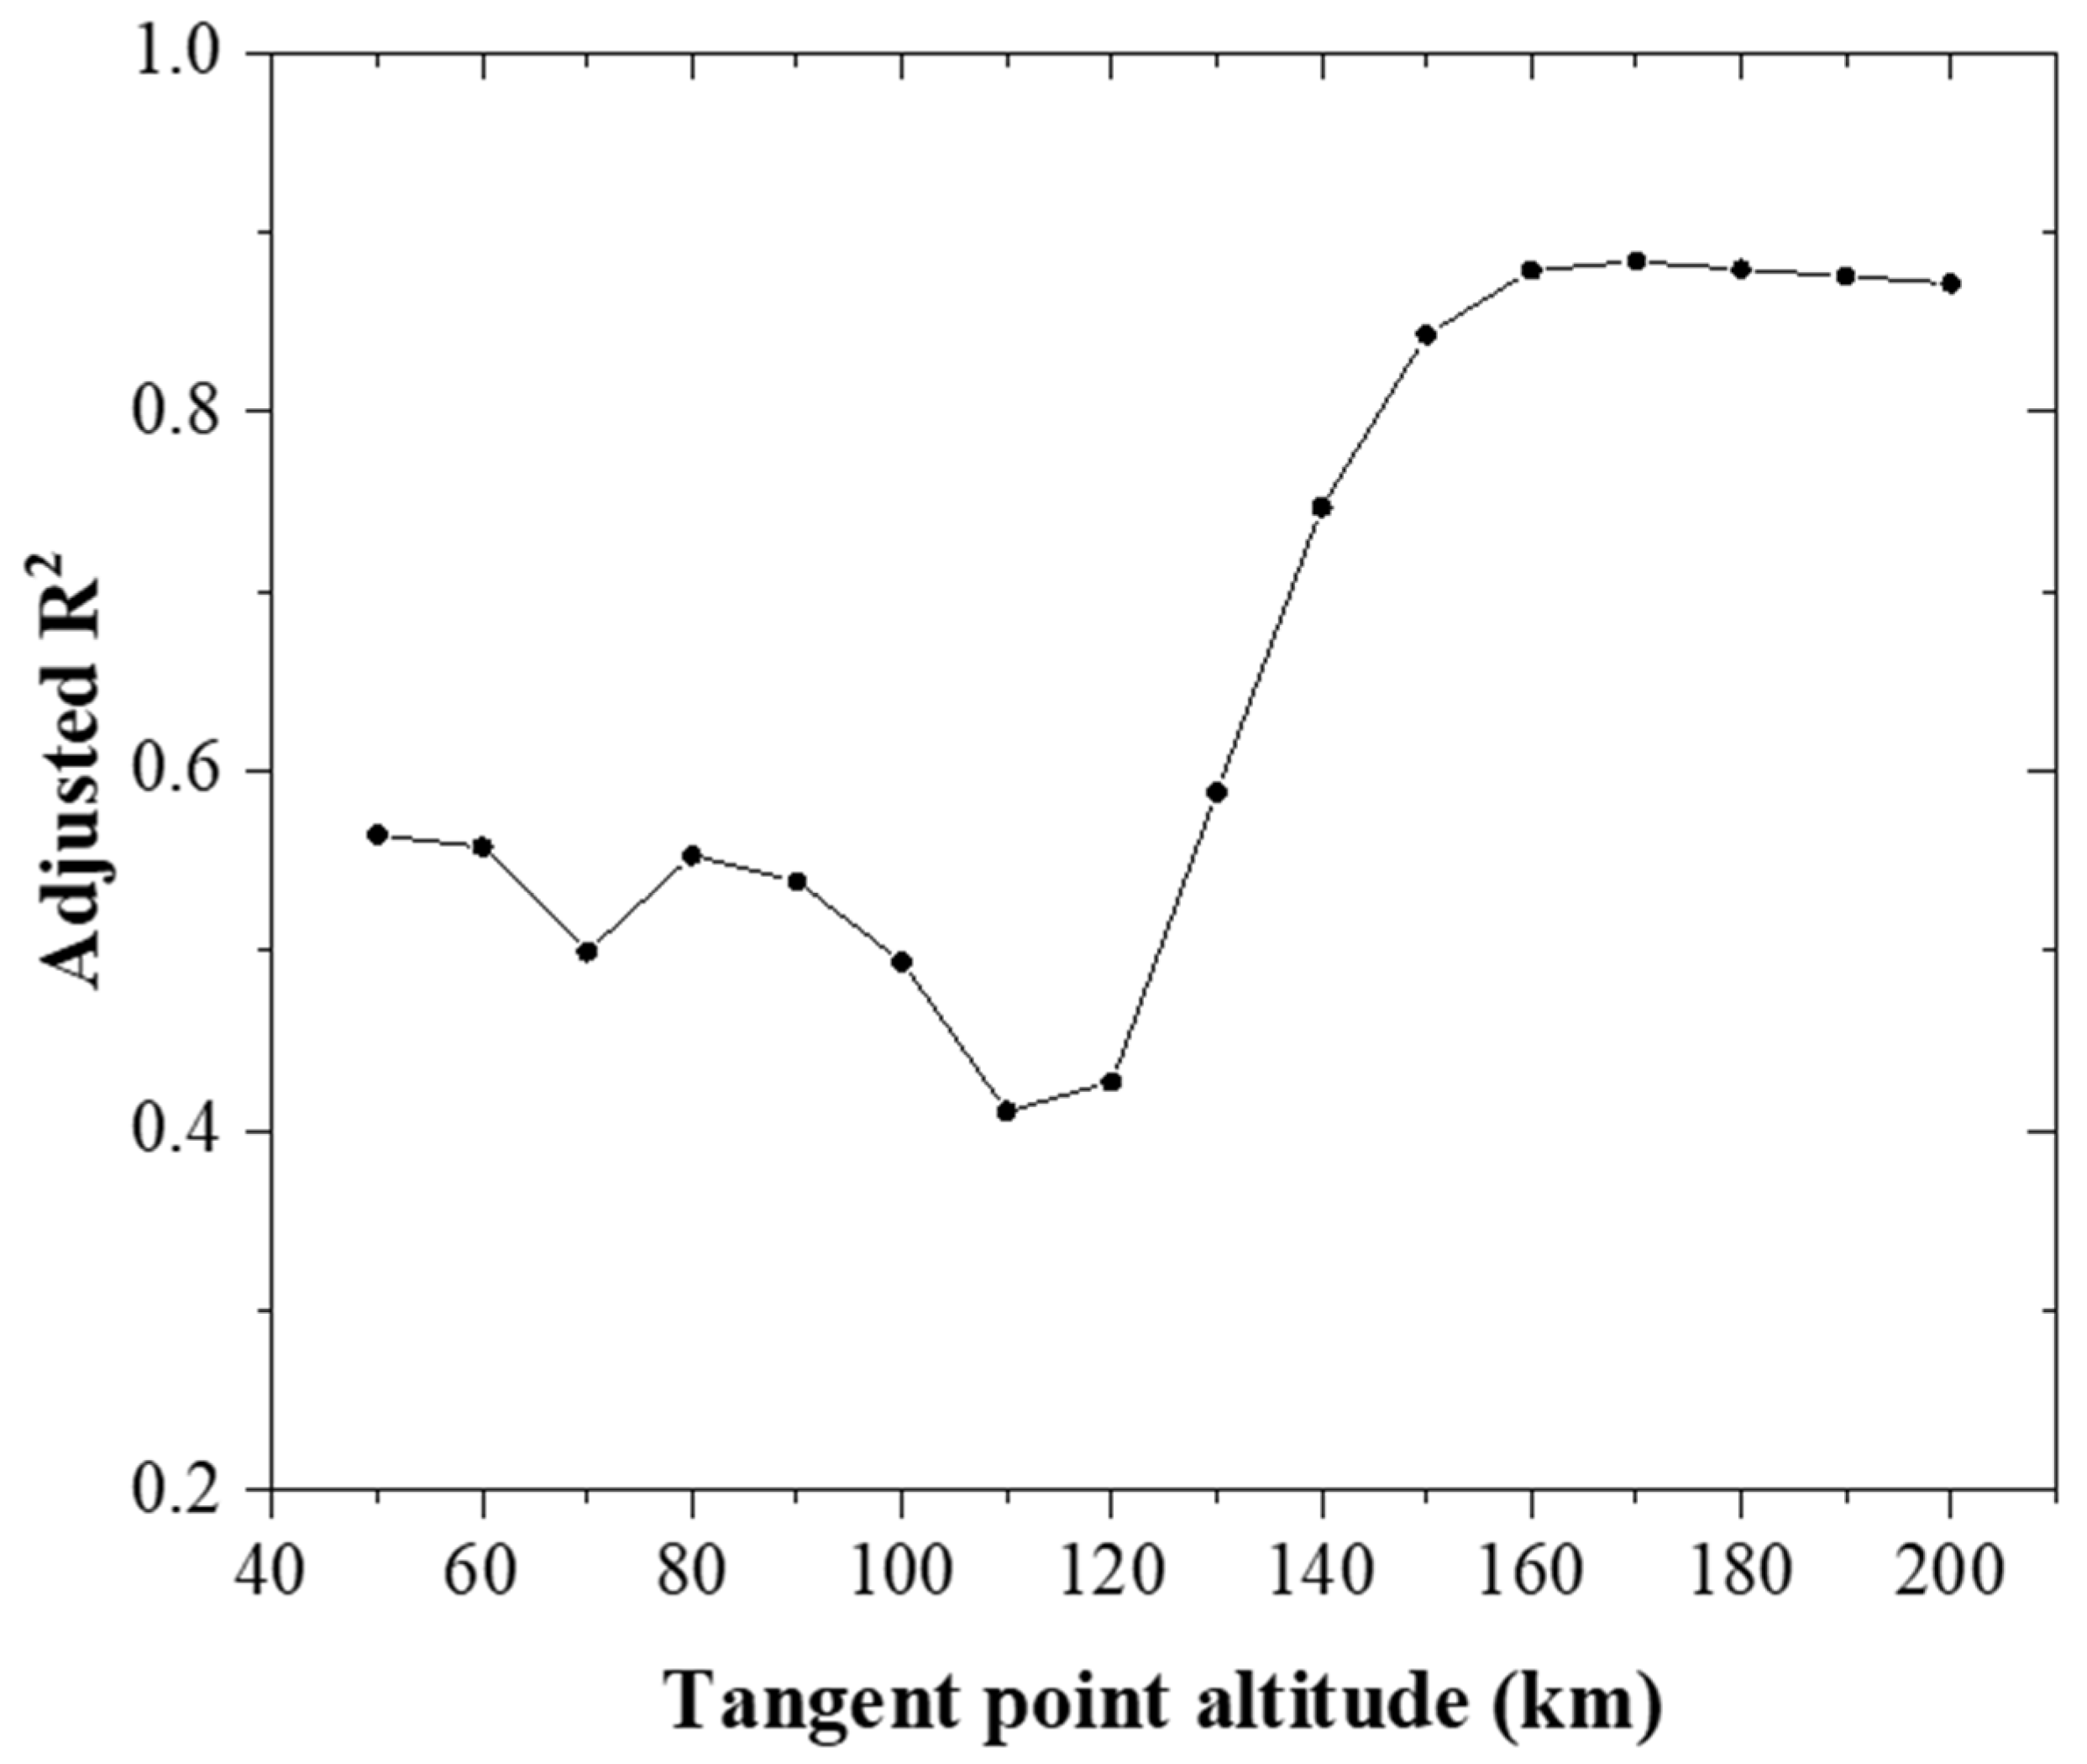
3.4. Correlation Analysis between Radiance and the Dst Index during Auroral Events
4. Conclusions
5. Discussion
Author Contributions
Funding
Data Availability Statement
Acknowledgments
Conflicts of Interest
References
- Liu, Z. Space Physics; Harbin Institute of Technology Press: Harbin, China, 2005. [Google Scholar]
- Liu, Z. Solar-terrestrial space environment and its influence on economic activities. In Chinese Geophysical Society, Proceedings of the 12th Annual Conference of the Chinese Geophysical Society; China Building Materials Industry Press: Beijing, China, 1996. [Google Scholar]
- Wang, C.; Chen, Z.; Hu, L.; Hu, Z.; Xue, X.; Xu, Q.; Zhang, X.; Li, F.; Wang, W.; Zong, W.; et al. Development and prospect of China’s space-based and ground-based space environment monitoring platforms. Spacecr. Environ. Eng. 2021, 38, 225–239. [Google Scholar]
- Cliver, E.W.; Svalgaard, L. The 1859 Solar–Terrestrial Disturbance And the Current Limits of Extreme Space Weather Activity. Sol. Phys. 2004, 224, 407–422. [Google Scholar] [CrossRef]
- Fang, T.W.; Kubaryk, A.; Goldstein, D.; Li, Z.; Fuller Rowell, T.; Millward, G.; Singer, H.J.; Steenburgh, R.; Westerman, S.; Babcock, E. Space Weather Environment during the SpaceX Starlink Satellite Loss in February 2022. Space Weather 2022, 20, e2022SW003193. [Google Scholar] [CrossRef]
- Chappell, C.R. The terrestrial plasma source: A new perspective in solar-terrestrial processes from Dynamics Explorer. Rev. Geophys. 1988, 26, 229–248. [Google Scholar] [CrossRef]
- Gonza Lez-Esparza, J.A.; Cuevas-Cardona, M.C. Observations of low-latitude red Aurora in Mexico during the 1859 Carrington geomagnetic storm. Space Weather 2018, 16, 593–600. [Google Scholar] [CrossRef]
- Silverman, S.M.S.V. Low-latitude auroras: The great aurora of 4 February 1872. J. Atmos. Sol.-Terr. Phy. 2008, 70, 1301–1308. [Google Scholar] [CrossRef]
- Wu, Y. Energy Deposition of Aurora and Non-Equilibrium Infrared Radiation. Master’s Thesis, Harbin Institute of Technology, Harbin, China, 2013. [Google Scholar]
- Winick, J.R.; Picard, R.H.; Joseph, R.A.; Sharma, R.D.; Wintersteiner, P.P. Infrared Spectral Radiance Code for the Auroral Thermosphere (AARC); Transactions of the American Clinical & Climatological Association: Baltimore, MD, USA, 1987. [Google Scholar]
- Bermejo-Pantaleón, D.; Funke, B.; López-Puertas, M.; García-Comas, M.; Stiller, G.P.; von Clarmann, T.; Linden, A.; Grabowski, U.; Höpfner, M.; Kiefer, M.; et al. Global observations of thermospheric temperature and nitric oxide from MIPAS spectra at 5.3 μm. J. Geophys. Res. Space Phys. 2011, 116. [Google Scholar] [CrossRef]
- Bharti, G.; Krishna, M.V.S.; Bag, T.; Jain, P. Storm Time Variation of Radiative Cooling by Nitric Oxide as Observed by TIMED-SABER and GUVI. J. Geophys. Res. Space Phys. Sect. 2018, 123, 1500–1514. [Google Scholar] [CrossRef]
- Gardner, J.L.; Puertas, M.L.; Funke, B.; Miller, S.M.; Lipson, S.J.; Sharma, R.D. Rotational and spin-orbit distributions of NO observed by MIPAS/ENVISAT during the solar storm of October/November 2003. J. Geophys. Res. Space Phys. 2005, 110, A9S–A34S. [Google Scholar] [CrossRef]
- Mlynczak, M.; Martin-Torres, F.J.; Russell, J.; Beaumont, K.; Jacobson, S.; Kozyra, J.; Lopez-Puertas, M.; Funke, B.; Mertens, C.; Gordley, L.; et al. The natural thermostat of nitric oxide emission at 5.3 μm in the thermosphere observed during the solar storms of April 2002. Geophys. Res. Lett. 2003, 30. [Google Scholar] [CrossRef]
- Mlynczak, M.G.; Martin-Torres, F.J.; Crowley, G.; Kratz, D.P.; Funke, B.; Lu, G.; Lopez-Puertas, M.; Russell, J.M.R., III; Kozyra, J.; Mertens, C.; et al. Energy transport in the thermosphere during the solar storms of April 2002. J. Geophys. Res. Space Phys. 2005, 110. Erratum in J. Geophys. Res. Space Phys. 2007, 112, A2303. [Google Scholar] [CrossRef]
- Barth, C.A. Reference models for thermospheric nitric oxide, 1994. Adv. Space Res. Off. J. Comm. Space Res. (COSPAR) 1996, 18, 103–115. [Google Scholar] [CrossRef]
- Siskind, D.E.; Barth, C.A.; Roble, R.G. The response of thermospheric nitric oxide to an auroral storm: 1. Low and middle latitudes. J. Geophys. Res. 1989, 94, 16885–16898. [Google Scholar]
- Cravens, T.E. The global distribution of nitric oxide at 200 km. J. Geophys. Res. 1981, 86, 5710–5714. [Google Scholar] [CrossRef]
- Barth, C.A.; Mankoff, K.D.; Bailey, S.M.; Solomon, S.C. Global observations of nitric oxide in the thermosphere. J. Geophys. Res. Space Phys. 2003, 108. [Google Scholar] [CrossRef]
- Siskind, D.E.; Barth, C.A.; Cleary, D.D. The possible effect of solar soft X rays on thermospheric nitric oxide. J. Geophys. Res. Atmos. 1990, 95, 4311–4317. [Google Scholar]
- Barth, C.A. Comparison of a thermospheric photochemical model with Student Nitric Oxide Explorer (SNOE) observations of nitric oxide. J. Geophys. Res. Space Phys. 2004, 109. [Google Scholar] [CrossRef]
- Lei, J.; Burns, A.G.; Thayer, J.P.; Wang, W.; Mlynczak, M.G.; Hunt, L.A.; Dou, X.; Sutton, E. Overcooling in the upper thermosphere during the recovery phase of the 2003 October storms. J. Geophys. Res. 2012, 117. [Google Scholar] [CrossRef]
- Mlynczak, M.G.; Hunt, L.A.; Marshall, B.T.; Martin-Torres, F.J.; Mertens, C.J.; Russell, J.M.R., III; Remsberg, E.E.; López-Puertas, M.; Picard, R.; Winick, J.; et al. Observations of infrared radiative cooling in the thermosphere on daily to multiyear timescales from the TIMED/SABER instrument. J. Geophys. Res. Space Phys. 2010, 115. [Google Scholar] [CrossRef]
- Mlynczak, M.G.; Hunt, L.A.; Marshall, B.T.; Iii, J.M.R.; Mertens, C.J.; Thompson, R.E.; Gordley, L.L. A combined solar and geomagnetic index for thermospheric climate. Geophys. Res. Lett. 2015, 42, 3677–3682. [Google Scholar] [CrossRef]
- O’Neil, R.R.; Winick, J.R.; Picard, R.H.; Kendra, M. Auroral NO+ 4.3 μm emission observed from the Midcourse Space Experiment: Multiplatform observations of 9 February 1997. J. Geophys. Res. Space Phys. 2007, 112. [Google Scholar] [CrossRef]
- Sharma, R.D.; O’Neil, R.; Gardiner, H.; Gibson, J.; Dothe, H.; Duff, J.W.; Wintersteiner, P.P.; Kendra, M. Midcourse Space Experiment: Auroral enhancement of nitric oxide medium-wave infrared emission observed by the Spatial Infrared Imaging Telescope III radiometer. J. Geophys. Res. Space Phys. 2001, 106, 21351–21365. [Google Scholar] [CrossRef]
- Adler-Golden, S.M.; Matthew, M.W.; Smith, D.R. Upper Atmospheric Infrared Radiance from CO2 and NO Observed during the SPIRIT 1 Rocket Experiment. J. Geophys. Res. Space Phys. 1991, 96, 11319–11329. [Google Scholar] [CrossRef]
- Espy, P.J.; Harris, C.R.; Steed, A.J.; Straka, J.C.U.A. Rocketborne interferometer measurement of infrared auroral spectra. Planet. Space Sci. 1988, 36, 543–551. [Google Scholar] [CrossRef]
- Kockarts, G. Nitric oxide cooling in the terrestrial thermosphere. Geophys. Res. Lett. 1980, 7, 137–140. [Google Scholar] [CrossRef]
- Sharma, R.D.; Dothe, H.; von Esse, F. On the rotational distribution of the 5.3μm “thermal” emission from nitric oxide in the nighttime terrestrial thermosphere. J. Geophys. Res. Space Phys. 1996, 101, 17129–17135. [Google Scholar] [CrossRef]
- Murphy, R.E.; Lee, E.T.P.; Hart, A.M. Quenching of vibrationally excited nitric oxide by molecular oxygen and nitrogen. J. Chem. Phys. 1975, 63, 2919. [Google Scholar] [CrossRef]
- Gardner, J.L.; Funke, B.; Mlynczak, M.G.; López-Puertas, M.; Martin-Torres, F.J.; Russell, J.M.R., III; Miller, S.M.; Sharma, R.D.; Winick, J.R. Comparison of nighttime nitric oxide 5.3 μm emissions in the thermosphere measured by MIPAS and SABER. J. Geophys. Res. Space Phys. 2007, 112. [Google Scholar] [CrossRef]
- Hwang, E.; Castle, K.J.; Dodd, J.A. Vibrational relaxation of NO(v = 1) by oxygen atoms between 295 and 825 K. J. Geophys. Res. Space Phys. 2003, 108. [Google Scholar] [CrossRef]
- Vitt, F.M.; Cravens, T.E.; Jackman, C.H. A two-dimensional model of thermospheric nitric oxide sources and their contributions to the middle atmospheric chemical balance. J. Atmos. Sol.-Terr. Phy. 2000, 62, 653–667. [Google Scholar] [CrossRef]
- Barth, C.A. Nitric oxide in the lower thermosphere. Planet. Space Sci. 1992, 40, 315–336. [Google Scholar] [CrossRef]
- Bag, T.; Li, Z.; Rout, D. SABER Observation of Storm-Time Hemispheric Asymmetry in Nitric Oxide Radiative Emission. J. Geophys. Res. Space Phys. 2021, 126. [Google Scholar] [CrossRef]
- Li, Z.; Knipp, D.; Wang, W. Understanding the Behaviors of Thermospheric Nitric Oxide Cooling during the 15 May 2005 Geomagnetic Storm. J. Geophys. Res. Space Phys. Sect. 2019, 124, 2113–2126. [Google Scholar] [CrossRef]
- Bag, T.; Rout, D.; Ogawa, Y.; Singh, V. Thermospheric NO Cooling during an Unusual Geomagnetic Storm of 21–22 January 2005: A Comparative Study between TIMED/SABER Measurements and TIEGCM Simulations. Atmosphere 2023, 14, 556. [Google Scholar] [CrossRef]
- Thatcher, L.J.; Müller, H.R. Statistical investigation of hourly OMNI solar wind data. J. Geophys. Res. 2011, 116. [Google Scholar] [CrossRef]
- Vokhmyanin, M.V.; Stepanov, N.A.; Sergeev, V.A. On the Evaluation of Data Quality in the OMNI Interplanetary Magnetic Field Database. Space Weather 2019, 17, 476–486. [Google Scholar] [CrossRef]
- Papitashvili, N.; Bilitza, D.; King, J. OMNI: A description of near-Earth solar wind environment. In Proceedings of the 40th COSPAR Scientific Assem, Moscow, Russia, 2–10 August 2014. [Google Scholar]
- Troshichev, O.A.A.O.; Sormakov, D.A.A. PC index as a proxy of the solar wind energy that entered into the magnetosphere: (5) verification of the solar wind parameters presented at OMNI website. J. Atmos. Sol. Terr. Phys. 2019, 196, 105147. [Google Scholar] [CrossRef]
- Papitashvili, N.E.; King, J.H. A draft high resolution OMNI data set. In AGU Spring Meeting Abstracts; 2006; Available online: https://ui.adsabs.harvard.edu/abs/2006AGUSMSM33A..02P/abstract (accessed on 14 April 2024).
- Russell, J.M.I.; Mlynczak, M.G.; Gordley, L.L.; Tansock, J.J., Jr.; Esplin, R.W. Overview of the SABER experiment and preliminary calibration results. Proc. SPIE-Int. Soc. Opt. Eng. 1999, 3756, 277–288. [Google Scholar]
- Mertens, C.J.C.J.; Russell, J.M.J.R., III; Mlynczak, M.G.M.G.; She, C.J.L.C.; Schmidlin, F.J.F.O.; Goldberg, R.A.R.A.; López-Puertas, M.P.I.E.; Wintersteiner, P.P.W.A.; Picard, R.H.R.P.; Winick, J.R.J.W.; et al. Kinetic temperature and carbon dioxide from broadband infrared limb emission measurements taken from the TIMED/SABER instrument. Adv. Space Res. 2009, 43, 15–27. [Google Scholar] [CrossRef]
- Xu, J.; She, C.Y.; Yuan, W.; Mertens, C.; Mlynczak, M.; Russell, J. Comparison between the temperature measurements by TIMED/SABER and lidar in the midlatitude. J. Geophys. Res. Space Phys. 2006, 111. [Google Scholar] [CrossRef]
- Bharti, G.; Krishna, M.V.S.; Singh, V. Radiative cooling due to NO at 5.3 μm emission as observed by TIMED/SABER over Asian sector. Adv. Space Res. 2019, 64, 1989–2001. [Google Scholar] [CrossRef]
- Jiang, G.; Wang, W.; Xu, J.; Yue, J.; Burns, A.G.; Lei, J.; Mlynczak, M.G.; Rusell, J.M. Responses of the lower thermospheric temperature to the 9-day and 13.5-day oscillations of recurrent geomagnetic activity. J. Geophys. Res. Space Phys. 2014, 119, 4841–4859. [Google Scholar] [CrossRef]
- Russell, J.M., III; Mlynczak, M.G.; Gordley, L.L. Overview of the Sounding of the Atmosphere Using Broadband Emission Radiometry (SABER) experiment for the Thermosphere-Ionsphere-Mesosphere Energetics and Dynamics (TIMED) mission. Opt. Spectrosc. Tech. Instrum. Atmos. Space Res. 1994, 2266, 406–415. [Google Scholar]
- Mlynczak, M.G.; Hunt, L.A.; Lopez-Puertas, M.; Funke, B.; Emmert, J.; Solomon, S.; Yue, J.; Russell, J.M.; Mertens, C. Spectroscopy, gas kinetics, and opacity of thermospheric nitric oxide and implications for analysis of SABER infrared emission measurements at 5.3 µm. J. Quant. Spectrosc. Radiat. 2021, 268, 107609. [Google Scholar] [CrossRef]
- Davis, T.N.; Sugiura, M. Auroral electrojet activity index AE and its universal time variations. J. Geophys. Res. 1966, 71, 785–801. [Google Scholar] [CrossRef]
- Sharma, R.D.; Dothe, H.; von Esse, F.; Kharchenko, V.A.; Sun, Y.; Dalgarno, A. Production of vibrationally and rotationally excited NO in the night time terrestrial thermosphere. J. Geophys. Res. Space Phys. 1996, 101, 19707–19713. [Google Scholar]
- Armstrong, P.S.; Lipson, S.J.; Dodd, J.A.; Lowell, J.R.; Blumberg, W.A.M.; Nadile, R.M. Highly rotationally excited NO (υ, J) in the thermosphere from CIRRIS 1A limb radiance measurements. Geophys. Res. Lett. 1994, 21, 2425–2428. [Google Scholar] [CrossRef]
- Crowley, G.; Ridley, A.; Winningham, D.; Frahm, R.; Sharber, J.; Russell, J.I. On the hemispheric symmetry in thermospheric nitric oxide. Geophys. Res. Lett. 1999, 26, 1545–1548. [Google Scholar] [CrossRef]
- Jiajia, Y.; Fangfang, Z.; Lishan, C.; Ji, Z. Infrared Characteristics of Ground Targets and Background Observed from NearSpace. Infrared Technol. 2021, 43, 670–678. [Google Scholar]


| Altitude Region (km) | Statistical Value of Radiance (W/m2/sr) | ||
|---|---|---|---|
| STD | MIN | MAX | |
| 50–100 | 3.99 × 10⁻⁴ | 1.08 × 10⁻⁴ | 1.79 × 10⁻³ |
| 100–150 | 6.85 × 10⁻⁴ | 3.81 × 10⁻⁵ | 3.38 × 10⁻³ |
| 150–200 | 2.77 × 10⁻⁴ | 7.28 × 10⁻⁷ | 2.00 × 10⁻³ |
| 200–250 | 6.40 × 10⁻⁵ | 1.89 × 10⁻⁹ | 4.54 × 10⁻⁴ |
| No. | Orbit Number | Date | Time (UT) |
|---|---|---|---|
| (a) | 10,538 | 11-18 | 23:06 |
| (b) | 10,553 | 11-19 | 23:17 |
| (c) | 10,562 | 11-20 | 13:51 |
| (d) | 10,563 | 11-20 | 15:27 |
| (e) | 10,565 | 11-20 | 18:42 |
| (f) | 10,566 | 11-20 | 20:19 |
| (g) | 10,567 | 11-20 | 21:57 |
| (h) | 10,568 | 11-20 | 23:34 |
| (i) | 10,569 | 11-21 | 01:11 |
| (j) | 10,590 | 11-22 | 11:10 |
| (k) | 10,607 | 11-23 | 14:42 |
| (l) | 10,609 | 11-23 | 17:57 |
| Orbit Information | Statistics Values (W/m2/sr) | ||||||
|---|---|---|---|---|---|---|---|
| Number | Event | Date | Time (UT) | AVE | STD | MIN | MAX |
| 10,538 | 1 | 11-18 | 23:06 | 3.63 × 10⁻⁴ | 2.67 × 10⁻⁴ | 3.24 × 10⁻⁵ | 1.21 × 10⁻³ |
| 10,553 | 2 | 11-19 | 23:17 | 2.87 × 10⁻⁴ | 1.75 × 10⁻⁴ | 3.47 × 10⁻⁵ | 7.02 × 10⁻⁴ |
| 10,562 | 3 | 11-20 | 13:51 | 9.76 × 10⁻⁴ | 6.52 × 10⁻⁴ | 1.79 × 10⁻⁴ | 3.51 × 10⁻³ |
| 10,563 | 4 | 11-20 | 15:27 | 1.42 × 10⁻³ | 9.94 × 10⁻⁴ | 2.14 × 10⁻⁴ | 4.30 × 10⁻³ |
| 10,565 | 5 | 11-20 | 18:42 | 2.26 × 10⁻³ | 1.46 × 10⁻³ | 3.78 × 10⁻⁴ | 6.93 × 10⁻³ |
| 10,566 | 6 | 11-20 | 20:19 | 2.16 × 10⁻³ | 1.46 × 10⁻³ | 3.85 × 10⁻⁴ | 6.23 × 10⁻³ |
| 10,567 | 7 | 11-20 | 21:57 | 2.19 × 10⁻³ | 1.36 × 10⁻³ | 4.55 × 10⁻⁴ | 6.11 × 10⁻³ |
| 10,568 | 8 | 11-20 | 23:34 | 2.19 × 10⁻³ | 1.41 × 10⁻³ | 4.69 × 10⁻⁴ | 7.83 × 10⁻³ |
| 10,569 | 9 | 11-21 | 01:11 | 2.56 × 10⁻³ | 1.42 × 10⁻³ | 6.39 × 10⁻⁴ | 7.91 × 10⁻³ |
| 10,578 | 10 | 11-21 | 16:10 | 8.43 × 10⁻⁴ | 4.52 × 10⁻⁴ | 2.26 × 10⁻⁴ | 2.35 × 10⁻³ |
| 10,588 | 11 | 11-22 | 08:18 | 4.68 × 10⁻⁴ | 3.74 × 10⁻⁴ | 4.64 × 10⁻⁵ | 1.34 × 10⁻³ |
| 10,589 | 12 | 11-22 | 09:56 | 4.52 × 10⁻⁴ | 3.25 × 10⁻⁴ | 6.59 × 10⁻⁵ | 1.24 × 10⁻³ |
| 10,590 | 13 | 11-22 | 11:10 | 4.33 × 10⁻⁴ | 2.88 × 10⁻⁴ | 6.68 × 10⁻⁴ | 1.06 × 10⁻³ |
| 10,591 | 14 | 11-22 | 13:12 | 4.12 × 10⁻⁴ | 2.31 × 10⁻⁴ | 1.23 × 10⁻⁴ | 1.18 × 10⁻³ |
| 10,593 | 15 | 11-22 | 16:27 | 4.92 × 10⁻⁴ | 3.88 × 10⁻⁴ | 1.13 × 10⁻⁴ | 1.96 × 10⁻³ |
| 10,607 | 16 | 11-23 | 14:42 | 5.68 × 10⁻⁴ | 4.10 × 10⁻⁴ | 1.30 × 10⁻⁴ | 1.72 × 10⁻³ |
| 10,609 | 17 | 11-23 | 17:57 | 5.43 × 10⁻⁴ | 3.85 × 10⁻⁴ | 1.37 × 10⁻⁴ | 1.76 × 10⁻³ |
Disclaimer/Publisher’s Note: The statements, opinions and data contained in all publications are solely those of the individual author(s) and contributor(s) and not of MDPI and/or the editor(s). MDPI and/or the editor(s) disclaim responsibility for any injury to people or property resulting from any ideas, methods, instructions or products referred to in the content. |
© 2024 by the authors. Licensee MDPI, Basel, Switzerland. This article is an open access article distributed under the terms and conditions of the Creative Commons Attribution (CC BY) license (https://creativecommons.org/licenses/by/4.0/).
Share and Cite
Wu, F.; Dai, C.; Chen, S.; Zhang, C.; Lian, W.; Wei, H. Spatial and Temporal Variation Patterns of NO 5.3 µm Infrared Radiation during Two Consecutive Auroral Disturbances. Remote Sens. 2024, 16, 1420. https://doi.org/10.3390/rs16081420
Wu F, Dai C, Chen S, Zhang C, Lian W, Wei H. Spatial and Temporal Variation Patterns of NO 5.3 µm Infrared Radiation during Two Consecutive Auroral Disturbances. Remote Sensing. 2024; 16(8):1420. https://doi.org/10.3390/rs16081420
Chicago/Turabian StyleWu, Fan, Congming Dai, Shunping Chen, Cong Zhang, Wentao Lian, and Heli Wei. 2024. "Spatial and Temporal Variation Patterns of NO 5.3 µm Infrared Radiation during Two Consecutive Auroral Disturbances" Remote Sensing 16, no. 8: 1420. https://doi.org/10.3390/rs16081420
APA StyleWu, F., Dai, C., Chen, S., Zhang, C., Lian, W., & Wei, H. (2024). Spatial and Temporal Variation Patterns of NO 5.3 µm Infrared Radiation during Two Consecutive Auroral Disturbances. Remote Sensing, 16(8), 1420. https://doi.org/10.3390/rs16081420