Article

Data Quality Analysis of Wet Atmospheric Temperature Profiles from the YunYao Meteorological Constellation Radio Occultation

1
Guangzhou Institute of Tropical and Marine Meteorology of China Meteorological Administration, GBA Academy of Meteorological Research, Guangzhou 510640, China
2
Guangzhou Meteorological Satellite Ground Station; Guangzhou 510630, China
*
Author to whom correspondence should be addressed.
Remote Sens. 2026, 18(16), 2733; https://doi.org/10.3390/rs18162733
Submission received: 18 June 2026 / Revised: 3 August 2026 / Accepted: 9 August 2026 / Published: 14 August 2026
(This article belongs to the Special Issue BDS/GNSS for Earth Observation (Third Edition))

Highlights

What are the main findings?
  • Within 50–925 hPa, the YunYao wet atmospheric temperature profiles agree closely with operational radiosonde observations over southern China, with the RMSE generally within 1–2 °C and only a weak, spatially uniform cold bias of about −0.25 °C, while providing approximately 4.77 times the matched sample volume of COSMIC-2 at comparable accuracy.
  • Within 925–1000 hPa, the error is dominated by enhanced random dispersion (RMSE up to 2.52 °C) and exhibits an inland-cold/coastal-warm bias dipole, together with two low-level anomalies: a January maximum of near-surface random error possibly related to winter monsoon cold surges and a March bias sign reversal possibly related to the pre-flood-season moisture increase.
What are the implications of the main findings?
  • With high observation density that supplements vertical sounding coverage in data-sparse regions, YunYao temperature profiles within 50–925 hPa exhibit a weak cold bias and are highly applicable after bias correction.
  • This study presents a preliminary analysis of the causes of low-level errors and may serve as a reference for the design of observation error models and bias correction schemes stratified by surface type, month, and local time.

Abstract

Radio occultation offers high vertical resolution, global coverage, and low sensitivity to clouds and precipitation, making it a useful complement to existing atmospheric sounding techniques. The YunYao constellation, the first commercial meteorological remote sensing constellation of China, supplies a large number of GNSS-RO temperature profile products, yet the quality of its wet atmospheric profiles remains undocumented. Using operational radiosonde data from 43 stations over southern China (97–123°E, 17–31°N) during boreal winter and early spring (1 November 2025 to 31 March 2026) as reference, this study evaluates the accuracy, error characteristics, and applicability of the YunYao wet atmospheric temperature profile product, with COSMIC-2 as an independent benchmark. YunYao yields 4.77 times the matched sample volume of COSMIC-2 over the same domain and period, while its RMSE is only 0.20–0.42 °C higher. Within 50–925 hPa, the YunYao profiles agree closely with radiosondes, with RMSE generally within 1–2 °C, a weak, spatially uniform cold bias, and small diurnal differences. Below 925 hPa, near-surface error grows markedly, dominated by enhanced random error rather than systematic error, with inland cold and coastal warm bias. A January maximum of random error is possibly related to super-refraction during peak winter monsoon cold surges, and a March sign reversal of the bias possibly related to the seasonal increase in boundary layer moisture ahead of the pre-flood season. With weak cold bias correction, YunYao temperature profiles are highly usable within 50–925 hPa, while data below 925 hPa require strict quality control.

1. Introduction

For a long time, global atmospheric temperature profiles have been obtained mainly from radiosonde systems. Carrying a radiosonde aloft with a balloon yields high-accuracy in situ temperature observations, which have been widely used to validate various remote sensing data [1]. The existing global radiosonde network, however, is highly uneven in space because of complex geographical conditions, high consumable costs, and heavy maintenance demands. Conventional soundings are usually carried out only twice or four times per day, and this low spatiotemporal resolution limits the detailed observation of the thermal structure of rapidly evolving hazardous weather [2]. Spaceborne passive remote sensing in the infrared and microwave bands greatly improves horizontal coverage through scanning radiometers, but its vertical sounding depends on weighting functions and so has limited vertical resolution. The infrared band cannot penetrate clouds [3], while the microwave band suffers strong scattering and attenuation under heavy precipitation and cloudy skies, so the fine temperature structure beneath clouds and under complex weather backgrounds remains difficult to retrieve [4].
The Global Navigation Satellite System Radio Occultation (GNSS-RO) technique is an active limb-sounding approach that addresses these shortcomings of traditional observations. It uses the refraction and phase delay produced when GNSS signals pass through the atmosphere along the density gradient of the medium, and retrieves the atmospheric bending angle and refractivity from geometric optics or wave optics. In thermodynamic retrieval, the water vapor content of the middle and upper troposphere and the stratosphere is extremely low, so its contribution to refractivity is negligible. Under this dry-air approximation, the dry temperature profile is retrieved directly by integrating the ideal gas law and the hydrostatic equation [5]. GNSS-RO offers high vertical resolution, uniform global coverage, all-weather observation, near immunity to clouds and precipitation, and long-term stability through self-calibration, and it has become a key way to compensate for the limitations of conventional observations [6]. Since the GPS/MET experiment first validated the technique, GNSS-RO has moved from preliminary exploration to large-scale operational use. Operational systems, such as the COSMIC-2 constellation and China’s FY-3C/D/E meteorological satellites, have markedly increased the spatiotemporal density and quality of RO observations. Yue et al. [7] show that the GLONASS and GPS RO profiles from COSMIC-2 agree well with ECMWF reanalysis from the troposphere to the lower stratosphere, which confirms their reliability in capturing the atmospheric thermal structure, and validation against radiosonde observations likewise indicates that COSMIC temperature and humidity retrievals are of good quality [8]. Bai et al. [9] report that the dry temperature profile products of China’s FY-3 series reach very high accuracy and excellent long-term stability in the stratosphere. In terms of the application of domestic RO data in numerical weather prediction, Li et al. [10] evaluate the assimilation performance of YunYao GNSS-RO constellation data within the Global Forecast System (GFS) framework. Their results demonstrate that the assimilation of YunYao RO data significantly reduces geopotential height and temperature biases in the mid-to-upper atmosphere, verifying the positive contribution of Chinese commercial RO data to improving the quality of numerical analysis fields.
In recent years, the rapid growth of commercial aerospace technology has allowed commercial GNSS-RO constellations to reshape global atmospheric sounding. Constellations such as Spire, PlanetiQ, and Tianmu-1 (TM-1) already provide multi-system RO services, and several institutions have verified the accuracy of their refractivity and temperature-humidity profiles, with overall performance approaching and in some cases exceeding that of operational satellites [5,11,12,13]. In this context, the YunYao meteorological constellation, as China’s first commercial meteorological remote sensing constellation, is of clear research value in terms of its construction progress and data quality [14]. The YunYao constellation already provides a large volume of RO data from multiple navigation systems, including BeiDou and GPS, and the BeiDou RO data show good low-level penetration, with about 79.75% of the profiles reaching below 2 km [7]. Xu et al. [15] assess the neutral atmospheric refractivity and bending angle of the YunYao constellation against ERA5 reanalysis and find that the error standard deviation within 4–40 km is comparable to that of COSMIC-2, while the lower-tropospheric observation error estimated with the three-cornered-hat method [16] is also fairly stable.
Nevertheless, a clear gap remains in both the evaluated variables and the validation methodology of existing YunYao studies. In terms of variables, current assessments of YunYao RO data focus mainly on intermediate products such as neutral atmospheric refractivity and bending angle, and rarely validate the temperature profile product that can be used directly for weather analysis and data assimilation [7,14,15,17,18], while conventional GPS radio occultation studies have shown that multipath effects in the tropical lower troposphere significantly degrade observation quality and increase the difficulty of validating lower-atmosphere products and applying them in assimilation [19]. In the lower troposphere, where water vapor contributes strongly to refractivity, GNSS-RO usually introduces a background field through methods such as one-dimensional variational (1D-Var) analysis to separate the temperature and humidity contributions [20]. The RO wet atmospheric temperature profile generally shows a pronounced bias at low levels [21], and in low-latitude humid regions, the retrieved temperature profile often shows a positive bias because of multipath effects, background field error, and cloud water [14,22]. In terms of methodology, prior YunYao evaluations rely either on comparison with ERA5 reanalysis combined with three-cornered-hat error estimation [23], which cannot fully separate observation error from background dependence because the 1D-Var retrieval itself uses model information, or on indirect assessment through assimilation impact experiments [16], which measure forecast benefit rather than product accuracy itself. No study has yet systematically evaluated the YunYao wet atmospheric temperature profile product against independent in situ observations. This gap is particularly significant over southern China, where water vapor conditions are complex, and convection is active.
As a relatively new data source for radio occultation observations, YunYao remains insufficiently studied to date. The few available assessment studies mainly focus on bending angle, refractivity, dry temperature profiles, and Level 1 products, leaving the wet atmospheric temperature profile, the Level 2 variable of most direct value for weather analysis, without systematic validation. This study therefore carries out a systematic evaluation of the wet temperature profile over southern China during boreal winter and early spring, using independent operational radiosonde observations as references, with COSMIC-2 serving as a concurrent benchmark under identical matching criteria, domain, and period. During this period, frequent cold-air outbreaks produce sharp horizontal temperature gradients along cold fronts; thus, collocation thresholds exert a direct influence on validation results: a larger matching radius increases representativeness error, while an overly small radius reduces the number of collocated samples. However, previous GNSS-RO validation studies rarely examine this trade-off or explicitly justify their threshold choices; thresholds are often adopted by convention instead of being objectively determined. To address this issue, sensitivity experiments are conducted using multiple combinations of time window and matching radius. The results identify a ±3 h time window and a 180 km matching radius as the most balanced combination.
The analysis of error field characteristics constitutes another important contribution of this study. Most previous GNSS-RO validations report layer-averaged statistics, which summarize overall accuracy but conceal its vertical, spatial, and temporal structure. This study instead decomposes the error field jointly by pressure layer, land and sea surface type, month, and daytime and nighttime subsets. On this basis, the overall accuracy of the YunYao product is fully evaluated across all atmospheric layers. It isolates three low-level error features that have not been documented for YunYao data. A persistent land-cold and sea-warm bias dipole exists below 700 hPa. Near-surface random error reaches its maximum in January and is amplified at night. The low-level bias sign reverses in March, with opposite diurnal expressions over land and sea. The study further explores the causes of these three features. It tentatively relates them to boundary layer and retrieval processes. These possible processes include super-refraction during peak winter monsoon cold surges and the seasonal rise in boundary layer moisture ahead of the pre-flood season. However, this analysis relies solely on temperature observations, and direct verification of these mechanisms is left to future work. These interpretations provide a reference for designing observation error models and bias correction schemes stratified by surface type, month, and local time, and thereby help improve the usability of the data.
The remainder of this paper is organized as follows. Section 2 describes the YunYao, COSMIC-2, and radiosonde datasets and the spatiotemporal matching, vertical interpolation, and statistical evaluation methods. Section 3 presents the benchmark comparison of YunYao and COSMIC-2 against the radiosonde reference, the layer-resolved error structure of the YunYao product, and the spatial and monthly decomposition of the bias. Section 4 preliminarily analyzes the potential error causes, clarifies study limitations, and outlines future research prospects. Section 5 summarizes the main findings and their implications for operational application.

2. Materials and Methods

2.1. Data

2.1.1. YunYao GNSS-RO Atmospheric Profile Data

The YunYao constellation is China’s first commercial meteorological remote sensing constellation and entered a phase of large-scale rapid networking in 2024. The constellation is planned to comprise 90 satellites and is expected to complete global networking by 2026. It mainly carries an independently developed GNSS-RO sounding instrument (GNROI, Tianjin Yunyao Aerospace Technology Co., Ltd., Tianjin, China), which detects the signals received from the four global navigation satellite systems BeiDou Navigation Satellite System (BDS, China Satellite Navigation Office, Beijing, China), Global Positioning System (GPS, U.S. Space Force, Washington, DC, USA), Global Navigation Satellite System (GLONASS, Roscosmos, Moscow, Russia), and Galileo Global Navigation Satellite System (Galileo, European Space Agency, Paris, France). The instrument primarily uses negative-elevation signals within the height range from near the surface to 60 km, and through onboard reception and processing together with ground retrieval algorithms, it converts the raw observations into atmospheric parameter profiles. Its standard products cover a series of basic physical quantities from atmospheric bending angle and refractivity to dry temperature, dry pressure, and density. These products help fill the spatiotemporal gaps of traditional meteorological monitoring over oceans and remote regions, and provide accurate initial-field information for numerical weather prediction [14,15,18]. Detailed core parameters of the YunYao constellation and its GNSS-RO payload are summarized in Table 1.
This study uses the wet atmospheric temperature profile product of the YunYao constellation as the object of validation. This product is generated via neutral atmospheric RO retrieval followed by one-dimensional variational (1D-Var) assimilation. The ECMWF operational analysis is adopted as the background field in the 1D-Var processing chain. Notably, the 1D-Var retrieval adopts ECMWF operational data as the background field, as officially stated by YunYao, although the detailed technical parameters of this background field remain undisclosed. Given the study period from November 2025 to March 2026, the applied ECMWF operational system is reasonably inferred to be IFS Cycle 49r1. This retrieval scheme produces meteorological elements that account for water vapor contributions. The data record the spatiotemporal and physical attributes of each RO event, including the observation time, the RO navigation satellite identifier, the geographic location of the tangent point given by longitude, latitude, and height, and the retrieved atmospheric temperature, pressure, and specific humidity. The dataset provides temperature, humidity, and pressure profiles on 801 vertical levels. Key specifications and quantitative quality indicators of the YunYao GNSS-RO atmospheric profile products are listed in Table 2. The data quality metrics presented in Table 2 are supported by independent peer-reviewed validation results. Specifically, Xu et al. (2025) assessed the YunYao Y003–Y010 satellites from May to July 2023 and confirmed that the mean refractivity bias relative to ERA5 is within ±1.54% (0–40 km) and nearly zero between 4 and 40 km, with standard deviations below 3.35% [15]. Using the three-cornered hat (3CH) method, the refractivity error standard deviation is below 2.53% within 1000–10 hPa [15].

2.1.2. COSMIC-2 GNSS-RO Atmospheric Profile Data

To enable a direct performance comparison with a mature and widely recognized RO mission, this study also includes wet atmospheric temperature profile data from the COSMIC-2 constellation as a benchmark. The COSMIC-2 mission is a well-established GNSS-RO satellite program led by the University Corporation for Atmospheric Research (UCAR). It provides globally covered atmospheric profile products whose data quality has been rigorously validated and widely adopted in meteorological research and operational applications. The wet temperature profiles used in this study are extracted from the COSMIC-2 Level-2 wetPf2 product. Independent validation studies have confirmed that COSMIC-2 wet temperature profiles deliver stable and high accuracy in the troposphere and lower stratosphere, and are widely used as a reference benchmark for evaluating new RO observation systems [24]. A direct intercomparison between YunYao and COSMIC-2 temperature profiles, using the same radiosonde dataset as the common reference truth, is presented in Section 3.1.

2.1.3. Radiosonde Observations Data

The reference data for the validation are the operational radiosonde observations of the China Meteorological Administration, which feature second-level temporal sampling and very high vertical resolution. The dataset comprises operational L-band radar sounding data, together with BeiDou sounding data (containing ascending and descending segments) from stations that have passed the operational access assessment for the BeiDou sounding service. Conventional operational soundings are normally carried out twice daily at 00:00 and 12:00 UTC, while some key national stations or specific observation campaigns increase the frequency to four times daily at 00:00, 06:00, 12:00, and 18:00 UTC. In terms of observation technique, a balloon carries the radiosonde aloft to obtain the vertical profiles of pressure, temperature, humidity, wind direction, and wind speed from the troposphere to the lower and middle stratosphere. Among these elements, temperature, humidity, and pressure are measured directly by the radiosonde sensors, whereas the wind field is derived mainly from L-band radar tracking or from BeiDou satellite navigation positioning. Compared with the current operational sounding system based on L-band radar positioning, the BeiDou sounding system obtains a three-stage ascent, drift, and descent detection from a single release, which greatly improves the spatiotemporal resolution of the sounding observation. In recent years, China has promoted a comprehensive upgrade of its operational sounding system toward BeiDou sounding [25].
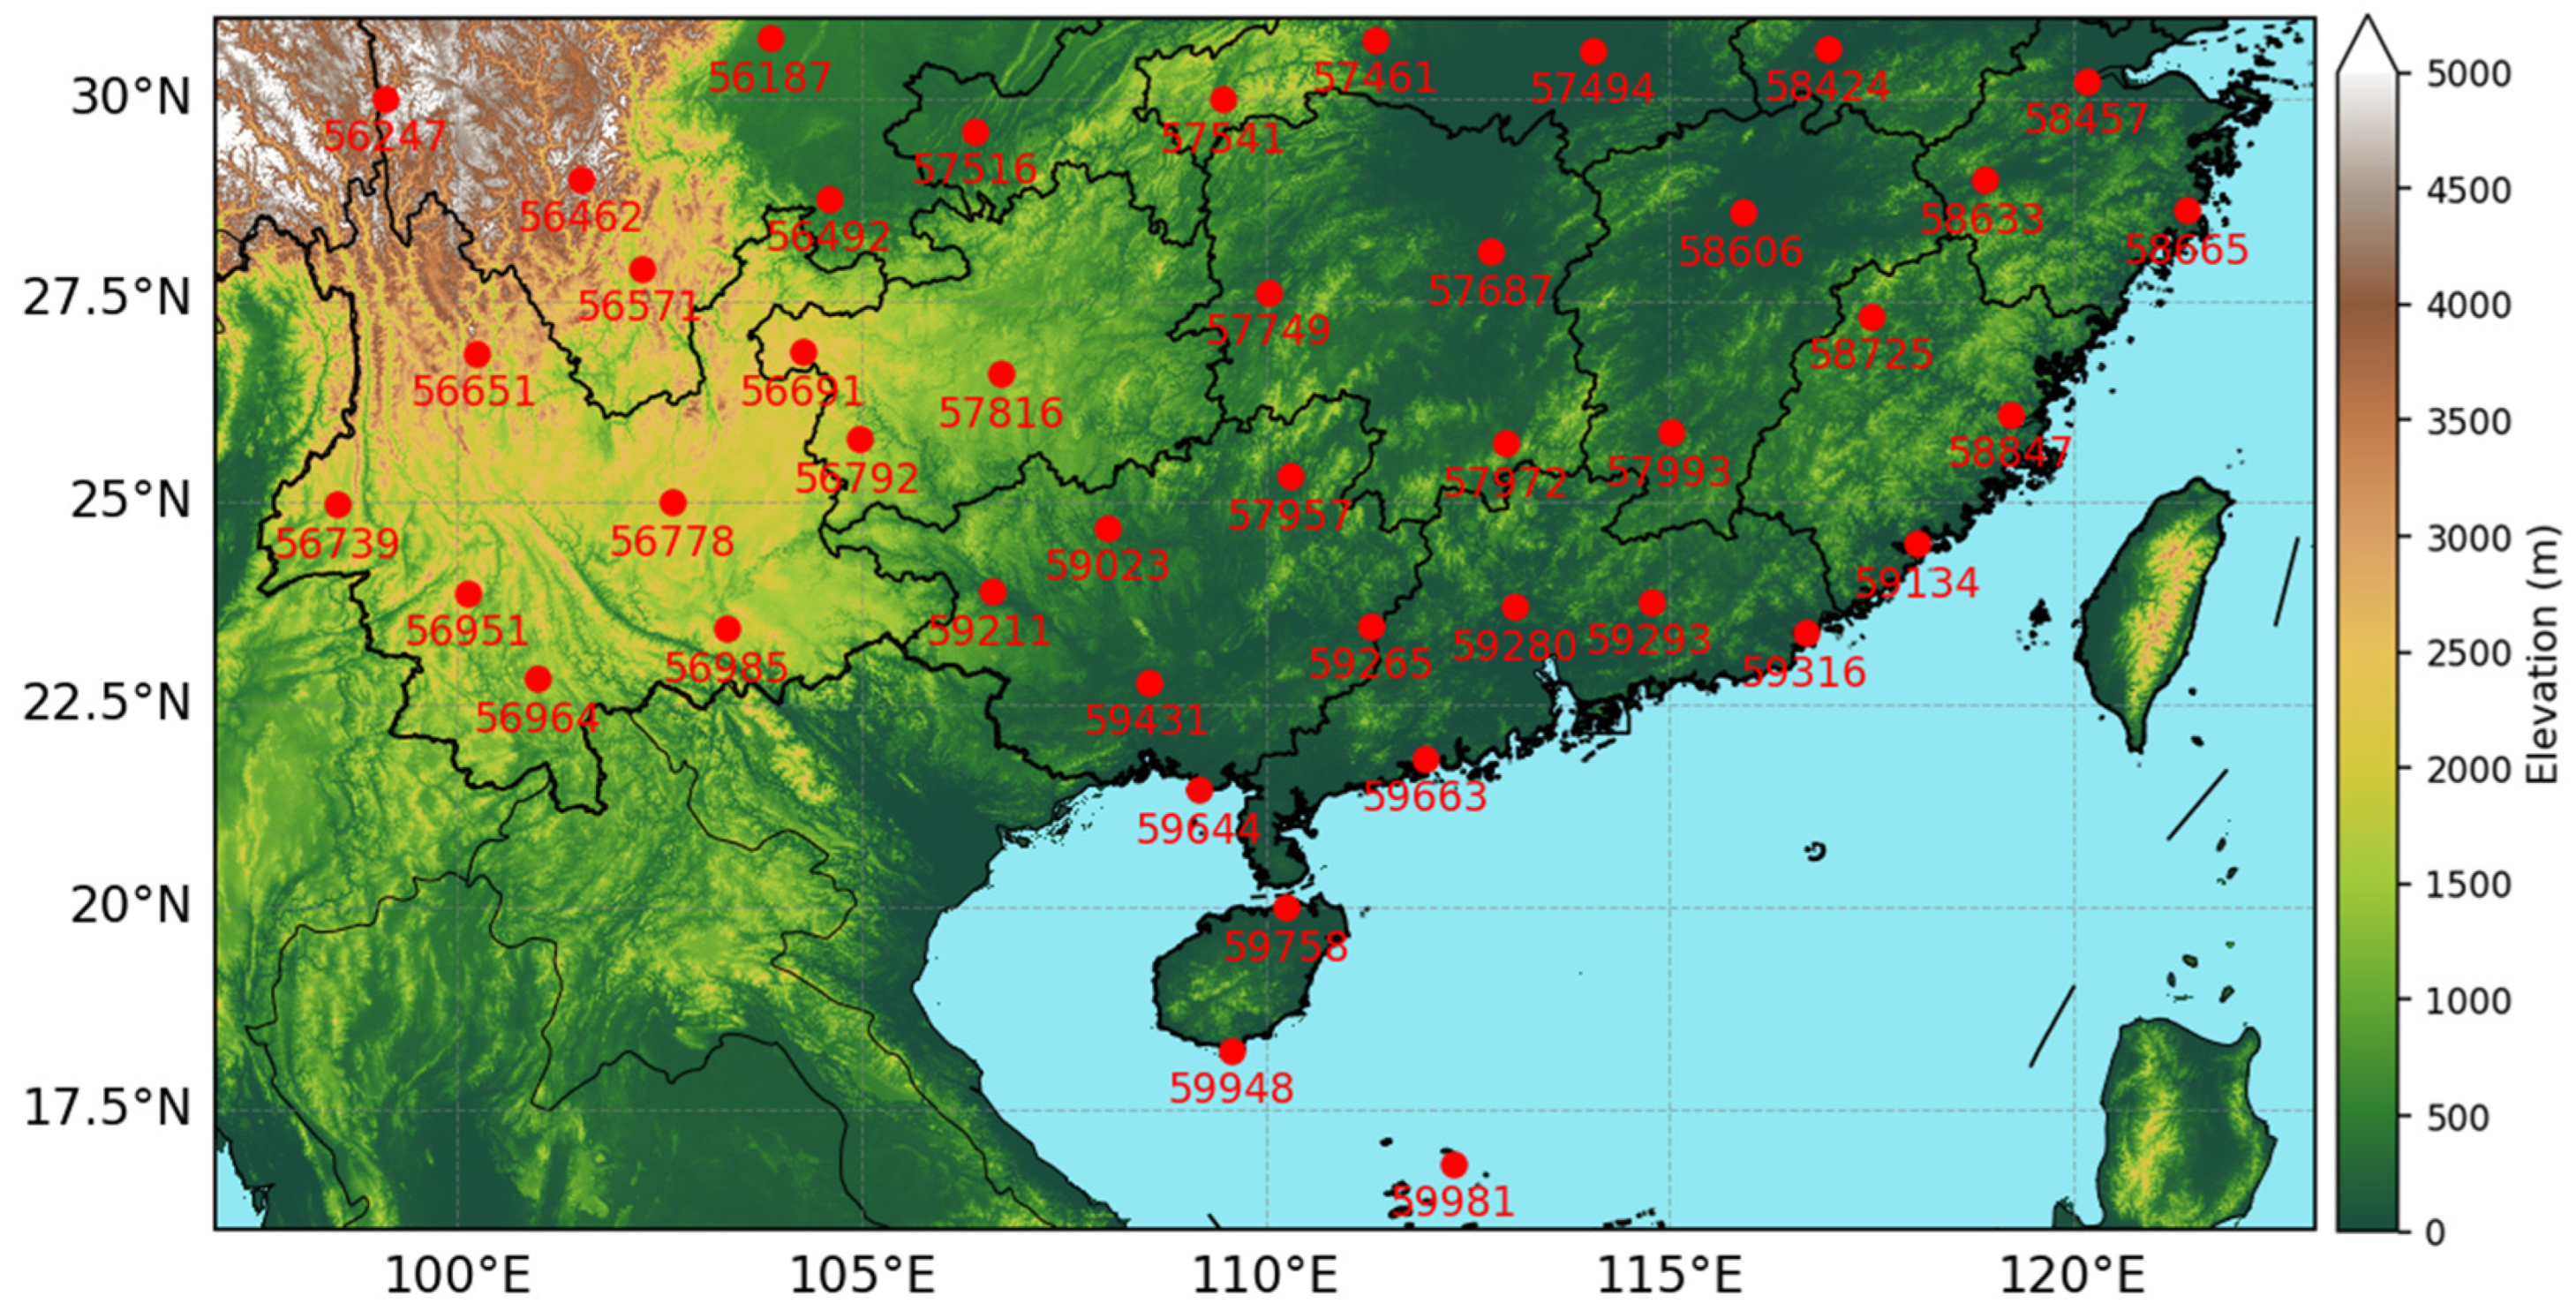
Observations from 43 national sounding stations of the China Meteorological Administration, taken twice daily at 00:00 and 12:00 UTC (Figure 1), serve as the reference for comparison and evaluation. After strict quality control that includes extreme-value checks, stuck-value checks, and hydrostatic checks [1], 12,872 valid radiosonde profiles remain for the spatiotemporal matching and data quality analysis of the YunYao temperature profiles. These radiosonde data are also used as the unified reference for the YunYao and COSMIC-2 intercomparison to ensure consistent evaluation criteria.

2.2. Spatiotemporal Matching Method and Sample Construction

2.2.1. Spatiotemporal Matching Criteria and Threshold Sensitivity Analysis

To compare the operational radiosonde data and the YunYao temperature profiles accurately, the observation time, spatial location, and vertical pressure levels of the YunYao temperature profiles are matched in space and time with the quality-controlled radiosonde data. For the temporal criterion, many existing studies adopt a time difference within ±3 h [16,23]. For the spatial criterion, the threshold is adjusted according to the geographic location and the density of the sounding network. Wang et al. (2022) match radiosonde and RO profiles within 300 km [16], and Guo et al. (2020) use 100 km in the dense eastern region and 200 km in the sparse western region [23].
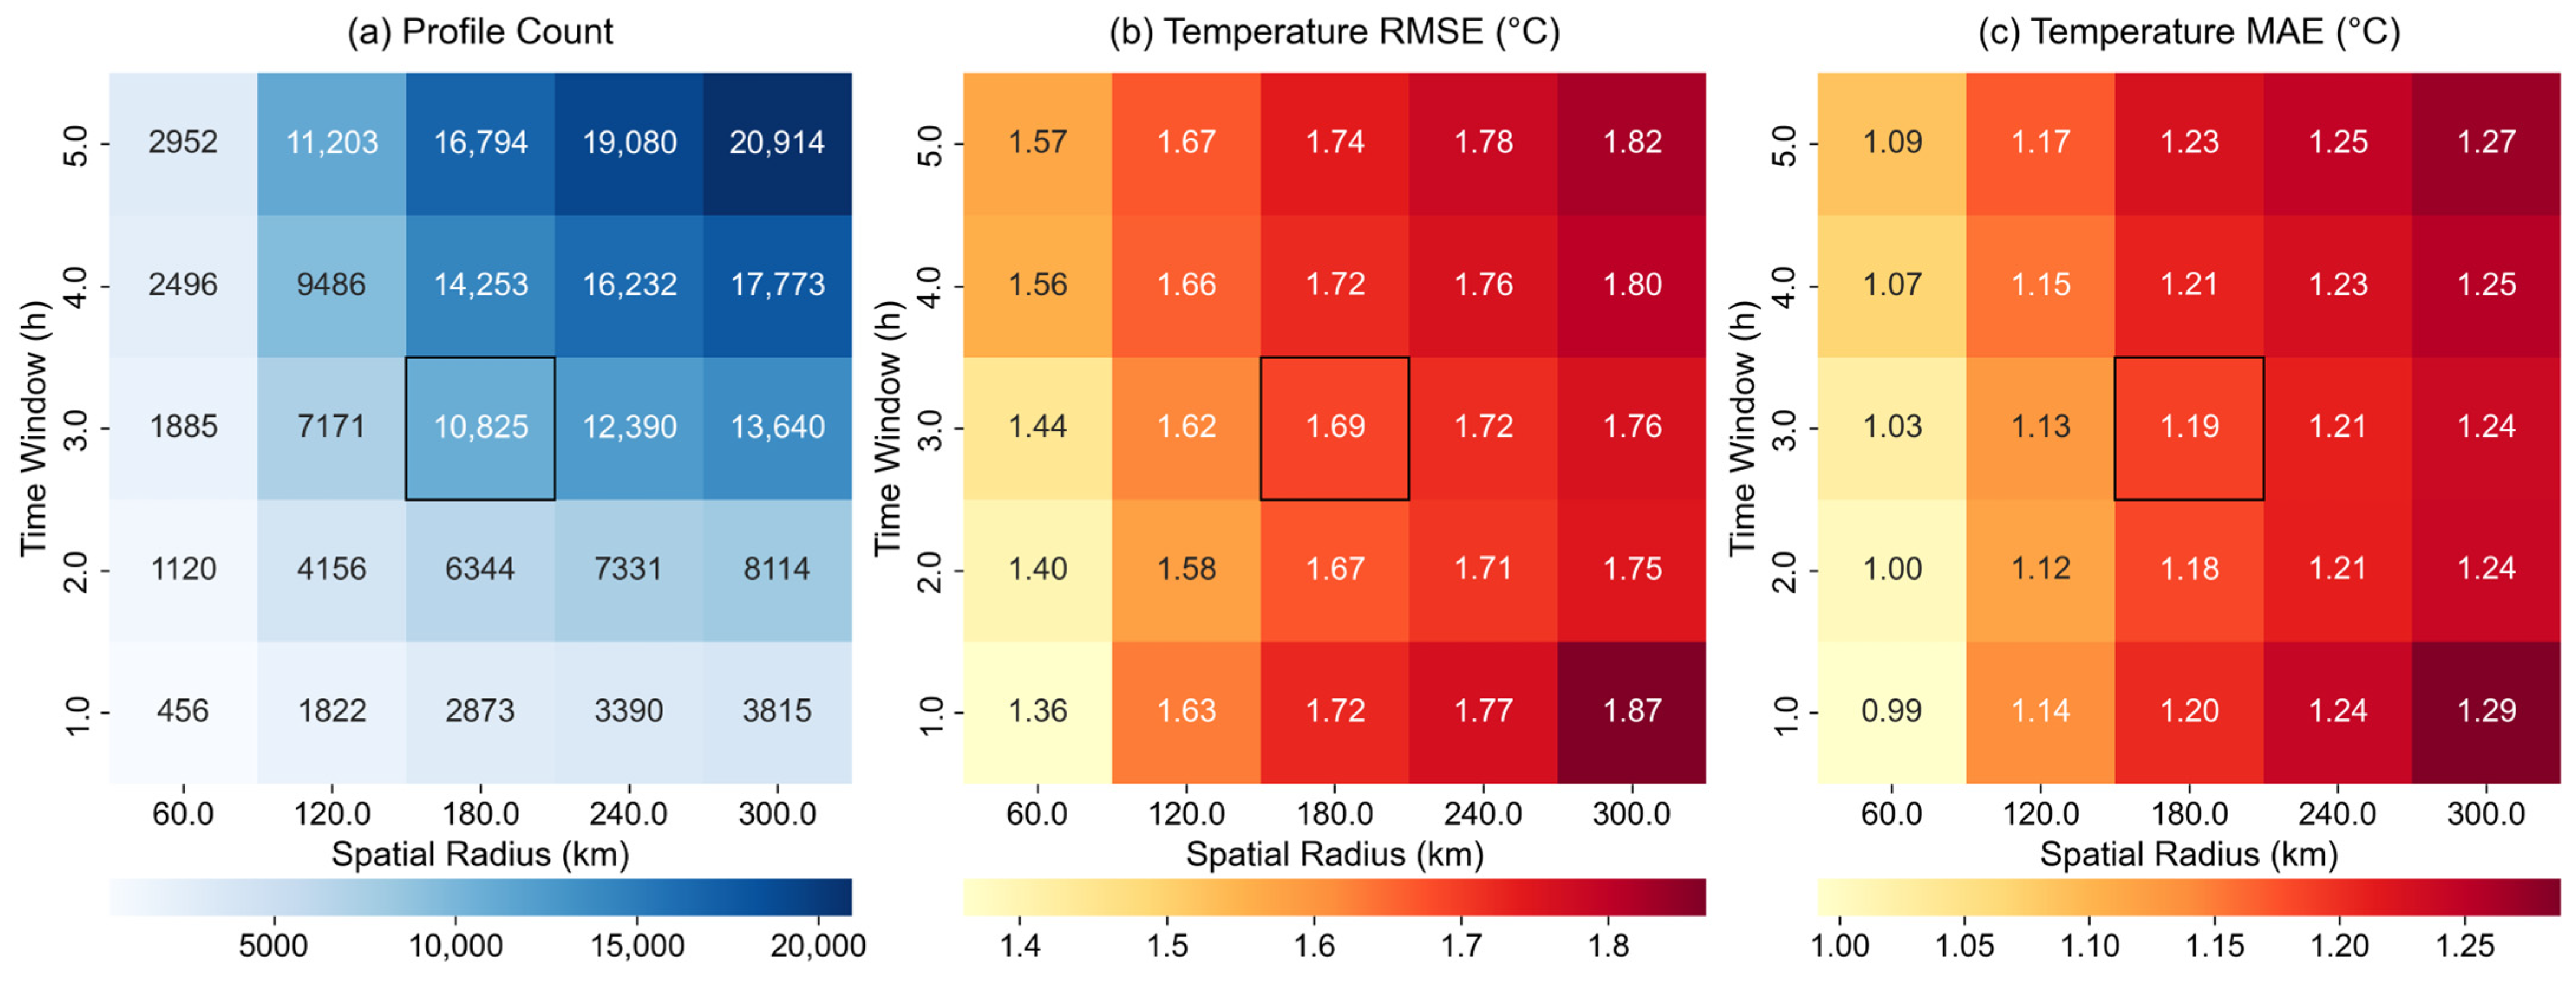
This study evaluates the YunYao temperature profiles over southern China in winter and spring, when frequent cold-air outbreaks produce sharp horizontal temperature gradients ahead of and behind cold fronts. A large matching radius then inflates the representativeness error, whereas a very small radius reduces the sample size, so the spatial threshold requires a dedicated sensitivity analysis. The YunYao temperature profiles are matched with the radiosonde data under five time windows (±1, ±2, ±3, ±4 and ±5 h) and five spatial radii (60, 120, 180, 240 and 300 km). For each combination, the number of matched profiles and the temperature RMSE and MAE over 50–1000 hPa are computed against the radiosonde data (Figure 2).
The analysis yields three findings. The matching error is more sensitive to the spatial radius than to the time window. For a fixed radius, the RMSE and MAE change little across the time windows, whereas for a fixed time window both errors increase steadily with the radius, with the RMSE rising from 1.44 °C at 60 km to 1.76 °C at 300 km under the ±3 h time window. Second, a ±3 h time window is adopted because the error is insensitive to this choice, and the time window is consistent with prior studies and retains a large sample. A radius of 180 km is adopted rather than 120 km. From 120 to 180 km, the matched profile count increases by about 51% (from 7171 to 10,825), while the RMSE rises only from 1.62 to 1.69 °C. Beyond 180 km, the marginal sample gain diminishes, and the error continues to rise to 1.76 °C. The ±3 h time window and 180 km radius therefore balance sample size against matching error.
Based on this analysis, the following criteria are adopted. For temporal screening, a ±3 h time window centered on the observation time of each YunYao temperature profile selects the radiosonde data that fall within the window. For spatial screening, a circle of 180 km radius centered on the RO tangent point further selects the radiosonde data within this range. Among all radiosonde profiles satisfying both criteria, the one with the shortest great-circle distance to the RO tangent point is selected under the spatial nearest-neighbor principle to establish the match.

2.2.2. Vertical Interpolation of the Radiosonde Profiles and Its Uncertainty

In the vertical direction, the operational radiosonde data are sampled at the second level and have a much higher vertical resolution than the GNSS-RO temperature profiles. The mean spacing between adjacent pressure levels of the radiosonde profiles is only about 6–7 m over the 50–1000 hPa range. To allow a point-to-point quantitative evaluation, linear interpolation maps the high-resolution radiosonde temperature onto the 801 pressure levels of the GNSS-RO temperature profile product. This mapping projects an ultra-high-resolution profile onto a coarser fixed grid, and the interpolation acts within a very small vertical interval, so the interpolation error is expected to be small. Considering the actual ascent height of the sounding balloon and the uncertainty of water vapor sounding in the lower stratosphere, the pressure range of 50–1000 hPa is used for the validation of the GNSS-RO temperature profile product.
The interpolation uncertainty is quantified by a Leave-One-Out (LOO) cross-validation on the radiosonde profiles. For each profile, one interior level is removed at a time. Its temperature is reconstructed by linear interpolation from the two adjacent retained levels. The difference between the reconstructed and observed values is the interpolation error at that level. Because each removal doubles the local level spacing, this test gives a conservative upper bound of the actual interpolation error at the target levels. The same interpolation is applied whenever the radiosonde profiles are mapped onto the pressure levels of the satellite occultation products, so this error estimate applies directly to the matched product.
Table 3 reports the results by pressure band. The mean adjacent-level spacing is about 6 m in all bands. The bias magnitude is below 0.001 °C, so no systematic offset is introduced. The MAE is at or below 0.010 °C, and the RMSE is at or below 0.022 °C in every band. The interpolation error stays small even near sharp thermal gradients. In the tropopause region (100–250 hPa), the RMSE is 0.014 °C. At the top of the boundary layer (850–1000 hPa), the RMSE is 0.022 °C. The upper-tail error is also small. For 99% of the test levels, the absolute error is below 0.084 °C in the lower stratosphere and below 0.055 °C over the whole range, which shows that levels at sharp gradients also retain a small error. Over the whole 50–1000 hPa range, the MAE is 0.007 °C, and the RMSE is 0.017 °C. These values are more than one order of magnitude smaller than the YunYao–radiosonde temperature differences reported in Section 3.3, so the linear interpolation introduces a negligible uncertainty into the validation.

2.2.3. Matched Sample Construction and Temporal Selection Rationale

The identical spatiotemporal matching criteria and vertical interpolation procedure described in Section 2.2.1 and Section 2.2.2 are applied to both the YunYao and COSMIC-2 temperature profiles to ensure consistent and comparable validation conditions. Following this procedure, both sets of GNSS-RO temperature profiles and the operational radiosonde data over southern China (97–123°E, 17–31°N) from 1 November 2025 to 31 March 2026, 151 days in total, are processed, which yields 10,825 spatiotemporally matched YunYao–radiosonde temperature profile pairs. The same protocol yields 2207 matched COSMIC-2–radiosonde profile pairs, which serve as an independent reference for the intercomparison analysis in Section 3.1.
The boreal winter and early spring period is selected for validation for two main scientific reasons. According to publicly available monitoring results from the National Climate Center of the China Meteorological Administration, this period falls within the non-flood season over southern China. Compared with the May–September rainy season, the non-flood season features substantially lower atmospheric water vapor loading and weaker convective activity, which reduces the interference of water vapor on temperature retrieval and enables a cleaner quantification of the baseline accuracy of GNSS-RO temperature profiles. In addition, frequent cold-air outbreaks in this season produce sharp horizontal and vertical temperature gradients ahead of and behind cold fronts, providing conditions to evaluate the product performance under strong synoptic forcing.
To examine the diurnal variation in product accuracy, daytime and nighttime are classified using the Solar Zenith Angle (SZA) at each occultation tangent point. The SZA is the angle between the incident solar beam and the local zenith, computed from the tangent-point coordinates and observation time using standard solar-position algorithms. Profiles with SZA ≤ 96° are classified as daytime, and those with SZA > 96° as nighttime. This threshold corresponds to civil twilight, defined as the interval when the sun lies within 6° below the geometric horizon. The physical basis for this 6° criterion was established in early systematic studies of twilight duration and intensity [26] and remains a widely adopted convention in atmospheric and solar research (U.S. National Weather Service). Under this classification, the 10,825 YunYao–radiosonde pairs are divided into a daytime group of 4644 pairs and a nighttime group of 6181 pairs, and the 2207 COSMIC-2–radiosonde pairs are divided into a daytime group of 1115 pairs and a nighttime group of 1092 pairs. Both datasets are evaluated separately for each period.
Two sample definitions are used for both RO datasets. The profile-pair definition, which takes the number of matched profile pairs as the basic unit and supports the data volume and benchmark analysis. The level-by-level matched-point definition treats the temperature point pair on each pressure level of every profile pair as a sample and supports the scatter and error statistics. Because each profile pair contains multiple valid pressure levels, the total number of level-by-level matched points is far larger than the number of matched profile pairs, and this difference in magnitude is expected.

2.3. Quality Analysis and Evaluation Method

For each pair of data satisfying the spatiotemporal matching criteria, B denotes the operational radiosonde data, O denotes the YunYao temperature profile data, N is the total number of samples, and i is the sample index. The following statistical evaluation metrics are used.
Mean Bias (MB):
M B = 1 N i = 1 N O i B i
Mean Absolute Error (MAE):
M A E = 1 N i = 1 N O i B i
Root Mean Square Error (RMSE):
R M S E = 1 N i = 1 N O i B i 2
Correlation Coefficient (R):
R O i , B i = cov O i , B i V a r O i V a r B i
where Cov(O, B) is the covariance of O and B, Var(O) and Var(B) are the variances of O and B, respectively, and the coefficient of determination R 2 is the square of the correlation coefficient R.
Normalized Contoured Frequency by Altitude Diagrams (NCFAD):
The metrics above give only one-dimensional results and can hardly avoid problems such as highly localized systematic bias or error amplification at specific pressure levels. This study therefore introduces the normalized contoured frequency by altitude diagrams (NCFAD) to describe the two-dimensional frequency distribution of the bias in the vertical direction, which allows a quantitative evaluation of the accuracy of the YunYao wet atmospheric temperature profile product [3]. The temperature bias obtained by subtracting the operational radiosonde from the YunYao data is binned at each pressure level; the occurrence frequency of each bias interval at that level is counted, and the frequency is normalized by the total number of samples at that level to give the relative frequency of each bias interval. The normalized frequency is then displayed on the height-bias plane with a color scale or contours, which reveals the bias concentration zones, the width of the bias distribution, and their vertical variation at different heights.

3. Results

3.1. Data Volume and Benchmark Comparison of YunYao Temperature Profiles Against COSMIC-2

This section provides an overall, layer-averaged benchmark of YunYao against COSMIC-2 and the radiosonde reference.
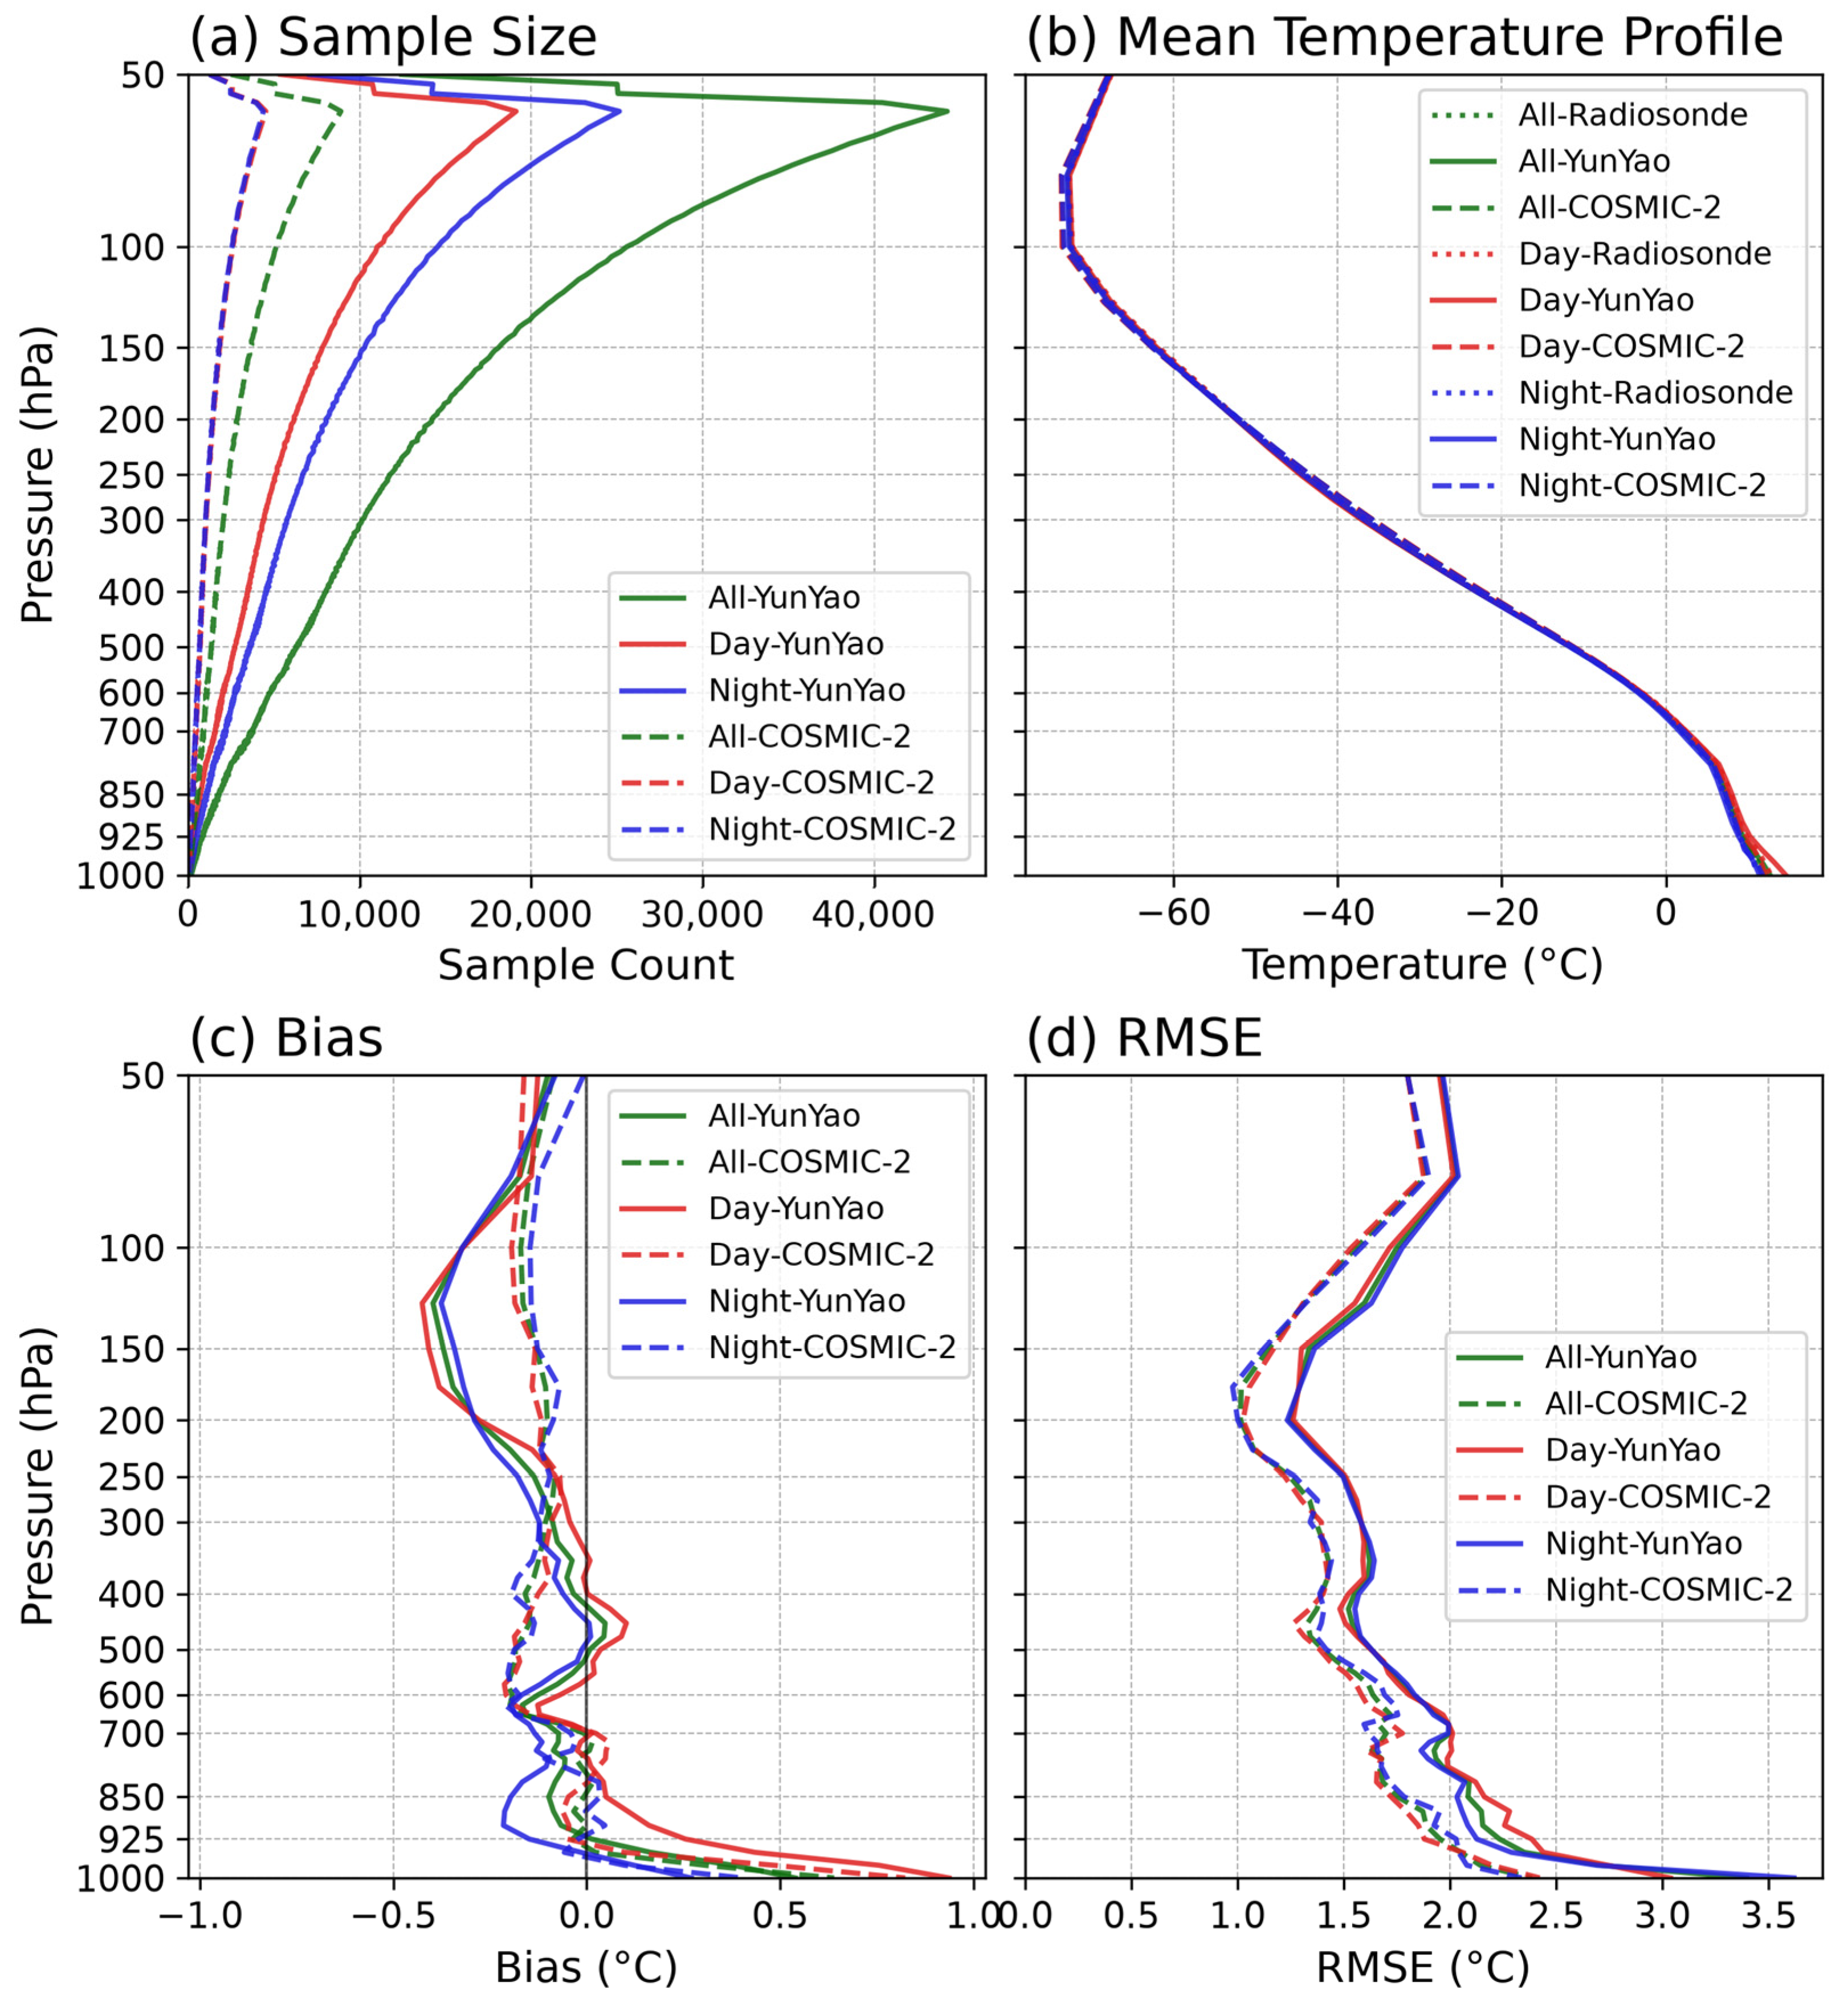
Figure 3a shows the level-wise sample size of YunYao and COSMIC-2 temperature profiles as a function of pressure height over southern China and distinguishes the three groups of all samples, daytime, and nighttime. The sample number increases steadily from the near surface upward, reaches a maximum near 70 hPa, and then levels off in the lower stratosphere, which reflects the detection advantage and higher vertical sampling density of this dataset in the middle and upper troposphere. Below 700 hPa, the sample number drops sharply as height decreases. This typical inverted-cone distribution arises mainly because abundant water vapor in the lower atmosphere causes sharp changes in the vertical gradient of refractivity, which induce multipath effects and signal interference and limit the effective penetration depth of RO sounding near the surface. At every level, however, the sample size of YunYao clearly exceeds that of COSMIC-2. Summed over the whole matched dataset (Table 4), the level-by-level matched points of YunYao (N = 3,922,165) are about 4.77 times those of COSMIC-2 (N = 821,207); this relative advantage is largest in the upper and middle troposphere, about 4.97 times within 50–300 hPa, and narrows toward the surface, to about 2.91 times within 925–1000 hPa. This difference is expected because YunYao operates a considerably larger satellite constellation than COSMIC-2, which yields a substantially higher observation density over the same domain and time window.
In terms of diurnal behavior, the cumulative sample numbers of daytime (N = 1,688,107) and nighttime (N = 2,234,058) YunYao matched points are broadly comparable, and the shapes of their vertical distribution curves remain highly consistent. The vertical detection capability of the YunYao RO signal is therefore governed mainly by the thermodynamic state of the atmospheric background field rather than by solar illumination, which gives stable all-weather detection performance. The same day–night consistency is also found for COSMIC-2 (Table 4).
Figure 3b further compares the mean temperature profile of YunYao and COSMIC-2 with the collocated operational radiosonde. The three curves are nearly indistinguishable from 1000 to 50 hPa in all three subsets, and both RO datasets closely reproduce the tropopause inversion and the overall lapse-rate structure of the mean temperature profile. Temperature itself varies by close to 80–90 °C across this vertical range, from below −60 °C near the tropopause to above 10 °C near the surface, so the resulting coefficient of determination for both YunYao (R2 = 0.883–0.983) and COSMIC-2 (R2 = 0.919–0.988, Table 4) is dominated by this large-scale vertical trend rather than by the point-to-point scatter. A value close to unity is therefore an expected consequence of the wide dynamic range of the sample and should not, by itself, be read as evidence of high pointwise precision; the bias and RMSE, which retain the physical unit of temperature, are used below as the primary accuracy metrics.
Table 4 and Figure 3c,d summarize the MB and RMSE of YunYao and COSMIC-2 relative to the radiosonde reference within four representative layers. The mean bias of both datasets is small, generally below 0.3 °C in magnitude for YunYao (up to −0.247 °C at 50–300 hPa) and below 0.2 °C for COSMIC-2 (up to 0.151 °C at 300–700 hPa); COSMIC-2 shows a marginally smaller bias magnitude than YunYao in three of the four layers (50–300, 700–925, and 925–1000 hPa), whereas YunYao shows a smaller bias than COSMIC-2 in the 300–700 hPa layer, so neither dataset holds a systematic advantage in bias across the whole profile. The RMSE of the two datasets is close within 50–700 hPa, about 1.652–1.675 °C for YunYao and 1.451–1.478 °C for COSMIC-2, a difference of only about 0.2 °C. Within 700–925 hPa, the RMSE of both datasets increases moderately, to 2.008 °C for YunYao and 1.717 °C for COSMIC-2, and within 925–1000 hPa it increases further, to 2.515 °C for YunYao and 2.091 °C for COSMIC-2, while the bias of both datasets also turns positive (0.214 °C for YunYao and 0.140 °C for COSMIC-2, all-sample), consistent with the well-documented degradation of RO retrievals in the moist, strongly inhomogeneous boundary layer, including near-surface multipath effects and the breakdown of the spherical symmetry assumption. Overall, the RMSE of YunYao is systematically 0.201–0.424 °C higher than that of COSMIC-2, with the smallest gap in the free troposphere and the largest gap near the surface. Because COSMIC-2 is a mature, extensively validated RO mission, these results indicate that the accuracy of YunYao is broadly comparable to COSMIC-2 in the free troposphere and only modestly lower near the boundary layer, supporting the reliability of YunYao as a viable, higher-density complement to existing RO constellations over southern China.
The diurnal comparison shows a broadly consistent pattern for both datasets. The RMSE and the bias magnitude at nighttime are slightly higher than in the daytime at most levels, most noticeably near the surface (Table 4), but the difference remains modest and does not change the overall accuracy ranking between YunYao and COSMIC-2. The YunYao temperature profiles therefore describe the vertical temperature structure over southern China fairly reliably within 50–925 hPa, at an accuracy level broadly comparable to the established COSMIC-2 mission, whereas the observation uncertainty of both datasets within 925–1000 hPa is larger and warrants appropriate weighting or constraint in specific applications.

3.2. Layer-Resolved Bias Structure of YunYao Temperature Profiles Against Operational Radiosonde Data

Section 3.1 establishes that, in a layer-averaged sense, YunYao reproduces the mean vertical temperature structure over southern China at an accuracy broadly comparable to COSMIC-2. Building on that benchmark, this section moves from the profile mean to the point-by-point level and characterizes the error structure of YunYao alone, so as to resolve how its systematic bias and random error distribute within each pressure layer and along the vertical, without further reference to COSMIC-2.
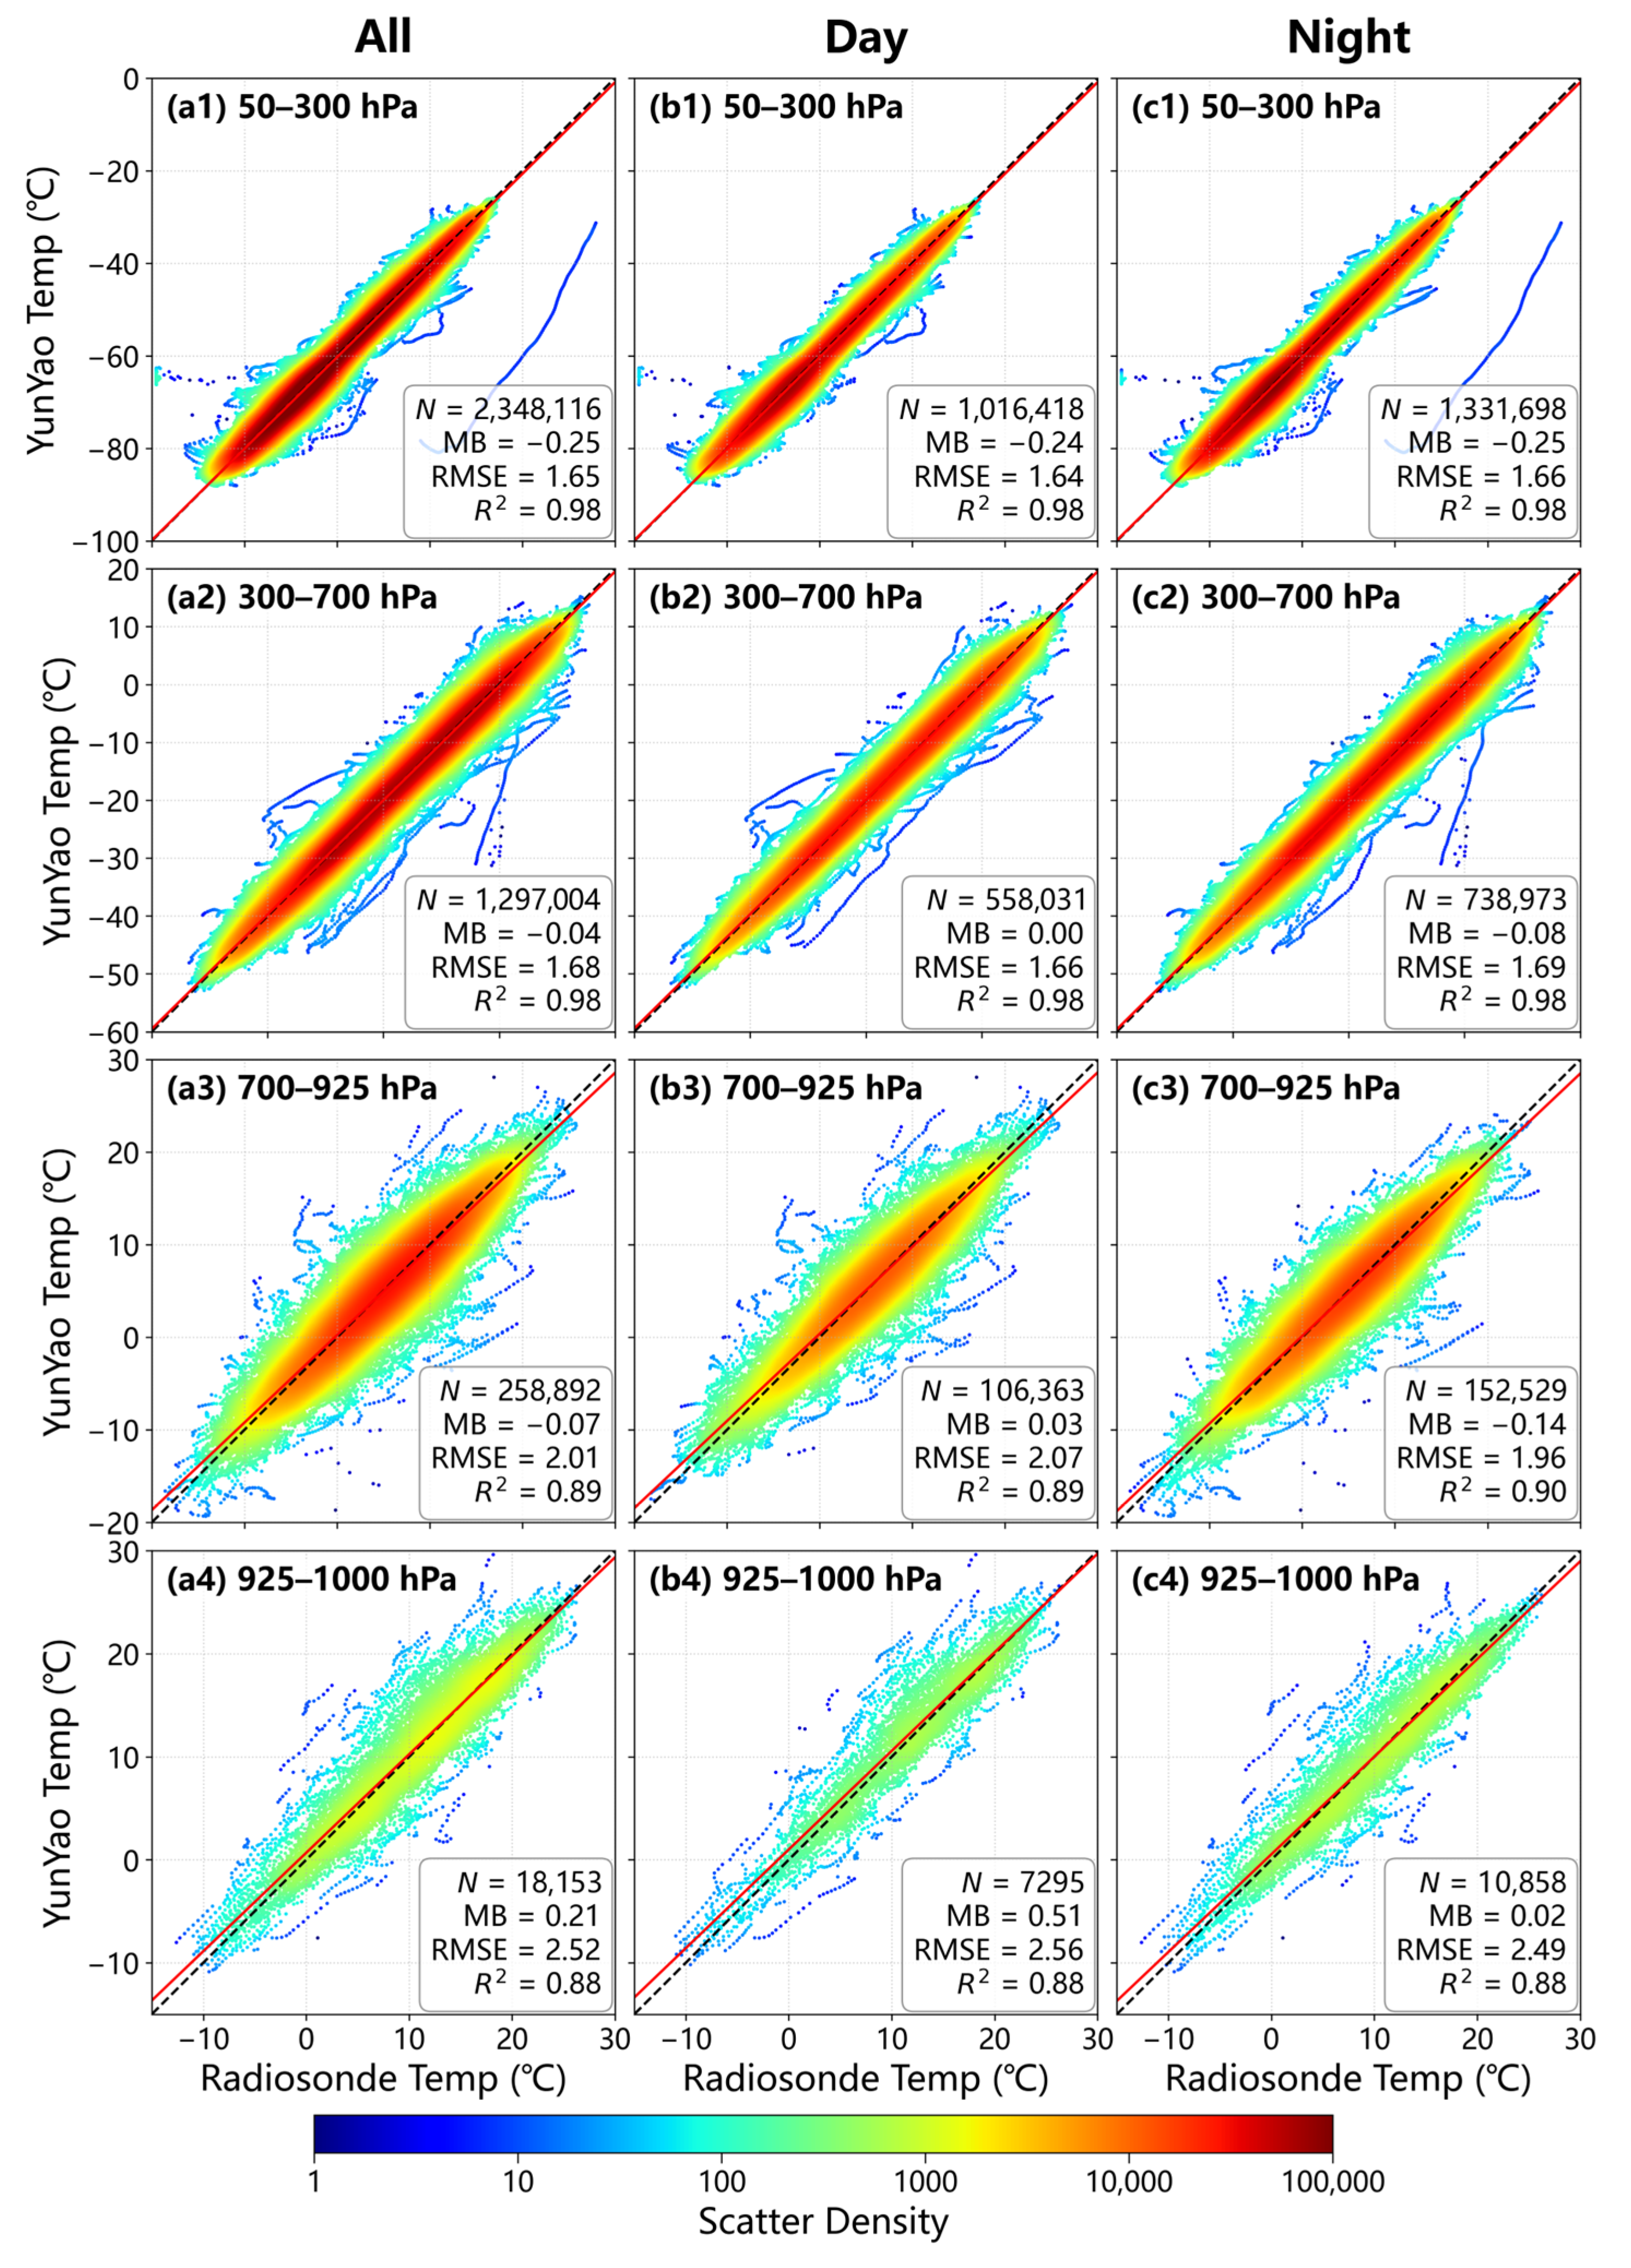
Figure 4 presents the level-by-level scatter density of YunYao versus the collocated radiosonde temperature, stratified into four pressure layers by row and three temporal subsets by column. In the two upper layers, 50–300 and 300–700 hPa, the density maximum aligns tightly along the 1:1 diagonal, and the regression fit nearly coincides with it, with a coefficient of determination of 0.98 and an RMSE close to 1.65 and 1.68 °C. The mean bias is weakly negative and shrinks from −0.25 °C at 50–300 hPa to only −0.04 °C at 300–700 hPa, so YunYao carries a slight cold bias in the upper troposphere and lower stratosphere that becomes nearly negligible in the free troposphere. Because this systematic component is far smaller than the random error, the accuracy in these two layers meets operational requirements. Toward the lower troposphere, the scatter broadens markedly. At 700–925 hPa, the RMSE rises to 2.01 °C, and the coefficient of determination drops to 0.89; at 925–1000 hPa, the RMSE reaches 2.52 °C with a coefficient of determination of 0.88, while the point cloud fans out roughly symmetrically about the diagonal and a limited number of outliers appear. The mean bias also reverses sign in the lowest layer, turning positive to 0.21 °C, consistent with the boundary layer degradation of radio occultation retrievals discussed in Section 3.1. The concurrent decline of the coefficient of determination partly reflects the narrower temperature dynamic range within these near-surface layers, following the same caveat noted in Section 3.1, so it should be read together with the RMSE rather than as an independent accuracy loss.
The diurnal contrast stays small across the profile. In the two upper layers, the nighttime RMSE exceeds the daytime value by less than 0.03 °C; for example, 1.66 against 1.64 °C at 50–300 hPa, the bias differs by no more than 0.02 °C, and the correlation metrics are identical. The differences are mixed in sign at lower levels, since the nighttime RMSE at 700–925 hPa is even slightly smaller than the daytime one, 1.96 against 2.07 °C. The only appreciable diurnal signal appears at 925–1000 hPa, where the daytime positive bias of 0.56 °C is larger than the nighttime value of 0.02 °C, and the daytime RMSE of 2.56 °C marginally exceeds the nighttime value of 2.49 °C. No systematic bias reversal or clear diurnal dependence emerges over the bulk of the profile, which indicates that the YunYao retrieval and its radiative transfer correction remain temporally stable over southern China.
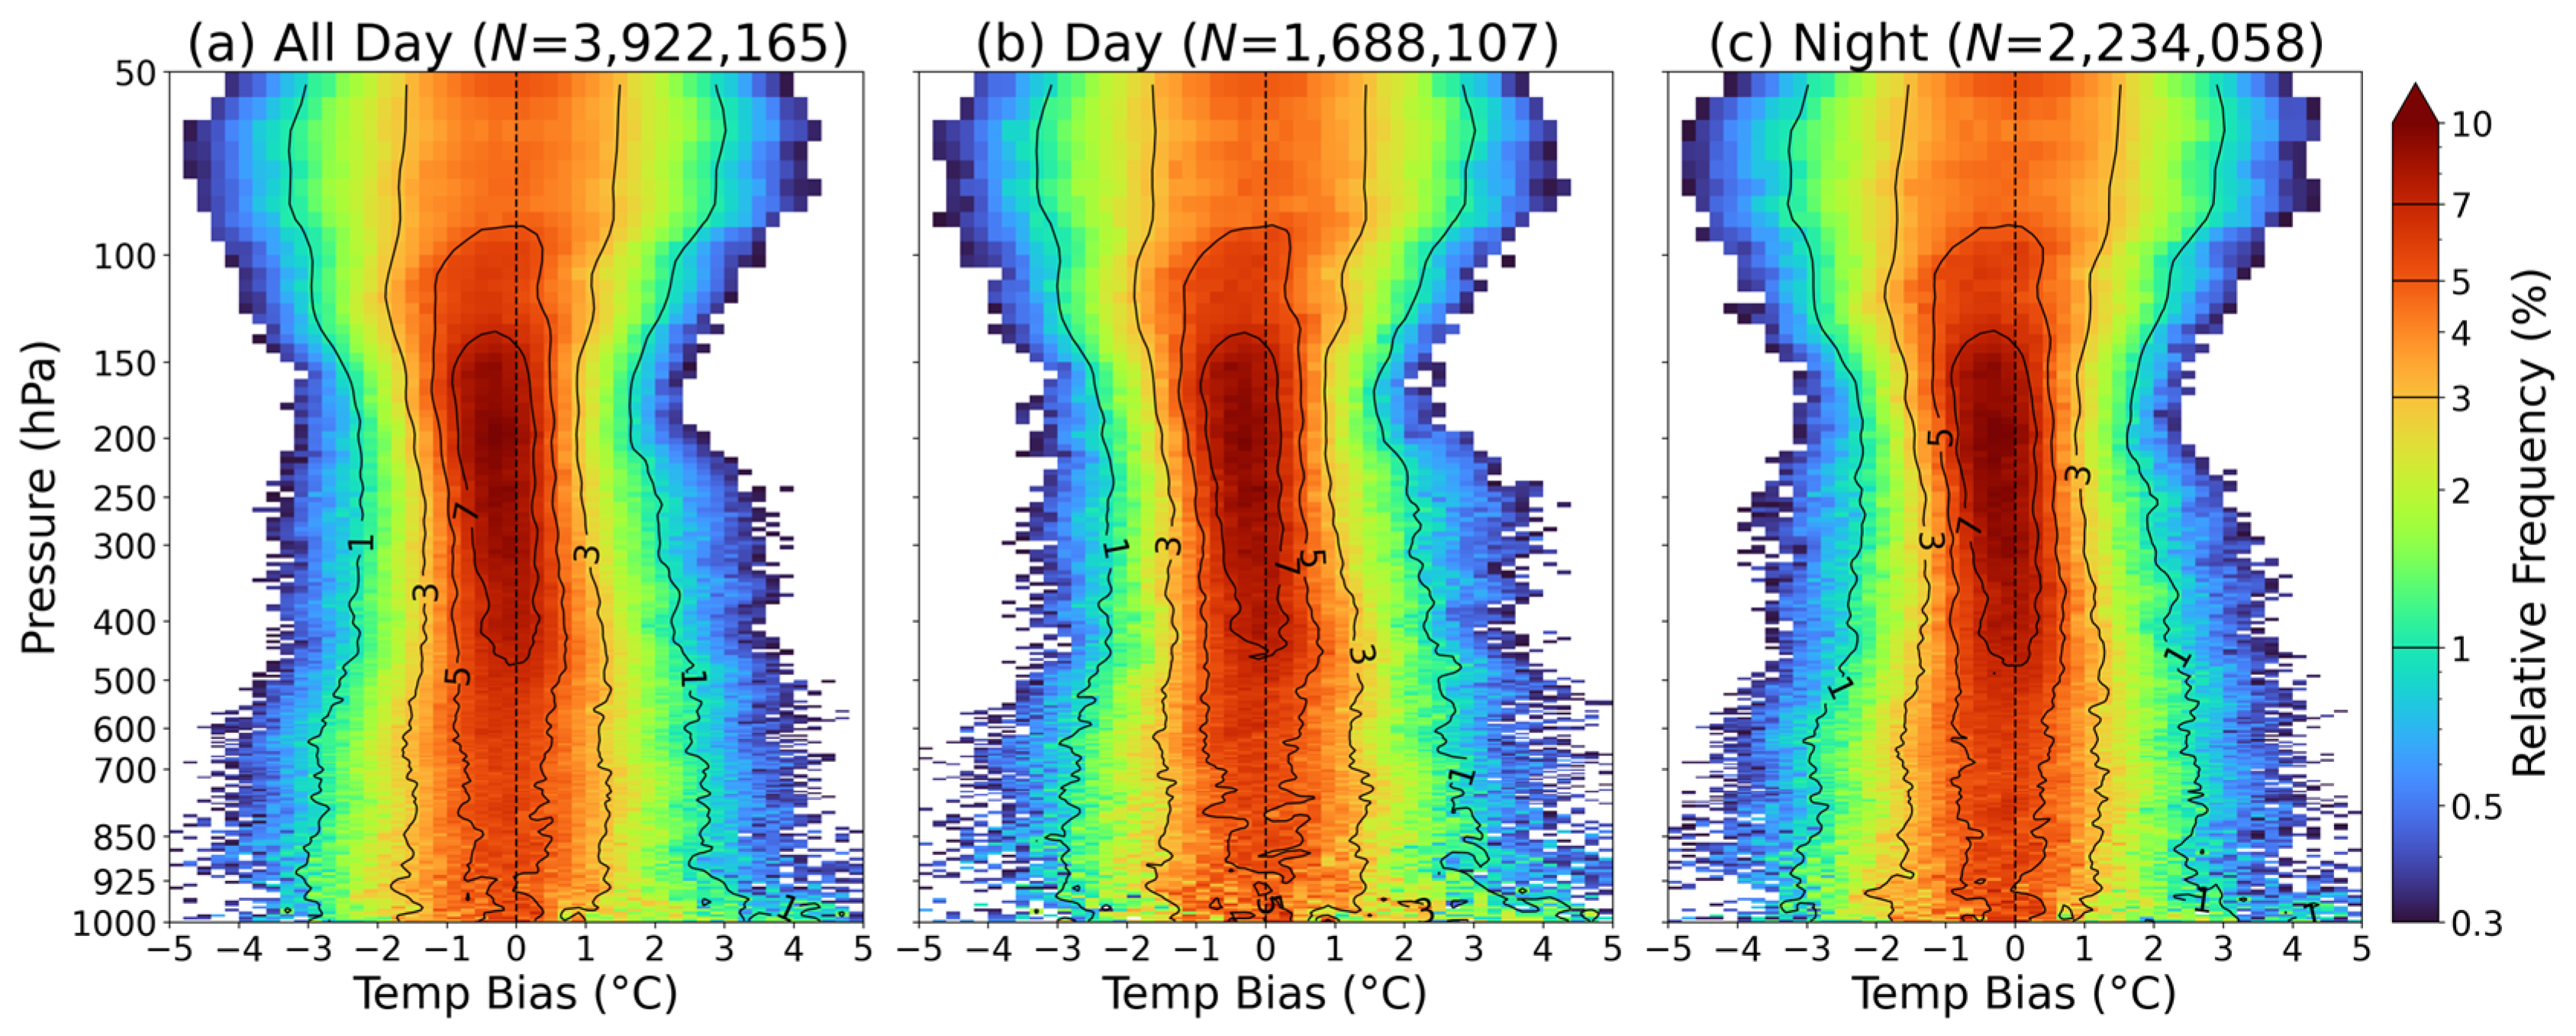
Figure 5 recasts the same comparison as a normalized contoured frequency by altitude distribution, making the vertical evolution of the bias explicit. For all samples in Figure 5a, the high-frequency core concentrates within 150–500 hPa and forms a narrow single peak confined to roughly −1.0 to 0.5 °C, which confirms the tight agreement of the two upper layers seen in the scatter density and the vertically continuous but limited cold underestimation in the middle and upper troposphere. Below about 700 hPa, the frequency band widens, its positive and negative tails extend, and a few long tails beyond ±4 °C appear, mirroring the RMSE increase toward the surface. The central axis of the distribution stays close to zero throughout, so the low-level degradation is dominated by enhanced random dispersion rather than a height-dependent systematic drift. This agrees with existing radio occultation and satellite temperature assessments that attribute near-surface accuracy loss to the complex refractivity structure of the moist lower atmosphere and to near-surface multipath interference on signal propagation.
The daytime distribution in Figure 5b and the nighttime distribution in Figure 5c share the same single-peak weak cold bias structure within 150–300 hPa, with nearly coincident peak positions. The daytime iso frequency band is marginally more contracted, implying slightly smaller random error at the upper levels, whereas the nighttime band widens a little and its tails lengthen in a few height ranges, yet no new systematic bias mode appears. In the lowest layers, both subsets show the same basal broadening and near-symmetric diffusion about the zero axis, which indicates that the near-surface random error enhancement is governed by the observation geometry and the boundary layer structure rather than by diurnal radiative differences.

3.3. Spatial Distribution and Monthly Evolution of the Temperature Bias Between YunYao Profiles and Operational Radiosonde Data

The preceding sections describe the layer-averaged and vertical error structures of YunYao without spatiotemporal decomposition. This section further examines land–sea and monthly variations in the bias to locate error concentration and verify the stability of the systematic component. As the 151-day period (November 2025–March 2026) cannot be split into standard meteorological seasons, monthly analysis is adopted for finer temporal resolution and to capture the winter to early spring transition.
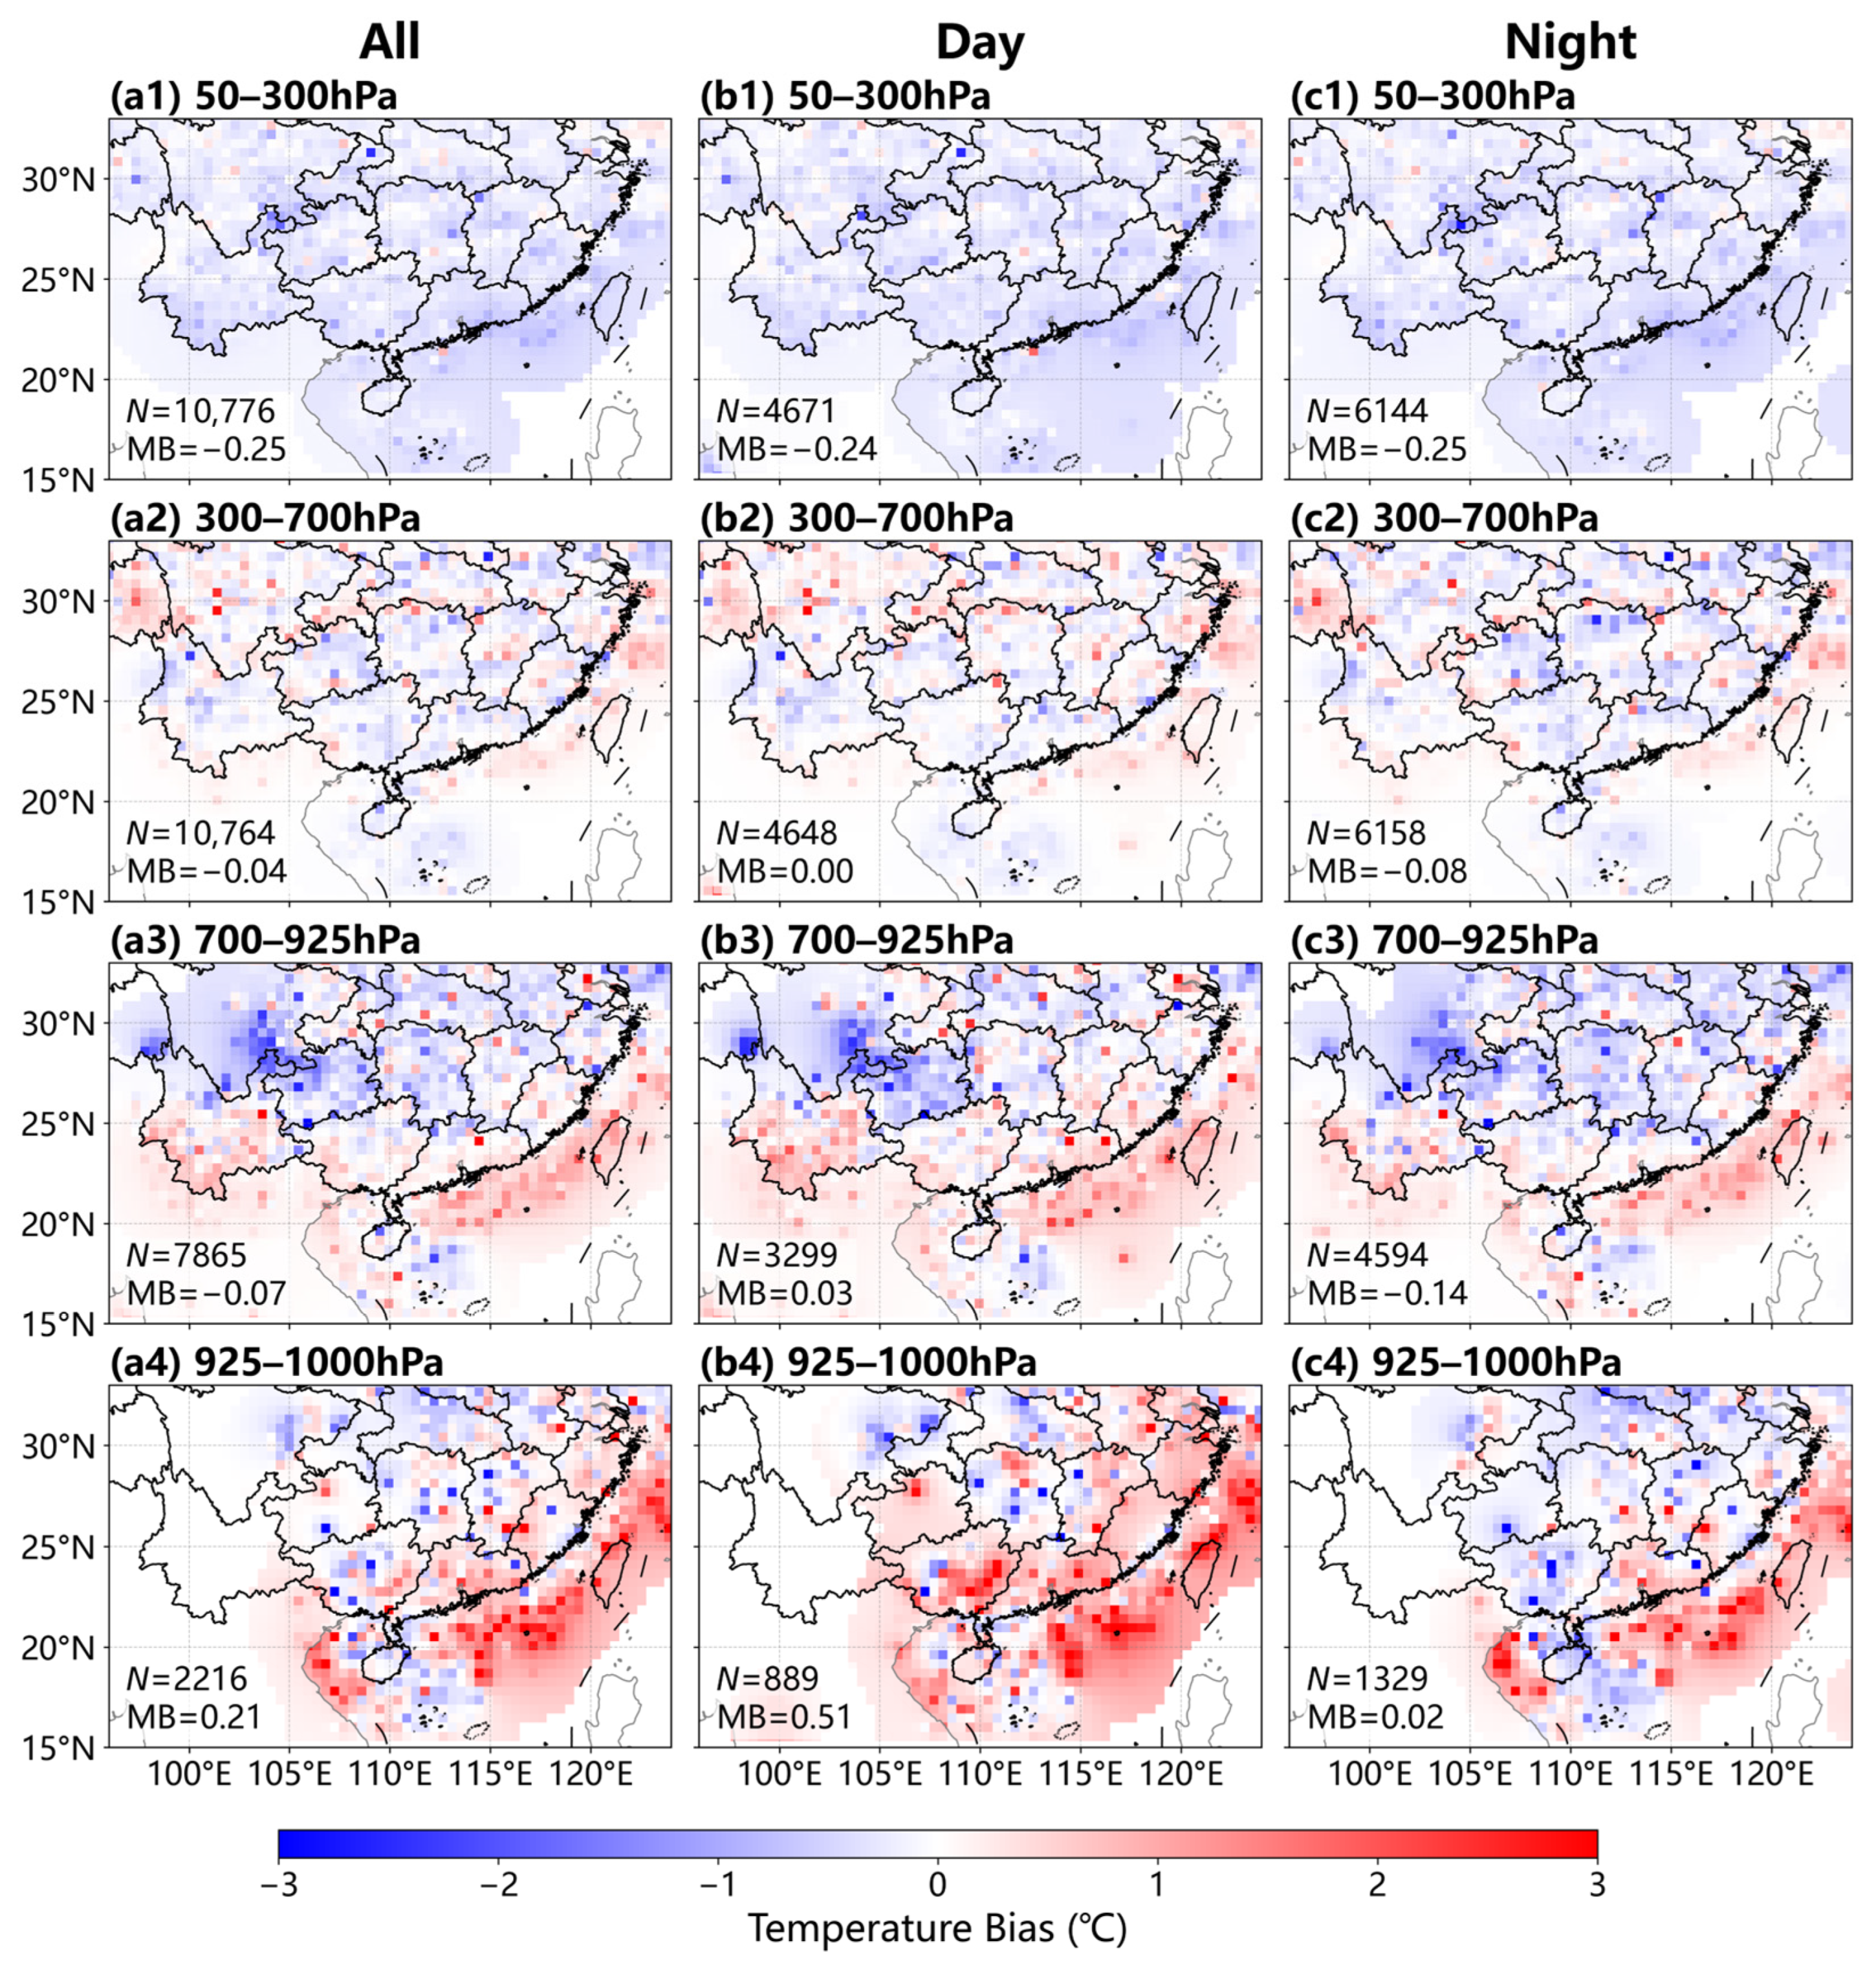
The spatial fields presented in this section are constructed on a regular 0.4° × 0.4° longitude–latitude grid, rather than plotted directly at raw match-up coordinates. Each YunYao–radiosonde pair is geolocated at the GNSS radio-occultation tangent point, not at the fixed position of the radiosonde station, and tangent points from repeated occultation events at the same physical site exhibit small positional drifts. Within each pressure layer and temporal subset, all records sharing the same profile identifier (occultation event and time) are first averaged to obtain a single representative point per profile. To prevent spatially proximate profiles from receiving disproportionate weight in the interpolation, these profile-level points are subsequently declustered on a 0.4° × 0.4° grid, the same resolution as the output/interpolation grid. All profile points within a grid cell are assigned equal weight when computing the cell-average bias, regardless of how many profiles fall within that cell, following standard geostatistical practice for spatially clustered sampling data. The declustered cell centroids are interpolated onto the 0.4° grid using Inverse-Distance Weighting (IDW) with a power parameter of 2. Grid points located more than 2.5° from the nearest valid centroid are masked to avoid excessive extrapolation into data-sparse regions.
Because the number of profile-level points is large, their locations are not marked on the maps in order to avoid obscuring the spatial pattern of the bias field. In each panel, N denotes the total number of matched profiles within the corresponding pressure layer and temporal subset, and MB denotes the overall mean bias computed from all raw YunYao–radiosonde match-up samples in that subset, before any spatial averaging or declustering, consistent with the layer-averaged statistics reported elsewhere in the manuscript.
Figure 6 maps the mean temperature bias of YunYao relative to the collocated radiosonde within the four pressure layers for the all-sample, daytime, and nighttime subsets, and the bias field exhibits a clearly tiered vertical organization. Within 50–300 hPa, the bias is a spatially uniform weak cold bias, with a domain mean of −0.25 °C for all samples, and the daytime (−0.24 °C) and nighttime (−0.25 °C) patterns are nearly identical, indicating negligible diurnal dependence at this level. Within 300–700 hPa, the mean bias is close to zero, −0.04 °C for all samples, and the field breaks into small-scale alternating positive and negative patches without a coherent large-scale structure, which indicates that the middle troposphere error is essentially random rather than systematic. A modest day–night contrast nonetheless emerges, with the bias near zero in the daytime (0.00 °C) and weakly negative at night (−0.08 °C). From 700 hPa downward, an organized regional structure emerges together with a more pronounced diurnal signal. Within 700–925 hPa, an isolated cold center is centered over the Sichuan Basin, while southern coastal areas and the adjacent sea carry a warm bias, and the domain mean bias reverses sign between daytime (0.03 °C) and nighttime (−0.14 °C). Within 925–1000 hPa, the near-surface warm bias over the coastal and offshore waters strengthens markedly and controls the domain mean, which reaches 0.21 °C for all samples. The diurnal asymmetry is most prominent at this level, as the daytime mean bias rises to 0.51 °C, whereas the nighttime mean bias falls to only 0.02 °C, indicating that solar heating of the coastal and marine boundary layer substantially amplifies the near-surface warm bias during the day. This land–sea contrast, together with the level-dependent diurnal signal, reflects the different refractivity structures of the moist marine boundary layer and the drier, terrain-influenced continental boundary layer, and it identifies the near surface as the layer where the YunYao retrieval is most sensitive to the underlying surface.
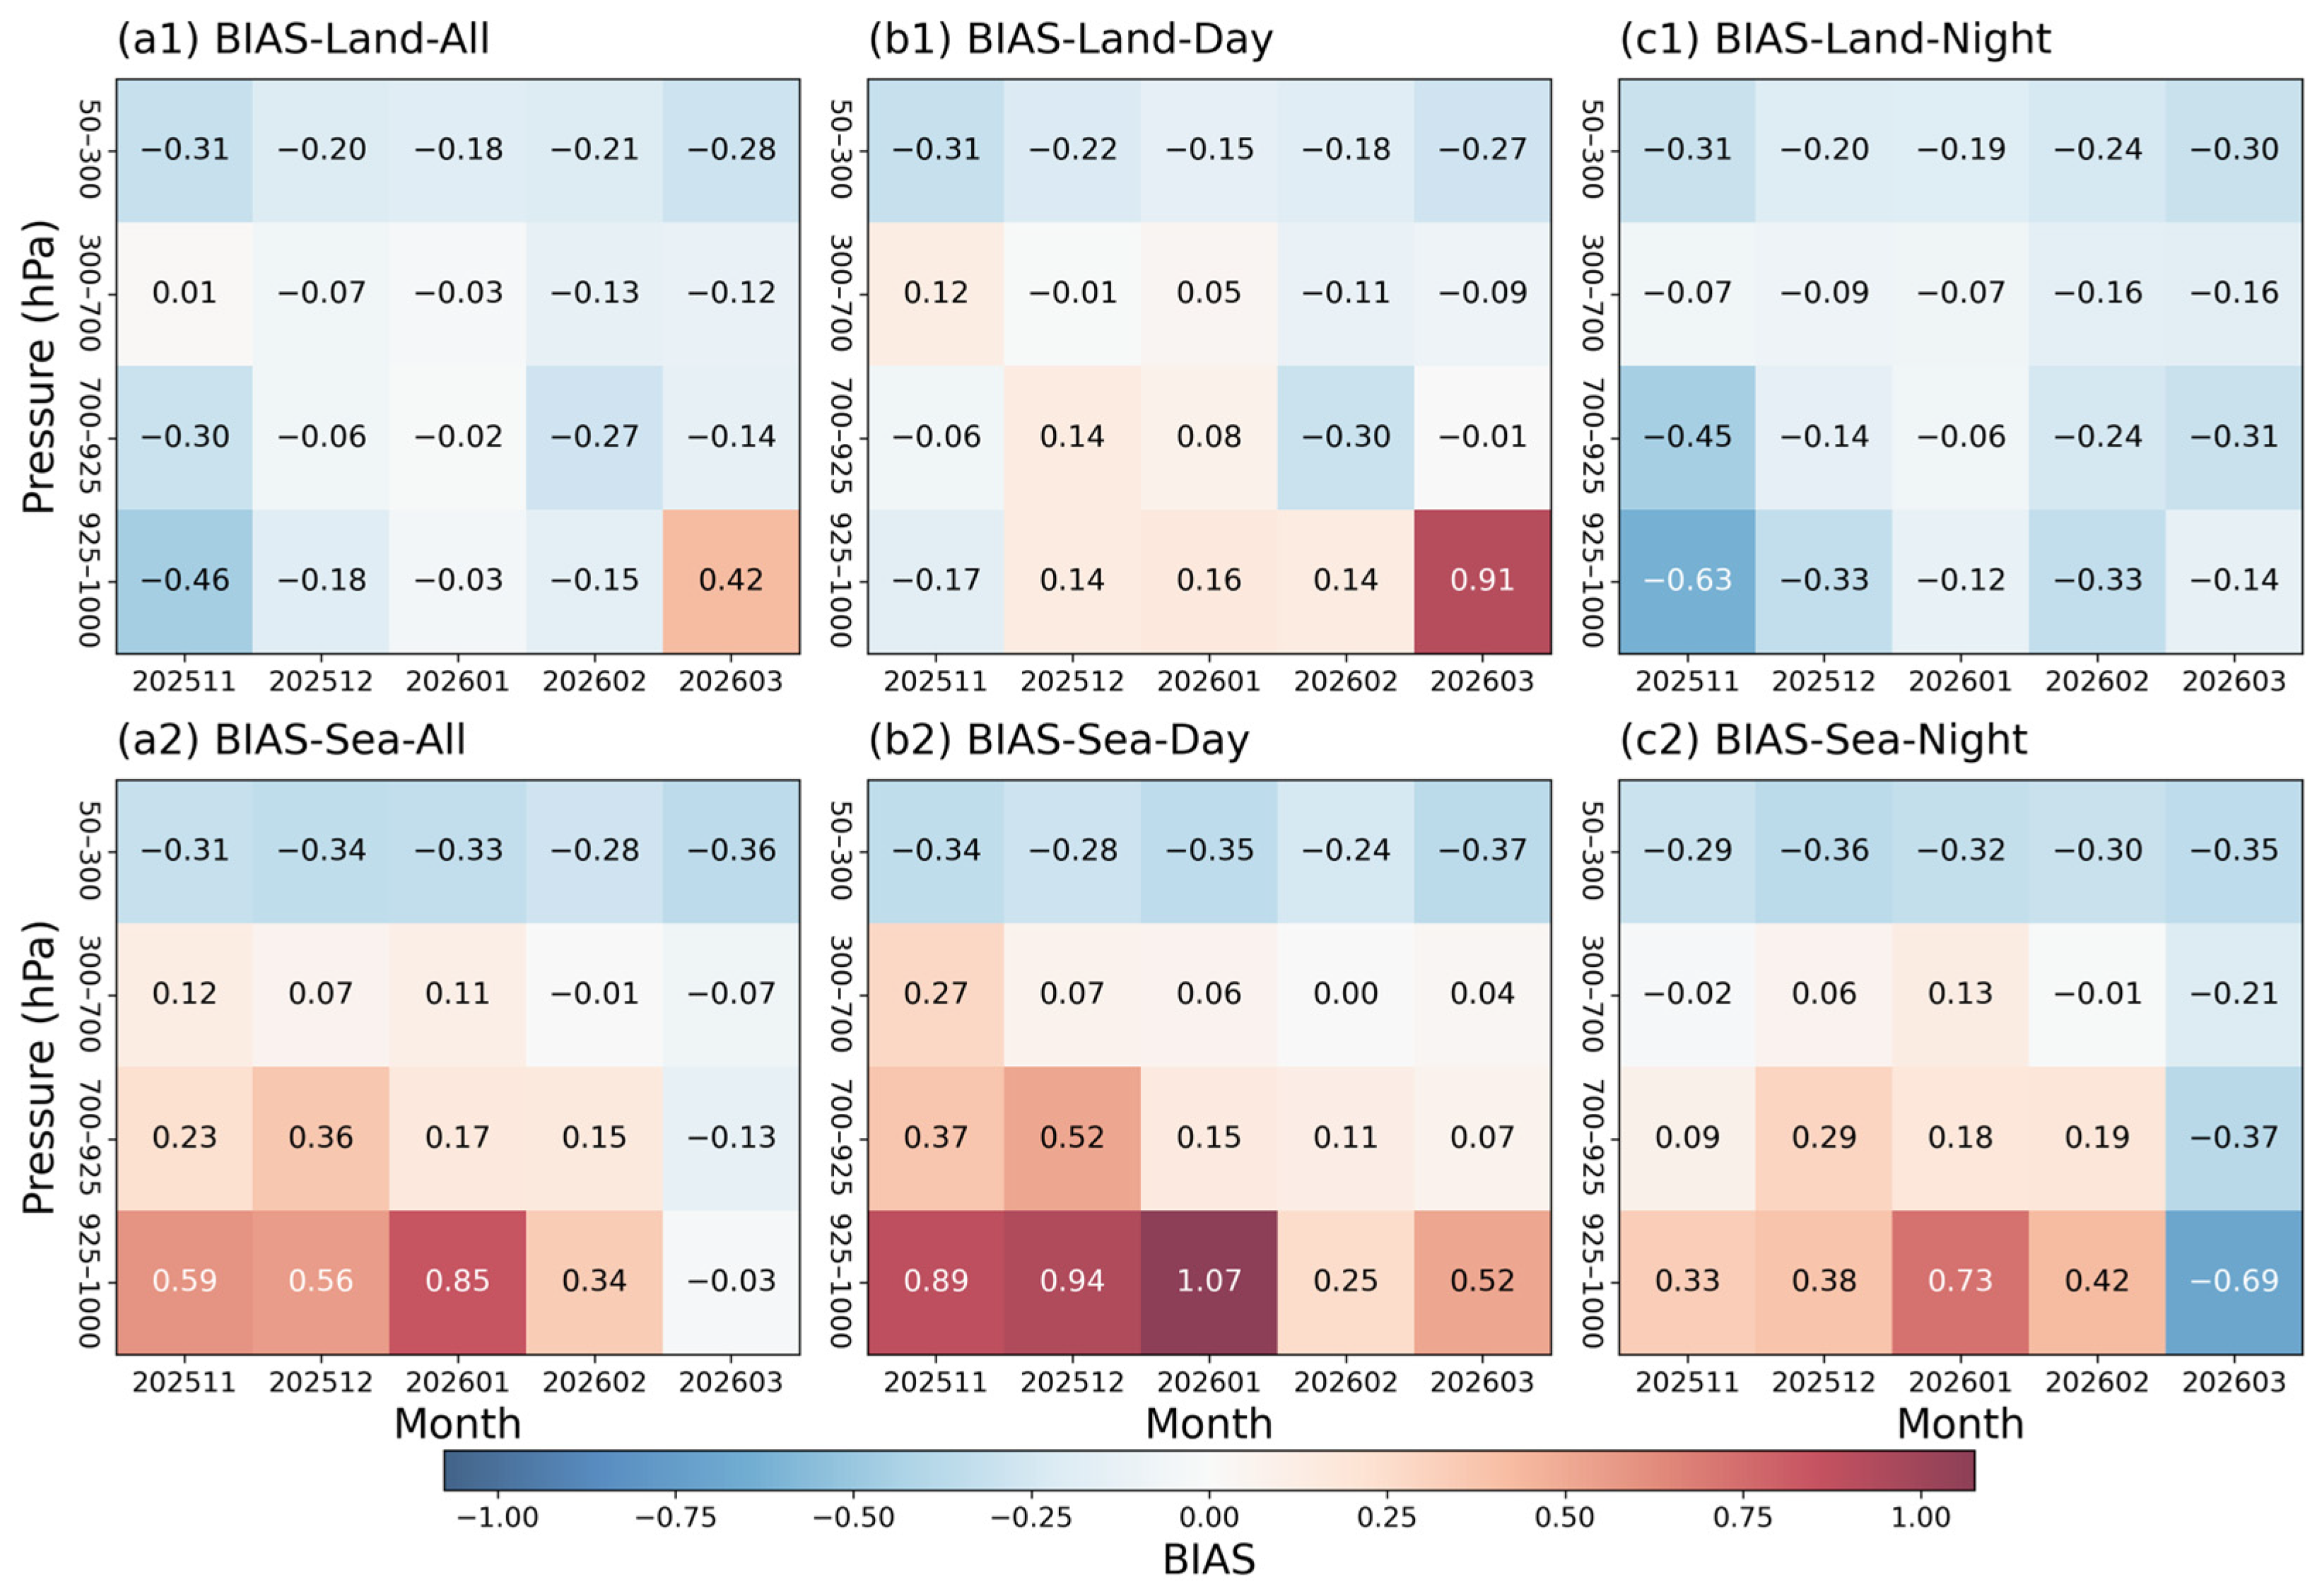
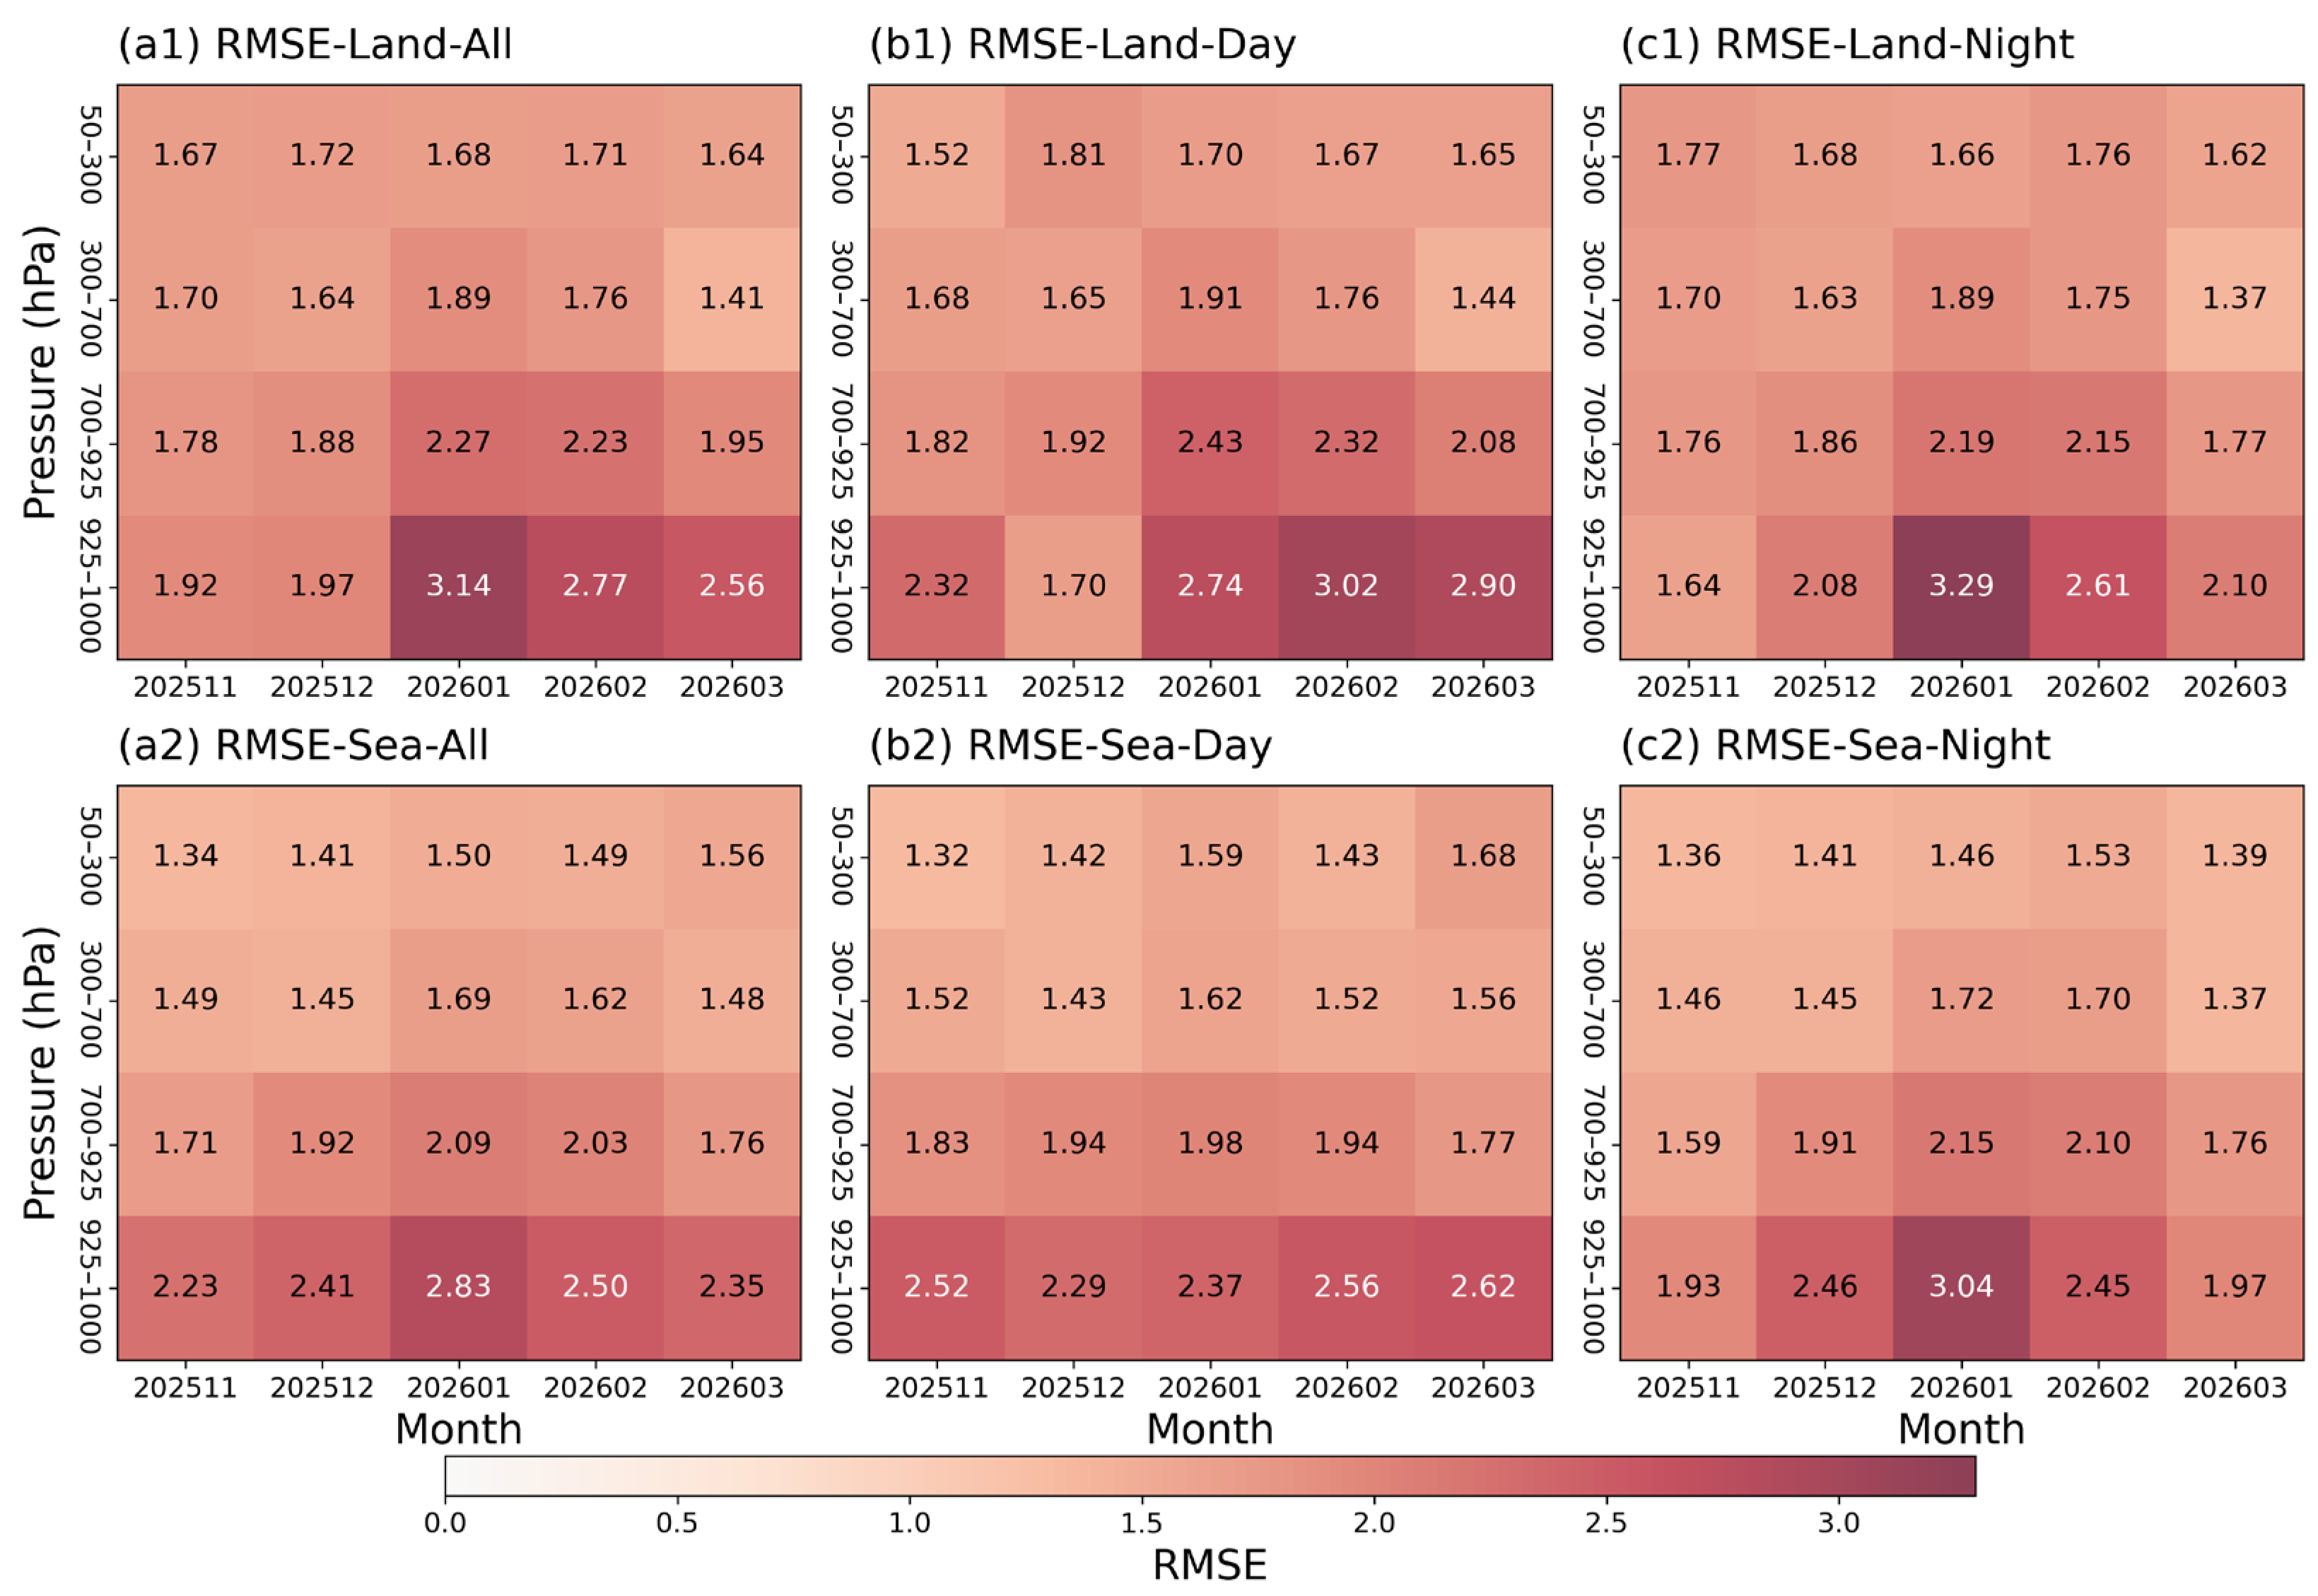
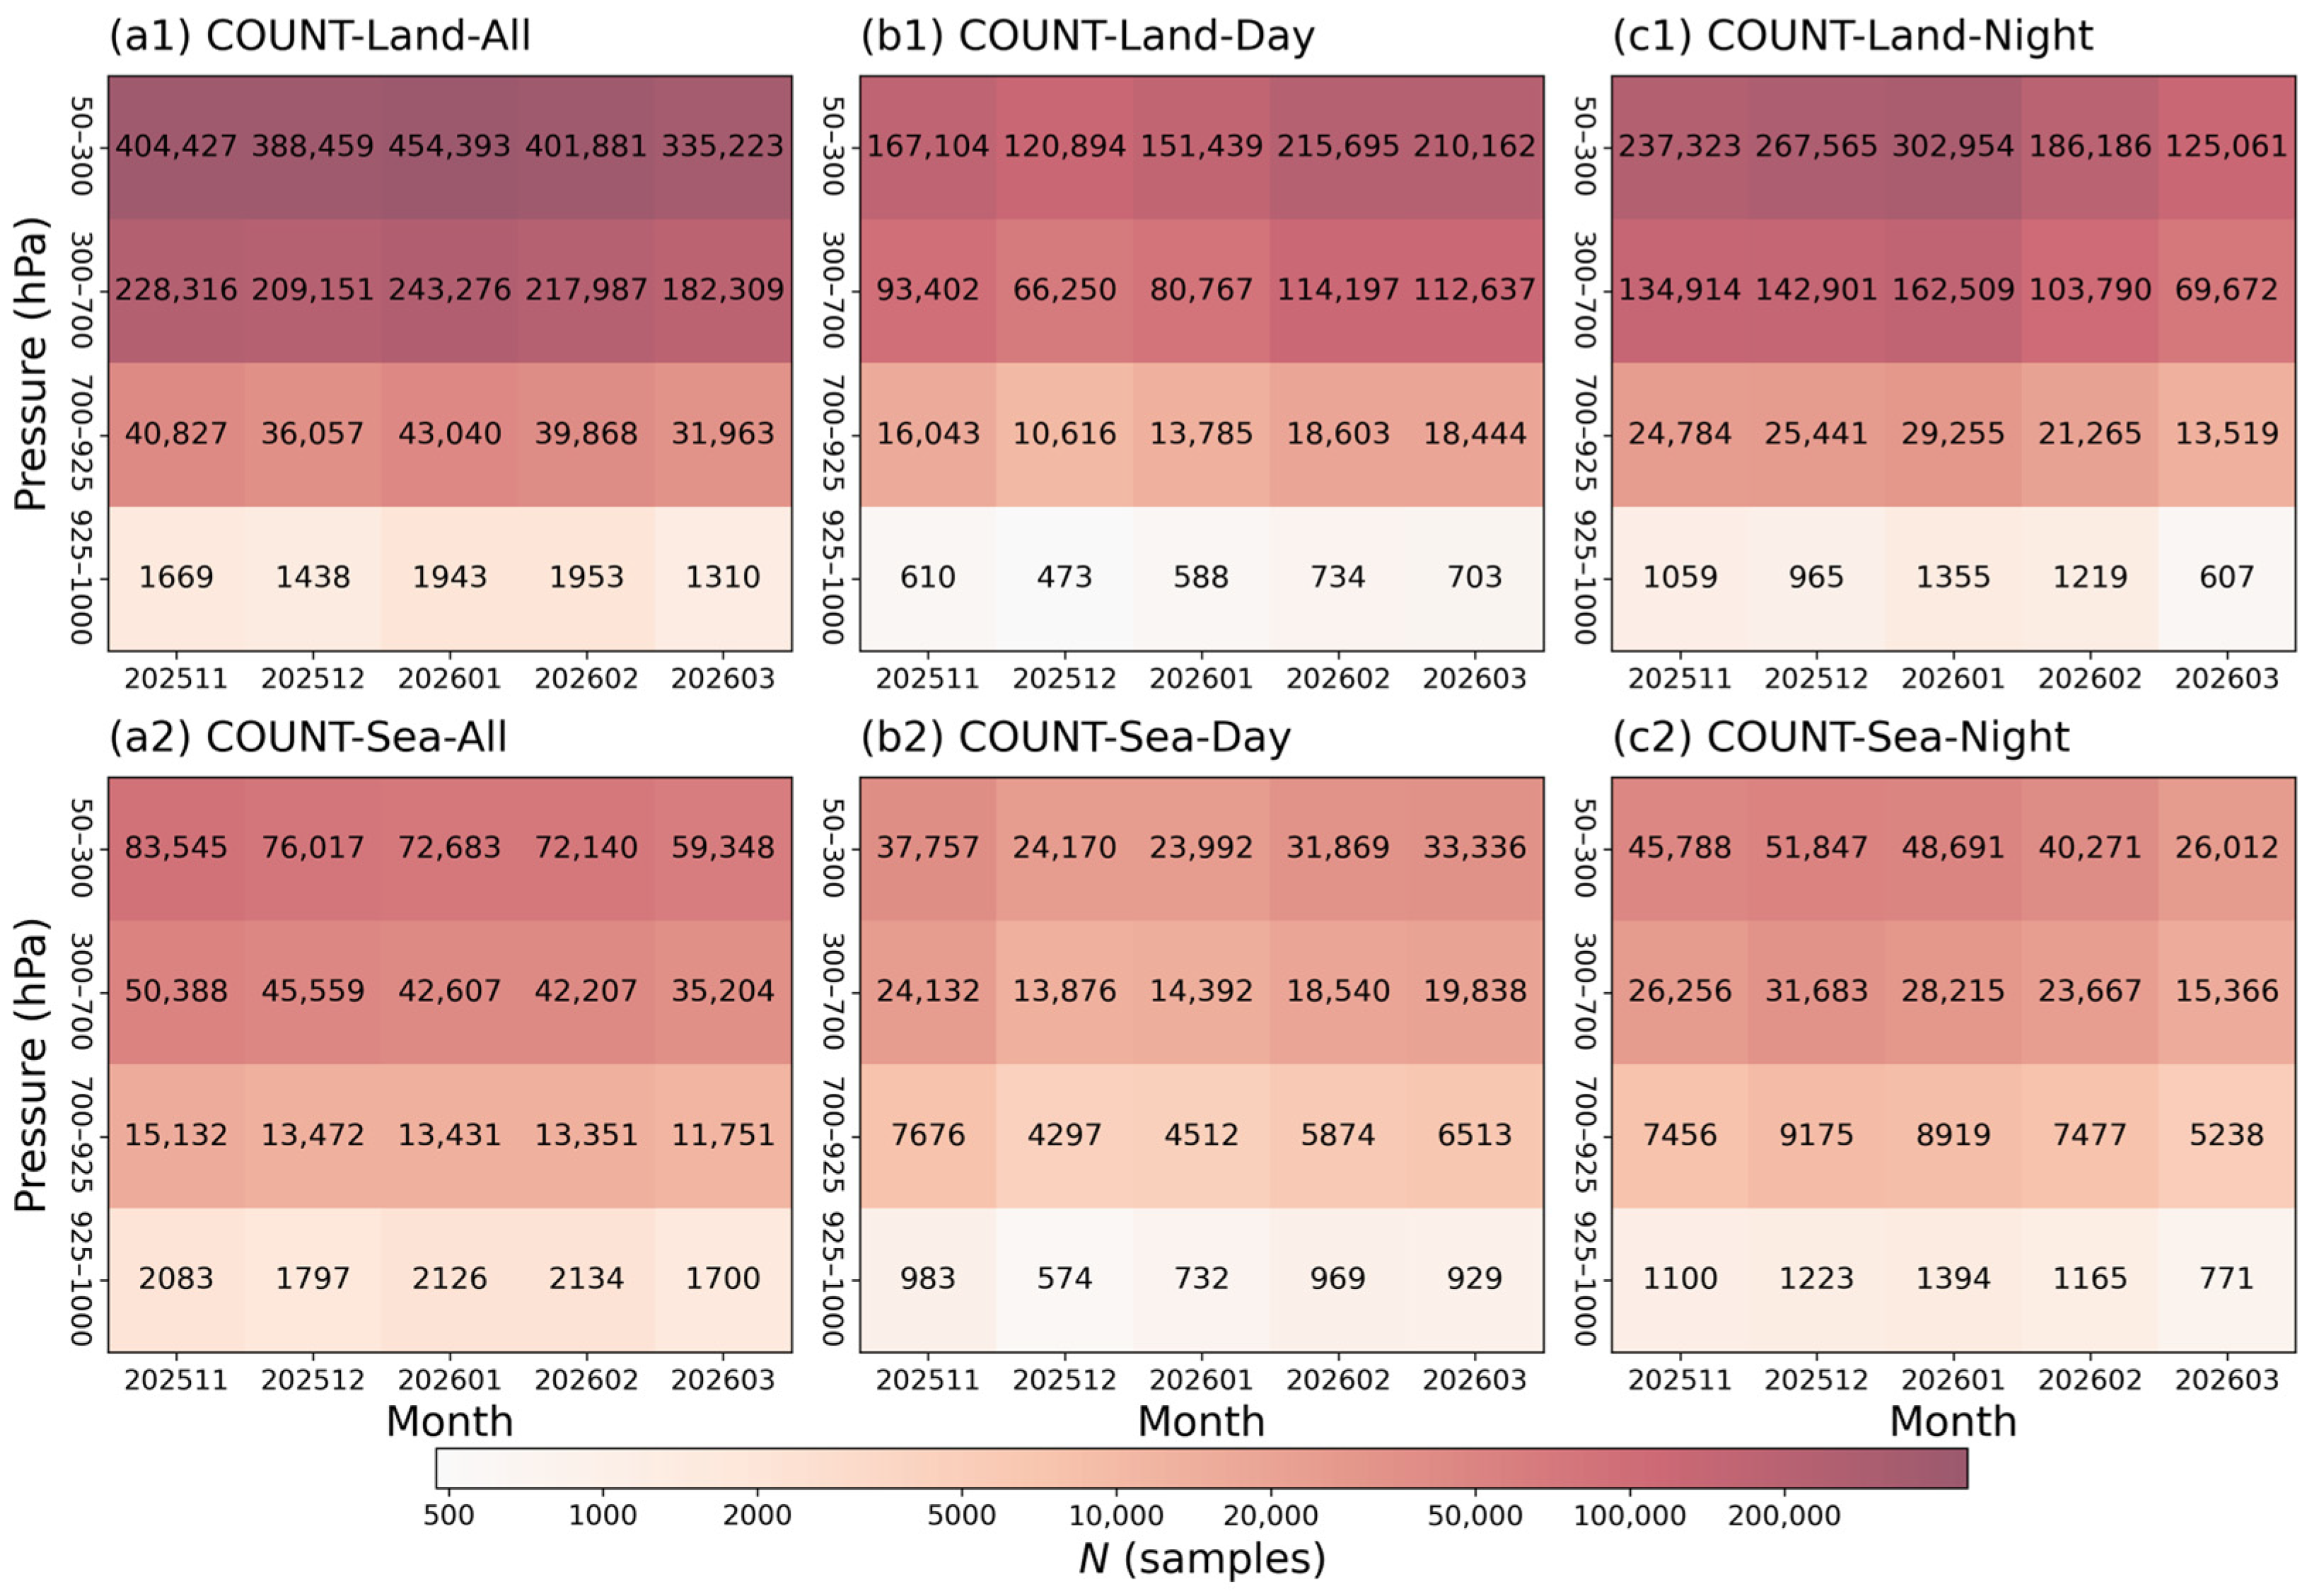
Figure 7 and Figure 8 quantify this decomposition month by month through heatmaps of the bias and RMSE stratified by pressure layer, land and sea category, and temporal subset, and Figure 9 reports the corresponding number of matched samples in each cell. In the two upper layers, both statistics are temporally stable and nearly insensitive to the underlying surface. The 50–300 hPa bias stays weakly negative in every month and subset, between −0.15 and −0.31 °C over land and −0.24 and −0.37 °C over sea, and the 300–700 hPa all-sample bias remains within ±0.27 °C. The corresponding RMSE varies within narrow ranges of 1.37 to 1.91 °C and 1.37 to 1.72 °C. These two layers are also supported by the largest sample sizes in the dataset, with several hundred thousand matched points per cell according to Figure 9, which is likely to contribute to the temporal stability observed in their bias and RMSE statistics. The free-tropospheric accuracy of YunYao therefore holds throughout the five months. Below 700 hPa, the dipole of Figure 6 persists from November to February. The 700–925 hPa land bias is negative in all months, between −0.30 and −0.02 °C, while the sea bias is positive, between 0.15 and 0.36 °C; at 925–1000 hPa, the contrast strengthens, with a land bias of −0.46 to −0.03 °C against a sea bias of 0.34 to 0.85 °C.
Two features stand out from the joint reading of these figures. The near-surface random error peaks in January rather than at either end of the period. The all-sample RMSE at 925–1000 hPa reaches 3.14 °C over land and 2.83 °C over sea, against only 1.92 to 1.97 °C over land and 2.23–2.41 °C over sea in November and December, and this peak is further amplified at night to 3.29 °C over land and 3.04 °C over sea; the 700–925 hPa layer displays the same peak with weaker amplitude. Notably, the January land bias is only about −0.02 °C, while the RMSE is the largest of the whole period, suggesting that the mid-winter degradation over land is associated mainly with a random rather than a systematic component, whereas over the sea the largest warm bias, 0.85 °C for all samples and 1.07 °C in the daytime, coincides with the largest RMSE. The low-level bias also reverses sign in March, and the diurnal decomposition helps to localize this reversal. Over land, the daytime bias at 925–1000 hPa is negative in November, remains near neutral (0.14 to 0.16 °C) from December through February, and then rises sharply to 0.91 °C in March, while the nighttime land bias stays negative in every month. Over sea, the reversal takes the opposite sign at night, collapsing from 0.73 °C in January to −0.69 °C in March, while the daytime sea bias remains warm at 0.52 °C; the near-zero all-sample sea value of −0.03 °C in March therefore appears to reflect compensation between opposing daytime and nighttime errors rather than a genuine accuracy gain. It is also worth noting that the 925–1000 hPa layer is supported by markedly fewer matched samples, on the order of 103 according to Figure 9, compared with 105 in the upper layers, and this comparatively limited sample size may partly account for the larger month-to-month fluctuations and the sharper sign reversals observed at this level.
In summary, Section 3.1, Section 3.2 and Section 3.3 progress from overall performance benchmarking against COSMIC-2, through layer-resolved error structure analysis, to spatiotemporal bias decomposition, and reveal three characteristics: a temporally stable and surface-independent error field above 700 hPa, a persistent land cold and sea warm dipole below 700 hPa, and two low-level anomalies consisting of a January maximum of random error and a March sign reversal of the bias with opposite diurnal expressions over land and sea. Possible physical causes for these features are explored in Section 4.

4. Discussion

The preceding analyses, grounded in 10,825 collocated operational radiosonde profiles over the 151-day boreal winter and early spring period, have systematically delineated the error properties of YunYao radio occultation temperature profiles across vertical layers and spatiotemporal dimensions, with cross-validation against COSMIC-2. The three robust features identified above carry distinct atmospheric physical implications, and their potential formation mechanisms are elaborated in the following subsections.
  • The upper-level cold bias of approximately −0.25 °C within 50–300 hPa is spatially uniform and temporally stable throughout the five months. A bias of this magnitude is consistent with those reported in earlier RO validations against radiosondes and may partly reflect the daytime solar radiation correction applied to the radiosonde reference and the high-altitude initialization of the Abel inversion in the retrieval chain [27]. Within 300–700 hPa, the mean bias is near zero, and the error field shows no organized spatial structure, indicating that the free-tropospheric accuracy of YunYao is governed by random rather than systematic processes and holds throughout the study period.
  • Below 700 hPa, the error field transitions into a land cold and sea warm dipole that persists from November through February. Two distinct boundary layer regimes may contribute to this contrast. Over the complex terrain of inland southern China, the limb-viewing geometry of RO integrates the signal along a horizontal path of several hundred kilometers. This horizontal averaging could smooth the terrain-following thermal structure and produce a cold bias relative to the point radiosonde. Over coastal and offshore waters, the moist marine boundary layer frequently holds humidity inversions. A plausible explanation is that an underestimated humidity contribution to refractivity, within the one-dimensional variational retrieval, maps into a warm temperature bias. This humidity-related pathway is not directly tested here, because the present evaluation does not include the humidity product. Representativeness differences between the volume-averaged RO measurement and the point radiosonde observation contribute to both regimes.
  • The January maximum of near-surface random error on both sides of the coastline, amplified at night, coincides with the peak intensity of the East Asian winter monsoon. A plausible explanation involves repeated cold surges during this month. These surges may sharpen the vertical refractivity gradient over the chilled land surface through strong nocturnal inversions. Vigorous sensible and latent heat fluxes may also develop where cold air flows over the warm sea. Both conditions could favor super-refraction, which would inflate the retrieval uncertainty. This explanation is consistent with the observed timing, but the refractivity gradient and the occurrence of super-refraction are not directly examined in this temperature-only study. The near-zero January land bias alongside the largest RMSE of the entire period is consistent with the hypothesis that individual cold-surge events inject large but sign-alternating errors that cancel in the mean yet substantially increase the dispersion.
  • The March sign reversal of the low-level bias, expressed as a monotonic daytime warm drift over land and a nighttime cold turn over sea, coincides with the seasonal transition from the winter monsoon to the pre-flood season. One possible explanation is that strengthening insolation over land, from February onward, deepens the daytime convective boundary layer. This deepening could increase low-level moisture. The growing wet contribution to refractivity makes the temperature–humidity partition in the 1D-Var retrieval increasingly ambiguous. An underestimated humidity term could then produce a warm temperature bias confined to daytime samples. The nighttime cold turn over sea may suggest a concurrent change in the refractivity structure of the marine boundary layer during the monsoon transition, but the present temperature-only evaluation cannot isolate its mechanism. The near-zero all-sample sea bias in March likely reflects compensation between opposing daytime and nighttime errors rather than a genuine accuracy gain, which warns against interpreting all-sample statistics alone in transitional months.
The marine samples rely on observations from coastal and island stations, as well as descending segments of BeiDou sounding profiles drifted offshore over the ocean, which limits the purely open-ocean representativeness of the ocean group. Several limitations qualify these findings. The validation window covers only the non-flood season, so the results define a baseline accuracy under relatively low moisture loading rather than the full annual performance envelope, and the March behavior is best read as a precursor of stronger rainy-season degradation. The evaluation is confined to temperature, whereas the mechanisms proposed above operate through refractivity and humidity, which are not directly examined here. The mechanisms proposed above offer plausible explanations for the observed error patterns, but they remain to be verified. The radiosonde reference carries its own daytime radiation biases and represents a point measurement, so part of the reported error reflects the comparison methodology rather than the retrieval itself. The day–night classification adopted here uses a single solar zenith angle threshold of 96°, corresponding to civil twilight. This threshold does not resolve the gradual twilight transition zone, and dedicated statistical analysis of this transition zone is left to future work. The marine samples rely on coastal and island stations, which may also limit the purely oceanic representativeness of the sea category.
Future work should extend the validation to a full annual cycle, particularly the May–September rainy season, to quantify moisture-driven degradation under high water vapor loading. Direct evaluation of the YunYao refractivity and humidity products would separate the temperature–humidity partitioning error inferred from the March warm drift. Dedicated screening of super-refraction cases would improve near-surface usability. Further analysis should also examine the mechanisms proposed above, including super-refraction, humidity underestimation, individual cold-surge events, and boundary layer structure. A more detailed analysis of the bias within the twilight transition zone should also be considered. Regional assimilation experiments that exploit the density advantage of the constellation, with observation errors below 700 hPa stratified by month, surface type, and local time, are a natural next step toward operational use.

5. Conclusions

This study evaluates the wet atmospheric temperature profile product of the YunYao GNSS-RO constellation over southern China during boreal winter and early spring (1 November 2025 to 31 March 2026), using 10,825 collocated operational radiosonde profiles as the reference and COSMIC-2 as an independent benchmark. The main conclusions are as follows:
  • YunYao provides approximately 4.77 times the matched sample volume of COSMIC-2 over the same domain and period, demonstrating a clear observation density advantage as a large commercial constellation, while its overall accuracy in the free troposphere is broadly comparable to the established COSMIC-2 mission.
  • Within 50–925 hPa, the YunYao temperature profiles agree closely with radiosonde observations. The RMSEs are generally within 1–2 °C; a weak and spatially uniform cold bias of approximately −0.25 °C persists in the upper troposphere and lower stratosphere, and the diurnal difference is small. Once this weak cold bias is corrected, the profiles within this layer exhibit high usability for regional statistical analysis.
  • Within 925–1000 hPa, the near-surface error grows markedly, with the RMSE reaching 2.52 °C. The error is dominated by enhanced random dispersion rather than systematic drift, and the bias shows a persistent regional pattern of inland cold bias and coastal warm bias driven by contrasting boundary layer regimes over complex terrain and the moist marine surface.
  • Two low-level anomalies are identified. A January maximum of near-surface random error, amplified at night, is attributed to super-refraction and spherical symmetry breakdown during peak East Asian winter monsoon cold surges. A March sign reversal of the bias, with a daytime warm drift over land and a nighttime cold turn over sea, reflects the seasonal increase in boundary layer moisture ahead of the pre-flood season and the associated ambiguity in temperature–humidity partitioning during 1D-Var retrieval.
  • Data below 925 hPa require strict quality control and a bias correction scheme stratified by surface type, terrain, and local time, combined with multi-source observations, to improve retrieval accuracy and spatiotemporal stability under complex boundary layer conditions.

Author Contributions

Conceptualization, J.L. and Z.L.; methodology, J.L. and J.H.; software, J.L.; validation, J.L. and L.Z.; formal analysis, J.L.; investigation, J.L. and J.H.; resources, Z.L.; data curation, J.L. and L.Z.; writing—original draft preparation, J.L.; writing—review and editing, J.L.; visualization, J.L.; supervision, Z.L. and J.H.; project administration, J.L. and J.H.; funding acquisition, J.L. and J.H. All authors have read and agreed to the published version of the manuscript.

Funding

This research was funded by Guangdong Basic and Applied Basic Research Foundation, grant numbers 2024A1515510016 and 2024A1515510015; the National Natural Science Foundation of China, grant number 42305172; the Open Fund of Heavy Rain Research, grant number BYKJ2024M02; and the Scientific Research Project of Guangzhou Meteorological Satellite Ground Station (Project No. 2408). The APC was funded by the Guangdong Basic and Applied Basic Research Foundation.

Data Availability Statement

The datasets supporting the findings of this study include wet atmospheric temperature profiles from the YunYao meteorological constellation radio occultation and operational radiosonde observations. All the above data can be accessed and downloaded from TianQing Meteorological Big Data Cloud Platform. Restrictions apply to the availability of these data as the platform requires an authorized access application for internal meteorological researchers, and the data are not publicly available via open repositories.

Conflicts of Interest

The authors declare no conflicts of interest.

Abbreviations

The following abbreviations are used in this manuscript:
RORadio Occultation
GNSSGlobal Navigation Satellite System
GNSS-ROGlobal Navigation Satellite System Radio Occultation
GNROIGNSS Radio Occultation sounding Instrument
GPSGlobal Positioning System (U.S. Space Force, Washington, DC, USA)
GPS/METGPS/Meteorology
GLONASSGlobal Navigation Satellite System (Roscosmos, Moscow, Russia)
BDSBeiDou Navigation Satellite System (China Satellite Navigation Office, Beijing, China)
GalileoGalileo Global Navigation Satellite System (European Space Agency, Paris, France)
TM-1Tianmu-1
FYFengyun
COSMICConstellation Observing System for Meteorology, Ionosphere, and Climate
ECMWFEuropean Centre for Medium-Range Weather Forecasts
ERA5ECMWF Reanalysis v5
1D-VarOne-Dimensional Variational
UTCCoordinated Universal Time
LOOLeave-One-Out
SZASolar Zenith Angle
MBMean Bias
MAEMean Absolute Error
RMSERoot Mean Square Error
RCorrelation Coefficient
R2Coefficient of Determination
CovCovariance
VarVariance
NCFADNormalized Contoured Frequency by Altitude Diagrams

References

  1. Wang, D.; Wang, J.C.; Tian, W.H.; Guo, Q.Y. Quality Control and Uncertainty Analysis of Return Radiosonde Data. Chin. J. Atmos. Sci. 2020, 44, 865–884. [Google Scholar] [CrossRef]
  2. Qi, X.X.; Yang, S.P.; He, L. Investigating Tropical Cyclone Warm Core and Boundary Layer Structures with Constellation Observing System for Meteorology, Ionosphere, and Climate 2 Radio Occultation Data. Remote Sens. 2024, 16, 4257. [Google Scholar] [CrossRef] [Scilit]
  3. Jin, Z.Q.; Yu, Z.S.; Hao, S.F.; Zhang, H.L.; Lu, Z.Q.; Zhang, S.X. Validation and Correction of FY-4B/GIIRS Temperature and Humidity Profiles Based on Radiosonde Data. J. Appl. Meteorol. Sci. 2024, 35, 538–550. [Google Scholar] [CrossRef]
  4. Zhou, B.X.; Zhu, L.F.; Wu, H.; Dong, Z.P.; Wang, X.; Luo, Y.Y. Accuracy of Atmospheric Profiles Retrieved from Microwave Radiometer and Its Application to Precipitation Forecast. J. Appl. Meteorol. Sci. 2023, 34, 717–728. [Google Scholar] [CrossRef]
  5. Mo, Z.X.; Lou, Y.D.; Zhang, W.X.; Zhou, Y.Z.; Wu, P.D.; Zhang, Z.Y. Performance Assessment of Multi-Source GNSS Radio Occultation from COSMIC-2, MetOp-B/C, FY-3D/E, Spire and PlanetiQ over China. Atmos. Res. 2024, 311, 107704. [Google Scholar] [CrossRef] [Scilit]
  6. Hordyniec, P.; Huang, C.Y.; Liu, C.Y.; Rohm, W.; Chen, S.Y. GNSS Radio Occultation Profiles in the Neutral Atmosphere from Inversion of Excess Phase Data. Terr. Atmos. Ocean. Sci. 2019, 30, 215–233. [Google Scholar] [CrossRef] [Scilit]
  7. Yue, H.Y.; Fu, N.F.; Li, F.H.; Cheng, Y.; Wu, M.J.; Guo, P.; Dong, W.L.; Hu, X.G.; Wang, F.X. The YunYao LEO Satellite Constellation: Occultation Results of the Neutral Atmosphere Using Multi-System Global Navigation Satellites. Remote Sens. 2025, 17, 2851. [Google Scholar] [CrossRef] [Scilit]
  8. Ma, X.L.; Jiang, S.; Yu, Y.M.; Guo, H. Analyzing the Quality of Data for Temperature and Humidity Using COSMIC Radio Occultation Observations. Trans. Atmos. Sci. 2017, 40, 841–849. [Google Scholar] [CrossRef]
  9. Bai, W.H.; Liu, C.L.; Meng, X.G.; Sun, Y.Q.; Kirchengast, G.; Du, Q.F.; Wang, X.Y.; Yang, G.L.; Liao, M.; Yang, Z.D.; et al. Evaluation of Atmospheric Profiles Derived from Single- and Zero-Difference Excess Phase Processing of BeiDou Radio Occultation Data from the FY-3C GNOS Mission. Atmos. Meas. Tech. 2018, 11, 819–833. [Google Scholar] [CrossRef] [Scilit]
  10. Li, F.H.; Kan, L.; Xu, Y.S.; Li, J.X.; Huang, M.Y.; Wang, P.C.; Cheng, Y.; Liang, X.W.; Chen, G.C. Evaluation of the Assimilation Effectiveness of YunYao GNSS-RO Constellation Data in a Global Numerical Weather Forecasting System. In The Proceedings of 2025 International Conference of Electrical, Electronic and Networked Energy Systems, Lecture Notes in Electrical Engineering; Springer Nature: Singapore, 2026; Volume 1635, pp. 329–339. [Google Scholar] [CrossRef] [Scilit]
  11. Jing, X.; Ho, S.P.; Shao, X.; Liu, T.C.; Chen, Y.; Zhou, X.J. Spire RO Thermal Profiles for Climate Studies: Initial Comparisons of the Measurements from Spire, NOAA-20 ATMS, Radiosonde, and COSMIC-2. Remote Sens. 2023, 15, 3710. [Google Scholar] [CrossRef] [Scilit]
  12. Zhran, M.; Mousa, A.; Wang, Y.; Hasher, F.F.B.; Jin, S.G. Assessment of Commercial GNSS Radio Occultation Performance from PlanetiQ Mission. Remote Sens. 2024, 16, 3339. [Google Scholar] [CrossRef] [Scilit]
  13. Li, J.F.; Lu, C.X.; Zheng, Y.X.; Ban, W.; Zhang, X.H. Quality Assessment and Assimilation of Tianmu-1 GNSS Radio Occultation Refractivity Observations: A Preliminary Study. IEEE Trans. Geosci. Remote Sens. 2025, 63, 5803217. [Google Scholar] [CrossRef] [Scilit]
  14. Li, F.H.; Kan, L.; Mana, Z.M.; Li, J.X.; Huang, M.Y.; Wang, P.C.; Cheng, Y.; Liu, C.Y.; Xia, S.; Xu, Y.; et al. YunYao GNSS-RO Constellation Data Quality Control and Product Evaluation. In Proceedings of the 2025 International Conference of Electrical, Electronic and Networked Energy Systems; Springer Nature: Singapore, 2026; pp. 495–508. [Google Scholar] [CrossRef] [Scilit]
  15. Xu, X.Z.; Han, W.; Wang, J.C.; Gao, Z.Q.; Li, F.H.; Cheng, Y.; Fu, N.F. Quality Assessment of YunYao Radio Occultation Data in the Neutral Atmosphere. Atmos. Meas. Tech. 2025, 18, 1339–1353. [Google Scholar] [CrossRef] [Scilit]
  16. Wang, M.M.; Zou, X.L.; Xu, X. Estimation of Observation Error Standard Deviation of Global GPS Radio Occultation Data by the Three-Cornered Hat Method. J. Meteorol. Sci. 2022, 42, 285–299. [Google Scholar] [CrossRef]
  17. Zhu, J.; Zhang, L.; Huang, W.; Cheng, Y.; Wang, G. Quality Assessment of GNSS-RO Neutral Atmosphere Refractivity Data from YunYao Mission. Adv. Space Res. 2026, 78, 746–767. [Google Scholar] [CrossRef] [Scilit]
  18. Wu, S.J.; Zheng, Y.J.; Li, F.H.; Zhuang, Z.R. Comparative Assessment of YunYao and COSMIC-2 Radio Occultation Bending-Angle Observations. Remote Sens. 2026, 18, 1566. [Google Scholar] [CrossRef] [Scilit]
  19. Zou, X.L.; Liu, H. Impact multipath quality control improving GPS RO data assimilation in the tropical lower troposphere. Trans. Atmos. Sci. 2020, 43, 116–127. [Google Scholar] [CrossRef]
  20. Wee, T.K.; Anthes, R.A.; Hunt, D.C.; Schreiner, W.S.; Kuo, Y.H. Atmospheric GNSS RO 1D-Var in Use at UCAR: Description and Validation. Remote Sens. 2022, 14, 5614. [Google Scholar] [CrossRef] [Scilit]
  21. Li, Y.; Yuan, Y.B.; Wang, X.M. Assessments of the Retrieval of Atmospheric Profiles from GNSS Radio Occultation Data in Moist Tropospheric Conditions Using Radiosonde Data. Remote Sens. 2020, 12, 2717. [Google Scholar] [CrossRef] [Scilit]
  22. Yin, Y.A.; Yang, S.P. Bias Characteristics of COSMIC RO Data within Clouds Based on Different Background Fields. Plateau Meteorol. 2023, 42, 1351–1360. [Google Scholar] [CrossRef]
  23. Guo, Q.Y.; Yang, R.K.; Cheng, K.Q.; Li, C.X. Refractive Index Quality Control and Comparative Analysis of Multi-Source Occultation Based on Sounding Observation. J. Appl. Meteorol. Sci. 2020, 31, 13–26. [Google Scholar] [CrossRef]
  24. Ho, S.-P.; Kireev, S.; Shao, X.; Zhou, X.; Jing, X. Processing and Validation of the STAR COSMIC-2 Temperature and Water Vapor Profiles in the Neutral Atmosphere. Remote Sens. 2022, 14, 5588. [Google Scholar] [CrossRef] [Scilit]
  25. Cao, X.Z.; Xia, Y.C.; Luo, H.W.; Liu, L.H.; Liu, Y.F.; Liu, Z.Y.; Li, X.; Guo, R.; Guo, Q.Y. Technical Development and Prospect of Meteorological Sounding Observation. Adv. Meteorol. Sci. Technol. 2022, 12, 27–36. [Google Scholar] [CrossRef]
  26. KIMBALL, H.H. The Duration and Intensity of Twilight. Mon. Weather Rev. 1916, 44, 614–620. [Google Scholar] [CrossRef] [Scilit]
  27. Wang, B.R.; Liu, X.Y.; Wang, J.K. Assessment of COSMIC radio occultation retrieval product using global radiosonde data. Atmos. Meas. Tech. 2013, 6, 1073–1083. [Google Scholar] [CrossRef] [Scilit]
Figure 1. Distribution of the 43 radiosonde stations over southern China (97–123°E, 17–31°N).
Remotesensing 18 02733 g001
Figure 2. Sensitivity of the YunYao–radiosonde temperature matching to the time window and the spatial radius over 50–1000 hPa. (a) Number of matched profiles; (b) Temperature root mean square error (RMSE, °C); (c) Temperature mean absolute error (MAE, °C). The vertical axis is the half-width of the time window (h), and the horizontal axis is the spatial radius (km). The black box marks the adopted threshold (±3 h, 180 km).
Remotesensing 18 02733 g002
Figure 3. Comparison of sample size and accuracy statistics between YunYao and COSMIC-2 temperature profiles against the operational radiosonde over southern China. (a) Sample Size; (b) Mean Temperature Profile; (c) Bias; (d) RMSE. Green, red, and blue lines denote the all-sample, daytime, and nighttime subsets, respectively; solid and dashed lines denote YunYao and COSMIC-2, respectively; dotted lines in (b) denote the radiosonde reference.
Remotesensing 18 02733 g003
Figure 4. Level-by-level scatter density comparison between YunYao and collocated operational radiosonde temperature over southern China, stratified by pressure layer and temporal subset. Rows correspond to the 50–300, 300–700, 700–925 and 925–1000 hPa layers; columns correspond to all samples in (a1a4), daytime in (b1b4), and nighttime in (c1c4). The black dashed line is the 1:1 reference and the red line is the linear regression fit. Color denotes scatter density on a logarithmic scale. N is the number of level-by-level matched points, and MB, RMSE, and R2 denote the mean bias, root mean square error in °C, and coefficient of determination.
Remotesensing 18 02733 g004
Figure 5. Normalized contoured frequency by altitude distribution of the YunYao minus radiosonde temperature bias over southern China. (a) All samples, (b) Daytime, (c) Nighttime. Color shading is the relative frequency in percent within each pressure level, and black contours mark the 1, 3, 5, and 7 percent levels; the vertical dashed line marks zero bias. The bias unit is °C.
Remotesensing 18 02733 g005
Figure 6. Spatial distribution of the mean temperature bias of YunYao relative to the operational radiosonde over southern China, stratified by pressure layer and temporal subset. Rows correspond to the 50–300, 300–700, 700–925, and 925–1000 hPa layers; columns correspond to all samples in (a1a4), daytime in (b1b4), and nighttime in (c1c4). Color shading indicates the interpolated mean bias (unit: °C), derived via Inverse-Distance Weighting (power = 2) applied to grid-cell-declustered profile representative values on a 0.4° regular grid (see the preceding content within this section for the declustering procedure). Warm colors denote positive bias and cool colors denote negative bias; grid points farther than 2.5° from the nearest contributing point are left blank. In the lower-left corner of each panel, N is the total number of matched profiles within the corresponding pressure layer and temporal subset, and MB is the overall mean bias computed from all raw YunYao–radiosonde match-up samples in that subset, before any spatial averaging or declustering.
Remotesensing 18 02733 g006
Figure 7. Monthly heatmaps of the mean bias of YunYao temperature profiles relative to the operational radiosonde over southern China from November 2025 to March 2026, stratified by pressure layer, surface type, and temporal subset. Columns denote all samples in (a1,a2), daytime in (b1,b2), and nighttime in (c1,c2); rows denote the land category in (a1,b1,c1) and the sea category in (a2,b2,c2). Within each panel, the vertical axis gives the 50–300, 300–700, 700–925, and 925–1000 hPa layers and the horizontal axis gives the calendar month. Each cell is annotated with the layer mean bias in °C, with red shading for warm bias and blue shading for cold bias.
Remotesensing 18 02733 g007
Figure 8. Same as Figure 7 but for the root mean square error of YunYao temperature profiles against the operational radiosonde. Each cell is annotated with the layer RMSE in °C, with darker shading indicating larger RMSE values.
Remotesensing 18 02733 g008
Figure 9. Same as Figure 7 but for the number of matched YunYao–radiosonde samples (N) contributing to each cell, shown on a logarithmic color scale, with darker shading indicating a larger sample count.
Remotesensing 18 02733 g009
Table 1. Key parameters of the YunYao constellation satellites and GNSS-RO receiver.
ParameterSpecification/Description
OperatorTianjin Yunyao Aerospace Technology Co., Ltd. (Tianjing, China)
ConstellationYunyao Meteorological Constellation (Yunyao Aerospace Constellation)
Total planned satellites90 satellites
Orbital configuration72 sun-synchronous orbit satellites + 18 low-inclination orbit satellites
Orbit altitude~500–535 km
Orbit inclination97.5°, 97.46°, 94.5° (sun-synchronous), and 50° (low-inclination)
Orbital planes6 orbital planes; 3 satellites on low-inclination orbits
Local solar time coverage06:00, 10:30, 13:30, 16:30, and 00:00–24:00 (50° inclination orbit)
Satellites in orbit (as of document)34 GNSS-RO satellites + 2 GNSS-R satellites
Operational occultation satellites22 satellites performing occultation business detection
Infrared detection satellites12 occultation satellites equipped with infrared payloads
GNSS-RO payloadYunYao Receiver, a multi-GNSS receiver
Supported GNSS systemsGPS, BeiDou (BDS), GLONASS, and Galileo
Antenna array (GNSS-RO)3 × 1 antenna array
Antenna array (GNSS-R)4 × 5 antenna array
Observation principleMeasures phase delay due to refraction during GNSS-LEO occultation
Limb scanning rangeFrom 400 km altitude to near-surface
Data inversion accuracy0.05 K
Data delivery latencyFrom acquisition to distribution < 30 min
Table 2. Overview of YunYao GNSS-RO atmospheric profile products.
ParameterSpecification/Description
Product nameYunYao GNSS-RO atmospheric profile products (atmPrf/ionPrf)
One-dimensional variational (1D-Var) background fieldECMWF operational analysis (presumably IFS Cycle 49r1)
Output variablesBendAng (bending angle), Ref (refractivity), Temp (temperature), Shum (specific humidity), Pres (pressure); ELEC_dens (electron density), TEC
Data formatnetCDF, BUFR
Spatial coverageLongitude: −180° to 180°; Latitude: −90° to 90° (global coverage)
Time seriesFrom August 2022 to present
Horizontal resolution200 km
Vertical resolution0.1 km
Daily data volumeatmPrf ≥ 33,000 profiles/day; ionPrf ≥ 17,000 profiles/day
Penetration capability60% of profiles penetrate below 1 km; 90% below 4 km
Timeliness70% of data < 6 h; 40% of data < 3 h
Refractivity mean bias (vs. ERA5)Absolute value < 1.54% (0–40 km); close to 0 between 4 and 40 km
Refractivity standard deviation (vs. ERA5)<3.35% (0–40 km)
Bending angle mean bias (vs. ERA5)Absolute value < 4.51% (0–40 km)
Bending angle standard deviation (vs. ERA5)<11.06% (0–40 km)
Refractivity error SD (3CH method)<2.53% in 1000–10 hPa range
Refractivity error SD variation (across GNSS systems)Differences do not exceed 0.52%
Comparison with COSMIC-2 and Metop-CYunyao RO data exhibit consistent refractivity error SDs and are smaller within 300–50 hPa
Full-year 2025 evaluation (vs. ERA5)Mean bias within ±1.5% below 4 km; SD < 3% across all altitudes; optimal performance (0.5–1.5%) in 5–25 km range
Penetration below 1 km (2025 evaluation)Over 70% of observations
Table 3. Leave-One-Out (LOO) cross-validation error of the linear interpolation applied to the operational radiosonde temperature, summarized by pressure band.
Pressure Band (hPa)Mean Adjacent-Level Spacing (m) 1MAE (°C)RMSE (°C)P99 of |Error| (°C) 2
50–1006.9490.0100.0210.084
100–2506.6760.0070.0140.055
250–5006.3010.0060.0110.037
500–8506.0550.0070.0210.050
850–10005.7180.0080.0220.056
50–1000 (Overall)6.4530.0070.0170.055
1 Mean adjacent-level spacing: the average vertical distance between two consecutive pressure levels of the radiosonde profiles in the band. A small spacing means the interpolation operates over a very short vertical interval. 2 P99 of |error|: the 99th percentile of the absolute interpolation error, i.e., 99% of the test levels have an absolute error below this value. It characterizes the near-worst-case (upper-tail) error.
Table 4. Statistical comparison of YunYao and COSMIC-2 temperature profiles against the operational radiosonde over southern China, stratified by pressure layer (50–300, 300–700, 700–925, and 925–1000 hPa) and by all-sample, daytime, and nighttime subsets. N denotes the number of level-by-level matched sample points, not the number of matched profile pairs (see Section 2.2); MB, RMSE, and R2 denote the mean bias, root mean square error, and coefficient of determination.
Pressure Band (hPa)Statistics (°C)AllDayNight
YunYaoCOSMIC-2YunYaoCOSMIC-2YunYaoCOSMIC-2
50–300N2,348,116471,6111,016,418238,4401,331,698233,171
MB−0.247−0.128−0.242−0.147−0.251−0.108
RMSE1.6521.4511.6381.4461.6621.455
R20.9830.9880.9820.9880.9830.987
300–700N1,297,004274,038558,031139,303738,973134,735
MB−0.045−0.1510.003−0.142−0.080−0.160
RMSE1.6751.4781.6601.4601.6871.497
R20.9830.9870.9840.9870.9830.986
700–925N258,89269,329106,36335,503152,52933,826
MB−0.073−0.0040.0260.016−0.142−0.025
RMSE2.0081.7172.0701.7041.9631.731
R20.8940.9220.8880.9270.8970.917
925–1000N18,15362297295328510,8582944
MB0.2140.1400.5100.2430.0150.026
RMSE2.5152.0912.5572.0992.4862.082
R20.8830.9190.8810.9250.8840.912
Disclaimer/Publisher’s Note: The statements, opinions and data contained in all publications are solely those of the individual author(s) and contributor(s) and not of MDPI and/or the editor(s). MDPI and/or the editor(s) disclaim responsibility for any injury to people or property resulting from any ideas, methods, instructions or products referred to in the content.