Article

Midday Depression and Legacy Effect Disrupt SIF-GPP Coupling in Northern Peatlands During Combined Heat and Drought Stress

by
Abdallah Yussuf Ali Abdelmajeed
1,
M.Pilar Cendrero-Mateo
2,3,
Shari Van Wittenberghe
3,
Michal Antala
1,
Mar Albert-Saiz
1,
Marcin Stróżecki
1,
Anshu Rastogi
1,
Tommaso Julitta
4,
Andreas Burkart
4,
Dirk Schuettemeyer
5,
Sheng Wang
6 and
Radosław Juszczak
1,*
1
Department of Bioclimatology, Faculty of Environmental and Mechanical Engineering, Poznan University of Life Sciences, 60-649 Poznan, Poland
2
Desertification Research Centre, Ecology and Global Change, University of Valencia, CV-315, Km. 10, 7, Moncada, 46113 Valencia, Spain
3
Laboratory of Earth Observation, Image Processing Laboratory, University of Valencia, C/Catedrático Agustin Escardino, n° 9, 46980 Paterna, Spain
4
JB Hyperspectral Devices, Am Botanischen Garten 33, 40225 Düsseldorf, Germany
5
European Space Agency (ESA), ESTEC, Keplerlaan 1, 2200 AG Noordwijk, The Netherlands
6
LandCRAFT, Department of Agroecology, Aarhus University, Ole Worms Allé 3, DK-8000 Aarhus, Denmark
*
Author to whom correspondence should be addressed.
Remote Sens. 2026, 18(16), 2826; https://doi.org/10.3390/rs18162826
Submission received: 25 May 2026 / Revised: 14 August 2026 / Accepted: 18 August 2026 / Published: 20 August 2026
(This article belongs to the Section Remote Sensing in Agriculture and Vegetation)

Highlights

What are the main findings?
  • Multi-day heat exposure induced legacy effects, causing persistent morning SIF-GPP decoupling (R2 = 0.07) on recovery days, contrasting with strong coupling (R2 = 0.86) on the same date without prior stress history.
  • Daily-averaged correlations (R2 = 0.83–0.92) masked critical sub-daily patterns: complete midday decoupling (R2 = 0.04) during midday depression stress and morning decoupling (R2 = 0.07) from legacy effects.
What are the implications of the main findings?
  • Case-study evidence from a temperate fen suggests that weakened morning SIF-GPP correlations detectable by mid-morning satellite overpasses may be consistent with cumulative stress responses, and the morning-coupling signal could be a candidate early indicator worth multi-site, multi-year validation before any operational use. serve as early warning indicators of cumulative stress 1–2 days before afternoon physiological collapse becomes measurable.
  • Insights into the modelling of GPP based on SIF in heterogeneous ecosystems exposed to stress conditions.

Abstract

Peatlands, critical global carbon sinks, are facing increasing threats from climate change-driven heatwaves and droughts. These threats can cause a midday depression in carbon uptake through photosynthetic inhibition. Using high-temporal-resolution solar-induced chlorophyll fluorescence (SIF; ~30 s) and chamber-based CO2 flux measurements, we investigated the coupling between SIF and gross primary production (GPP) during extreme events (air temperature > 25 °C and vapour pressure deficit > 15 hPa) in a northern peatland. Our results show that SIF tracks GPP closely under non-stress conditions (daily R2 = 0.86–0.96). However, during combined heat and drought stress, midday correlations collapsed (Case A: R2 = 0.04 on 27 June; Case B: R2 = 0.15 and 0.01 on 29 and 30 June, respectively), indicating severe decoupling. Importantly, we discovered legacy effects from multi-day heat exposure: on 26 June, vegetation with prior cumulative stress (Case A) showed weak morning coupling (R2 = 0.07), while vegetation without prior stress history (Case B) maintained strong coupling (R2 = 0.93). This suggests that cumulative stress alters baseline physiology and can exacerbate midday mismatches; therefore, not just current condition controls photosynthetic regulation. These findings highlight limitations of SIF-based GPP estimation at sub-daily timescales during stress, particularly in heterogeneous peatland systems where canopy composition and physiological responses could vary among plant functional types.

1. Introduction

Peatlands are critical to the global carbon cycle, storing approximately one-third of terrestrial carbon (400–600 Gt) in only 3% of the Earth’s land area, primarily in boreal and subarctic regions [1,2]. This millennia-long accumulation due to slow decomposition in waterlogged conditions makes them critical for climate change mitigation [3].
The carbon balance of peatland ecosystems is influenced by several abiotic factors, including precipitation, temperature, water table depth, and moisture [4,5], as well as biotic factors such as vegetation communities and plant phenology [6,7,8]. Research suggests that a peatland’s net ecosystem productivity (NEP) may decrease with rising air and soil temperatures, as well as increased drought frequency [9,10]. A lower water table depth (WTD) generally reduces the net CO2 sink [11,12,13], although this effect can be mitigated by the movement of floating peat carpets that adjust with WTD oscillations [14]. Additionally, a higher vapour pressure deficit (VPD) affects photosynthesis by increasing evapotranspiration. Under warm conditions, high VPD leads to stomatal closure, a mechanism that prevents excessive water loss but, consequently, reduces photosynthesis due to limited gas exchange at the leaf level [15,16]. Consequently, understanding the physiological responses of peatland vegetation to these stressors is crucial for assessing its resilience under a changing climate and its sustainable contribution to the global carbon balance [17,18].
Remote sensing is widely used to assess the physiological status and phenological phases of plant canopies. Specifically, spectral Vegetation Indices (VIs), such as the Photochemical Reflectance Index (PRI) and Normalised Difference Vegetation Index (NDVI), are commonly used in the monitoring of vegetation health, growth stages, and productivity [19,20]. Furthermore, solar-induced fluorescence (SIF) exhibits a close link to carbon assimilation and serves as a valuable proxy for estimating Gross Primary Production (GPP), the total carbon fixed by plants during photosynthesis [21,22,23,24,25]. Indeed, strong SIF-GPP correlations have been documented across diverse spatial scales using satellite [26], airborne [20,27], and in situ measurements [28], highlighting the importance of this relationship for understanding ecosystem productivity and carbon cycling. Under optimal conditions, a positive correlation has been observed between SIF and GPP across various ecosystems [29,30]. However, this relationship can weaken or even decouple under stress conditions [31,32]. Here, we focus on the SIF-GPP relationship in peatland ecosystems, where a significant knowledge gap remains. These unique environments are characterised by heterogeneous vegetation communities, including mosses, sedges, and shrubs, each with potentially distinct physiological responses to environmental changes.
Peatlands exhibit diurnal variations in GPP, gradually increasing following PAR rising until it peaks in late morning (around solar noon) with maximum instantaneous rates typically ranging from 2 to 17 μmol CO2 m−2 s−1 depending on peatland type and vegetation composition and then experiencing a midday decline in efficiency despite light availability due to a phenomenon known as ‘midday depression’ [33,34,35,36]. This reduction in photosynthesis is a protective response in plants to high light intensity and temperature, involving stomatal closure, photoinhibitory damage, chloroplast positioning, and decreased carbon assimilation, which, consequently, affects the SIF signal [37,38]. While midday depression has been extensively studied in agricultural and forest ecosystems [35,38,39,40], its specific impact on the SIF-GPP relationship in the unique context of peatlands remains less clear.
The complex hydrology and diverse vegetation composition of peatlands further complicate the relationship between SIF and GPP [26]. Dominant plant types such as mosses and sedges exhibit differing photosynthetic capacities and stress responses. For instance, sedges are more tolerant to water table fluctuations compared to the light- and moisture-sensitive mosses [26]. These interspecies variations, coupled with rapid environmental changes (e.g., cloud cover, temperature, and water table depth), drive variable non-photochemical quenching (NPQ) responses that directly modulate photosynthetic efficiency and alter the SIF-GPP relationship throughout the day, making a universal SIF-based GPP estimation challenging [21,30]. Despite these challenges, SIF holds significant potential for monitoring GPP in peatlands [28]. The upcoming European Space Agency (ESA) FLuorescence EXplorer (FLEX) mission [41,42] promises to enhance our understanding of global carbon dynamics, including in peatlands, by providing spaceborne measurements of SIF. However, the success of such missions relies on a thorough understanding of the diurnal variability of SIF, NPQ and its link to GPP, particularly during stress-induced events like midday depression.
A key feature that distinguishes peatlands from other terrestrial ecosystems is their two-layer canopy architecture, comprising an overstory of vascular plants and an understory of bryophytes, predominantly Sphagnum mosses. These plant functional types differ fundamentally in their water acquisition strategies and stress responses. Vascular plants regulate gas exchange through stomata and access deeper water tables via root systems, whereas Sphagnum mosses lack stomata, depend on external water films for CO2 diffusion, and are highly sensitive to surface drying [43,44,45]. Under combined heat and drought stress, this structural and physiological heterogeneity creates conditions for non-synchronous responses: vascular plants may sustain carbon assimilation while Sphagnum fluorescence declines, leading to SIF-GPP decoupling at the canopy level. We hypothesise that this two-layer community structure is a primary driver of the stress-induced decoupling patterns reported in this study, a mechanism that would not manifest in structurally simpler canopies such as croplands or broadleaf forests. Moreover, a negative relationship between fluorescence yield and photochemical yield has been observed in evergreen forests under low-light and low-temperature conditions [46,47]. Conversely, under combined high-light and high-temperature stress, photochemical yield can decrease while fluorescence yield actively rises [30]. This pattern, documented during a Mediterranean heatwave, reflects a critical shift in energy allocation: once non-photochemical quenching (NPQ) reaches full capacity, excess absorbed energy is increasingly dissipated as fluorescence.
This research contributes to peatland carbon cycle research by providing continuous, high-temporal-resolution (~30 s) SIF measurements integrated with chamber-based CO2 flux data—an approach rarely applied in peatland ecosystems. Addressing critical gaps in the current literature, this research aims to: (1) characterise the diurnal variability of SIF and GPP in peatland; (2) elucidate the influence of weather conditions on the SIF-GPP relationship, particularly during midday; (3) investigate the decoupling mechanisms between SIF and GPP under environmental stress; and (4) evaluate the reliability of SIF as a proxy for GPP across different times of day and weather conditions. To address these objectives, we hypothesised that: (H1) the correlation between SIF and GPP will exhibit diurnal variation, with a weakening during the midday period due to stress; (H2) high light and temperature associated with midday depression will lead to a decoupling of the SIF-GPP relationship; and (H3) while SIF holds promise as a GPP proxy in peatlands, its effectiveness will be modulated by both time of day and prevailing weather conditions. Ultimately, the results of this study are expected to address critical limitations in SIF-GPP relationships during midday depression—a period when current SIF algorithms show significant inconsistencies and reduced reliability—provide essential validation data for upcoming remote sensing missions such as FLEX, and advance our understanding of how environmental stressors impact carbon sequestration in these crucial ecosystems.

2. Material and Methods

2.1. Study Area

The research was conducted in the Rzecin peatland, an 86 ha fen located in western Poland (at 52°45′N, 16°18′E, and 54 m above sea level; Figure 1). In the central part, it features an approximately 70 cm thick floating peat carpet and diverse plant communities, including mosses and various vascular species. The area where the measurements were conducted is predominantly occupied by species such as Carex rostrata L., Carex limosa L., Oxycoccus palustris L., and Sphagnum spp. [27]. Due to the presence of the floating peat carpet and large seasonal oscillations of the peatland surface (up to 25 cm per year), the seasonal water table depth (WTD) fluctuations at the middle of the peatland are relatively small (from 0 cm to −15 cm), reaching their minimum in July-August [48]. The local climate of the site aligns with Central Europe’s typical weather patterns, influenced by both oceanic and continental air masses. Specifically, the mean annual air temperature in the Rzecin region stands at 8.6 °C (based on data from 1981 to 2010). Notably, January experiences a mean temperature of −0.9 °C, while July observes an average of 18.9 °C. Furthermore, the average annual precipitation amounts to 551 ± 25 mm, with the highest rainfall in July [14]. These climatic and hydrological conditions significantly shape the ecological dynamics of the Rzecin peatland.

2.2. Sun-Induced Fluorescence and Reflectance Measurements

The irradiance and radiance in the VIS and NIR spectra were measured using the FloX system (JB Hyperspectral Devices, Düsseldorf, Germany). The system was positioned ~2 m above the ground, 70 m southwest of the site for CO2 flux measurements, and the instrument operated from 26 June 2019 to 1 February 2020. The FloX system consists of a thermally stabilised hyperspectral spectrometer (QE-Pro; Ocean Optics, Dunedin, FL, USA) configured for red- to far-red SIF retrieval (650–800 nm with Full Width at Half Maximum (FWHM) ≃ 0.3 nm) and a hyperspectral spectrometer (FLAME; Ocean Optics, Dunedin, FL, USA) for visible (VIS) and near-infrared (NIR) reflectance (400–950 nm with FWHM 1.5 nm). Both non-imaging spectrometers are maintained in a temperature-regulated compartment and connected via a bifurcated fibre optic to an optical shutter, which switches sampled light between fixed upwelling and downwelling channels. The downwelling light is measured through a cosine diffuser, while the upwelling light is measured through fibre optics with a 25° field of view. The system is designed to function fully autonomously in the field and stores data on an internal SD card. Further details are provided in these studies [49,50].
Radiometric calibration and reflectance conversion were processed using the open-source FieldSpectroscopyCC (https://github.com/tommasojulitta/FieldSpectroscopyCC (accessed on 26 May 2025)) and FieldSpectroscopyDP (https://github.com/tommasojulitta/FieldSpectroscopyDP (accessed on 26 May 2025)) toolkits in R 4.3.2 [51].
Canopy SIF retrievals were derived from the QE-Pro spectrometer. In particular, SIF was accurately computed by taking advantage of more than 400 spectral bands in the oxygen absorption band (O2-A) at 760 nm using the Improved Fraunhofer Line Discrimination Method (iFLD). A FLAME spectrometer (VIS-NIR) was used for calculating the spectral indices. PRI was calculated as follows in Equation (1) [52]:
P R I = R 531 R 570 R 531 + R 570    

2.3. Chamber Measurements of CO2 Fluxes and GPP Calculations

The study involved measuring carbon dioxide fluxes using a portable chamber system, as outlined in previous research [28,53]. This system included a gas analyser (Li-840, LI-COR Biosciences, Lincoln, NE, USA) housed in a portable box, along with two types of chambers—a transparent one made of Plexiglas and an opaque one made of polyvinyl chloride (PVC) for measurements of net ecosystem exchange (NEE) and ecosystem respiration (Reco) fluxes, respectively. The chambers’ dimensions were 0.78 × 0.78 × 0.50 m, and their volume was 0.296 m3. The air circulated between the chambers and the gas analyser in the closed loop through the Teflon tubes. Each chamber was equipped with a temperature and humidity sensor, computer fans to mix the air, and a vent for equalising air pressure. The transparent chamber also had PAR quantum sensors (SKP215; Skye Instruments, Llandrindod Wells, Powys, Wales, UK) to measure light intensity. The chambers were placed on permanently installed PVC frames (0.75 × 0.75 m). Measurements were conducted on 29 June on three plots located approximately 70 m south of the tower with the FloX system (Figure 1), which had similar vegetation species composition and hydrological conditions. The spatial representativeness of SIF measurements relative to chamber-based GPP was validated through multi-temporal UAV spectral imaging (2022–2024, n = 12 flights), demonstrating exceptionally high spectral similarity (r = 0.98) between the FloX tower footprint and chamber measurement sites (Supplementary Figure S1). Measurements began in the morning when photosynthetically active radiation (PAR) exceeded 400 µmol m−2 s−1 and continued until late afternoon to capture the diurnal variations in PAR and air temperature (Tair). The maximum chamber closure time was 1.5 and 2.5 min for NEE and Reco measurements, respectively. Reco measurements were performed immediately after NEE, with a time gap of less than one minute between the two, assuming stable Tair conditions, to enable accurate calculation of gross primary production (GPP). GPP for each plot was estimated as the sum of consecutively measured NEE and Reco. Three to four measurements were taken per plot, resulting in 12 individual GPP flux estimations per day.
GPP at 30 s intervals was estimated from long-term continuous measurements conducted at the Rzecin site as part of ongoing ecosystem monitoring [54]. Chamber-based CO2 flux measurements were conducted periodically throughout the year; for the study period (26 June–2 July 2019), measured GPP values were extracted from this dataset.
To achieve the 30 s temporal resolution required for coupling analysis with high-frequency SIF measurements, we interpolated between discrete chamber measurements using a modified Michaelis–Menten light-response model (Equation (2)) based on temperature stress factors defined based on Equation (3):
G P P = G P m a x · α · P A R · T f G P m a x + α · P A R · T f
T f = 2 exp 0.53 T a v g T o p t + x 1 45 T o p t + x 1 , T a v g > T o p t + x 1 2 exp 0.615 T o p t x 2 T a v g T o p t x 2 , T a v g < T o p t x 2 1 , T o p t x 2 T a v g T o p t + x 1
where GPmax is the maximum photosynthetic rate (µmol CO2 m−2 s−1) and α is light-use efficiency (mol CO2 mol−1 photons). Tf is an exponential temperature factor used to correct the Michaelis–Menten approach [54], penalising non-optimum temperatures. It considers an optimum air temperature (Topt) of 24.5 °C for peatland vegetation defined by [55] for the Rzecin peatland. The range of the Topt is defined with x1 and x2, using the temperatures in which the model performed the best. Model parameters (GPmax, α and Tf) were derived from measured GPP, PAR and Tair data (collected at 30 s intervals) during the study period, ensuring consistency with observed ecosystem behaviour during the stress events examined. The parameterised model was applied to all study days using continuously measured PAR and Tair at 30 s resolution, with parameters held constant across cases to enable direct comparison of SIF-GPP relationships under varying environmental conditions. This approach provided sub-diurnal temporal resolution while remaining grounded in measured chamber fluxes [54]. And to validate the high-frequency GPP model against direct observations on stress days, we overlaid raw chamber measurements from the plot on the modelled light-response curve (Figure S3). All chamber-based CO2 flux measurements were processed, and GPP was calculated using MATLAB R2023b (MathWorks, Inc., Natick, MA, USA).

2.4. Data Selection (Selected Cases)

Specific stress events were selected during periods when air temperature (Tair) exceeded 25 °C and vapour pressure deficit (VPD) exceeded 15 hPa, thresholds previously identified as approximating the optimum conditions for photosynthesis at the Rzecin study area, above which photosynthetic limitation due to stomatal regulation becomes increasingly likely, which was established in these studies [8,55]. These thresholds are not universal physiological constants and should not be transferred to other peatlands without independent calibration. Two analytical case studies were subsequently defined to investigate contrasting patterns of the SIF–GPP relationship (Table 1). The terms before stress, during stress, and after stress describe the temporal sequence relative to the focal acute stress event analysed within each case. These terms should therefore be interpreted as chronological labels rather than indicators of the complete absence or presence of physiological stress. Consequently, the before stress period may already reflect physiological conditions inherited from antecedent weather, whereas the after stress period may still contain recovery or residual stress effects.
Case A was centred on the acute heat-stress event of 27 June 2019, when air temperature exceeded the optimum threshold and pronounced midday depression of photosynthesis was observed. The preceding day (26 June) was designated as the before stress period because it immediately preceded the focal event. Although this day already showed evidence of a physiological legacy resulting from the preceding sequence of hot days (24–26 June), it was retained as the pre-event reference to quantify how antecedent stress influenced the response on the focal stress day. The following day (28 June) was designated as the after stress period to evaluate the immediate post-event response. Case B was centred on the consecutive acute heat-stress period of 29–30 June 2019, characterised by repeated midday depression under elevated temperatures. Within this analytical window, 28 June served as the before stress period because it immediately preceded the focal event, while 1–2 July represented the after stress period. Although 28 June also constitutes the post-event day for Case A, it fulfilled a different analytical purpose in Case B. The two cases were analysed independently to examine different patterns of SIF–GPP decoupling, and the assignment of calendar days to more than one case does not imply statistical dependence between them.

2.5. Meteorological and Hydrological Measurements

Meteorological measurements (METEO) were taken alongside SIF, GPP, and WTD observations. Air temperature (Tair) was recorded using HygroVue5 sensors (Campbell Scientific, Logan, UT, USA) with a ventilated radiation shield installed 2.0 m above the surface at the tower with the FloX system and 0.3 m above the surface at the chamber measurement plots. Photosynthetically active radiation (PAR) was measured at the tower using a BF5 sensor (Delta-T Devices Ltd., Burwell, Cambridge, UK) installed 2.5 m above the surface. Both Tair and PAR data were logged by the CR1000 datalogger (Campbell Scientific, Logan, UT, USA) at 30 s intervals. Precipitation observations were made using the A-Ster TBG 124 tipping-bucket rain gauge (A-Ster, Krakow, Poland). WTD was recorded using TD-divers (Royal Eijkelkamp, Giesbeek, The Netherlands) installed in PVC piezometers, which were securely fixed to a wooden boardwalk. These measurements were adjusted for peatland surface oscillations, using the boardwalk as a reference [48].

2.6. Quality Control and Sampling of SIF and Reflectance Data

Before analysing the data, quality control measures were implemented for canopy reflectance and SIF. Measurements taken on rainy or cloudy days were excluded, as SIF retrieval is more reliable under clear skies with gradual illumination changes, unlike the unpredictable fluctuations under cloud cover [56]. The retained days were predominantly clear-sky, though rapid transient cloud passages lasting seconds to minutes occurred on some of these days. These brief events are captured in the 30 s data and contribute to scatter in SIF and GPP time series, but they do not invalidate the clear-sky analytical framework, as they represent natural high-frequency PAR variability rather than systematic illumination bias. Additionally, a 5-reading average window-based outlier detection was applied to all data collected by the FLoX, which helped smooth out short-term atmospheric fluctuations that could lead to unreliable SIF and reflectance values. SIF O2-A values below zero and above 2.5 were filtered out.

2.7. Correlation and Regression Analysis

The relationship between SIF and GPP fluxes was evaluated using non-parametric Spearman’s Rank Order Correlation within the regression analysis for different periods: diurnally (for all measured variables after sunrise till late afternoon from 6 am to 5 pm), before noon (9–11), around noon (11–13), and afternoon (13–15). Because our measurements were recorded at an extremely high temporal resolution (~30 s), consecutive data points could exhibit strong temporal autocorrelation. Consequently, the effective degrees of freedom in our dataset are smaller than the absolute number of observations. Therefore, the linear regression analyses presented herein are not intended to serve as absolute predictive models, but rather as diagnostic tools to highlight relative shifts in diurnal coupling strength between different stress phases. Correlation coefficients, statistical significance and regression analyses were calculated using MATLAB R2023b (MathWorks, Inc., Natick, MA, USA), with correlation coefficients computed using the corr function (Spearman’s rank order) and regression fitting using the fit function with appropriate model types. The dependency between GPP and biophysical parameters was examined using simple exponential or linear regression and second-order polynomial regression models to obtain their associated statistics (root mean square error (RMSE), p-value).

2.8. Absolute Delta (/Δ/) Analysis

A delta (Δ) analysis was conducted to quantify the magnitude of change in GPP, SIF O2-A, PRI, PAR, VPD, and Tair between different physiological states and during the stress periods. Deltas were calculated as the absolute difference in mean values between specific time periods, providing insights into the response of different variables to stress conditions within the context of cases A and B. The terms used in these comparisons, such as ‘Morning Before stress’ or ‘Noon stress’, specifically refer to the mean values of the respective variable calculated within defined diurnal time windows: Morning (9:00–11:00), Noon (11:00–13:00), and Afternoon (13:00–15:00). These mean values were computed using data collected on the specific calendar dates previously designated as ‘before’, ‘stress’, or ‘after’ for Case A and Case B (as defined in Section 2.4). The comparisons are defined as follows for variables within the cases: The purpose of the delta analysis is to quantify the absolute magnitude of change in each variable between stress and non-stress periods, complementing the correlation-based analyses in Section 3.2 and Section 3.3, which describe the shape and strength of the SIF-GPP relationship but not the absolute magnitudes. The significance of each before-after comparison was tested with the Mann–Whitney U test (Supplementary Table S2).
(a)
|Mean (Morning Before stress)—Mean (Morning stress)|: Absolute difference between the mean morning value on ‘before stress’ days and the mean morning value on ‘stress’ days.
(b)
|Mean (Morning After stress)—Mean (Morning stress)|: Absolute difference between the mean morning value on ‘after stress’ days and the mean morning value on ‘stress’ days.
(c)
|Mean (Noon Before stress)—Mean (Noon stress)|: Absolute difference between the mean noon value on ‘before stress’ days and the mean noon value on ‘stress’ days.
(d)
|Mean (Noon After stress)—Mean (Noon stress)|: Absolute difference between the mean noon value on ‘after stress’ days and the mean noon value on ‘stress’ days.
(e)
|Mean (Afternoon Before stress)—Mean (Afternoon stress)|: Absolute difference between the mean afternoon value on ‘before stress’ days and the mean afternoon value on ‘stress’ days.
(f)
|Mean (Afternoon After stress)—Mean (Afternoon stress)|: Absolute difference between the mean afternoon value on ‘after stress’ days and the mean afternoon value on ‘stress’ days.
For each comparison, the variable’s mean value was calculated for both conditions (e.g., noon before stress, noon stress), and the absolute difference between these mean values was taken as the delta value. To provide a measure of uncertainty and estimate the significance of these mean differences, the standard error for each delta was calculated based on the sample sizes and standard deviations using the following formula:
S E = s t d g r o u p 1 2 N g r o u p 1 + s t d g r o u p 2 2 N g r o u p 2 ,
These standard errors are represented as error bars on the respective bar plots.

3. Results

3.1. Dynamics of Meteorological and Hydrological Conditions

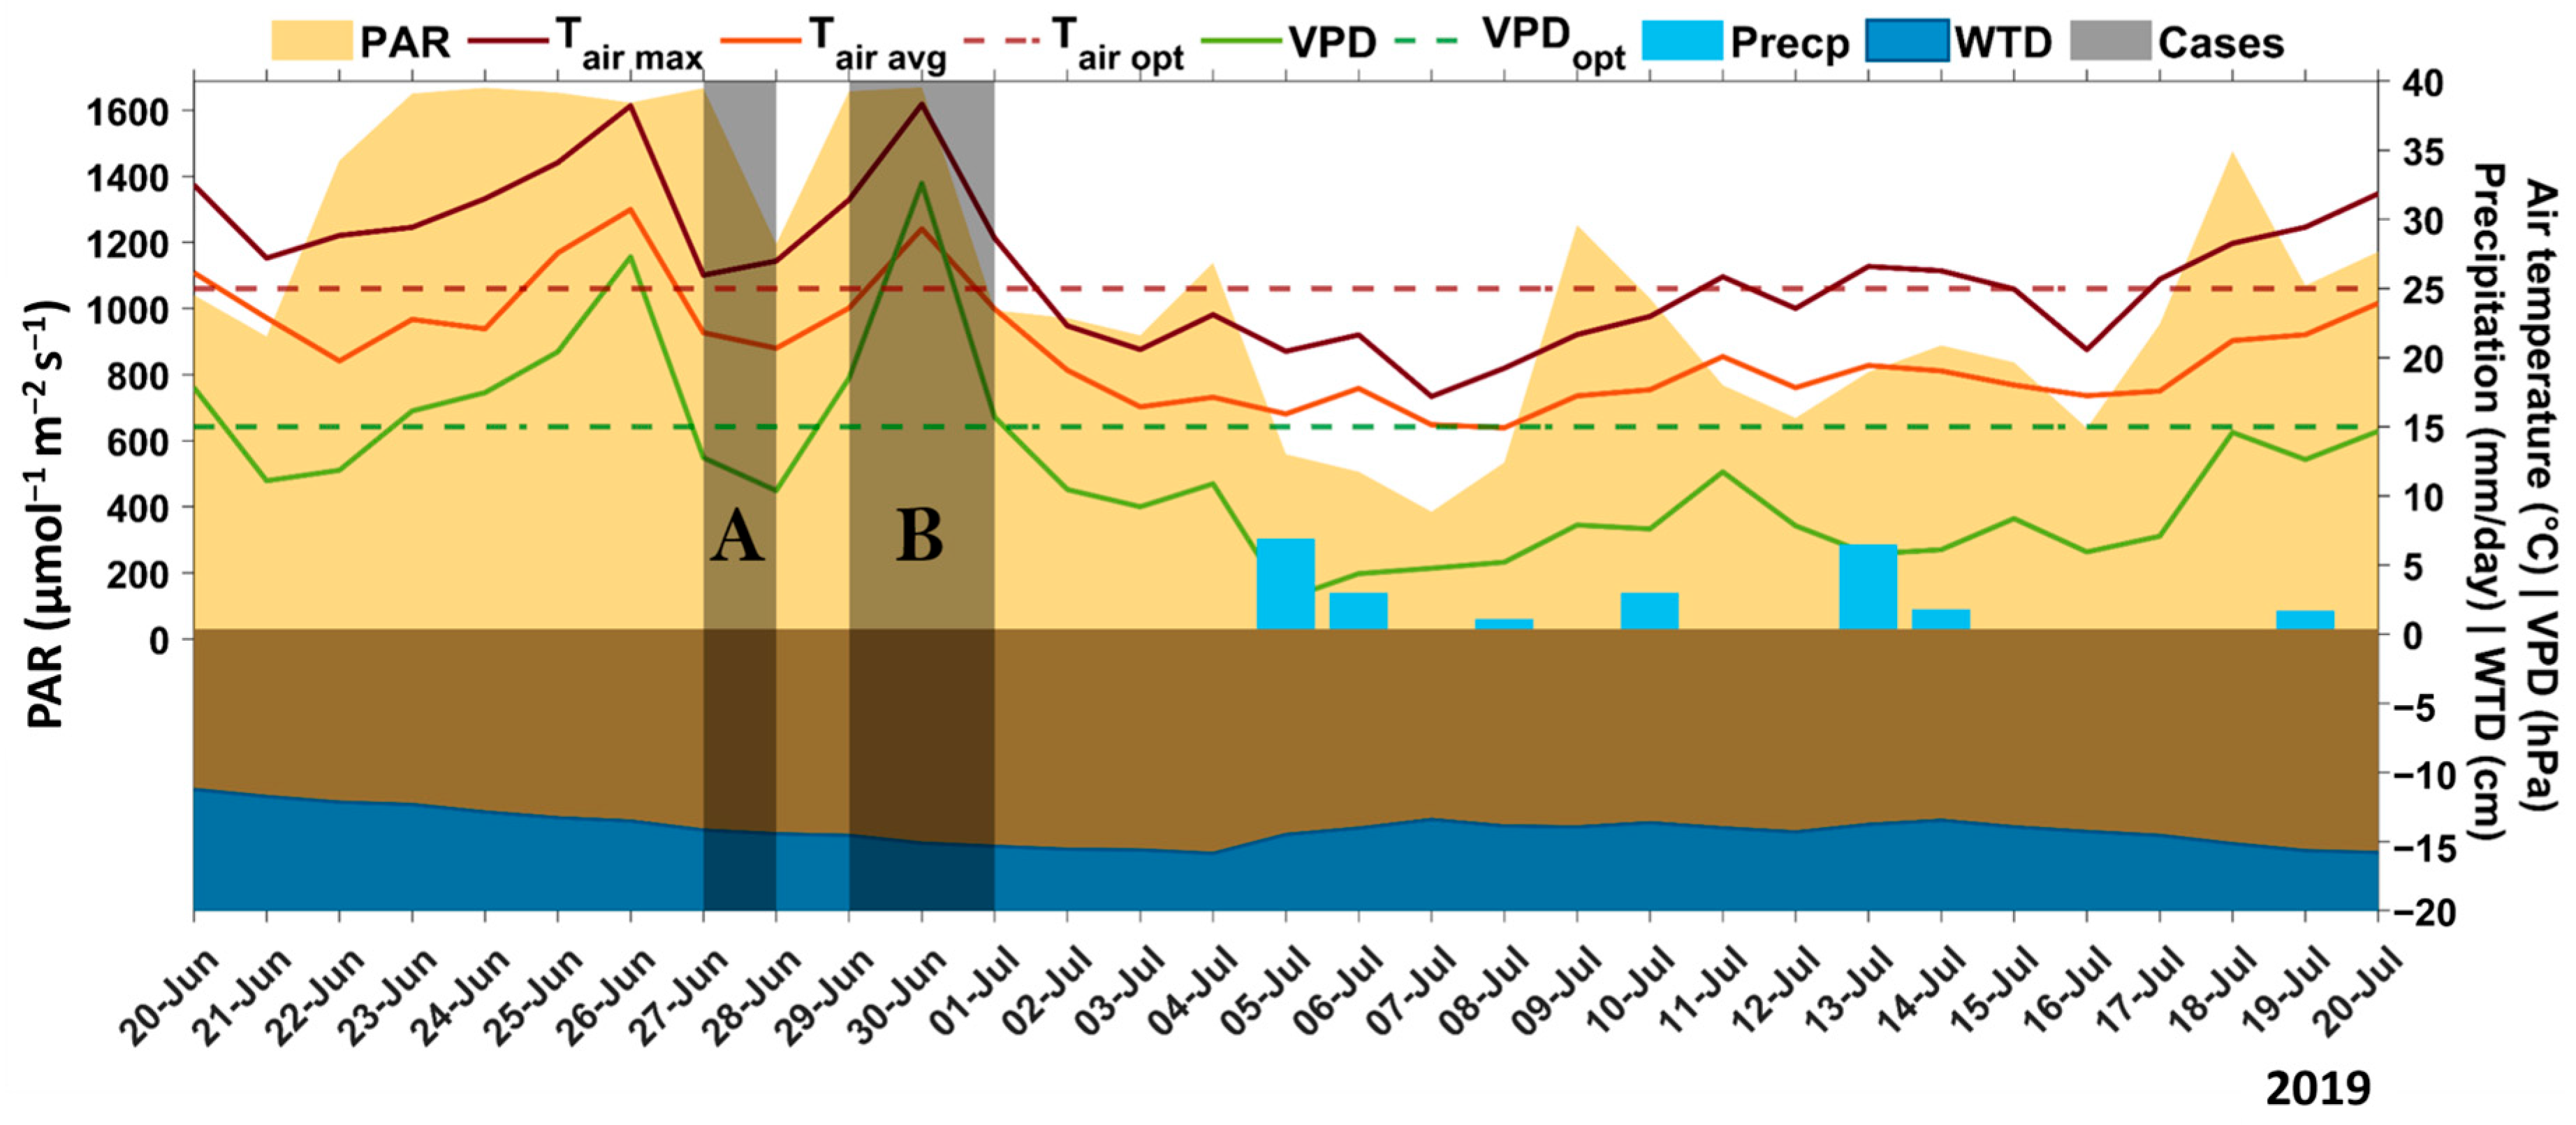
Figure 2 presents environmental variables measured from 20 June to 20 July 2019, including PAR, WTD, precipitation, Tair, and VPD. During the experiment, the PAR levels remained high, with an average midday intensity of 1600 µmol m−2 s−1 from 10:00 to 15:00 during June and July. Such elevated radiation, particularly during the identified stress events, caused light stress in combination with high temperatures, VPD, and a lack of precipitation.
Precipitation showed marked variability, with irregular rainfall events scattered across the season. The chosen stress events occurred during 16 days without rainfall that started on 20 June and lasted until the first week of July (16 consecutive days). This pattern, coupled with the decline in WTD from approximately −16 cm to −20 cm, contributed to the change. Tair followed a clear diurnal pattern, with daytime averages ranging from approximately 20 °C to 28 °C during late June and early July, particularly during the periods of 23–26 June and 29–30 June, with maximum air temperature (Tair max) ranging from 27 °C to 38 °C. Simultaneously, VPD values exceeded the optimum threshold of 15 hPa, indicating increased evaporative demand. Elevated Tair and VPD, simultaneously with reduced precipitation and deeper water table levels, created synergistic conditions that intensified plant water stress. The shaded regions in Figure 2 define the stress periods (Cases A and B), offering a representative cross-section of the meteorological and hydrological dynamics. On 27 June 2019, case A was a midday stress event. Over the previous three consecutive days, the average noon Tair peaked at 28.6 °C (±0.8 °C), exceeding the site’s optimum temperature by 4.1 °C. Concurrently, VPD reached 26 hPa (±1.2 hPa), nearly 74% higher than the optimum average VPD, while PAR at midday averaged from 1600 to 1700 µmol m−2 s−1 under a cloudless sky. Hydrologically, the WTD dropped to −17 cm (±2 cm), negatively impacting peat moisture in the upper layers, which is the root zone for the plants. The lack of precipitation during this period intensified atmospheric drought, creating a compound stress environment where both hydrological and meteorological factors challenge vegetation resilience.
Case B, which occurred on 29–30 June 2019, illustrated the effects of prolonged stress. Average Tair remained above 25 °C, peaking at 26.4 °C (±0.7 °C), while VPD persisted above 15 hPa (average daytime), reaching 30 hPa (±1.5 hPa) on both days. PAR intensity remained consistently high (1600–2000 µmol m−2 s−1), and WTD declined further to −17 cm (±2 cm), marking the driest conditions in late June. The extended lack of precipitation amplified moisture limitations, particularly for Sphagnum mosses, which rely on surface water availability.

3.2. SIF, GPP, and PRI Temporal Trends

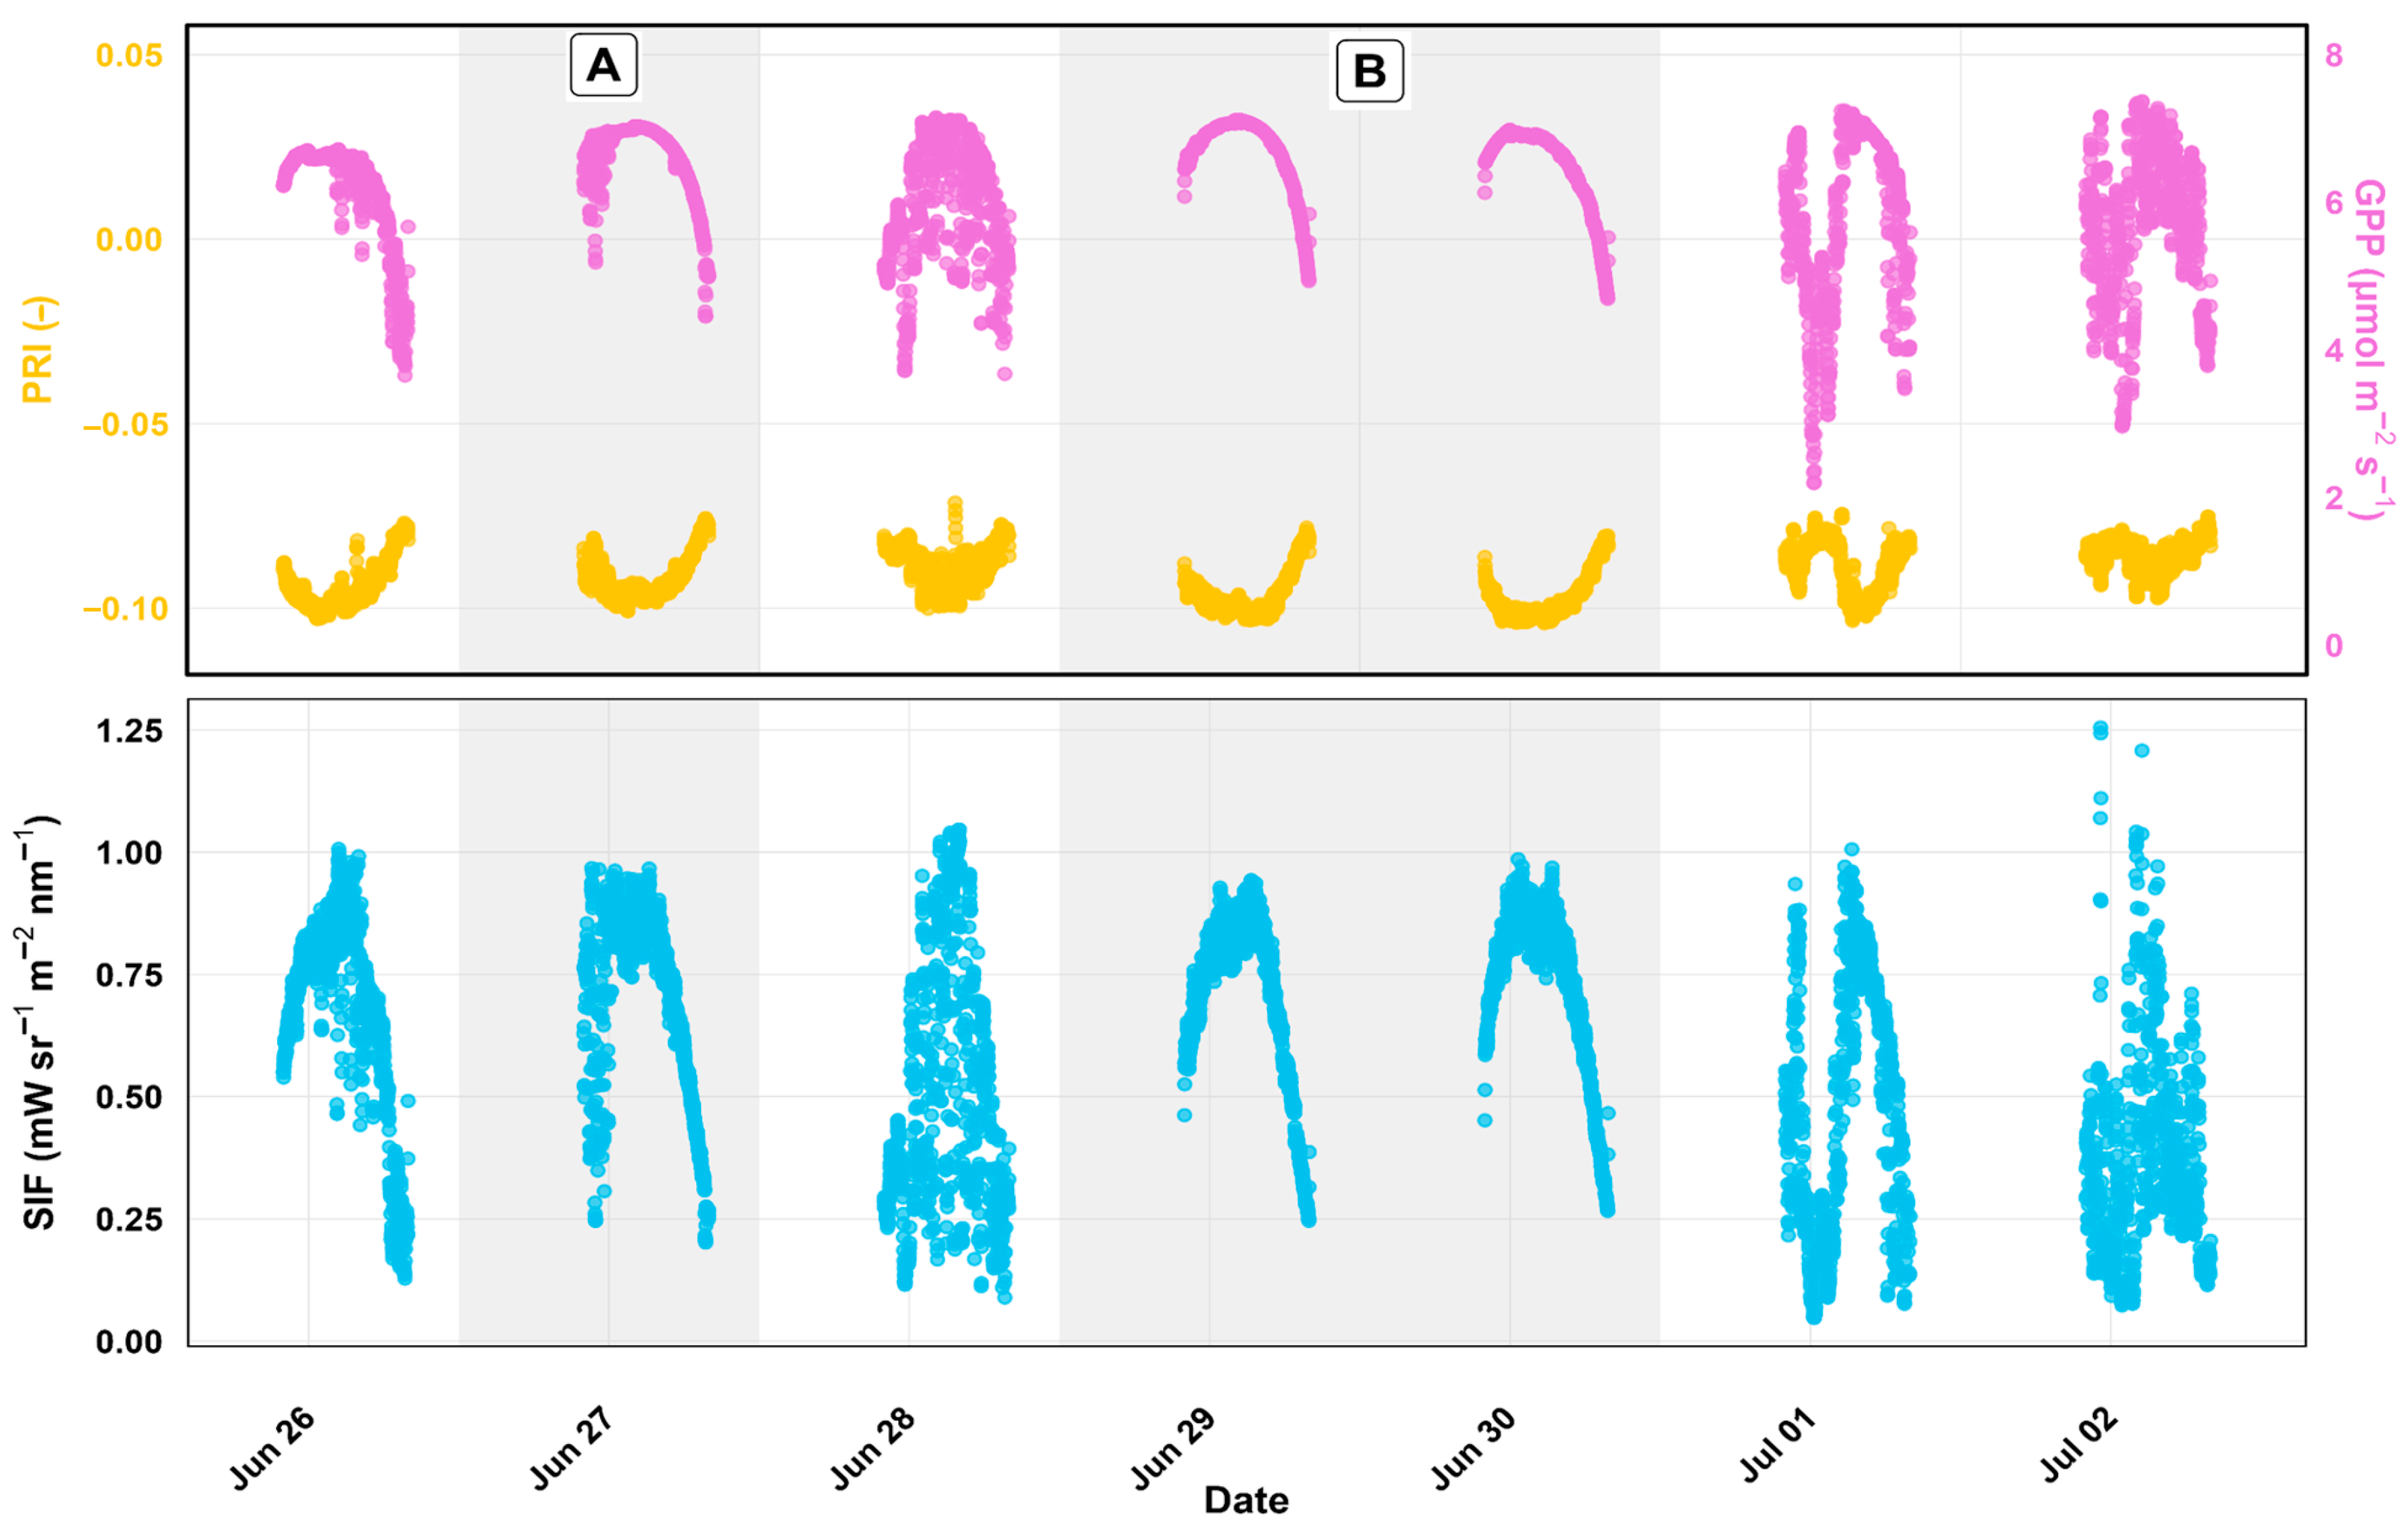
Figure 3 presents the temporal dynamics of three vegetation parameters (PRI, GPP, and SIF O2-A), emphasising the responses of photosynthesis to a changing environment from 26 June to 2 July 2019. All three parameters exhibit diurnal behaviour, characterised by a gradual increase in the morning and a gradual decrease in the afternoon, on all days except 1 July, when the late morning was cloudy. During the highlighted cases A and B, a midday dip in both PRI and SIF O2-A can be observed. For instance, SIF O2-A exhibited pronounced midday depression, declining by approximately 0.02–0.19 mW sr−1 m−2 nm−1 from peak morning values during both stress cases. This midday SIF suppression coincided with PRI decline from 0.10 to 0.07–0.08 (±0.02), indicating photoprotective xanthophyll de-epoxidation [52]. GPP showed diurnal variation with peak values of ~6–7.5 μmol CO2 m−2 s−1, exhibiting less pronounced midday depression compared to SIF. Notably, GPP displayed increased scatter on 28 June (after stress in Case A), suggesting high-frequency variability in photosynthetic response during recovery. As the data have a very high temporal resolution (approximately 30 s intervals), they reveal the variations and rapid changes in the cloud, which are primarily represented by scatter points in GPP and SIF.

3.3. SIF-GPP Coupling Dynamics Across Stress Scenarios

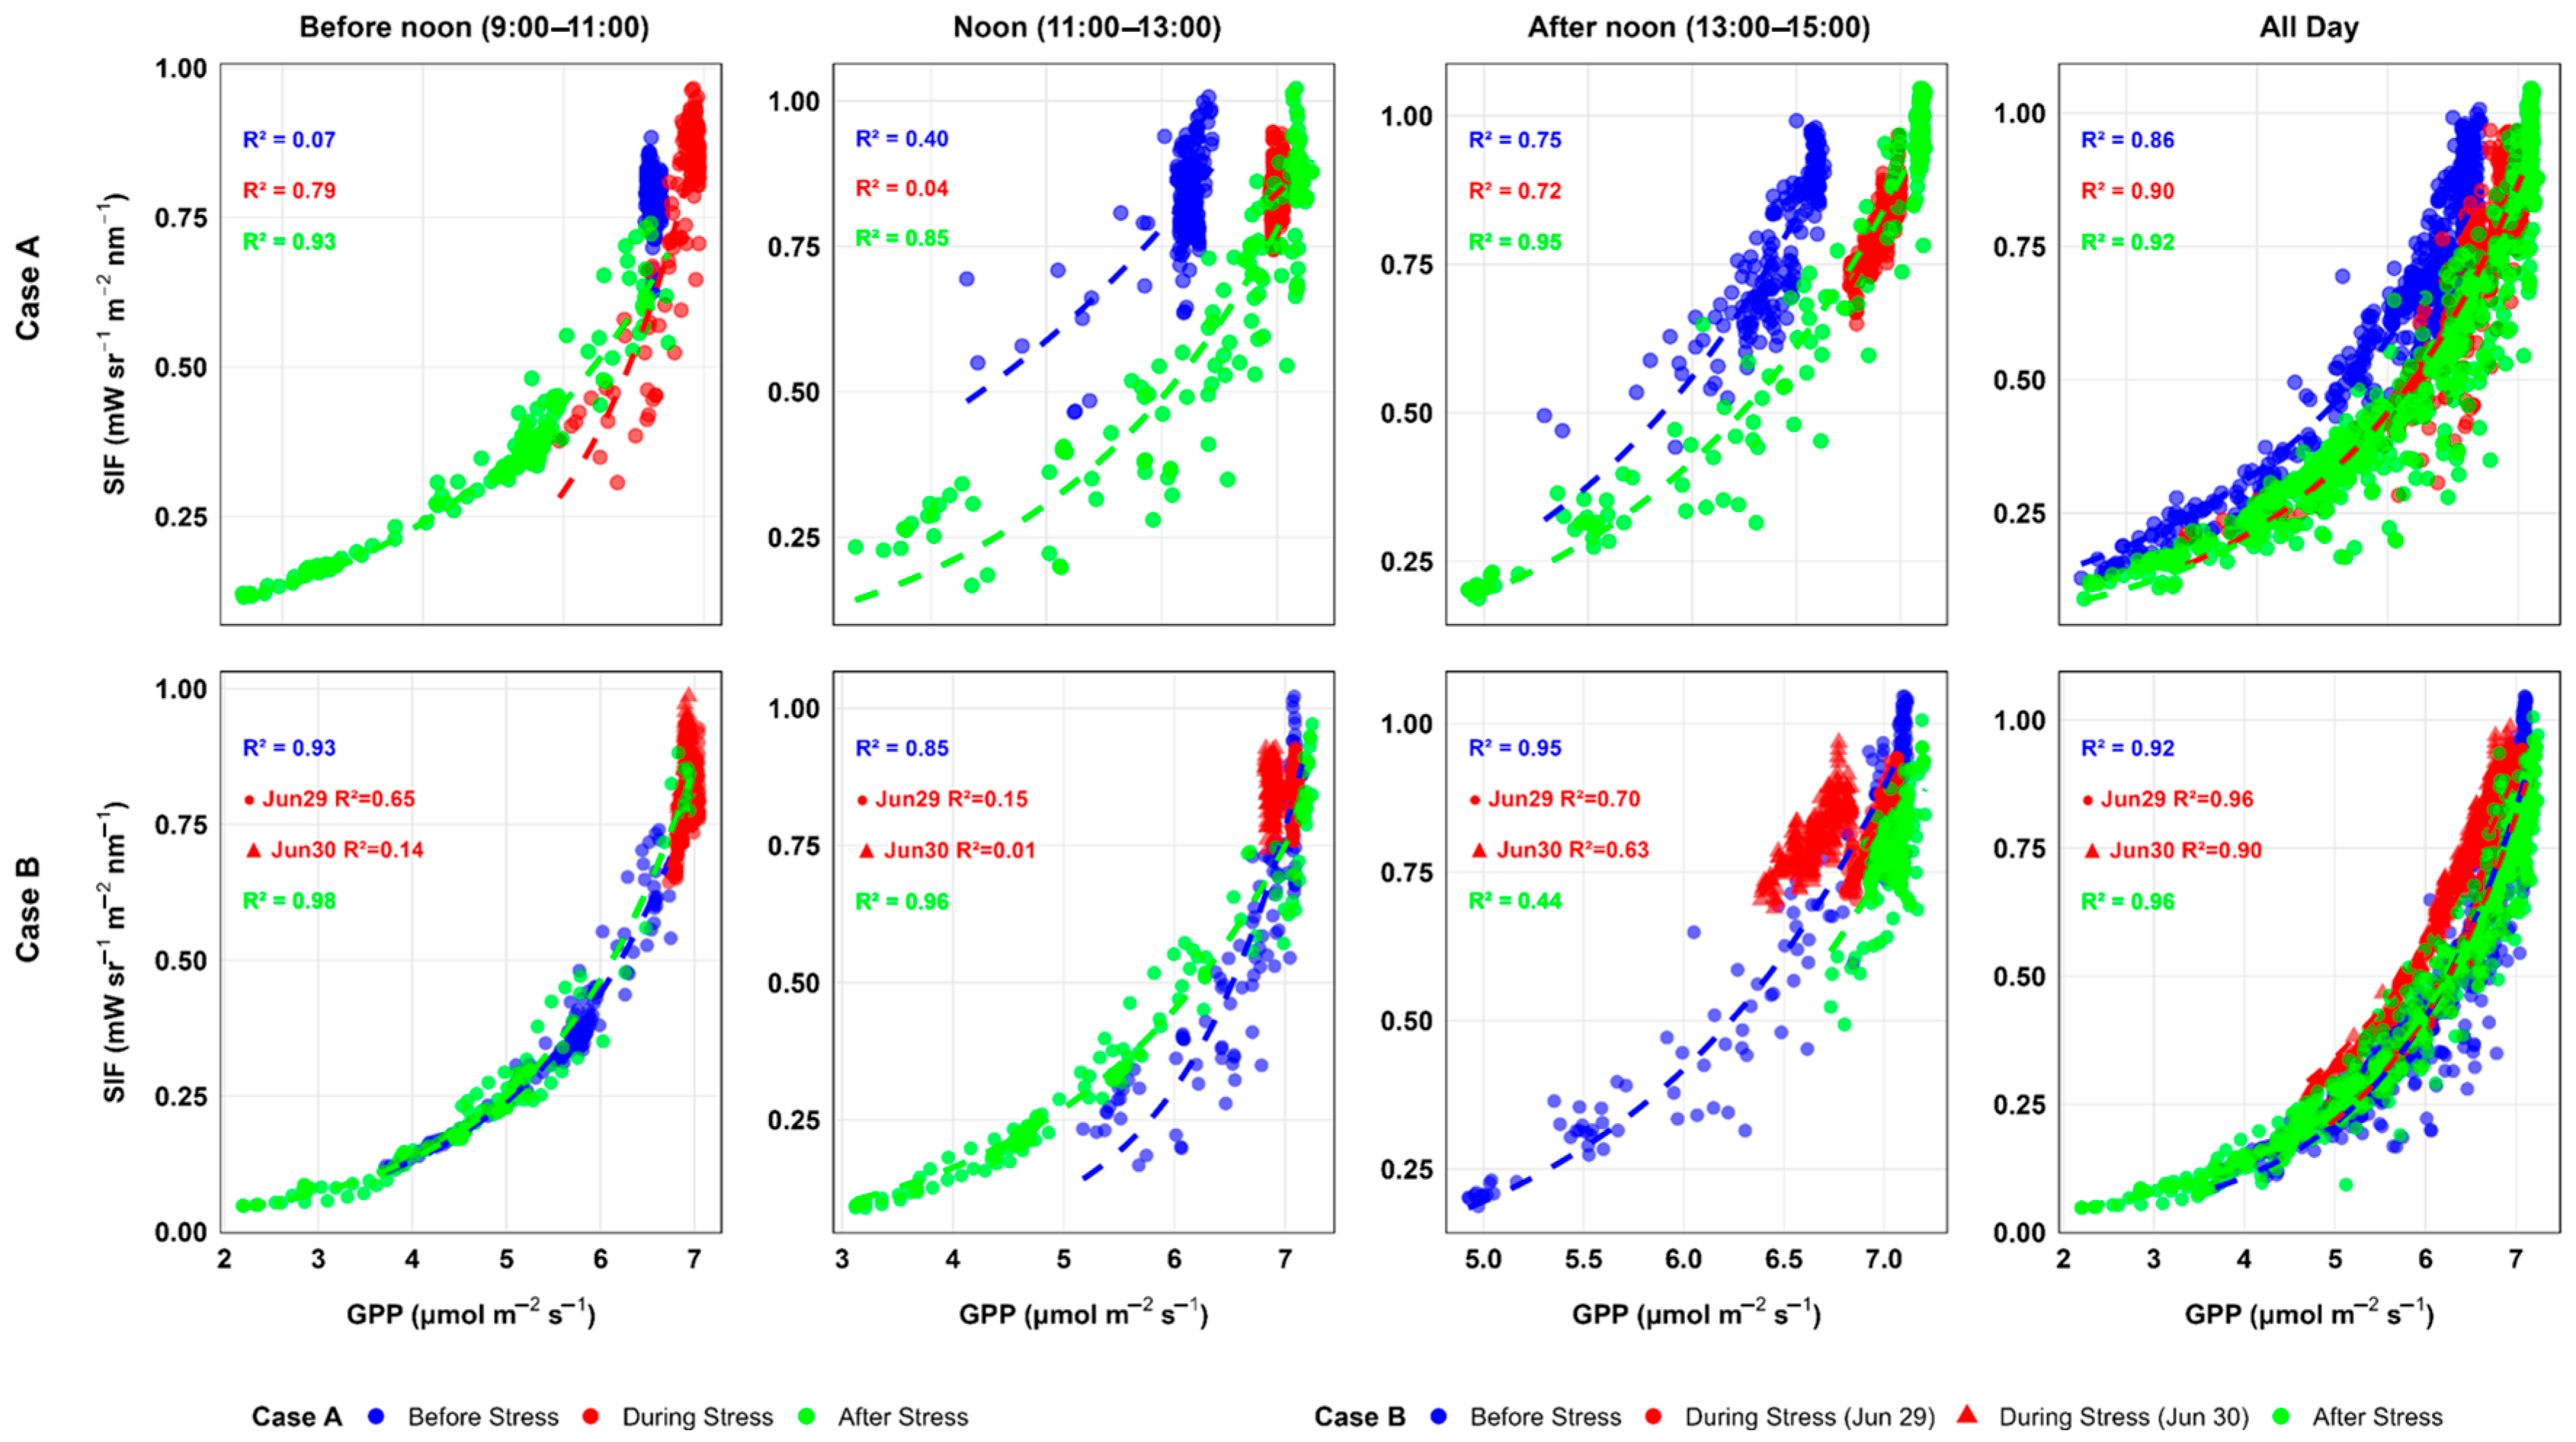
Figure 4 presents SIF-GPP correlations partitioned by time of day (before noon: 9:00–11:00; noon: 11:00–13:00; afternoon: 13:00–15:00) and stress phase (Table S1). The analysis reveals pronounced diurnal and multi-day variability in coupling strength, with distinct patterns differentiating legacy stress (Case A) from acute stress (Case B).
Case A shows the legacy effect signature on 26 June (legacy stress: 23–25 June cumulative warming; 27 June midday depression stress; 28 June recovery). Morning SIF-GPP correlation was highly disrupted (R2 = 0.07, RMSE = 0.040 mW sr−1 m−2 nm−1, p < 0.001), despite favourable environmental conditions (PAR 600–1200 μmol m−2 s−1, Tair 18–25 °C, VPD 8–12 hPa, all within optimal ranges), and it strengthened progressively through upcoming periods, noon (R2 = 0.40) and afternoon (R2 = 0.75). This temporal progression suggests cumulative stress from 23 to 25 June had already compromised morning photosynthetic regulation. The daily correlation (R2 = 0.86) masked this pronounced morning disruption. On 27 June (peak stress day), morning correlation strengthened dramatically (R2 = 0.79), but noon decoupling was nearly complete (R2 = 0.04, p = 0.01), with SIF exhibiting pronounced depression while GPP remained relatively stable. Afternoon correlation recovered strongly (R2 = 0.72), and daily correlation remained high (R2 = 0.90), demonstrating that daily averaged metrics hide critical stress responses. On 28 June (recovery day), correlations strengthened across all periods (morning R2 = 0.93, noon R2 = 0.85, afternoon R2 = 0.95, all-day R2 = 0.92), indicating rapid physiological recovery.
Case B provides critical contrast. On 28 June (same calendar date as Case A recovery but serving as pre-stress baseline), correlations were consistently strong across all time windows: before noon R2 = 0.93, noon R2 = 0.85, afternoon R2 = 0.95, and all-day R2 = 0.92. This 13-fold difference in morning correlation between cases (0.93 vs. 0.07) on the same date, under comparable instantaneous environmental conditions, strongly suggests a legacy stress component linked to antecedent thermal history, though we cannot fully exclude contributions from unmeasured variables such as soil moisture at the measurement plots. During acute stress, two consecutive days revealed progressive decline. On 29 June, morning correlation weakened moderately (R2 = 0.65), midday collapsed substantially (R2 = 0.15), and afternoon remained relatively strong (R2 = 0.70). On 30 June, morning decoupling intensified (R2 = 0.14), and midday correlation approached zero (R2 = 0.01, p = 0.33, non-significant), indicating complete physiological decoupling. Daily correlations remained high on both days (R2 = 0.96, R2 = 0.90), again masking sub-daily stress signals. Post-stress recovery (1–2 July) showed strong correlations (morning R2 = 0.98, noon R2 = 0.96), though afternoon weakened (R2 = 0.44), possibly reflecting different environmental conditions rather than persistent stress. Worth mentioning is that the range-restriction effect inherent to narrow time windows cannot account for the observed decoupling, as the same two-hour noon window on non-stress days (28 June noon: R2 = 0.85, N = 191) produced strong correlations. Moreover, the 79-fold asymmetry in morning SIF changes between Case A and Case B (Section 3.4) provides magnitude-based evidence independent of correlation statistics.
The key distinction between cases lies in pre-stress morning dynamics. Legacy stress (Case A, 26 June morning R2 = 0.07) contrasts sharply with no-legacy conditions (Case B, 28 June morning R2 = 0.93). Both cases exhibited midday decoupling during peak stress (R2 = 0.04 and 0.01), indicating shared photoprotective responses. Critically, all-day correlations (R2 = 0.86–0.96) consistently obscured sub-daily stress signals in both cases, with major implications for satellite remote sensing applications relying on single daily overpasses.

3.4. Quantifying Stress Response Through Delta Analysis

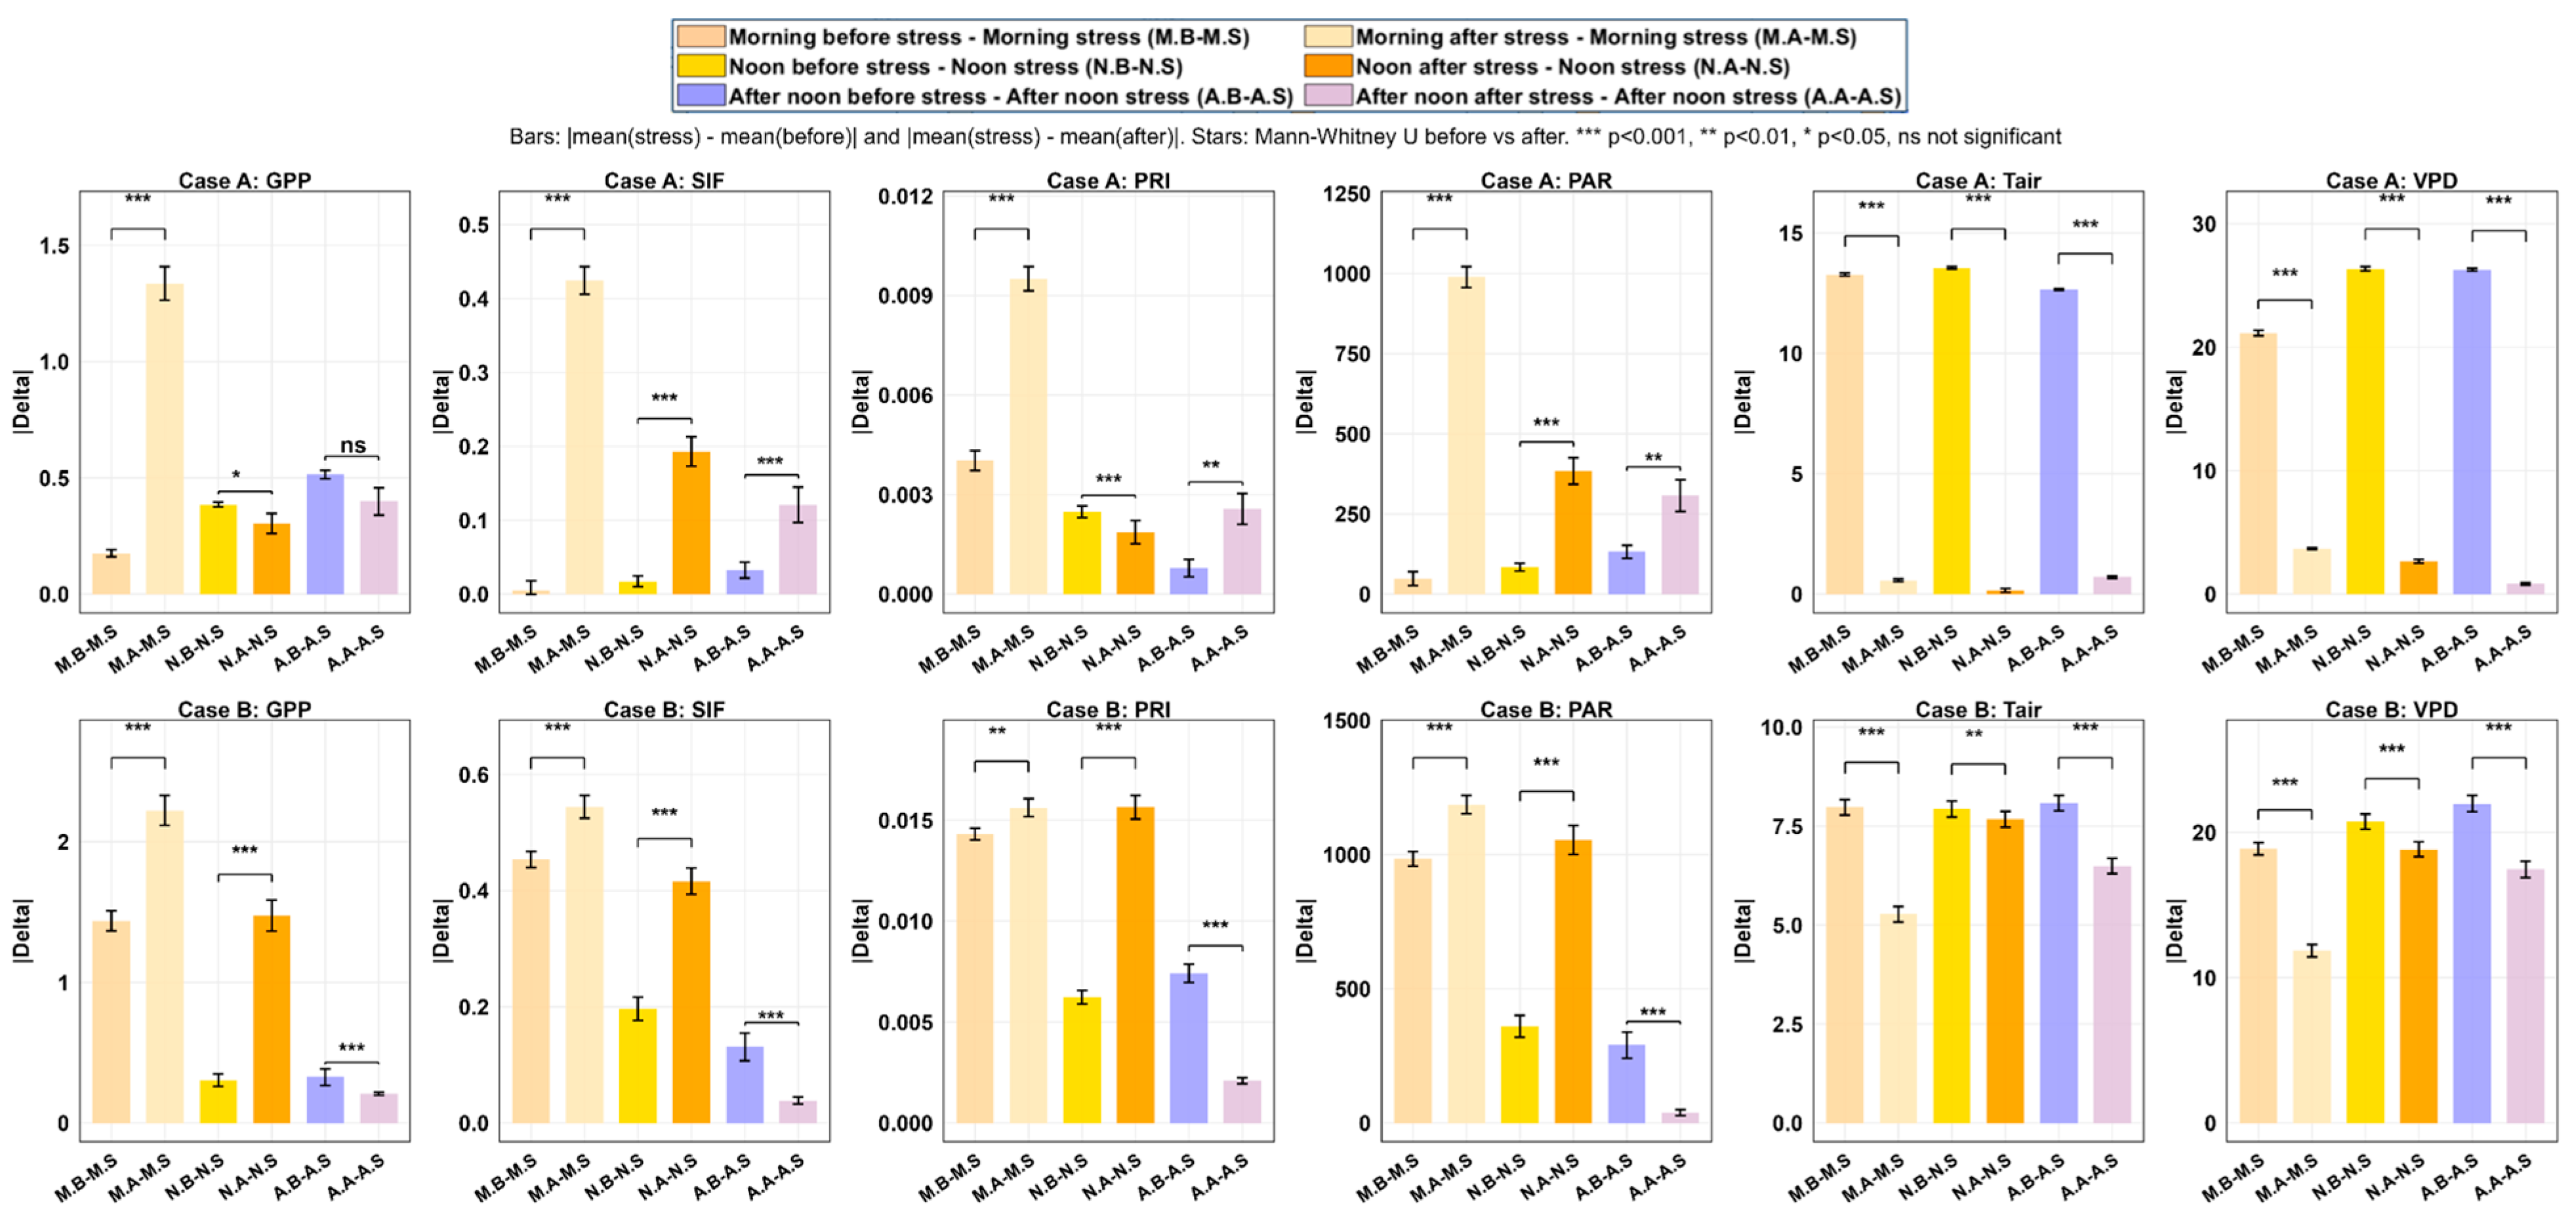
To quantify the physiological impact of stress across different times of day, we calculated absolute differences (|Δ|) between stress and non-stress periods for GPP, SIF, PRI, and environmental drivers (Figure 5, Table S2). The results clearly distinguished legacy stress in Case A (26 June) from the midday depression event centred on 27 June in the same case; moreover, they separated the acute stress (midday depression; 29–30 June) in Case B as well.
In Case A, which reflects legacy effects linked to 26 June, the strongest signal appears in the morning. Morning GPP after stress (µmol m−2 s−1) reached 1.34 ± 0.07, compared with only 0.20 ± 0.02 before stress. This 6.8-fold increase indicates that the recovery morning deviated far more from the stress day than the pre-stress morning did. In contrast, at noon, values were 0.41 ± 0.01 before and 0.30 ± 0.04 after stress. In the afternoon, they were 0.50 ± 0.02 before and 0.40 ± 0.06 after stress. These patterns show that the main disruption occurred in the morning, while the afternoon responded more proportionally.
SIF amplifies this asymmetry. Morning SIF after stress (mW sr−1 m−2 nm−1) reached 0.42 ± 0.02, while before stress it was only 0.005 ± 0.01. This extreme contrast explains the broken morning SIF GPP correlation in the morning of 26 June and the slow recovery trajectory. At noon, SIF deltas (mW sr−1 m−2 nm−1) increased from 0.02 ± 0.007 before stress to 0.19 ± 0.02 after stress. Afternoon values followed the same direction, 0.03 ± 0.01 before and 0.12 ± 0.02 after stress. These results show that fluorescence remained strongly affected during recovery, especially in the morning, which is consistent with our observation of severe morning SIF-GPP decoupling (R2 = 0.07).
PRI supports this interpretation when it is interpreted correctly as an indicator of NPQ. Higher PRI deltas reflect stronger photoprotective engagement. In Case A, morning PRI increased from 0.0040 ± 0.0003 before stress to 0.0095 ± 0.0004 after stress. This 2.4-fold increase indicates sustained NPQ during recovery mornings. At noon, PRI deltas were similar before and after stress, 0.0025 ± 0.0002 and 0.0019 ± 0.0003, indicating that midday photoprotection responded more symmetrically.
Environmental drivers confirm that this asymmetry does not arise from concurrent forcing. In Case A, Tair and VPD deltas were large before stress, around 13 °C and 2.6 hPa, respectively, but small after stress, around 0.6 °C and 0.3 hPa in the morning. Despite similar temperature and VPD between stress and recovery days, physiological deltas increased strongly after stress. This mismatch quantifies the legacy effect. The vegetation state depended on prior exposure on 26 June, not only on instantaneous conditions.
Case B exhibited fundamentally different delta patterns, characterised by relatively symmetric before/after comparisons across most variables. Here, the ecosystem experienced a clear midday depression at noon, while morning and afternoon correlations remained strong. The delta patterns are more symmetric. Morning GPP deltas (µmol m−2 s−1) were 1.43 ± 0.07 before and 2.21 ± 0.11 after stress, a 1.5-fold ratio. Morning SIF deltas (mW sr−1 m−2 nm−1) were 0.45 ± 0.01 before and 0.54 ± 0.02 after stress, close in magnitude. PRI deltas were also similar, 0.014 ± 0.0003 before and 0.016 ± 0.0004 after stress. These balanced responses indicate proportional reactions and recovery.
At noon in Case B, GPP (µmol m−2 s−1) increased from 0.29 ± 0.04 before stress to 1.46 ± 0.11 after stress. SIF (mW sr−1 m−2 nm−1) rose from 0.20 ± 0.02 to 0.42 ± 0.02. PRI increased from 0.0062 ± 0.0003 to 0.0156 ± 0.0006. These large noon deltas reflect the strong midday depression on 29–30 June and the subsequent rebound, not a persistent legacy. Afternoon deltas remained small and comparable, confirming stable recovery.
Comparing both cases, the key diagnostic feature is the asymmetry between before and after stress deltas in the morning. In Case A, morning GPP and SIF ratios reached 6.8× and 79×, respectively. In Case B, they remained close to 1. This contrast identifies legacy stress on 26 June as the driver of prolonged morning disruption. In Case B, 29–30 June expressed only midday depression, and the delta structure follows that pattern. This indicates that legacy stress may manifest as disproportionately larger morning deviations under similar environmental conditions, accompanied by elevated PRI indicating sustained NPQ. Acute stress manifests as midday depression with symmetric recovery. Integrating stress history into photosynthesis modelling becomes necessary when such asymmetries appear, especially for predicting morning carbon uptake after multi-day heat exposure.

4. Discussion

This study presents a novel, high-temporal-resolution analysis of SIF O2-A, investigating the complex relationship between SIF and GPP, as well as the impact of environmental factors within a heterogeneous peatland ecosystem. Our results highlight how environmental stressors, such as high light intensity and heat stress, combined with midday depression and stress legacy, significantly influence the relationships between SIF O2-A and GPP, which is fundamental to understanding peatland carbon cycling and the potential implications for global climate change [57].

4.1. Meteorological and Hydrological Effects on Peatland Photosynthesis

The studied location in the Rzecin peatland is dominated by Sphagnum spp. and vascular plants, such as Oxycoccus palustris L., Carex limosa, C. rostrata, and C. lasiocarpa [27]. PAR, Tair, VPD, and WTD influence photosynthetic activity; hence, their interaction shapes GPP and SIF O2-A. During the study period, PAR at midday averaged from 1600 to 1700 µmol m−2 s−1, reaching saturation levels for Sphagnum photosynthesis [58]. However, prolonged drought (16 days without precipitation) and elevated Tair (up to 28.6 °C) and VPD (>15 hPa) imposed water stress, reducing photosynthetic capacity, particularly in species like Sphagnum spp. [44]. Additionally, summer Tair accounted for 61% of the variability in NEP between 2005 and 2011, with higher Tair levels leading to a decrease in NEP [8]. Simultaneously, WTD declined below −17 cm, a threshold known to constrain GPP in northern peatlands [59].
Our findings align with studies on climate-peatland interactions, which reported around 30% GPP reduction during the droughts due to low WTD and high evapotranspiration [60,61]. Similarly, [62] observed that drought had a lasting impact on peatland photosynthesis. A comparable pattern was observed in Case A (27 June), where elevated VPD and low WTD during the past three days—exceeding the optimal thresholds—contributed to a reduction in GPP, despite increasing levels of PAR. This delayed physiological response, consistent with findings in Arctic peatlands [63], underscores the complex interactions of environmental stressors.
The decoupling of SIF O2-A and GPP, particularly under high PAR (>1600 µmol m−2 s−1), suggests photoprotective mechanisms such as photorespiration and non-photochemical quenching (NPQ) [64,65,66], which was further reflected in PRI, which exhibited a U-shaped pattern, mirroring midday depression effects [34]. However, GPP displayed a less pronounced U-shape compared to SIF O2-A, with scattered values particularly evident on the day after stress in case A (Figure 3). This suggests that while SIF O2-A responds rapidly to instantaneous changes in light conditions (such as cloud cover or PAR fluctuations), GPP recovery follows a more gradual, integrated response that is less affected by momentary environmental variations.
Hydrological conditions played a pivotal role in modulating these responses. High WTD (−20 to −60 cm), as observed in the study by [67], intensified drought stress by restricting the capillary water supply to moss-dominated communities [4]. In addition, atmospheric drought intensified evaporative demand [17], creating a dual-stressor environment that reduced water availability for Sphagnum spp. Notably, while vascular plants can regulate water loss via stomatal closure, Sphagnum spp. lack of stomata [68] makes them vulnerable to non-stomatal limitations, which are directly linked to their tissue water content. This includes potential damage to the photosynthetic apparatus upon desiccation and reduced CO2 uptake due to surface drying [69].
Therefore, we highlight and emphasise the necessity of considering both short-term meteorological extremes, such as heatwaves, and seasonal hydrological trends, when modelling peatland carbon fluxes. It is important to note, however, that our attribution of the observed decoupling to this canopy heterogeneity remains a conceptual hypothesis. In this study, we measured bulk canopy SIF and GPP without partitioning the species-specific fluorescence yields or conducting direct leaf area index (LAI) measurements of the understory (Sphagnum) versus the overstory (vascular plants). Therefore, future campaigns incorporating species-level fluorescence measurements and structural canopy modelling are necessary to empirically partition these contributions.

4.2. Diurnal Variability and Midday Depression in SIF and GPP

The diurnal patterns of SIF O2-A and GPP exhibited contrasting responses to midday stress (Figure 3). Under non-stress conditions (e.g., 28 June, Case B before stress), both SIF and GPP increased with morning PAR and declined gradually in the afternoon, showing coupled diurnal trajectories. However, during combined heat and drought stress (27 June, Case A; 29–30 June, Case B), SIF and PRI exhibited pronounced U-shaped midday depression, declining sharply from late morning peaks despite continued high PAR (>1600 μmol m−2 s−1), while GPP showed comparatively muted midday suppression and continued to track PAR availability. This differential response (strong SIF depression, weak GPP depression) causes the midday SIF-GPP decoupling (R2 0.01–0.04) observed in Figure 4 and Table S1. This partially supports our hypothesis of diurnal inconsistency between SIF O2-A and GPP, revealing a deviation or variability under stress.
Midday depression of photosynthesis is well-documented across ecosystems [38,39,40] and is typically attributed to stomatal closure under high VPD, photoinhibition from excess PAR, or NPQ to dissipate energy as heat [33,34]. In the studied peatland, during legacy stress (Case A), SIF O2-A at midday decreased by 0.30 mW sr−1 m−2 nm−1 while GPP remained stable. This divergence suggests that carbon assimilation was sustained (possibly by vascular plants with deeper root systems) even as light-use efficiency declined. The concurrent PRI decline suggests activation of photoprotective mechanisms, particularly the xanthophyll cycle, to dissipate excess energy under stress [70].
Sphagnum mosses, which lack stomata and depend on external water films for CO2 diffusion, are highly sensitive to surface drying under high irradiance. This sensitivity often leads to a stronger midday depression of photosynthesis compared to co-occurring vascular plants, as documented by [43]. Such moisture-driven reductions in photosynthetic activity could plausibly contribute to a pronounced midday decline in SIF in Sphagnum-dominated areas, especially when high light coincides with lowered water availability.
The mixed canopy, comprising both mosses and vascular plants, may thus exhibit a combined response, with GPP sustained by vascular plants while SIF O2-A remains more sensitive to Sphagnum stress. The high temporal resolution of our data (30 s intervals) further captured transient alleviations, such as cloud cover reducing PAR and mitigating depression [71].
PRI declines under midday stress in various ecosystems [72], reflecting activation of the xanthophyll cycle. PRI-NPQ relationships are typically robust under normal conditions [19], although photoinhibition can disrupt this linkage. In the studied peatland, the combination of high PAR, low WTD (below –17 cm), and water stress likely amplified photoinhibition, further explaining the decline in PRI. This aligns with other ecosystems, where soil moisture buffers such effects [73], highlighting the vulnerability of peatlands to diurnal extremes that impact carbon modelling.
Our observation of midday SIF depression during high PAR and heat stress aligns with recent studies across diverse biomes. [35] demonstrated widespread midday depression in dryland photosynthesis using geostationary SIF observations during extreme heatwaves, while [40] reported severe midday photosynthetic depression in coastal mangroves under combined heat and drought. In wetland ecosystems, [74] showed that severe photoinhibition during climate anomalies eliminated the carbon sink capacity of Amazonian peatlands, underscoring the high vulnerability of wetland vegetation to diurnal thermal extremes.

4.3. Decoupling of SIF-GPP Under Stress Scenarios

Our analysis reveals two distinct decoupling patterns. Midday decoupling responds to concurrent environmental stress at the time of measurement. Morning decoupling responds to antecedent thermal history from preceding days. Both disrupt the SIF-GPP relationship but through fundamentally different processes.

4.3.1. Midday Decoupling from Concurrent Stress

A key finding is the pronounced diurnal decoupling of SIF and GPP during midday stress. In Case A, SIF O2-A at solar noon declined by ~30% from morning values, while GPP remained relatively stable or continued to increase with PAR, reducing the SIF-GPP correlation from R2 = 0.79 (before noon) to R2 ≈ 0.04 (noon). This divergence suggests that photoprotective mechanisms (e.g., non-photochemical quenching) suppress fluorescence yield more effectively than they suppress carbon fixation—possibly because vascular plants with deeper root systems maintain gas exchange despite stress on surface-dwelling Sphagnum mosses. This finding has important implications for interpreting satellite-based SIF observations: high-resolution temporal sampling is essential to capture stress-induced decoupling, and daily-averaged SIF-GPP correlations may mask substantial midday biases.
During Stress Day, the R2 under optimal conditions, SIF O2-A and GPP are tightly coupled, as both originate from chlorophyll after light absorption. However, stress triggers photoprotective mechanisms, notably NPQ, which dissipates excess energy as heat, reducing fluorescence yield more than photosynthetic rate [75]. In this study, the midday peak in PAR (>1600 μmol m−2 s−1), combined with high Tair (28.6 °C) and VPD (26 hPa), likely maximised NPQ, suppressing SIF O2-A while GPP persisted, possibly due to vascular plants accessing residual water. The concurrent decline in PRI supports this reasoning, indicating activation of the xanthophyll cycle [76].
This decoupling aligns with observations in other systems. Wieneke et al. (2016) reported a weak SIF-GPP relationship in water-stressed crops, attributed to the dominance of NPQ under high light [77]. Similarly, [78] found SIF more sensitive to heat stress than GPP in forests, suggesting that fluorescence increasingly reflects non-regulated energy loss rather than regulated NPQ or carbon uptake under stress. In peatlands, Sphagnum’s limited regulatory capacity may exacerbate this trend, as the drying of its photosynthetic tissue reduces top-of-canopy SIF without a proportional effect on the canopy’s GPP, which is driven mainly by vascular plants with deeper roots [45]. This structural difference may amplify decoupling, as noted in many studies that have shown how canopy architecture influences SIF escape probability [33,34,79,80,81]. Moreover, the decoupling aligns with a study by [30], which demonstrates that SIF does not always scale linearly with GPP under extreme environmental conditions due to increased NPQ. The observed weakening and decoupling may be attributed to stomatal closure under high VPD >15 and Tair (>25 °C), which reduces or stabilises CO2 uptake (GPP) [8,54], while SIF remains elevated due to light-driven chlorophyll fluorescence (Figure 3, Case A). However, we lack direct measurements of stomatal conductance.
The mechanisms of midday decoupling are probably controlled by non-stomatal limitations, which dominate the midday decline, underscoring a fundamental disconnect between light phase (SIF) and carbon fixation (GPP) [82]. This decoupling aligns with recent studies attributing midday depression to Rubisco deactivation and electron transport chain inefficiencies [33,37]. Photoprotective mechanisms, such as the xanthophyll cycle, dominate stress responses. Delta analysis confirms this pattern: at noon during stress, PRI deltas were N.B-N.S = 0.0025 and N.A-N.S = 0.0019 (Figure 5), indicating comparable xanthophyll de-epoxidation across all days when peak stress occurred. Morning PRI showed larger asymmetry (M.B-M.S = 0.004, M.A-M.S = 0.0095) [52], as discussed in Section 4.3.2.

4.3.2. Morning Decoupling from Legacy Stress

Morning SIF-GPP decoupling on 26 June (R2 = 0.07) occurred under favourable conditions (PAR 700–1000 μmol m−2 s−1, temperature 19–22 °C, VPD 9–12 hPa) when no concurrent stress existed. This contrasts with strong morning coupling on 27 June (R2 = 0.79), the peak stress day. This pattern is consistent with incomplete overnight recovery following multi-day heat exposure (23–25 June). Three processes, drawn from the literature on photoinhibition and heat stress, could plausibly explain the delayed recovery and limit overnight photosynthetic apparatus repair. First, sustained high light exposure (PAR > 1600 μmol m−2 s−1) combined with heat stress can cause photoinhibitory damage to PSII reaction centres faster than D1 protein repair mechanisms can restore function [83,84]. Second, heat stress can cause thermal deactivation of Rubisco and its activase, requiring hours to reverse [85,86], which would decouple fluorescence emission from carbon fixation on morning timescales. Third, incomplete overnight zeaxanthin de-epoxidation [87] could maintain residual morning NPQ, suppressing fluorescence while carbon fixation proceeds through alternative electron pathways [88].
The delta analysis quantifies a 79-fold asymmetry in Case A morning SIF versus a 1.2-fold asymmetry in Case B, while morning GPP showed a 6.8-fold versus a 1.5-fold asymmetry. This disproportionate fluorescence suppression demonstrates that light reaction recovery lags behind biochemical recovery by more than an order of magnitude following cumulative stress exposure. Peatlands amplify legacy effects through differential recovery rates between plant functional types. Sphagnum mosses lack stomata and protective cuticles, making them highly vulnerable to desiccation [45]. During the 16-day drought preceding our stress events, surface Sphagnum likely experienced severe water stress, while vascular plants accessed deeper water at a −17 cm depth. Published work reports that Sphagnum photosynthetic recovery requires 24–72 h after stress [89], while vascular plants recover overnight; our canopy-scale data are consistent with this pathway but cannot confirm it at the species level. We note explicitly that no species-resolved fluorescence, leaf-level gas exchange, or canopy-contribution measurements were made in this study, so the differential recovery pathway attributed here to Sphagnum versus vascular plants is an inference consistent with the literature (e.g., [43,44,45,87]) rather than an observation from our data.
The absence of morning disruption in Case B (R2 = 0.93 on 28 June) validates this mechanism. Therefore, Case A confirms that legacy effects require multi-day thermal exposure rather than single acute events. This has implications for satellite monitoring: TROPOMI and OCO-2 overpass mid-morning (10:00–11:30 local time), when legacy effects are most apparent. Weakened morning SIF-GPP correlations could serve as early warning indicators of cumulative stress 1–2 days before afternoon physiological collapse becomes measurable, which is particularly valuable during multi-day heatwaves when peatland carbon sink capacity declines rapidly [4].

4.4. Reliability of SIF as a GPP Proxy

Our findings confirm that SIF is generally a reliable proxy for GPP in peatlands, with strong daily correlations (R2 = 0.86–0.96) under non-stress conditions, supporting its utility in monitoring photosynthesis [28]. However, this relationship weakens diurnally and under stress, revealing essential limitations that must be addressed for accurate application. Several factors contribute to this variability. The peatland canopy, characterised by a dense moss layer and low stature, influences light penetration and fluorescence escape, potentially dampening SIF relative to GPP [79]. Additionally, the lower chlorophyll content of Sphagnum compared to vascular plants may reduce SIF signals; however, the strong overall correlation on a whole-day scale suggests that this effect is minor. More critically, environmental stressors such as high PAR and water stress decouple SIF from GPP, as in case A (Figure 4), particularly at midday.
SIF can overestimate GPP under low-light conditions, when fluorescence persists despite limited carbon assimilation, and underestimates it during stress, when NPQ suppresses SIF disproportionately [64]. This pattern aligns with findings by [90], who reported SIF-GPP mismatches in forests under variable light and temperature. Peatlands are especially vulnerable to drought and heat stress, which can rapidly transform these important carbon sinks into sources. While approaches such as incorporating SIF yield (SIF/PAR) or PRI to account for light and stress effects have been proposed [70], understanding how these methods perform specifically in peatland ecosystems—with their unique moss–vascular plant composition and hydrology-dependent photosynthesis—remains crucial for accurate carbon flux monitoring [74].
Despite limitations, SIF offers non-invasive, real-time monitoring of photosynthetic activity, which is a significant advantage for remote sensing applications. However, interpretation in peatlands requires accounting for stress-induced decoupling and canopy architecture effects. Our findings partially support Hypothesis 3: SIF is reliable under non-stress conditions (R2 = 0.86 to 0.96, daily scale) but exhibits substantial variability under stress (R2 approaching zero at midday). These results suggest that SIF-based GPP models should incorporate stress indicators (e.g., VPD and temperature) and employ time-of-day adjustments.
The absolute delta (Δ) analysis further highlights this variability, with GPP, SIF, and PRI exhibiting the highest Δ values in morning comparisons, likely reflecting the legacy effects of stress (Figure 5, Case A). Similar trends have been reported in northern peatland ecosystems, where drought and waterlogging stress alter SIF-based signals independently of gross primary production, with fluorescence responses driven by water table dynamics rather than carbon assimilation alone [26]. Notably, the relative stability of SIF O2-A under stress (ΔSIF O2-A < 0.5 mW sr−1 m−2 nm−1) contrasts with the sharp decline in GPP (ΔGPP = 4.5 µmol m−2 s−1), reinforcing the need for caution when using SIF as a direct GPP proxy in peatlands. The insensitivity of SIF O2-A to biochemical constraints under stress highlights a key limitation in its standalone use for assessing GPP in these ecosystems.

4.5. Implications for Satellite-Based SIF Monitoring

Our ground-based SIF and GPP measurements provide important insights for improving satellite-based monitoring of peatland carbon dynamics. Crucially, translating these sub-daily relationships to spaceborne platforms involves confronting significant scale mismatches. Tower-based measurements capture a relatively homogeneous footprint, whereas satellite pixels aggregate immense spatial and structural vegetation heterogeneity. Furthermore, satellite observations are constrained by atmospheric scattering and absorption, which complicate the retrieval of the weak SIF signal [91]. Most importantly, the reliance of current satellites on single overpass times (e.g., mid-morning for TROPOMI) inherently misses the rapid diurnal decoupling—such as midday depression and morning legacy effects—observed in our 30 s data. Therefore, while satellite SIF is a powerful tool for tracking seasonal GPP, detecting sub-daily physiological stress from space will require sophisticated integration with diurnal canopy models and multi-platform remote sensing. Although satellite missions such as OCO-2, TROPOMI, and the forthcoming FLEX enable regional to global observations of SIF [42,92,93], retrieving reliable estimates over peatlands remains challenging because of their coarse spatial resolution, heterogeneous vegetation, and high surface moisture, which can introduce specular reflection and contaminate fluorescence retrievals [26,94]. Our results further demonstrate that diurnal physiological dynamics, including midday SIF depression and legacy stress effects, can weaken instantaneous SIF–GPP coupling. Consequently, satellite overpasses coinciding with these periods may underestimate ecosystem photosynthetic activity despite the generally strong daily relationship between SIF and GPP. This agrees with previous studies showing that SIF primarily tracks absorbed photosynthetically active radiation (APAR) and photosynthetic capacity at daily or longer temporal scales, whereas stress-induced regulation can decouple fluorescence from carbon assimilation at shorter timescales [94,95].
While canopy-level measurements provide a valuable mechanistic understanding of plant physiological responses, extrapolating these observations to ecosystem and satellite scales remains challenging. The light-response curves developed in this study represent the optical and physiological behaviour within the FloX field of view and do not explicitly account for canopy structural effects such as mutual shading, leaf angle distribution, vertical gradients in irradiance, or variable contributions from sunlit and shaded foliage, all of which influence the integrated canopy fluorescence signal. Moreover, point measurements may not fully capture the spatial variability of peatland vegetation, where different plant functional types and canopy layers experience contrasting microclimatic conditions and stress levels. These scale-dependent effects become increasingly important when satellite observations integrate signals over footprints ranging from hundreds of metres (FLEX) to several square kilometres (OCO-2 and TROPOMI), encompassing heterogeneous mosaics of hummocks, hollows, open water, shrubs, sedges, Sphagnum communities, and adjacent upland vegetation. Consequently, the sub-daily decoupling observed at the canopy scale may be weakened or obscured after spatial aggregation, and satellite-derived SIF should not be interpreted as a direct proxy for instantaneous GPP without considering these scaling effects.
Our high-frequency (30 s) ground observations therefore provide valuable calibration and validation data for improving satellite-based SIF retrievals and photosynthesis models. Incorporating complementary stress indicators, such as the photochemical reflectance index (PRI) [76], together with meteorological variables and water-table information, could improve the detection of stress-induced reductions in photosynthesis that are not captured by SIF alone. These observations are particularly relevant for the upcoming ESA FLEX mission, whose global SIF products will benefit from robust ground validation datasets collected under contrasting environmental conditions [42]. However, the reduced SIF–GPP coupling observed during periods of thermal and hydrological stress indicates that single-overpass satellite observations should be complemented, where possible, with sub-daily measurements or modelling approaches that account for time-of-day effects, environmental stress, and sub-pixel heterogeneity. Because peatland vegetation exhibits species-specific physiological responses—for example, the rapid environmental sensitivity of Sphagnum spp. compared with the more crop-like behaviour of sedge-dominated communities—future satellite applications should incorporate peatland-specific, stress-adjusted SIF–GPP models rather than relying on universal relationships developed for more homogeneous ecosystems.

4.6. Potential Improvement of the Study

Our study has identified the coupling and decoupling of SIF and GPP during climate extremes, but there are several limitations that should be considered when interpreting the results. First, we acknowledge that our temporal coverage is limited to a short, intense heatwave period during a single summer. Therefore, our findings regarding legacy effects and the precise mechanisms of SIF-GPP decoupling should be interpreted as a mechanistic case study rather than a generalised rule for all peatland ecosystems. Peatland responses to extreme climate events are highly context-dependent, and generalising these mechanisms requires extrapolation across diverse hydrological conditions and seasonal cycles. Second, all measurements (SIF, GPP, PRI) were taken at the canopy scale. We did not measure leaf-level stomatal conductance, chlorophyll fluorescence parameters (including NPQ and PSII efficiency), or leaf water potential. Mechanistic statements in the Discussion about NPQ engagement, stomatal closure, photoinhibition, and Rubisco deactivation are therefore inferred from PRI, VPD and the published literature, not observed directly. Third, water table depth was measured by pressure-transducer divers but only at sub-daily resolution, which precluded its inclusion as a covariate in the correlation and GPP modelling. Fourth, the canopy-scale SIF signal integrates over both Sphagnum and vascular plant communities; the relative contribution of each functional type to the observed decoupling cannot be separated with a single tower footprint, and the SIF signal was not decomposed into fluorescence yield and escape probability components. Fifth, the GPP interpolation used a modified Michaelis–Menten model with a fixed Topt of 24.5 °C; this may not capture VPD-driven stomatal closure independently of temperature, nor photoinhibition through a separate light-stress penalty. Sixth, the research was conducted at one peatland site (Rzecin), so the results may not be representative of other peatland types, such as bogs, or of sites in different climatic regions. Seventh, the study covered only part of the growing season, though it did include the peak of the season. Eighth, the results are based on two stress events at a single site in a single year and may not generalise to other events, years, or peatland types without further validation. Ninth, the UAV multispectral imagery used to validate footprint similarity was collected in 2022–2024, not in 2019, introducing a temporal mismatch with the study period, although the 3 seasons had stress windows, like heatwaves in 2024, as in Supplementary Figure S2.
Instrumental uncertainties also affect our findings. SIF retrievals may be influenced by atmospheric scattering or sensor drift despite rigorous calibration. GPP estimates were derived from chamber measurements, and the temporal gaps between campaigns were gap-filled by modelling. The automatic continuous measurements would have given higher accuracy; however, eddy covariance data carry uncertainties related to partitioning NEE to GPP and Reco [96].

5. Conclusions

This study provides continuous, high-temporal-resolution analysis of ~30 s of SIF in a peatland ecosystem, aiming to explore the relationship between GPP and SIF at the canopy level under legacy heat stress and midday depression scenarios, determine their behaviour when plant stress is present, and show that SIF could be an unreliable indicator of GPP in peatlands during stress. Within the limits of a two-event case study at a single peatland site during one growing season, we found that SIF-GPP correlations are highly dynamic, varying not only between stress and non-stress periods but also across diurnal timescales. Both stress scenarios (Case A: legacy stress; Case B: acute multi-day stress) produced similar diurnal patterns, characterised by weakened morning correlations and near-zero midday correlations, suggesting that cumulative and acute stress trigger similar photoprotective responses. The pronounced midday decoupling reflects the complex regulation of plant photophysiology under stress: even as plants absorb high light intensity (evident from PAR), activated photoprotective mechanisms (particularly non-photochemical quenching and canopy-level architectural changes, shown using PRI as a proxy) suppress fluorescence yield more strongly than carbon fixation. These mechanisms enable partial photosynthetic carbon uptake to persist even under severe stress conditions; however, this resilience is not reflected in SIF signals—a critical consideration for remote sensing-based carbon flux monitoring.
Therefore, it is necessary to refine approaches in carbon flux modelling and remote sensing, as SIF alone is insufficient for GPP estimation under stress. While weakened morning SIF-GPP correlations present a preliminary hypothesis for a potential early warning indicator of cumulative stress, this concept requires rigorous validation across multiple peatland sites and multi-year datasets before it can be applied operationally. Integrating microclimate data offers a necessary path forward for remote sensing missions such as FLEX.
Future research should investigate long-term trends in SIF under various climatic conditions to further enhance predictive models and remote sensing capabilities. It should also include multiple peatland sites to verify if the mechanistic decoupling patterns we observed persist across different environmental conditions and vegetation types. Increasing the temporal resolution of SIF measurements with sub-minute sensors will continue to capture rapid midday fluctuations and offer better insights into the effects of stress on photosynthesis. Additionally, combining hydrological and species-specific physiological measurements is essential to deepen our understanding of carbon flux dynamics in heterogeneous peatlands, where water availability and canopy architecture play key roles.

Supplementary Materials

The following supporting information can be downloaded at: https://www.mdpi.com/article/10.3390/rs18162826/s1, Figure S1: Multi-temporal UAV spectral signature regression between FloX tower footprint and chamber measurement sites across three years (2022–2024, n = 12 flights); Figure S2: Detected heatwave during the 2024 campaigns based on 90th percentile out of historical air temperature data in Rzecin peatland Poland; Figure S3: Gross Primary Production (GPP) light-response curve for the CRC2 plot across the 2019 growing season; Figure S4: Continuous temporal dynamics of Light Use Efficiency (LUE) and SIF yield across the study period (26 June–2 July 2019); Table S1: SIF-GPP Correlation Statistics by Time Period and Stress Phase; Table S2: Absolute differences (|Δ|) between stress and non-stress periods for GPP, SIF O2-A, PRI, PAR, Tair, and VPD across morning, noon, and after noon periods for Case A and Case B.

Author Contributions

A.Y.A.A.: Conceptualisation, Methodology, Software, Validation, Formal Analysis, Investigation, Data Curation, Writing—Original Draft, Writing—Review and Editing, Visualisation. M.C.-M.: Conceptualisation, Methodology, Visualisation, Writing—Review and Editing. S.V.W.: Methodology, Writing—Review and Editing. M.A.: Investigation, Data Curation, Methodology, Writing—Review and Editing. M.A.-S.: Methodology (chamber measurements), Visualisation, Writing—Review and Editing. M.S.: Methodology (chamber measurements), Writing—Review and Editing. A.R.: Resources, Writing—Review and Editing. T.J.: Methodology (FloX Instrument), Software (FloX Instrument), Resources, Investigation, Writing—Review and Editing. A.B.: Methodology (FloX Instrument), Software (FloX Instrument), Resources, Investigation, Writing—Review and Editing. D.S.: Methodology (FloX Instrument), Software (FloX Instrument), Resources, Investigation, Writing—Review and Editing. S.W.: Visualisation, Writing—Review and Editing. R.J.: Conceptualisation, Methodology, Data curation, Resources, Supervision, Funding acquisition, Project administration, Writing—Review and Editing. All authors have read and agreed to the published version of the manuscript.

Funding

This research was funded by the National Science Centre of Poland, grant number 2020/39/O/ST10/00775. The funder was not involved in the study design, the collection, analysis, or interpretation of data, the writing of this article, or the decision to submit it for publication.

Data Availability Statement

All data supporting the findings of this study are accessible from the corresponding author upon reasonable request.

Acknowledgments

The SIF data were acquired using the FLoX system (JB Hyperspectral, Germany), which was borrowed from the European Space Agency (ESA) under the grant number 4000119961/16/NL/FF/mg (Technical assistance for POlish radar and LIdar Mobile Observation System—POLIMOS). M. Pilar Cendrero-Mateo is supported by the Generalitat Valenciana grant for the scientific excellence of junior researchers (CISEJI/2023/48) and the Spanish Ministry of Science, Innovation and Universities through a Ramón y Cajal contract (RYC2024-050518-I). We thank the National Science Centre of Poland (NCN) for funding this research.

Conflicts of Interest

Authors Tommaso Julitta and Andreas Burkart were employed by the company JB Hyperspectral Devices. The remaining authors declare that the research was conducted in the absence of any commercial or financial relationships that could be construed as potential conflicts of interest.

References

  1. Page, S.E.; Rieley, J.O.; Banks, C.J. Global and Regional Importance of the Tropical Peatland Carbon Pool. Glob. Change Biol. 2011, 17, 798–818. [Google Scholar] [CrossRef] [Scilit]
  2. Gorham, E. Northern Peatlands: Role in the Carbon Cycle and Probable Responses to Climatic Warming. Ecol. Appl. 1991, 1, 182–195. [Google Scholar] [CrossRef] [Scilit] [PubMed]
  3. de Jong, R.; Blaauw, M.; Chambers, F.M.; Christensen, T.R.; de Vleeschouwer, F.; Finsinger, W.; Fronzek, S.; Johansson, M.; Kokfelt, U.; Lamentowicz, M.; et al. Climate and Peatlands. In Changing Climates, Earth Systems and Society; Springer: Dordrecht, The Netherlands, 2010; pp. 85–121. [Google Scholar]
  4. Loisel, J.; Gallego-Sala, A. Ecological Resilience of Restored Peatlands to Climate Change. Commun. Earth Environ. 2022, 3, 208. [Google Scholar] [CrossRef] [Scilit]
  5. Antala, M.; Juszczak, R.; van der Tol, C.; Rastogi, A. Impact of Climate Change-Induced Alterations in Peatland Vegetation Phenology and Composition on Carbon Balance. Sci. Total Environ. 2022, 827, 4. [Google Scholar] [CrossRef] [Scilit] [PubMed]
  6. Harenda, K.M.; Markowicz, K.M.; Poczta, P.; Stachlewska, I.S.; Bojanowski, J.S.; Czernecki, B.; McArthur, A.; Schütemeyer, D.; Chojnicki, B.H. Estimation of the Effects of Aerosol Optical Properties on Peatland Production in Rzecin, Poland. Agric. For. Meteorol. 2022, 316, 108861. [Google Scholar] [CrossRef] [Scilit]
  7. Acosta, M.; Juszczak, R.; Chojnicki, B.; Pavelka, M.; Havránková, K.; Lesny, J.; Krupková, L.; Urbaniak, M.; Machačová, K.; Olejnik, J. CO2 Fluxes from Different Vegetation Communities on a Peatland Ecosystem. Wetlands 2017, 37, 423–435. [Google Scholar] [CrossRef] [Scilit]
  8. Poczta, P.; Urbaniak, M.; Sachs, T.; Harenda, K.M.; Klarzyńska, A.; Juszczak, R.; Schüttemeyer, D.; Czernecki, B.; Kryszak, A.; Chojnicki, B.H. A Multi-Year Study of Ecosystem Production and Its Relation to Biophysical Factors over a Temperate Peatland. Agric. For. Meteorol. 2023, 338, 109529. [Google Scholar] [CrossRef] [Scilit]
  9. Fortuniak, K.; Pawlak, W.; Bednorz, L.; Grygoruk, M.; Siedlecki, M.; Zieliński, M. Methane and Carbon Dioxide Fluxes of a Temperate Mire in Central Europe. Agric. For. Meteorol. 2017, 232, 306–318. [Google Scholar] [CrossRef] [Scilit]
  10. Rastogi, A.; Stróżecki, M.; Kalaji, H.M.; Łuców, D.; Lamentowicz, M.; Juszczak, R. Impact of Warming and Reduced Precipitation on Photosynthetic and Remote Sensing Properties of Peatland Vegetation. Environ. Exp. Bot. 2019, 160, 71–80. [Google Scholar] [CrossRef] [Scilit]
  11. Strachan, I.B.; Pelletier, L.; Bonneville, M.C. Inter-Annual Variability in Water Table Depth Controls Net Ecosystem Carbon Dioxide Exchange in a Boreal Bog. Biogeochemistry 2016, 127, 99–111. [Google Scholar] [CrossRef] [Scilit]
  12. Aslan-Sungur, G.; Lee, X.; Evrendilek, F.; Karakaya, N. Large Interannual Variability in Net Ecosystem Carbon Dioxide Exchange of a Disturbed Temperate Peatland. Sci. Total Environ. 2016, 554–555, 192–202. [Google Scholar] [CrossRef] [Scilit] [PubMed]
  13. Peichl, M.; Öquist, M.; Ottosson Löfvenius, M.; Ilstedt, U.; Sagerfors, J.; Grelle, A.; Lindroth, A.; Nilsson, M.B. A 12-Year Record Reveals Pre-Growing Season Temperature and Water Table Level Threshold Effects on the Net Carbon Dioxide Exchange in a Boreal Fen. Environ. Res. Lett. 2014, 9, 055006. [Google Scholar] [CrossRef] [Scilit]
  14. Juszczak, R.; Humphreys, E.; Acosta, M.; Michalak-Galczewska, M.; Kayzer, D.; Olejnik, J. Ecosystem Respiration in a Heterogeneous Temperate Peatland and Its Sensitivity to Peat Temperature and Water Table Depth. Plant Soil 2013, 366, 505–520. [Google Scholar] [CrossRef] [Scilit]
  15. Oren, R.; Sperry, J.S.; Katul, G.G.; Pataki, D.E.; Ewers, B.E.; Phillips, N.; Schäfer, K.V.R. Survey and Synthesis of Intra- and Interspecific Variation in Stomatal Sensitivity to Vapour Pressure Deficit. Plant Cell Environ. 1999, 22, 1515–1526. [Google Scholar] [CrossRef] [Scilit]
  16. Massmann, A.; Gentine, P.; Lin, C. When Does Vapor Pressure Deficit Drive or Reduce Evapotranspiration? J. Adv. Model. Earth Syst. 2019, 11, 3305–3320. [Google Scholar] [CrossRef] [Scilit] [PubMed]
  17. Tian, J.; Branfireun, B.A.; Lindo, Z. Global Change Alters Peatland Carbon Cycling through Plant Biomass Allocation. Plant Soil 2020, 455, 53–64. [Google Scholar] [CrossRef] [Scilit]
  18. Harenda, K.M.; Lamentowicz, M.; Samson, M.; Chojnicki, B.H. The Role of Peatlands and Their Carbon Storage Function in the Context of Climate Change. In Interdisciplinary Approaches for Sustainable Development Goals; Zielinski, T., Sagan, I., Surosz, W., Eds.; GeoPlanet: Earth and Planetary Sciences; Springer: Cham, Switzerland, 2018. [Google Scholar] [CrossRef] [Scilit]
  19. Alonso, L.; Van Wittenberghe, S.; Amorós-López, J.; Vila-Francés, J.; Gómez-Chova, L.; Moreno, J. Diurnal Cycle Relationships between Passive Fluorescence, PRI and NPQ of Vegetation in a Controlled Stress Experiment. Remote Sens. 2017, 9, 770. [Google Scholar] [CrossRef] [Scilit]
  20. Bandopadhyay, S.; Rastogi, A.; Cogliati, S.; Rascher, U.; Gąbka, M.; Juszczak, R. Can Vegetation Indices Serve as Proxies for Potential Sun-Induced Fluorescence (SIF)? A Fuzzy Simulation Approach on Airborne Imaging Spectroscopy Data. Remote Sens. 2021, 13, 2545. [Google Scholar] [CrossRef] [Scilit]
  21. Mohammed, G.H.; Colombo, R.; Middleton, E.M.; Rascher, U.; van der Tol, C.; Nedbal, L.; Goulas, Y.; Pérez-Priego, O.; Damm, A.; Meroni, M.; et al. Remote Sensing of Solar-Induced Chlorophyll Fluorescence (SIF) in Vegetation: 50 years of Progress. Remote Sens. Environ. 2019, 231, 111177. [Google Scholar] [CrossRef] [Scilit] [PubMed]
  22. Bandopadhyay, S.; Rastogi, A.; Juszczak, R. Review of Top-of-Canopy Sun-Induced Fluorescence (Sif) Studies from Ground, Uav, Airborne to Spaceborne Observations. Sensors 2020, 20, 1144. [Google Scholar] [CrossRef] [Scilit] [PubMed]
  23. Zhang, Y.; Xiao, X.; Jin, C.; Dong, J.; Zhou, S.; Wagle, P.; Joiner, J.; Guanter, L.; Zhang, Y.; Zhang, G.; et al. Consistency between Sun-Induced Chlorophyll Fluorescence and Gross Primary Production of Vegetation in North America. Remote Sens. Environ. 2016, 183, 154–169. [Google Scholar] [CrossRef] [Scilit]
  24. Yang, P.; van der Tol, C. Linking Canopy Scattering of Far-Red Sun-Induced Chlorophyll Fluorescence with Reflectance. Remote Sens. Environ. 2018, 209, 456–467. [Google Scholar] [CrossRef] [Scilit]
  25. Zhang, Y.; Xiao, X.; Zhang, Y.; Wolf, S.; Zhou, S.; Joiner, J.; Guanter, L.; Verma, M.; Sun, Y.; Yang, X.; et al. On the Relationship between Sub-Daily Instantaneous and Daily Total Gross Primary Production: Implications for Interpreting Satellite-Based SIF Retrievals. Remote Sens. Environ. 2018, 205, 276–289. [Google Scholar] [CrossRef] [Scilit]
  26. Valkenborg, B.; De Lannoy, G.J.M.; Gruber, A.; Miralles, D.G.; Köhler, P.; Frankenberg, C.; Desai, A.R.; Humphreys, E.; Klatt, J.; Lohila, A.; et al. Drought and Waterlogging Stress Regimes in Northern Peatlands Detected Through Satellite Retrieved Solar-Induced Chlorophyll Fluorescence. Geophys. Res. Lett. 2023, 50, e2023GL105205. [Google Scholar] [CrossRef] [Scilit]
  27. Bandopadhyay, S.; Rastogi, A.; Rascher, U.; Rademske, P.; Schickling, A.; Cogliati, S.; Julitta, T.; Arthur, A.M.; Hueni, A.; Tomelleri, E.; et al. Hyplant-Derived Sun-Induced Fluorescence-A New Opportunity to Disentangle Complex Vegetation Signals from Diverse Vegetation Types. Remote Sens. 2019, 11, 1691. [Google Scholar] [CrossRef] [Scilit]
  28. Antala, M.; Rastogi, A.; Cogliati, S.; Stróżecki, M.; Colombo, R.; Juszczak, R. Sun-Induced Fluorescence Spectrum as a Tool for Assessing Peatland Vegetation Productivity in the Framework of Warming and Reduced Precipitation Experiment. Remote Sens. Environ. 2024, 301, 113921. [Google Scholar] [CrossRef] [Scilit]
  29. Qiu, R.; Li, X.; Han, G.; Xiao, J.; Ma, X.; Gong, W. Monitoring Drought Impacts on Crop Productivity of the U.S. Midwest with Solar-Induced Fluorescence: GOSIF Outperforms GOME-2 SIF and MODIS NDVI, EVI, and NIRv. Agric. For. Meteorol. 2022, 323, 109038. [Google Scholar] [CrossRef] [Scilit]
  30. Martini, D.; Sakowska, K.; Wohlfahrt, G.; Pacheco-Labrador, J.; van der Tol, C.; Porcar-Castell, A.; Magney, T.S.; Carrara, A.; Colombo, R.; El-Madany, T.S.; et al. Heatwave Breaks down the Linearity between Sun-Induced Fluorescence and Gross Primary Production. New Phytol. 2022, 233, 2415–2428. [Google Scholar] [CrossRef] [Scilit] [PubMed]
  31. Magney, T.S.; Barnes, M.L.; Yang, X. On the Covariation of Chlorophyll Fluorescence and Photosynthesis Across Scales. Geophys. Res. Lett. 2020, 47, e2020GL091098. [Google Scholar] [CrossRef] [Scilit]
  32. Moreno, J.F. Advances in the Retrieval and Interpretation of Solar-Induced Vegetation Chlorophyll Fluorescence Using Passive Remote Sensing Techniques. In Proceedings of the 2021 IEEE International Geoscience and Remote Sensing Symposium IGARSS, Brussels, Belgium, 11–16 July 2021; IEEE: Piscataway, NJ, USA, 2021; pp. 1915–1918. [Google Scholar]
  33. Qiu, R.; Han, G.; Li, X.; Xiao, J.; Liu, J.; Wang, S.; Li, S.; Gong, W. Contrasting Responses of Relationship between Solar-Induced Fluorescence and Gross Primary Production to Drought across Aridity Gradients. Remote Sens. Environ. 2024, 302, 113984. [Google Scholar] [CrossRef] [Scilit]
  34. Paul-Limoges, E.; Damm, A.; Hueni, A.; Liebisch, F.; Eugster, W.; Schaepman, M.E.; Buchmann, N. Effect of Environmental Conditions on Sun-Induced Fluorescence in a Mixed Forest and a Cropland. Remote Sens. Environ. 2018, 219, 310–323. [Google Scholar] [CrossRef] [Scilit]
  35. Li, X.; Ryu, Y.; Xiao, J.; Dechant, B.; Liu, J.; Li, B.; Jeong, S.; Gentine, P. New-Generation Geostationary Satellite Reveals Widespread Midday Depression in Dryland Photosynthesis during 2020 Western U.S. Heatwave. Sci. Adv. 2023, 9, eadi0775. [Google Scholar] [CrossRef] [Scilit] [PubMed]
  36. Peichl, M.; Gažovič, M.; Vermeij, I.; De Goede, E.; Sonnentag, O.; Limpens, J.; Nilsson, M.B. Peatland Vegetation Composition and Phenology Drive the Seasonal Trajectory of Maximum Gross Primary Production. Sci. Rep. 2018, 8, 8012. [Google Scholar] [CrossRef] [Scilit] [PubMed]
  37. Zhu, X.; Hou, Y.; Zhang, Y.; Lu, X.; Liu, Z.; Weng, Q. Potential of Sun-Induced Chlorophyll Fluorescence for Indicating Mangrove Canopy Photosynthesis. J. Geophys. Res. Biogeosci. 2021, 126, e2020JG006159. [Google Scholar] [CrossRef] [Scilit]
  38. Maai, E.; Nishimura, K.; Takisawa, R.; Nakazaki, T. Light Stress-Induced Chloroplast Movement and Midday Depression of Photosynthesis in Sorghum Leaves. Plant Prod. Sci. 2020, 23, 172–181. [Google Scholar] [CrossRef] [Scilit]
  39. Pons, T.L.; Welschen, R.A.M. Midday Depression of Net Photosynthesis in the Tropical Rainforest Tree Eperua Grandiflora: Contributions of Stomatal and Internal Conductances, Respiration and Rubisco Functioning. Tree Physiol. 2003, 23, 937–947. [Google Scholar] [CrossRef] [Scilit] [PubMed]
  40. Zhu, Z.; Zhu, X. Increasing Midday Depression of Mangrove Photosynthesis with Heat and Drought Stresses. Agric. For. Meteorol. 2025, 362, 110372. [Google Scholar] [CrossRef] [Scilit]
  41. Buman, B.; Hueni, A.; Colombo, R.; Cogliati, S.; Celesti, M.; Julitta, T.; Burkart, A.; Siegmann, B.; Rascher, U.; Drusch, M.; et al. Towards Consistent Assessments of in Situ Radiometric Measurements for the Validation of Fluorescence Satellite Missions. Remote Sens. Environ. 2022, 274, 112984. [Google Scholar] [CrossRef] [Scilit]
  42. Drusch, M.; Moreno, J.; Del Bello, U.; Franco, R.; Goulas, Y.; Huth, A.; Kraft, S.; Middleton, E.M.; Miglietta, F.; Mohammed, G.; et al. The FLuorescence EXplorer Mission Concept-ESA’s Earth Explorer 8. IEEE Trans. Geosci. Remote Sens. 2017, 55, 1273–1284. [Google Scholar] [CrossRef] [Scilit]
  43. Thompson, D.K.; Waddington, J.M. Sphagnum under Pressure: Towards an Ecohydrological Approach to Examining Sphagnum Productivity. Ecohydrology 2008, 1, 299–308. [Google Scholar] [CrossRef] [Scilit]
  44. Korrensalo, A.; Alekseychik, P.; Hájek, T.; Rinne, J.; Vesala, T.; Mehtätalo, L.; Mammarella, I.; Tuittila, E.S. Species-Specific Temporal Variation in Photosynthesis as a Moderator of Peatland Carbon Sequestration. Biogeosciences 2017, 14, 257–269. [Google Scholar] [CrossRef] [Scilit]
  45. Hájek, T.; Vicherová, E. Desiccation Tolerance of Sphagnum Revisited: A Puzzle Resolved. Plant Biol. 2014, 16, 765–773. [Google Scholar] [CrossRef] [Scilit] [PubMed]
  46. Ziccardi, L.G.; Kramer, D.; Gonçalves, N.; Nelson, B.W.; Taylor, T.; Albert, L.P.; Campos, K.S.; Prohaska, N.; Restrepo-Coupe, N.; Saleska, S.R.; et al. Seasonal and Intracanopy Shifts in the Fates of Absorbed Photons in Central Amazonian Forests: Implications for Leaf Fluorescence and Photosynthesis. New Phytol. 2025, 248, 76–91. [Google Scholar] [CrossRef] [Scilit] [PubMed]
  47. Maguire, A.J.; Eitel, J.U.H.; Griffin, K.L.; Magney, T.S.; Long, R.A.; Vierling, L.A.; Schmiege, S.C.; Jennewein, J.S.; Weygint, W.A.; Boelman, N.T.; et al. On the Functional Relationship Between Fluorescence and Photochemical Yields in Complex Evergreen Needleleaf Canopies. Geophys. Res. Lett. 2020, 47, e2020GL087858. [Google Scholar] [CrossRef] [Scilit]
  48. Górecki, K.; Rastogi, A.; Stróżecki, M.; Gąbka, M.; Lamentowicz, M.; Łuców, D.; Kayzer, D.; Juszczak, R. Water Table Depth, Experimental Warming, and Reduced Precipitation Impact on Litter Decomposition in a Temperate Sphagnum-Peatland. Sci. Total Environ. 2021, 771, 145452. [Google Scholar] [CrossRef] [Scilit] [PubMed]
  49. Julitta, T.; Corp, L.A.; Rossini, M.; Burkart, A.; Cogliati, S.; Davies, N.; Hom, M.; Arthur, A.M.; Middleton, E.M.; Rascher, U.; et al. Comparison of Sun-Induced Chlorophyll Fluorescence Estimates Obtained from Four Portable Field Spectroradiometers. Remote Sens. 2016, 8, 122. [Google Scholar] [CrossRef] [Scilit]
  50. Burkart, A.; Schickling, A.; Mateo, M.P.C.; Wrobel, T.J.; Rossini, M.; Cogliati, S.; Julitta, T.; Rascher, U. A Method for Uncertainty Assessment of Passive Sun-Induced Chlorophyll Fluorescence Retrieval Using an Infrared Reference Light. IEEE Sens. J. 2015, 15, 4603–4611. [Google Scholar] [CrossRef] [Scilit]
  51. R Core Team. R: A Language and Environment for Statistical Computing; R Foundation for Statistical Computing: Vienna, Austria, 2024. [Google Scholar]
  52. Gamon, J.A.; Peñuelas, J.; Field, C.B. A Narrow-Waveband Spectral Index That Tracks Diurnal Changes in Photosynthetic Efficiency. Remote Sens. Environ. 1992, 41, 35–44. [Google Scholar] [CrossRef] [Scilit]
  53. Juszczak, R.; Uździcka, B.; Stróżecki, M.; Sakowska, K. Improving Remote Estimation of Winter Crops Gross Ecosystem Production by Inclusion of Leaf Area Index in a Spectral Model. PeerJ 2018, 2018, e5613. [Google Scholar] [CrossRef] [Scilit] [PubMed]
  54. Albert-Saiz, M.; Stróżecki, M.; Rastogi, A.; Juszczak, R. A Multi-Model Gap-Filling Strategy Increases the Accuracy of GPP Estimation from Periodic Chamber-Based Flux Measurements on Sphagnum-Dominated Peatland. Sustainability 2025, 17, 393. [Google Scholar] [CrossRef] [Scilit]
  55. Huang, M.; Piao, S.; Ciais, P.; Peñuelas, J.; Wang, X.; Keenan, T.F.; Peng, S.; Berry, J.A.; Wang, K.; Mao, J.; et al. Air Temperature Optima of Vegetation Productivity across Global Biomes. Nat. Ecol. Evol. 2019, 3, 772–779. [Google Scholar] [CrossRef] [Scilit] [PubMed]
  56. Chang, C.Y.; Guanter, L.; Frankenberg, C.; Köhler, P.; Gu, L.; Magney, T.S.; Grossmann, K.; Sun, Y. Systematic Assessment of Retrieval Methods for Canopy Far-Red Solar-Induced Chlorophyll Fluorescence Using High-Frequency Automated Field Spectroscopy. J. Geophys. Res. Biogeosci. 2020, 125, e2019JG005533. [Google Scholar] [CrossRef] [Scilit]
  57. IPCC. Climate Change 2023: Synthesis Report. Contribution of Working Groups I, II and III to the Sixth Assessment Report of the Intergovernmental Panel on Climate Change; Core Writing Team, Lee, H., Romero, J., Eds.; IPCC: Geneva, Switzerland, 2023. [Google Scholar]
  58. Murray, K.J.; Tenhunen, J.D.; Nowak, R.S. Photoinhibition as a Control on Photosynthesis and Production of Sphagnum Mosses. Oecologia 1993, 96, 200–207. [Google Scholar] [CrossRef] [Scilit] [PubMed]
  59. Strack, M.; Waddington, J.M.; Rochefort, L.; Tuittila, E.S. Response of Vegetation and Net Ecosystem Carbon Dioxide Exchange at Different Peatland Microforms Following Water Table Drawdown. J. Geophys. Res. Biogeosci. 2006, 111, G02006. [Google Scholar] [CrossRef] [Scilit]
  60. Alm, J.; Schulman, L.; Walden, J.; Nykanen, H.; Martikainen, P.J.; Silvola, J. Carbon Balance of a Boreal Bog during a Year with an Exceptionally Dry Summer. Ecology 1999, 80, 161. [Google Scholar] [CrossRef] [Scilit] [PubMed]
  61. Helfter, C.; Campbell, C.; Dinsmore, K.J.; Drewer, J.; Coyle, M.; Anderson, M.; Skiba, U.; Nemitz, E.; Billett, M.F.; Sutton, M.A. Drivers of Long-Term Variability in CO2 Net Ecosystem Exchange in a Temperate Peatland. Biogeosciences 2015, 12, 1799–1811. [Google Scholar] [CrossRef] [Scilit]
  62. Nijp, J.J.; Limpens, J.; Metselaar, K.; van der Zee, S.E.A.T.M.; Berendse, F.; Robroek, B.J.M. Can Frequent Precipitation Moderate the Impact of Drought on Peatmoss Carbon Uptake in Northern Peatlands? New Phytol. 2014, 203, 70–80. [Google Scholar] [CrossRef] [Scilit] [PubMed]
  63. Saarinen, T. Biomass and Production of Two Vascular Plants in a Boreal Mesotrophic Fen. Can. J. Bot. 1996, 74, 934–938. [Google Scholar] [CrossRef] [Scilit]
  64. Helm, L.T.; Shi, H.; Lerdau, M.T.; Yang, X. Solar-Induced Chlorophyll Fluorescence and Short-Term Photosynthetic Response to Drought. Ecol. Appl. 2020, 30, e02101. [Google Scholar] [CrossRef] [Scilit] [PubMed]
  65. Wada, M. Chloroplast Movement. Plant Sci. 2013, 210, 177–182. [Google Scholar] [CrossRef] [Scilit] [PubMed]
  66. de Souza, M.A.; de Andrade, L.I.F.; Gago, J.; Pereira, E.G. Photoprotective Mechanisms and Higher Photorespiration Are Key Points for Iron Stress Tolerance under Heatwaves in Rice. Plant Sci. 2024, 342, 112031. [Google Scholar] [CrossRef] [Scilit] [PubMed]
  67. Renou-Wilson, F.; Barry, C.; Müller, C.; Wilson, D. The Impacts of Drainage, Nutrient Status and Management Practice on the Full Carbon Balance of Grasslands on Organic Soils in a Maritime Temperate Zone. Biogeosciences 2014, 11, 4361–4379. [Google Scholar] [CrossRef] [Scilit]
  68. Weston, D.J.; Timm, C.M.; Walker, A.P.; Gu, L.; Muchero, W.; Schmutz, J.; Shaw, A.J.; Tuskan, G.A.; Warren, J.M.; Wullschleger, S.D. Sphagnum Physiology in the Context of Changing Climate: Emergent Influences of Genomics, Modelling and Host-Microbiome Interactions on Understanding Ecosystem Function. Plant Cell Environ. 2015, 38, 1737–1751. [Google Scholar] [CrossRef] [Scilit] [PubMed]
  69. Carriquí, M.; Roig-Oliver, M.; Brodribb, T.J.; Coopman, R.; Gill, W.; Mark, K.; Niinemets, Ü.; Perera-Castro, A.V.; Ribas-Carbó, M.; Sack, L.; et al. Anatomical Constraints to Nonstomatal Diffusion Conductance and Photosynthesis in Lycophytes and Bryophytes. New Phytol. 2019, 222, 1256–1270. [Google Scholar] [CrossRef] [Scilit] [PubMed]
  70. Porcar-Castell, A.; Tyystjärvi, E.; Atherton, J.; Van Der Tol, C.; Flexas, J.; Pfündel, E.E.; Moreno, J.; Frankenberg, C.; Berry, J.A. Linking Chlorophyll a Fluorescence to Photosynthesis for Remote Sensing Applications: Mechanisms and Challenges. J. Exp. Bot. 2014, 65, 4065–4095. [Google Scholar] [CrossRef] [Scilit] [PubMed]
  71. Wu, Y.; Zhang, Z.; Zhang, X.; Wu, L.; Zhang, Y. How Do Sky Conditions Affect the Relationships Between Ground-Based Solar-Induced Chlorophyll Fluorescence and Gross Primary Productivity Across Different Plant Types? J. Geophys. Res. Biogeosci. 2022, 127, e2022JG006865. [Google Scholar] [CrossRef] [Scilit]
  72. Gamon, J.A.; Kovalchuck, O.; Wong, C.Y.S.; Harris, A.; Garrity, S.R. Monitoring Seasonal and Diurnal Changes in Photosynthetic Pigments with Automated PRI and NDVI Sensors. Biogeosciences 2015, 12, 4149–4159. [Google Scholar] [CrossRef] [Scilit]
  73. Greiser, C.; Hederová, L.; Vico, G.; Wild, J.; Macek, M.; Kopecký, M. Higher Soil Moisture Increases Microclimate Temperature Buffering in Temperate Broadleaf Forests. Agric. For. Meteorol. 2024, 345, 109828. [Google Scholar] [CrossRef] [Scilit]
  74. Wood, J.D.; Roman, D.T.; Griffis, T.J.; Cadillo-Quiroz, H.; Del Castillo, D.; Fachin, L.; Lilleskov, E.; Kolka, R.K.; Rengifo, J.; Wayson, C. A Large Amazonian Peatland Carbon Sink Was Eliminated by Photoinhibition of Photosynthesis and Amplified Ecosystem Respiration. Geophys. Res. Lett. 2025, 52, e2025GL114642. [Google Scholar] [CrossRef] [Scilit]
  75. Flexas, J.; Escalona, J.M.; Evain, S.; Gulías, J.; Moya, I.; Osmond, C.B.; Medrano, H. Steady-State Chlorophyll Fluorescence (Fs) Measurements as a Tool to Follow Variations of Net CO2 Assimilation and Stomatal Conductance during Water-Stress in C3 Plants. Physiol. Plant. 2002, 114, 231–240. [Google Scholar] [CrossRef] [Scilit] [PubMed]
  76. Garbulsky, M.F.; Peñuelas, J.; Gamon, J.; Inoue, Y.; Filella, I. The Photochemical Reflectance Index (PRI) and the Remote Sensing of Leaf, Canopy and Ecosystem Radiation Use Efficiencies. A Review and Meta-Analysis. Remote Sens. Environ. 2011, 115, 281–297. [Google Scholar] [CrossRef] [Scilit]
  77. Wieneke, S.; Ahrends, H.; Damm, A.; Pinto, F.; Stadler, A.; Rossini, M.; Rascher, U. Airborne Based Spectroscopy of Red and Far-Red Sun-Induced Chlorophyll Fluorescence: Implications for Improved Estimates of Gross Primary Productivity. Remote Sens. Environ. 2016, 184, 654–667. [Google Scholar] [CrossRef] [Scilit]
  78. Marrs, J.K.; Reblin, J.S.; Logan, B.A.; Allen, D.W.; Reinmann, A.B.; Bombard, D.M.; Tabachnik, D.; Hutyra, L.R. Solar-Induced Fluorescence Does Not Track Photosynthetic Carbon Assimilation Following Induced Stomatal Closure. Geophys. Res. Lett. 2020, 47, e2020GL087956. [Google Scholar] [CrossRef] [Scilit]
  79. Dechant, B.; Ryu, Y.; Badgley, G.; Zeng, Y.; Berry, J.A.; Zhang, Y.; Goulas, Y.; Li, Z.; Zhang, Q.; Kang, M.; et al. Canopy Structure Explains the Relationship between Photosynthesis and Sun-Induced Chlorophyll Fluorescence in Crops. Remote Sens. Environ. 2020, 241, 111733. [Google Scholar] [CrossRef] [Scilit]
  80. Chen, A.; Mao, J.; Ricciuto, D.; Xiao, J.; Frankenberg, C.; Li, X.; Thornton, P.E.; Gu, L.; Knapp, A.K. Moisture Availability Mediates the Relationship between Terrestrial Gross Primary Production and Solar-Induced Chlorophyll Fluorescence: Insights from Global-Scale Variations. Glob. Change Biol. 2021, 27, 1144–1156. [Google Scholar] [CrossRef] [Scilit] [PubMed]
  81. Yang, K.; Ryu, Y.; Dechant, B.; Berry, J.A.; Hwang, Y.; Jiang, C.; Kang, M.; Kim, J.; Kimm, H.; Kornfeld, A.; et al. Sun-Induced Chlorophyll Fluorescence Is More Strongly Related to Absorbed Light than to Photosynthesis at Half-Hourly Resolution in a Rice Paddy. Remote Sens. Environ. 2018, 216, 658–673. [Google Scholar] [CrossRef] [Scilit]
  82. Signarbieux, C.; Feller, U. Non-Stomatal Limitations of Photosynthesis in Grassland Species under Artificial Drought in the Field. Environ. Exp. Bot. 2011, 71, 192–197. [Google Scholar] [CrossRef] [Scilit]
  83. Murata, N.; Takahashi, S.; Nishiyama, Y.; Allakhverdiev, S.I. Photoinhibition of Photosystem II under Environmental Stress. Biochim. Biophys. Acta Bioenerg. 2007, 1767, 414–421. [Google Scholar] [CrossRef] [Scilit] [PubMed]
  84. Takahashi, S.; Badger, M.R. Photoprotection in Plants: A New Light on Photosystem II Damage. Trends Plant Sci. 2011, 16, 53–60. [Google Scholar] [CrossRef] [Scilit] [PubMed]
  85. Salvucci, M.E.; Crafts-Brandner, S.J. Inhibition of Photosynthesis by Heat Stress: The Activation State of Rubisco as a Limiting Factor in Photosynthesis. Physiol. Plant. 2004, 120, 179–186. [Google Scholar] [CrossRef] [Scilit] [PubMed]
  86. Perdomo, J.A.; Capó-Bauçà, S.; Carmo-Silva, E.; Galmés, J. Rubisco and Rubisco Activase Play an Important Role in the Biochemical Limitations of Photosynthesis in Rice, Wheat, and Maize under High Temperature and Water Deficit. Front. Plant Sci. 2017, 8, 240508. [Google Scholar] [CrossRef] [Scilit] [PubMed]
  87. Nilkens, M.; Kress, E.; Lambrev, P.; Miloslavina, Y.; Müller, M.; Holzwarth, A.R.; Jahns, P. Identification of a Slowly Inducible Zeaxanthin-Dependent Component of Non-Photochemical Quenching of Chlorophyll Fluorescence Generated under Steady-State Conditions in Arabidopsis. Biochim. Biophys. Acta Bioenerg. 2010, 1797, 466–475. [Google Scholar] [CrossRef] [Scilit] [PubMed]
  88. Foyer, C.H.; Bloom, A.J.; Queval, G.; Noctor, G. Photorespiratory Metabolism: Genes, Mutants, Energetics, and Redox Signaling. Annu. Rev. Plant Biol. 2009, 60, 455–484. [Google Scholar] [CrossRef] [Scilit] [PubMed]
  89. Schipperges, B.; Rydin, H. Response of Photosynthesis of Sphagnum Species from Contrasting Microhabitats to Tissue Water Content and Repeated Desiccation. New Phytol. 1998, 140, 677–684. [Google Scholar] [CrossRef] [Scilit] [PubMed]
  90. Verma, M.; Schimel, D.; Evans, B.; Frankenberg, C.; Beringer, J.; Drewry, D.T.; Magney, T.; Marang, I.; Hutley, L.; Moore, C.; et al. Effect of Environmental Conditions on the Relationship between Solar-Induced Fluorescence and Gross Primary Productivity at an OzFlux Grassland Site. J. Geophys. Res. Biogeosci. 2017, 122, 716–733. [Google Scholar] [CrossRef] [Scilit]
  91. Frankenberg, C.; Fisher, J.B.; Worden, J.; Badgley, G.; Saatchi, S.S.; Lee, J.E.; Toon, G.C.; Butz, A.; Jung, M.; Kuze, A.; et al. New Global Observations of the Terrestrial Carbon Cycle from GOSAT: Patterns of Plant Fluorescence with Gross Primary Productivity. Geophys. Res. Lett. 2011, 38, L17706. [Google Scholar] [CrossRef] [Scilit]
  92. Köhler, P.; Frankenberg, C.; Magney, T.S.; Guanter, L.; Joiner, J.; Landgraf, J. Global Retrievals of Solar-Induced Chlorophyll Fluorescence With TROPOMI: First Results and Intersensor Comparison to OCO-2. Geophys. Res. Lett. 2018, 45, 10456–10463. [Google Scholar] [CrossRef] [Scilit] [PubMed]
  93. Butterfield, Z.; Magney, T.; Grossmann, K.; Bohrer, G.; Vogel, C.; Barr, S.; Keppel-Aleks, G. Accounting for Changes in Radiation Improves the Ability of SIF to Track Water Stress-Induced Losses in Summer GPP in a Temperate Deciduous Forest. J. Geophys. Res. Biogeosci. 2023, 128, e2022JG007352. [Google Scholar] [CrossRef] [Scilit]
  94. Zheng, X.; Zhao, W.; Zhu, Z.; Wang, Z.; Zheng, Y.; Li, D. Characterization and Evaluation of Global Solar-Induced Chlorophyll Fluorescence Products: Estimation of Gross Primary Productivity and Phenology. J. Remote Sens. 2024, 4, 0173. [Google Scholar] [CrossRef] [Scilit]
  95. Cheng, X.; Zhou, Y.; Hu, M.; Wang, F.; Huang, H.; Zhang, J. The Links between Canopy Solar-Induced Chlorophyll Fluorescence and Gross Primary Production Responses to Meteorological Factors in the Growing Season in Deciduous Broadleaf Forest. Remote Sens. 2021, 13, 2363. [Google Scholar] [CrossRef] [Scilit]
  96. Baldocchi, D.D. Assessing the Eddy Covariance Technique for Evaluating Carbon Dioxide Exchange Rates of Ecosystems: Past, Present and Future. Glob. Change Biol. 2003, 9, 479–492. [Google Scholar] [CrossRef] [Scilit]
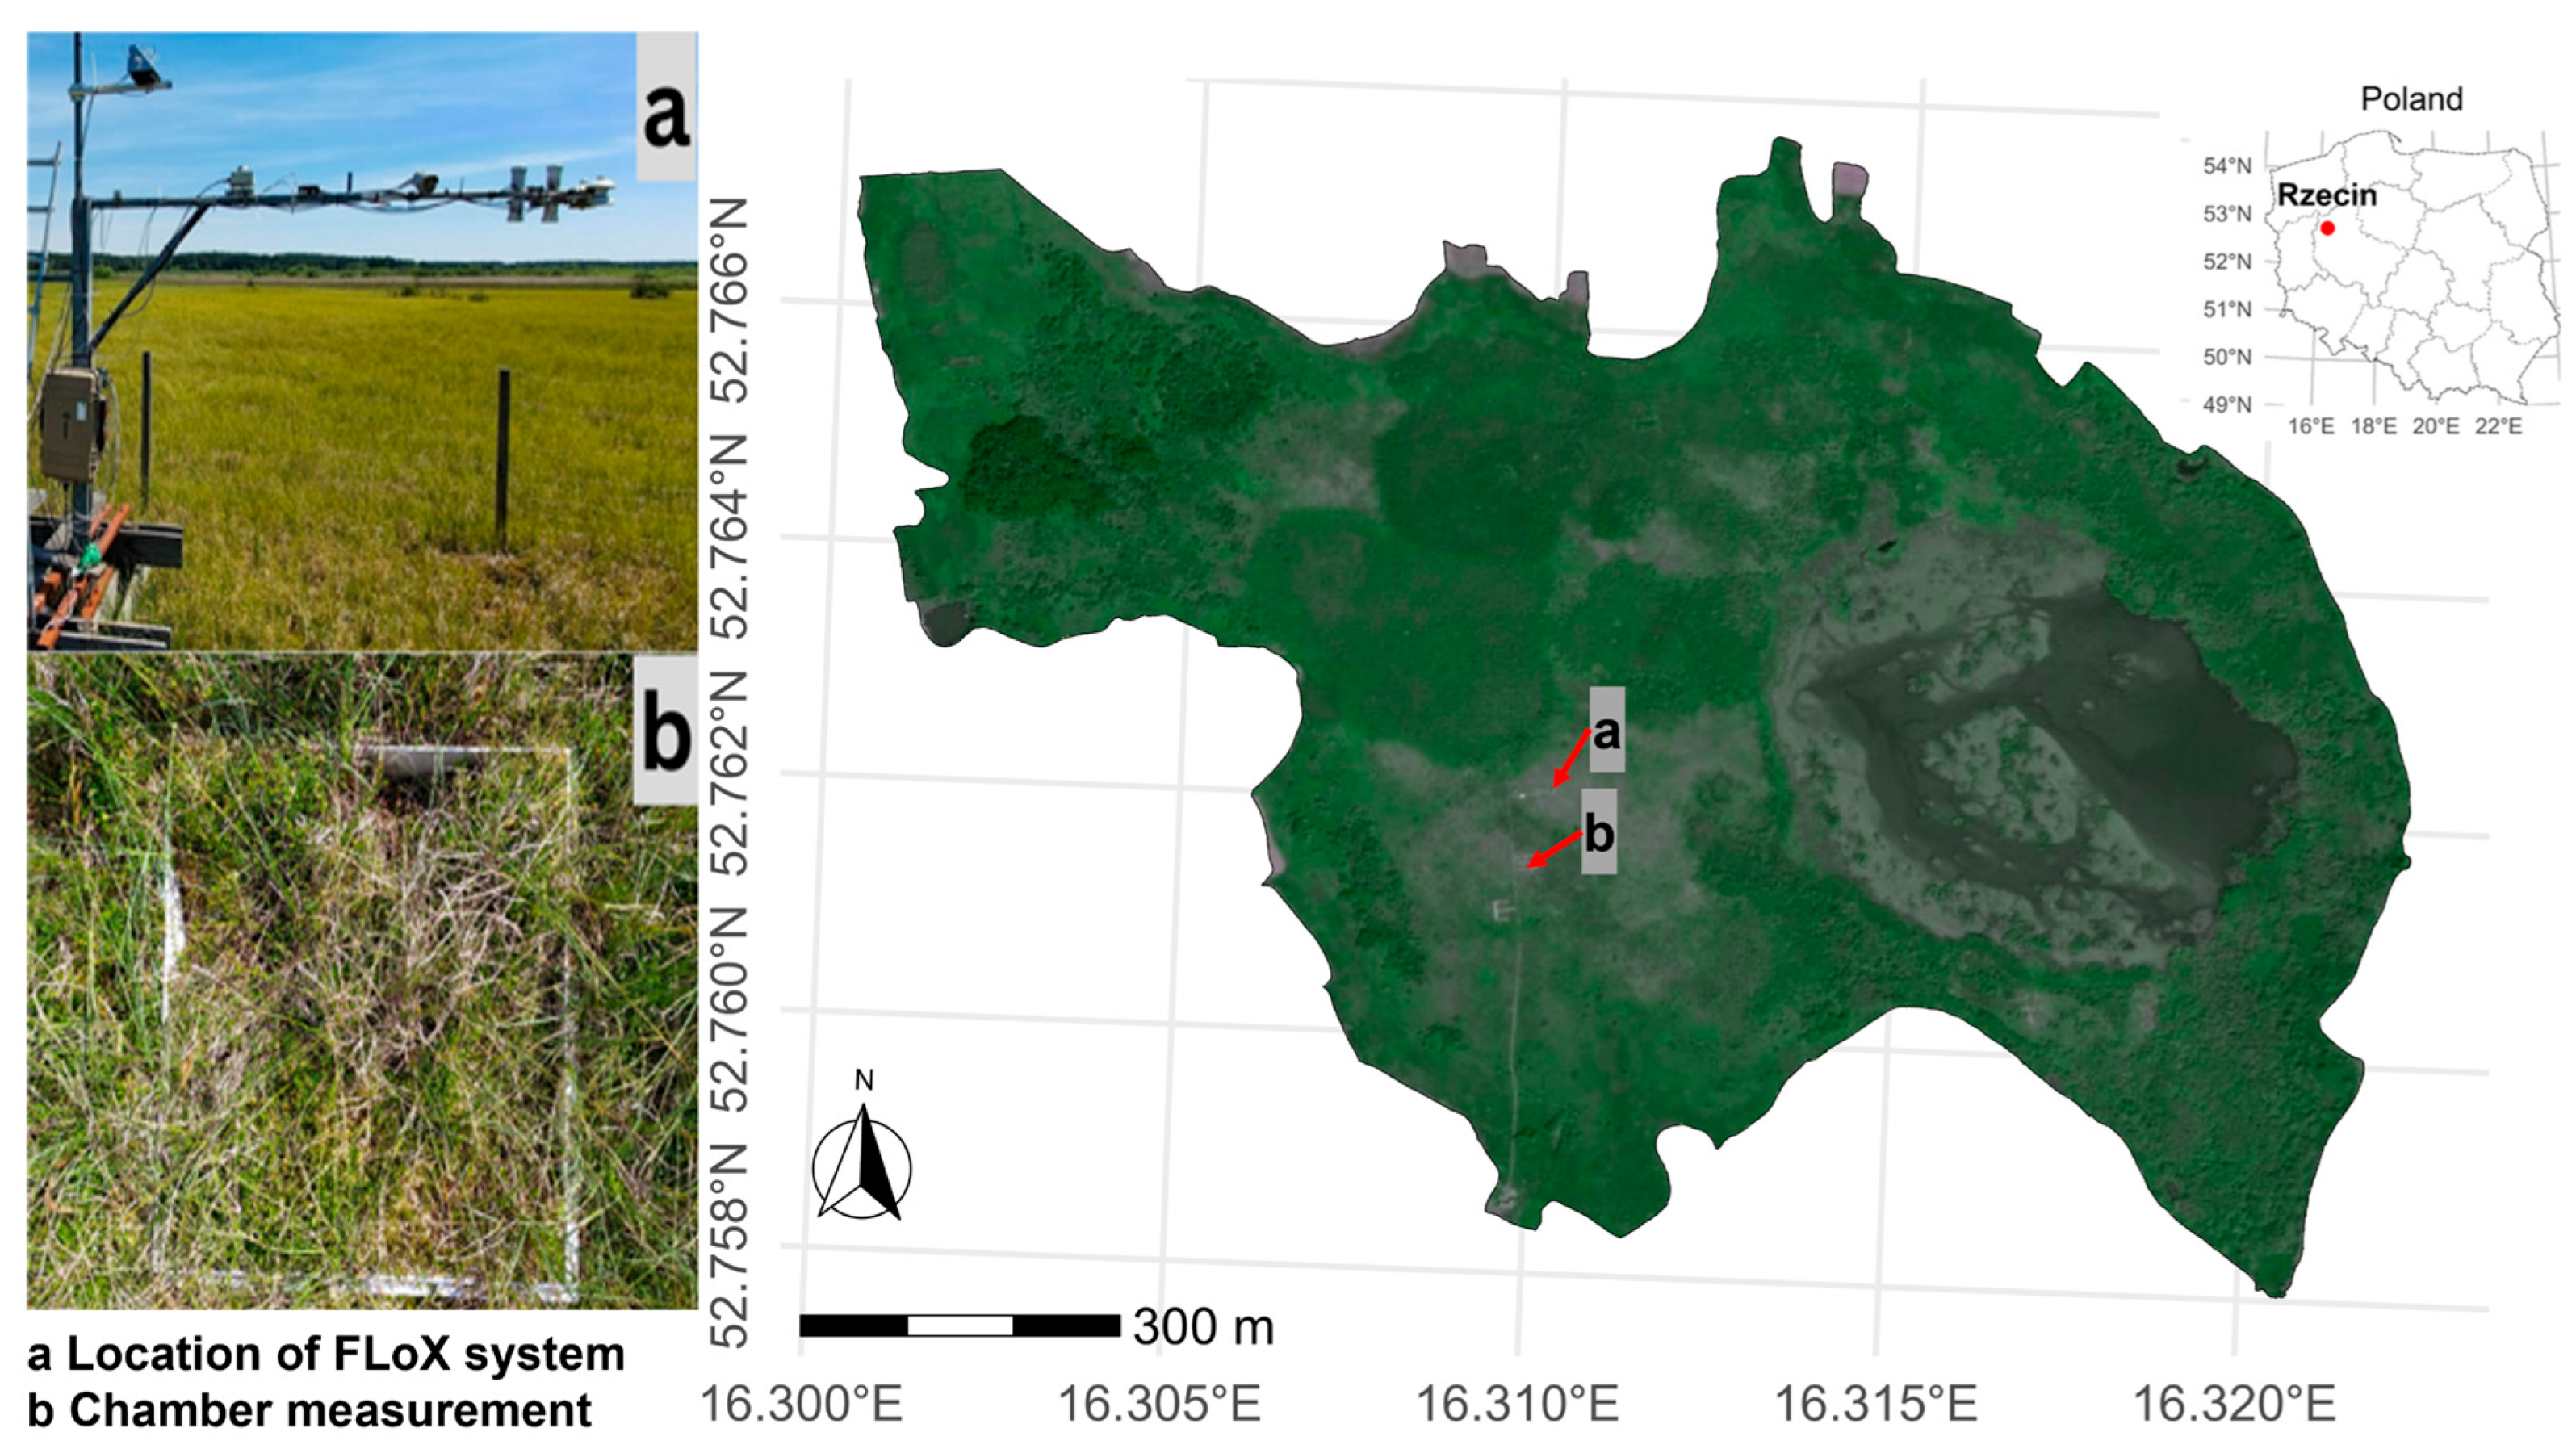
Figure 1. The top-right map shows the location of the study site in Poland, and the close-up in the centre shows the fen-peatland. Key locations include (a) the FloX instrument and (b) the site where chamber CO2 measurements were taken.
Remotesensing 18 02826 g001
Figure 2. The study area’s meteorological and hydrological conditions from 20 June to 20 July 2019. The solid lines define maximum air temperature (Tair max), average daytime air temperature (Tair) and vapour pressure deficit (VPD), with dashed lines indicating the established optimum thresholds for temperature (Topt, 25 °C) and VPD (VPDopt, 15 hPa) [8,55]. The bar plot presents cumulative daily precipitation. The bottom blue area of the plot shows average daily water table depth (WTD), the brown portion represents the aerated peat, and the yellow area above shows photosynthetically active radiation (PAR) averaged during the hours from 10:00 to 15:00. The highlighted areas (cases A and B) are the selected days where the stress events were identified.
Remotesensing 18 02826 g002
Figure 3. Temporal patterns of the sun-induced fluorescence (SIF O2-A, blue line in the lower panel), gross primary production (GPP, pink line in the upper panel) and photochemical reflectance index (PRI, yellow line in the upper panel). The shaded vertical regions represent the selected cases where stress events happened on 27 June (Case A) and 29–30 June (Case B). Both LUE and SIF yield diurnal patterns are included in Figure S4.
Remotesensing 18 02826 g003
Figure 4. Correlation analysis between sun-induced fluorescence (SIF O2-A) and gross primary production (GPP) during different periods of the day and stress cases (case A: 27 June 2019, case B: 29–30 June 2019). Regression lines (dashed) and R2 values are shown for each period. (Table S1 summarises all correlation coefficients by case, period, and stress phase).
Remotesensing 18 02826 g004
Figure 5. The Delta (|Δ|) analysis of stress impacts on gross primary production (GPP), sun-induced fluorescence (SIF), photochemical reflectance index (PRI), photosynthetically active radiation (PAR), air temperature (Tair), and vapour pressure deficit (VPD) from Cases A and B. Bar plots show absolute differences (|Δ|) between before-stress/stress and after-stress/stress periods for both cases. Error bars represent standard errors. Categories: Morning Before Stress-Morning During Stress (M.B-M.S); Morning After Stress-Morning During Stress (M.A-M.S); Noon Before Stress-Noon During Stress (N.B-N.S); Noon After Stress-Noon During Stress (N.A-N.S); Afternoon Before Stress-Afternoon During Stress (A.B-A.S); Afternoon After Stress-Afternoon During Stress (A.A-A.S). Absolute deltas for all physiological and environmental variables, including standard errors and period-specific comparisons and p-value (Welch’s t-test) and Cohen’s d effect size, are provided in Table S2.
Remotesensing 18 02826 g005
Table 1. Dates for defined periods for Case A and Case B.
PeriodCase ACase B
Before26 June28 June
During stress27 June29 June–30 June
After28 June1–2 July
Disclaimer/Publisher’s Note: The statements, opinions and data contained in all publications are solely those of the individual author(s) and contributor(s) and not of MDPI and/or the editor(s). MDPI and/or the editor(s) disclaim responsibility for any injury to people or property resulting from any ideas, methods, instructions or products referred to in the content.