Abstract
Risk of hyperuricemia is modified by genetic and environmental factors. Our aim was to identify factors associated with serum uric acid levels and hyperuricemia in Mexicans. A pilot Genome-wide association study GWAS was performed in a subgroup of participants (n = 411) from the Health Workers Cohort Study (HWCS). Single nucleotide polymorphisms (SNPs) associated with serum uric acid levels were validated in all the HWCS participants (n = 1939) and replicated in independent children (n = 1080) and adult (n = 1073) case-control studies. The meta-analysis of the whole HWCS and replication samples identified three SLC2A9 SNPs: rs1014290 (p = 2.3 × 10−64), rs3775948 (p = 8.2 × 10−64) and rs11722228 (p = 1.1 × 10⁻¹⁷); and an ABCG2 missense SNP, rs2231142 (p = 1.0 × 10⁻¹⁸). Among the non-genetic factors identified, the visceral adiposity index, smoking, the metabolic syndrome and its components (waist circumference, blood pressure, glucose and hyperlipidemia) were associated with increased serum uric acid levels and hyperuricemia (p < 0.05). Among the female HWCS participants, the odds ratio for hyperuricemia was 1.24 (95% CI, 1.01–1.53) per unit increase in soft drink consumption. As reported in other studies, our findings indicate that diet, adiposity and genetic variation contribute to the elevated prevalence of hyperuricemia in Mexico.
1. Introduction
Hyperuricemia is necessary for the development of gout and is associated with chronic diseases like obesity, metabolic syndrome, insulin resistance, cardiovascular disease, hypertension, chronic kidney disease, and type 2 diabetes [1,2,3,4,5]. Globally, the prevalence of hyperuricemia is estimated to be 2.0–32.1%, and it is higher in men than in women [6,7,8,9]. The prevalence of hyperuricemia in a cohort study of adults in Mexico was estimated to be 20.6% among men and 13.5% in women [9]. Additionally, the prevalence increases with age, particularly among postmenopausal women [10].
Elevated uric acid (UA) concentrations can be caused by low intestinal or renal excretion rates, and from UA overproduction that is probably due to an excess of purine precursors [11]. Epidemiological evidence suggests that the body mass index, genetic polymorphisms and purine-rich foods such as alcohol, meat, legumes and seafood, can influence serum UA concentrations [12]. Some studies have reported that serum UA concentrations are markedly heritable [13,14].
Genome-wide association studies (GWAS) conducted in European, American, Mexican American, Indian, Japanese and Chinese populations have identified significant associations between single nucleotide polymorphisms (SNPs) in the SLC2A9 and ABCG2 genes, and UA levels [15,16,17,18,19,20,21]. However, genetic epidemiological studies for UA levels are limited in the Mexican population [22]. Additionally, these studies have failed to consider hyperuricemia as a dichotomous trait, and they have not included nutritional data. The aim of this study was to identify genetic and non-genetic risk factors for hyperuricemia in Mexico. This pilot GWAS in a well characterized cohort of Mexican children and adults may provide further insight into the genetic factors affecting UA levels and their relationship to known environmental risk factors.
2. Materials and Methods
2.1. Study Population
We performed a pilot GWAS on the participants of the Health Workers Cohort Study (HWCS), comprised of Mexican-Mestizo subjects who were followed up between 2010 and 2012. The study design, methodology and participants’ baseline characteristics have been described in detail elsewhere [23].
The discovery sample consisted of a subgroup of 411 unrelated postmenopausal women who are HWCS participants. A first stage of validation was conducted with all the HWCS participants (n = 1939). Individuals <18 years of age (n = 85), with kidney failure (n = 14), missing UA concentrations (n = 1) and missing genotype data (n = 30) were excluded. After these exclusions, a total of 1936 subjects (including the 396 women from the discovery sample) comprised the study sample (Supplementary Figure S1).
The replication groups consisted of 1080 obese and normal weight children (6–12 years) and 1073 obese and normal weight adults (18–82 years) from Mexico City. These case-control studies (CCS) were designed to identify risk factors for obesity and metabolic abnormalities. The recruitment and inclusion criteria have been described elsewhere (Supplementary Figure S1) [24].
All study participants provided written informed consent and the ethical committees from the Instituto Mexicano del Seguro Social (No. 12CEI 09 006 14) and Instituto Nacional de Medicina Genómica approved this research project [23].
2.2. Measurement of Outcomes
As part of the HWCS procedures, fasting blood specimens (≥ 8 h) were obtained for each participant and serum UA levels were measured by the enzymatic colorimetric method, using the SYNCHRON CX® system (Beckman Coulter CA, USA) [9,23]. The serum UA in the replication groups was determined with a commercial uricase assay (UNICEL DxC600, Beckman coulter) [24]. Hyperuricemia was defined as the UA levels ≥7.0 mg/dL in men and ≥5.8 mg/dL in women; for children it was determined using the sex and age-specific cut-off values [9,25].
2.3. Assessment of Covariates
The socio-demographic information was obtained from self-reported questionnaires [23]. The procedures for collecting biochemical assays (HDL-C, LDL-C, total cholesterol, triglycerides, glucose, and insulin levels) were followed as previously described [23,24]. The homeostasis model assessment of the insulin resistance (HOMA-IR) was determined with the formula: HOMA = (insulin μU/mL × glucose mmol/L)/22.5 [26]. Metabolic Syndrome was defined according to the International Diabetes Federation [24,27,28]. Additionally, we estimated the visceral adiposity index (VAI) using sex-specific equations [29]. The coronary heart disease (CHD) risk was calculated using a previously validated recalibration of the Framingham Coronary Heart Disease Risk Score [30]. The dietary information was obtained from a food frequency questionnaire that consists of 116 items [23].
2.4. Sample Genotyping and Quality Control
A pilot GWAS scan was performed in 411 unrelated postmenopausal women from the HWCS using Infinium HumanCytoSNP-12 DNA v2.1 chips, following the manufacturer’s protocol. Briefly, we genotyped 300,000 SNPs, and after stringent quality control filtering we excluded individuals with a genotyping call rate <97% from further analysis (n = 15). SNPs were excluded when the Minor Allele Frequency (MAF) was <0.05, the Hardy-Weinberg Equilibrium (HWE) test p-value was <0.0001, and the SNPs call rate was <95%. A total of 225,635 SNPs in 396 women with an overall call rate of 99.68% were used for further analysis. The study design and methodology are described in detail elsewhere [31].
Genome-wide SNP imputation was performed with the Michigan Imputation Server Web-Tool [32]. The pre-imputation quality controls were a 95% sample call rate and a Hardy-Weinberg p > 10−6 and 95% SNP call rate. After haplotype phasing with Eagle’s v2.3 algorithm [33], imputed SNPs from the Haplotype Reference Consortium (HRC) panel [34] with high genotype information content were retained for the association analysis. A total of 7.2 million SNPs were used. A linear Wald test (Quantitative) was performed for the genome-wide association analysis using EPACTS software [35]. We analyzed the UA levels using residuals and inverse normal transformation for each trait with the age, body mass index (BMI) and two principal ancestry components (PC) as covariates.
In the pediatric and adult replication groups, genotyping was performed with the expanded Multi-Ethnic Genome Array (Illumina) using the same quality control criteria. The genotypes for the selected SNPs were extracted using Plink 1.9 [24].
2.5. Selection of SNPs for Validation
We selected rs3775948, rs1014290, rs11722228 (SLC2A9) and rs2231142 (ABCG2) for validation based on the following criteria: (1) SNPs with a serum UA association with p < 1.0 × 10⁻⁵ in the discovery GWAS; (2) previously reported SNPs with an evidence of a functional effect on UA; (3) MAF ≥ 0.05; and (4) SNPs that have shown the strongest association in Mexican-American populations. We used the TaqMan assay (Applied Biosystems) to genotype the four SNPs.
2.6. Statistical Analysis
The Hardy-Weinberg Equilibrium was tested in each of the study groups using the chi-square (chi2) test. Descriptive analyses of demographic and clinical variables stratified by hyperuricemia were performed in each sample. To assess the differences between groups, we conducted a chi2 test for the categorical variables and a Wilcoxon test or Student’s t-test for the continuous variables (e.g., age, BMI), respectively. To estimate the association between the serum UA and genetic SLC2A9 or ABCG2 variants or non-genetic factors, we performed multivariable linear regressions, adjusting for different co-variables in each model. We also used a logistic regression model to evaluate the association between hyperuricemia and non-genetic and genetic factors, adjusting for covariates. Additionally, we constructed a genetic risk score (GRS) [36] that included two SNPs: SLC2A9 rs11722228 and ABCG2 rs2231142, and evaluated its association with hyperuricemia. We also analyzed interactions with diet (soft drinks, alcohol, dietary patterns, total proteins, and animal proteins) among the HWCS participants by adding an interaction term to the logistic regression models. Statistical analyses were performed using STATA software, version 14.0 (StataCorp LP, College Station, TX, USA) [37]. Linkage disequilibrium (LD) and haplotype frequencies were estimated using Haploview 4.2 [38]. The discovery and validation results were combined in a meta-analysis using an inverse variance method, assuming a random-effects model. The between-group heterogeneity was assessed with I2 and Cochrane’s Q with the R package meta. All p values presented are two-tailed, and a p value <0.05 was considered statistically significant. To account for multiple testing (four SNPs), a p value of <0.0125 was considered significant (Bonferroni-corrected p value).
3. Results
3.1. Characteristics of Study Participants
The anthropometric and biochemical characteristics of the HWCS subjects who participated in the discovery and validation samples are shown in Supplementary Table S1. The median age in the discovery sample was 61 years, median serum UA was 5.3 mg/dl, 46.2% were overweight and 29.8% were obese. The prevalence of metabolic syndrome was that 65.4%, and 32.8% of the participants were found to have osteopenia, while 4.2% had osteoporosis. Within the validation sample, the median age was 48 years, with a prevalence of overweightness and obesity of 42.1% and 22.8%, respectively, and a median serum UA of 5.4 mg/dl. The prevalence of hyperuricemia was lower in the validation sample compared to the discovery group (26.3% vs. 34%, respectively) (Supplementary Table S1).
The demographic and clinical characteristics of the study groups (HWCS, adults and children) are presented in Table 1. The prevalence of hyperuricemia was similar among the different cohorts: 27.8 % among the HWCS, 22.7% in the CCS adults, and 20.2% among the CCS children, respectively. The median age, BMI, waist circumference, insulin levels, HOMA, systolic and diastolic blood pressures, serum concentrations of lipids, fasting glucose, creatinine, and uric acid levels were greater among patients with hyperuricemia, compared to the controls in the different cohorts. The prevalence of metabolic syndrome and obesity were higher among patients with hyperuricemia than in the corresponding controls. These results were similar among the different cohorts (Table 1).

Table 1.
Characteristics of study groups by hyperuricemia status.
3.2. Non-Genetic Risk Factors and Uric Acid Levels
In all the samples, we observed that obesity, metabolic syndrome and its components (hypertriglyceridemia, hypertension, and hyperglycemia) were associated with increased uric acid levels. For example, among the HWSC participants, metabolic syndrome [males β = 0.53 (95% CI 0.31, 0.75), females β = 0.57 (95% CI 0.44, 0.71)], the visceral adiposity index [males β = 0.05 (95% CI 0.009, 0.09), females β = 0.08 (95% CI 0.06, 0.11)], BMI [males β = 0.07 (95% CI 0.05, 0.10), females β = 0.06 (95% CI 0.05, 0.08)] and smoking [males β = 0.33 (95% CI 0.04, 0.62), females β = 0.41 (95% CI 0.19, 0.63)] were positively associated with higher uric acid levels (Table 2). These results were similar with hyperuricemia and the non-genetic factors in all groups. For example, individuals in the highest VAI quartile had higher odds for hyperuricemia compared with individuals from the lowest quartile. Among the female HWCS participants, for each unit increase in the daily soft drink intake the odds ratio of hyperuricemia was 1.24 (95% CI, 1.01–1.53) (Supplementary Table S2).
Table 2.
Association between metabolic syndrome, its components, diet, and smoking with serum uric acid levels.
Additionally, female HWCS participants with hyperuricemia had an odds ratio of 1.63 (95% CI, 1.14–2.33) for CHD compared to females without hyperuricemia, after adjusting for covariates. However, there was no association between hyperuricemia and CHD among males (Supplementary Table S3).
3.3. Genetic Risk Factors-Discovery Sample
Figure 1 shows the genome-wide association results in 411 postmenopausal women, a sub-cohort from the HWCS (discovery sample) with genotyped and imputed SNPs. Several SNPs showed suggestive associations with serum UA which suggests multiple loci with modest effects. None of the SNPs met the conventional criteria for a genome-wide significance. However, 47 SNPs in the solute carrier protein 2 family member 9 (SLC2A9) on chromosome 4 (Figure 1) met the genome-wide suggestive association threshold of p < 1.0 × 10⁻⁵.
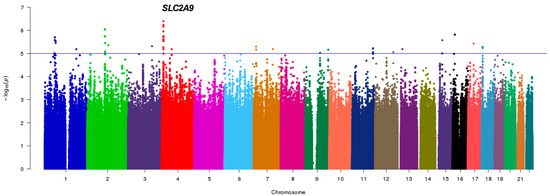
Figure 1.
Pilot GWAS for the Serum Uric Acid (SUA) levels in the discovery sample. Manhattan plot for SUA showing the -log10 transformed p-value of SNPs for 411 Mexican postmenopausal women from HWCS. The blue line indicates the established threshold value of p < 1.0 × 10⁻⁵. The gene closest to the SNP with the lowest p-value is indicated.
The SNPs with a suggestive association were in a region that covered both SLC2A9 and the adjacent gene: WD repeat-containing protein 1 (WDR1). The strongest association was with the imputed intronic SNP rs3775948 (p = 6.89 × 10⁻⁷), followed by the genotyped intronic SNP rs1014290 (p = 2.62 × 10⁻⁶, MAF = 0.33). The linkage disequilibrium (LD) amongst them revealed that they belong to a single block within SLC2A9 (r2 = 0.90) (Supplementary Figure S2). Interestingly, another associated SNP in SLC2A9, rs11722228 (p = 9.93 × 10⁻⁵, MAF = 0.25), was not in LD with the lead SNP (r2 = 0.25). The second most significant result outside the SLC2A9/WDR1 region was obtained with the non-synonymous SNP rs2231142 (9.60 × 10⁻⁵, MAF = 0.25), in ABCG2 (data not shown, information available upon request), also on chromosome 4.
The top suggestive associations are presented in Supplementary Table S4, with minor allele frequencies that range from 0.057 to 0.352. With the exception of the SLC2A9 gene, there is insufficient evidence to support the role of other genes in disease pathogenesis that warrants further replication. The SNPs selected for replication were rs3775948, rs1014290 and rs11722228 of the SLC2A9 gene, and rs2231142 in the ABCG2 gene.
3.4. Replication Analysis
In the first validation analysis, the selected SNPs were examined in the entire HWCS cohort under an additive model. The linear regression results adjusted for the main covariates indicate that four SNPs were associated with serum UA levels: rs3775948 allele G [β = −0.39 (95% CI −0.46, −0.31), p = 3.1 × 10⁻²⁴], rs1014290 allele G [β = −0.40 (95% CI −0.48, −0.33), p = 1.5 × 10⁻²⁵], rs11722228 [β = 0.33 (95% CI 0.25, 0.41), p = 1.1 × 10⁻¹⁵] and rs2231142 [β = 0.23 (95% CI 0.15, 0.31), p = 5.4 × 10⁻⁸] (Table 3).
Table 3.
Association between SLC2A9 and ABCG2 genes with serum uric acid levels.
In the second validation, the selected SNPs also showed a significant association with the serum UA levels. Among CCS-adults, the minor alleles of rs3775948 [β = −0.37 (95% CI −0.46, −0.27), p = 2.1 × 10⁻¹⁶] and rs1014290 [β = −0.31 (95% CI −0.41, −0.22), p = 2.3 × 10⁻¹⁰] were negatively associated with uric acid levels, independently of other possible confounding variables. The minor alleles of rs11722228 [β = 0.29 (95% CI 0.19, 0.39, p = 1.2 × 10⁻⁸] and rs2231142 [β = 0.23 (95% CI 0.13, 0.32), p = 7.2 × 10⁻⁶] were associated with increased uric acid levels (Table 3).
We further analyzed the extent to which SLC2A9 and ABCG2 are associated with AU levels in children, and our findings were similar to the previously analyzed cohorts. The minor alleles of rs3775948 and rs1014290 were inversely associated with the UA levels, while the minor alleles of rs11722228 [β = 0.42 (95% CI 0.33, 0.51), p = 1.6 × 10⁻¹⁹] and rs2231142 [β = 0.24 (95% CI 0.15, 0.33), p = 2.3 × 10⁻⁷] were positively associated with increased uric acid levels (Table 3).
To further evaluate whether rs11722228 and rs3775948 are independent, we analyzed the association between the serum UA and rs3775948 conditioned by rs11722228. The effect of rs3775948 in the HWCS and the replication groups decreased slightly after conditioning, but remained significant, compatible with an independent effect from these SNPs (Table 3). A meta-analysis in all samples indicated that rs3775948, rs1014290, rs11722228 and rs2231142 were associated with the UA levels, independently of other possible confounding variables (Table 3).
In an attempt to replicate the remaining SNPs identified in the discovery sample (Supplementary Table S4), we searched for those children and adults included in a previous study who were genotyped using the Multi-Ethnic Genotyping Array (MEGA, Illumina, San Diego, CA, USA) [24]. Of the ~13 top suggestive associations (excluding the SLC2A9 gene) that met the genome-wide suggestive association threshold of p < 1.0 × 10⁻⁵, four genotyped SNPs and five proxies were available for a replication analysis. In the replication samples (CCS-adult and CCS-children) no statistically significant associations were observed (Supplementary Table S5).
Additionally, under the additive model, we observed statistically significant associations between hyperuricemia and the ABCG2 SNPs and SLC2A9 genes (Supplementary Table S6). A sensitivity analysis was performed for the association between SNPs and hyperuricemia, excluding individuals >70 years, and the results were similar; therefore we decided to maintain these individuals (data not shown). Interestingly, the odds ratio for rs11722228 in children was slightly higher than among the HWCS participants (2.50 versus 1.71, respectively).
The genetic risk score (GRS), based on the rs11722228 and rs2231142 genotypes, showed that the prevalence and odds for hyperuricemia increased with the number of risk alleles (p < 0.0001) (Figure 2A,B).
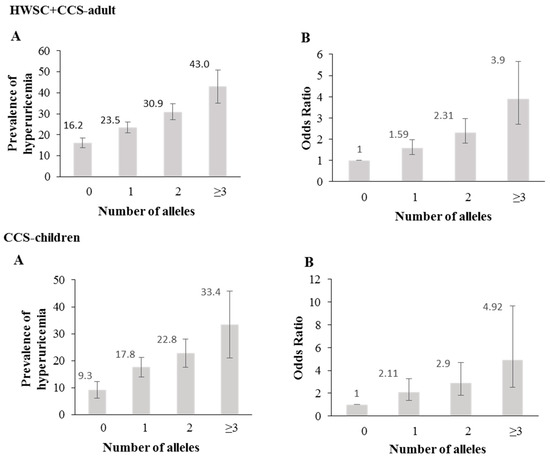
Figure 2.
Association between a genetic risk score (GRS) and hyperuricemia. (A) Prevalence of hyperuricemia across the genetic risk score (rs11722228 + rs2231142) (B) Odds ratio of hyperuricemia for each genetic risk score (rs11722228 + rs2231142). The lines indicate 95% confidence intervals.
Among the adults from both samples and the children, the UA concentrations were modified by the rs11722228 and rs2231142 genotypes following an additive effect (Supplementary Figures S3–5, p value <0.001). However, no significant differences were observed in the glucose levels, triglycerides, BMI, and metabolic syndrome. Additionally, we did not observe statistically significant interactions between rs11722228 and rs2231142 regarding the previously mentioned variables.
In the HWSC sample, there was no statistically significant association between the genetic variants of SLC2A9 and the CHD risk, after adjusting for possible confounding variables (age, sex, uric acid levels, consumption of anti-inflammatory drugs and diuretics, creatinine concentrations and menopause) (Supplementary Table S7). We observed an association between rs2231142 and the CHD risk under the additive model, but no co-dominant model. The results of the diet-genotype interaction analyses suggest independent effects (data not shown).
4. Discussion
This study examined the risk factors for hyperuricemia in a cohort with a high proportion of obesity and metabolic syndrome and in two obesity case-control studies. The prevalence of hyperuricemia in these groups was similar to other studies with metabolically compromised subjects [5,39,40,41]. A previous study of hypertensive Europeans reported a lower prevalence of hyperuricemia (17%) [5], in contrast with our results and those of another study in a European population that also observed a higher prevalence of hyperuricemia (29% and 25%, respectively) [40]. This could be due to racial or ethnic differences, age, or other factors involved in the development of hypertension. The BMI, waist circumference and body fat proportion were also associated with hyperuricemia in our study, suggesting that these factors may be contributing to the high prevalence of hyperuricemia observed in the Mexican population.
As expected, the BMI, waist circumference and body fat proportion were associated with hyperuricemia [42]. Although these are established risk factors for hyperuricemia, racial/ethnic differences have been observed in the association between the adiposity measures and UA levels [43]; therefore, their assessment in diverse populations is important. The VAI has been suggested as a better indicator for hyperuricemia risk than the BMI and waist circumference. Dong et al. observed that individuals in the highest VAI quartile had an odds ratio of 5.93 (95% CI 5.79–8.29) for hyperuricemia compared to those in the lowest quartile, although sex-specific effects were not reported [44]. The results in our study have the same direction as previous reports; however, a larger effect was observed in children and adult women from the case-control study. Additionally, the well-known association between hyperuricemia and metabolic syndrome was also observed [39,45,46,47,48] in this study, particularly among girls and adult women from the case-control study. However, it is important to note that these women are younger and have a different menopausal status, compared to the older female participants from the HWCS. Studies that have evaluated the association between hyperuricemia and metabolic syndrome by hormonal status have had conflicting results, with some reporting similar odds in both groups, [49,50] while others found a stronger relationship in premenopausal women [51]. These studies differ from ours in terms of the age range and mean BMI of the participants. Determining the effect of age or menopause on the relationship between hyperuricemia and metabolic syndrome in larger studies could help to identify high risk groups.
The Mexican population is one of the highest consumers of soft drinks, and the association between soft drink consumption and hyperuricemia is known [9,39]. A positive association between sweetened beverages and hyperuricemia, after adjusting for total calorie intake, was reported from data obtained as part of the 2004–2006 assessment of the HWCS [9]. This smaller study focused on soda intake, and the model included calorie intake, but the association with hyperuricemia was only observed among females, which could be due to the smaller sample size of males. A mechanism for this association has been proposed, according to which the phosphorylation of fructose by fructokinase, whose regulation is looser than that of hexokinase, depletes intracellular ATP, pushing UA synthesis [52]. It is likely that reducing soda consumption could be an effective public health strategy to reduce the high rates of hyperuricemia in Mexico.
Regarding genetic factors, the variants identified through a pilot GWAS proved consistent in the wider HWCS, CCS-adults and CCS-children. These were located in SLC2A9 and ABCG2, two loci widely reported for their association with UA in several populations [18,19,53]. Three SLC2A9 SNPs were selected for replication, two of these in LD. Both the LD between rs11722228 and rs3775948 (the third evaluated variant), as well as the conditional analysis, suggest that the effect of these SNPs on UA is independent. This extends the evidence for more than one signal in this locus [54], although the largest UA GWAS, mainly of European subjects, reports a single signal [15]. The evidence for heterogeneity in the rs11722228 meta-analysis suggests that the effect of this SNP is larger in children. There are few serum UA genetic association studies in children; however, separate publications from the same cohort using a similar methodology are consistent, with a stronger effect of SLC2A9 in children, at least for some SNPs [18,55]. The only UA GWAS that compares children and adults directly also found a larger genetic effect in children, although it did not reach a statistical significance [22]. Interestingly, early studies that evaluated the sex differences in the effect of SLC2A9 on UA found evidence for interaction in some variants but not in others, although the allele frequency could account for this [56]. Our results support that allelic heterogeneity in SLC2A9 entails heterogeneity for the age interaction. Similarly, the interaction of fructose consumption and the effect of the variants in SLC2A9 on serum UA have been shown to differ by race/ethnicity [57]. Furthermore, inconsistent gene by diet interaction results were found in separate studies performed in Europeans and African Americans [58,59]. Dietary factors that modulated the association included legumes, red meat (women only) and vitamin C (men only) [59]. Additionally, Batt et al. observed that the C allele of rs11942223 (SLC2A9 gene) was associated with lower levels of uric acid and risk of gout; however, upon exposure to the consumption of soft drinks, individuals carrying the C allele had a higher risk of gout (p interaction = 0.01) [60]. It is important to note that although we do not find interaction in our study, it cannot be ruled out that other genetic variants are interacting with diet. Unraveling population vs. variant specific sex and nutritional interactions in SLC2A9 could contribute to the understanding of how this gene is regulated and how it affects the serum UA. On the other hand, sex interaction with ABCG2’s missense variant rs2231142 has been reported in several populations, including Mexicans [15,22]. Allelic heterogeneity is an unlikely explanation for ABCG2, but it is possible that we did not observe a sex by genotype interaction with the SLC2A9 and ABCG2 genes because of the large proportion of postmenopausal women in this study [61].
Comparisons of the effect sizes of the association studies for the serum UA in different populations are of great interest. The present study replicated two previously reported loci of SLC2A9 and ABCG2 associated with serum UA levels. We compared the results of the two SNPs associated with elevated serum UA concentrations from the present study with those in Chinese, Japanese and Europeans populations. The effect sizes of these loci showed a consistent direction across the populations. For rs11722228 in SLC2A9, our study showed β = 0.355, Chinese β = 0.028 [62], Japanese β = 0.164 [53] and European β = 0.167 [63], and for SNP rs2231142 in ABCG2, our study showed β = 0.231, Chinese β = 0.046 [62], Japanese β = 0.121 [53] and European β = 0.173 [63]. It is noteworthy that the observed effect is stronger in the Mexican population.
Of the nine top suggestive associations that were available for a replication analysis, we did not observe statistically significant associations in the available replication samples. To our knowledge, these SNPs are located in genes that have not been previously associated with SUA levels or hyperuricemia, in other populations. Additional studies are required to understand the role of these genes in SUA levels in the Mexican population. Further confirmation studies are needed in other populations, to determine the main associated variants. These results could also serve as a reference and may be informative for future studies in Mexican populations.
In the HWSC sample, the glucose levels and type 2 diabetes were significantly associated with hyperuricemia in women. These results are similar to those reported by Kim et al. [45], and this could be related to our sampling strategy or to a stronger metabolic effect of UA among women, which has been previously suggested [64]. Although, the affinity of GLUT9, the gene encoded by SLC2A9, is mainly towards UA, it may also transport simple carbohydrates. We evaluated whether SNPs had an effect on glucose concentrations, as consistent with GWAS for glucose, but we did not observe any statistically significant associations [65,66].
No statistically significant gene-diet interactions were observed in the HWSC sample, which is likely because the dietary intake was very similar between the genotypes. Our results are similar to a previous study conducted with individuals of European descent who evaluated the interaction of the diet and rs1014290 on UA concentrations (p > 0.05) [58]. However, a longitudinal study in the African-American population observed an interaction between a genetic risk score of 15 SNPs and diet on AU concentrations [59].
Hyperuricemia is a risk factor for cardiovascular disease [2,4,67]; however, the findings of other studies are inconsistent [22], and in our study with data from the HWSC, we only observed an association among women. A meta-analysis reported a more pronounced increased risk for CHD mortality in women [67]. On the other hand, no association was observed between the genetic variants of SLC2A9 and the CHD risk; which may be due to the sample size within the strata and because the SNPs account for very little variability of UA. These results are similar to a previous study in the Asian population and in individuals of European ancestry [15,68]. We observed an association with ABCG2, but our results differ from a previous study in Mexican individuals; this could be due to variations in the study design and unmeasured confounders, so it is important to confirm these finding in future studies [22].
Although we observed statistically significant associations, our study has some potential limitations. First, it is a cross-sectional study that does not necessarily imply causality, although it is clear that the genetics of each individual can influence the uric acid concentrations. A second important issue is the power of the GWAS and the interaction analyses. Power is very low for both and is clearly limited to detecting associations of a greater number of genetic variants with a small effect size and/or a low minor allele frequency; this is the most likely reason we were not able to replicate the signals previously associated with hyperuricemia and serum uric acid levels in other populations. However, in the present study we identified two previously reported loci (SLC2A9 and ABCG2) associated with the serum levels of UA and hyperuricemia. This suggests that our study was able to identify significant loci that are associated with serum UA levels. Third, the discovery sample only represents postmenopausal women; however we found that the prevalence of hyperuricemia in postmenopausal women was similar to the prevalence in men (34% and 30%, respectively). Fourth, in performing gene-diet interaction analyses, although diet was assessed individually and as a whole by the construction of dietary patterns, no statistically significant associations were observed because of the small sample sizes of each stratum. Additionally, the measurement error derived from the food frequency questionnaire could perhaps mask possible interactions.
The strengths of our study include associations that were adjusted for variables accounted for in previous studies (e.g., age, sex, body fat proportion), which allow for consistency and comparability in the results. However, this did not have an effect on the estimators of this study, which is perhaps due to the fact that the variables were similarly distributed among the genotypes. The GWAS analyses in the discovery sample (22% of the total of the sample) were adjusted for ancestry to reduce the type 2 error that could be caused by the stratification of the population.
5. Conclusions
In conclusion, this study confirms the association between the SLC2A9 and ABCG2 genes and hyperuricemia. Our findings suggest the need for additional genetic studies in the Mexican population to identify genetic variants that could be used to develop genetic risk markers to identify individuals with a higher predisposition for hyperuricemia. Additional studies are needed to evaluate the gene-environment interactions associated with hyperuricemia, which could help to alleviate the burden of hyperuricemia and its complications in Mexico.
Supplementary Materials
The following are available online at https://www.mdpi.com/2072-6643/11/6/1336/s1. Figure S1: Flowchart of study population. Table S1: Characteristics of participants in the Health Worker Cohort Study, Table S2: Association of metabolic syndrome, its components, diet and smoking with hyperuricemia, Table S3: Association between hyperuricemia and coronary heart disease from HWSC, Figure S2: LocusZoom plot of the region associated with Serum Uric Acid on chromosome 4, after imputation in the discovery sample, Table S4: Top SNPs associated with serum Uric Acid in the discovery sample, Table S5: Replication analysis of the top SNPs associated with serum uric acid levels in the Mexican population, Table S6: Multivariate logistic regression for the relationship between polymorphism in the SLC2A9 and ABCG2 genes and hyperuricemia, Figure S3: Distribution of selected biochemical traits, body mass index and metabolic syndrome in the Health Worker Cohort Study by rs11722228, rs2231142 separate and combined genotypes, Figure S4: Distribution of selected biochemical traits, body mass index and metabolic syndrome in the Adult Case Control Study by rs11722228, rs2231142 separate and combined genotypes, Figure S5: Distribution of selected biochemical traits, body mass index percentile and metabolic syndrome in the Children Case Control Study by rs11722228, rs2231142 separate and combined genotypes, Table S7: Multivariate logistic regression for the relationship between polymorphisms in the SLC2A9 gene and Coronary Heart Disease (CHD) in HWSC.
Author Contributions
B.R.-P., L.M.-K. and R.V.-C. designed, coordinated the study and wrote the manuscript, attending the comments from authors. M.M.M.-A., A.C.-M. and E.G.R.-S. performed the genotyping and preliminary analyzes. M.V.-C., J.C.F.-L., and S.R.-H. assisted with the GWAs data analysis and imputation. M.Q., P.R.-P., E.D.-G., Y.N.F. and J.S. were responsible for the data collection of the HWCS sample. L.M.-K., H.V.-R., M.T.V.-M. and S.C.-Q. contributed with the data collection of the Adults and Children of the case-control study (replication sample). All authors read and approved the final content of the manuscript.
Funding
This work was supported by a grant from the Consejo Nacional de Ciencia y Tecnología (CONACyT): grant INFR-2016-01-270405 and partially supported by the Instituto Nacional de Medicina Genomica project 266-17/2016/I. Y. N. F. was supported by NIH/NCI K07CA197179.
Acknowledgments
Berenice Rivera Paredez is a student from the Programa de Doctorado en Ciencias en Epidemiología, Instituto Nacional de Salud Pública (INSP), and received fellowship from the Consejo Nacional de Ciencia y Tecnología (CONACYT). The authors would like to acknowledge the study participants for their participation and the staff at Unidad de Investigación Epidemiológica y en Servicios de Salud, IMSS, Cuernavaca, Morelos. We also acknowledge the Technical Assistance provided for Hugo Villamil-Ramírez (Facultad de Química-UNAM) and Jeny Flores Morales (Instituto Nacional de Medicina Genómica, INMEGEN).
Conflicts of Interest
The authors declare that they have no conflicts of interest.
References
- Brook, R.A.; Forsythe, A.; Smeeding, J.E.; Lawrence-Edwards, N. Chronic gout: Epidemiology, disease progression, treatment and disease burden. Curr. Med. Res. Opin. 2010, 26, 2813–2821. [Google Scholar] [CrossRef] [PubMed]
- Kei, A.; Koutsouka, F.; Makri, A.; Elisaf, M. Uric acid and cardiovascular risk: What genes can say. Int. J. Clin. Pract. 2018, 72. [Google Scholar] [CrossRef] [PubMed]
- Johnson, R.J.; Nakagawa, T.; Sanchez-Lozada, L.G.; Shafiu, M.; Sundaram, S.; Le, M.; Ishimoto, T.; Sautin, Y.Y.; Lanaspa, M.A. Sugar, uric acid, and the etiology of diabetes and obesity. Diabetes 2013, 62, 3307–3315. [Google Scholar] [CrossRef] [PubMed]
- Soltani, Z.; Rasheed, K.; Kapusta, D.R.; Reisin, E. Potential role of uric acid in metabolic syndrome, hypertension, kidney injury, and cardiovascular diseases: Is it time for reappraisal? Curr. Hypertens. Rep. 2013, 15, 175–181. [Google Scholar] [CrossRef]
- Maloberti, A.; Maggioni, S.; Occhi, L.; Triglione, N.; Panzeri, F.; Nava, S.; Signorini, S.; Falbo, R.; Casati, M.; Grassi, G.; et al. Sex-related relationships between uric acid and target organ damage in hypertension. J. Clin. Hypertens. 2018, 20, 193–200. [Google Scholar] [CrossRef] [PubMed]
- Zhu, Y.; Pandya, B.J.; Choi, H.K. Prevalence of gout and hyperuricemia in the US general population: The National Health and Nutrition Examination Survey 2007–2008. Arthritis Rheum. 2011, 63, 3136–3141. [Google Scholar] [CrossRef]
- You, L.; Liu, A.; Wuyun, G.; Wu, H.; Wang, P. Prevalence of hyperuricemia and the relationship between serum uric acid and metabolic syndrome in the Asian Mongolian area. J. Atheroscler. Thromb. 2014, 21, 355–365. [Google Scholar] [CrossRef]
- Nan, H.; Qiao, Q.; Dong, Y.; Gao, W.; Tang, B.; Qian, R.; Tuomilehto, J. The prevalence of hyperuricemia in a population of the coastal city of Qingdao, China. J. Rheumatol. 2006, 33, 1346–1350. [Google Scholar]
- Meneses-Leon, J.; Denova-Gutiérrez, E.; Castañón-Robles, S.; Granados-García, V.; Talavera, J.O.; Rivera-Paredez, B.; Huitrón-Bravo, G.G.; Cervantes-Rodríguez, M.; Quiterio-Trenado, M.; Rudolph, S.E.; et al. Sweetened beverage consumption and the risk of hyperuricemia in Mexican adults: A cross-sectional study. BMC Public Health 2014, 14, 445. [Google Scholar] [CrossRef]
- Merriman, T. Genomic Influences on Hyperuricemia and Gout. Rheum. Dis. Clin. N. Am. 2017, 43, 389–399. [Google Scholar] [CrossRef]
- Choi, H.K.; Mount, D.B.; Reginato, A.M.; American College of Physicians; American Physiological Society. Pathogenesis of gout. Ann. Intern. Med. 2005, 143, 499–516. [Google Scholar] [CrossRef] [PubMed]
- De Oliveira, E.P.; Burini, R.C. High plasma uric acid concentration: Causes and consequences. Diabetol. Metab. Syndr. 2012, 4, 12. [Google Scholar] [CrossRef] [PubMed]
- Nath, S.D.; Voruganti, V.S.; Arar, N.H.; Thameem, F.; Lopez-Alvarenga, J.C.; Bauer, R.; Blangero, J.; MacCluer, J.W.; Comuzzie, A.G.; Abboud, H.E. Genome scan for determinants of serum uric acid variability. J. Am. Soc. Nephrol. 2007, 18, 3156–3163. [Google Scholar] [CrossRef] [PubMed]
- Yang, Q.; Guo, C.Y.; Cupples, L.A.; Levy, D.; Wilson, P.W.; Fox, C.S. Genome-wide search for genes affecting serum uric acid levels: The Framingham Heart Study. Metabolism 2005, 54, 1435–1441. [Google Scholar] [CrossRef] [PubMed]
- Köttgen, A.; Albrecht, E.; Teumer, A.; Vitart, V.; Krumsiek, J.; Hundertmark, C.; Pistis, G.; Ruggiero, D.; O’Seaghdha, C.M.; Haller, T.; et al. Genome-wide association analyses identify 18 new loci associated with serum urate concentrations. Nat. Genet. 2013, 45, 145–154. [Google Scholar] [CrossRef] [PubMed]
- Li, W.D.; Jiao, H.; Wang, K.; Zhang, C.K.; Glessner, J.T.; de Grant, S.F.; Zhao, H.; Hakonarson, H.; Arlen, P.R. A genome wide association study of plasma uric acid levels in obese cases and never-overweight controls. Obesity 2013, 21, E490–E494. [Google Scholar] [CrossRef]
- Dehghan, A.; Köttgen, A.; Yang, Q.; Hwang, S.J.; Kao, W.L.; Rivadeneira, F.; Boerwinkle, E.; Levy, D.; Hofman, A.; Astor, B.C.; et al. Association of three genetic loci with uric acid concentration and risk of gout: A genome-wide association study. Lancet 2008, 372, 1953–1961. [Google Scholar] [CrossRef]
- Voruganti, V.S.; Kent, J.W.; Debnath, S.; Cole, S.A.; Haack, K.; Göring, H.H.; Carless, M.A.; Curran, J.E.; Johnson, M.P.; Almasy, L.; et al. Genome-wide association analysis confirms and extends the association of SLC2A9 with serum uric acid levels to Mexican Americans. Front. Genet. 2013, 4, 279. [Google Scholar] [CrossRef]
- Giri, A.K.; Banerjee, P.; Chakraborty, S.; Kauser, Y.; Undru, A.; Roy, S.; Parekatt, V.; Ghosh, S.; Tandon, N.; Bharadwaj, D. Genome wide association study of uric acid in Indian population and interaction of identified variants with Type 2 diabetes. Sci. Rep. 2016, 6, 21440. [Google Scholar] [CrossRef]
- Matsuo, H.; Yamamoto, K.; Nakaoka, H.; Nakayama, A.; Sakiyama, M.; Chiba, T.; Takahashi, A.; Nakamura, T.; Nakashima, H.; Takada, Y.; et al. Genome-wide association study of clinically defined gout identifies multiple risk loci and its association with clinical subtypes. Ann. Rheum Dis. 2016, 75, 652–659. [Google Scholar] [CrossRef]
- Li, Z.; Zhou, Z.; Hou, X.; Lu, D.; Yuan, X.; Lu, J.; Wang, C.; Han, L.; Cui, L.; Liu, Z.; et al. Replication of Gout/Urate Concentrations GWAS Susceptibility Loci Associated with Gout in a Han Chinese Population. Sci. Rep. 2017, 7, 4094. [Google Scholar] [CrossRef] [PubMed]
- Macias-Kauffer, L.R.; Villamil-Ramírez, H.; León-Mimila, P.; Jacobo-Albavera, L.; Posadas-Romero, C.; Posadas-Sánchez, R.; López-Contreras, B.E.; Morán-Ramos, S.; Romero-Hidalgo, S.; Acuña-Alonzo, V.; et al. Genetic contributors to serum uric acid levels in Mexicans and their effect on premature coronary artery disease. Int. J. Cardiol. 2019, 279, 168–173. [Google Scholar] [CrossRef] [PubMed]
- Denova-Gutiérrez, E.; Flores, Y.N.; Gallegos-Carrillo, K.; Ramírez-Palacios, P.; Rivera-Paredez, B.; Muñoz-Aguirre, P.; Velázquez-Cruz, R.; Torres-Ibarra, L.; Meneses-León, J.; Méndez-Hernández, P.; et al. Health workers cohort study: Methods and study design. Salud Publica Mex. 2016, 58, 708–716. [Google Scholar] [CrossRef] [PubMed]
- León-Mimila, P.; Villamil-Ramírez, H.; Villalobos-Comparán, M.; Villarreal-Molina, T.; Romero-Hidalgo, S.; López-Contreras, B.; Gutiérrez-Vidal, R.; Vega-Badillo, J.; Jacobo-Albavera, L.; Posadas-Romeros, C.; et al. Contribution of common genetic variants to obesity and obesity-related traits in Mexican children and adults. PLoS ONE 2013, 8, e70640. [Google Scholar] [CrossRef] [PubMed]
- Kubota, M.; Nagai, A.; Tang, L.; Tokuda, M. Investigation on hyperuricemia in children with obesity or various pediatric disorders. Nucleosides Nucleotides Nucleic Acids 2011, 30, 1051–1059. [Google Scholar] [CrossRef]
- Katon, J.G.; Flores, Y.N.; Salmerón, J. Sexual maturation and metabolic profile among adolescents and children of the Health Worker Cohort Study in Mexico. Salud Publica Mex. 2009, 51, 219–226. [Google Scholar] [CrossRef]
- Zimmet, P.; Alberti, K.G.M.; Serrano-Ríos, M. A new International Diabetes Federation worldwide definition of the metabolic syndrome: The rationale and the results. Rev. Esp. Cardiol. 2005, 58, 1371–1376. [Google Scholar] [CrossRef]
- International Diabetes Federation. Available online: https://www.idf.org/e-library/consensus-statements/61-idf-consensus-definition-of-metabolic-syndrome-in-children-and-adolescents (accessed on 3 February 2019).
- Amato, M.C.; Giordano, C.; Galia, M.; Criscimanna, A.; Vitabile, S.; Midiri, M.; Galluzzo, A.; AlkaMeSy Study Group. Visceral Adiposity index: A reliable indicator of visceral fat function associated with cardiometabolic risk. Diabetes Care 2010, 33, 920–922. [Google Scholar] [CrossRef]
- D’Agostino, R.B.; Grundy, S.; Sullivan, L.M.; Wilson, P.; CHD Risk Prediction Group. Validation of the Framingham coronary heart disease prediction scores: Results of a multiple ethnic groups investigation. JAMA 2001, 286, 180–187. [Google Scholar] [CrossRef]
- Villalobos-Comparán, M.; Jiménez-Ortega, R.F.; Estrada, K.; Parra-Torres, A.Y.; González-Mercado, A.; Patiño, N.; Castillejos-López, M.; Quiterio, M.; Fernandez-López, J.C.; Ibarra, B.; et al. A Pilot Genome-Wide Association Study in Postmenopausal Mexican-Mestizo Women Implicates the RMND1/CCDC170 Locus Is Associated with Bone Mineral Density. Int. J. Genom. 2017, 2017, 5831020. [Google Scholar] [CrossRef]
- Das, S.; Forer, L.; Schönherr, S.; Sidore, C.; Locke, A.E.; Kwong, A.; Vrieze, S.; Chew, E.Y.; Levy, S.; McGue, M.; et al. Next-generation genotype imputation service and methods. Nat. Genet. 2016, 48, 1284–1287. [Google Scholar] [CrossRef] [PubMed]
- McCarthy, S.; Das, S.; Kretzschmar, W.; Delaneau, O.; Wood, A.R.; Teumer, A.; Kang, H.M.; Fuchsberger, C.; Danecek, P.; Sharp, K. A reference panel of 64,976 haplotypes for genotype imputation. Nat. Genet. 2016, 48, 1279–1283. [Google Scholar] [CrossRef] [PubMed]
- Loh, P.R.; Danecek, P.; Palamara, P.F.; Fuchsberger, C.; Reshef, Y.A.; Finucane, H.K.; Schoenherr, S.; Forer, L.; McCarthy, S.; Abecasis, G.R.; et al. Reference-based phasing using the Haplotype Reference Consortium panel. Nat. Genet. 2016, 48, 1443–1448. [Google Scholar] [CrossRef] [PubMed]
- EPACTS: Efficient and Parallelizable Association Container Toolbox. Available online: http://genome.sph.umich.edu/wiki/EPACTS (accessed on 3 February 2019).
- Dudbridge, F. Power and predictive accuracy of polygenic risk scores. PLoS Genet. 2013, 9, e1003348. [Google Scholar] [CrossRef]
- StataCorp. Stata Stastical Software: Release 9; StataCorp LP: College Station, TX, USA, 2005. [Google Scholar]
- Barrett, J.C.; Fry, B.; Maller, J.; Daly, M.J. Haploview: Analysis and visualization of LD and haplotype maps. Bioinformatics 2005, 21, 263–265. [Google Scholar] [CrossRef] [PubMed]
- López-Molina, R.; Parra-Cabrera, S.; López-Ridaura, R.; González-Villalpando, M.E.; Ferrannini, E.; González-Villalpando, C. Sweetened beverages intake, hyperuricemia and metabolic syndrome: The Mexico City Diabetes Study. Salud Publica Mex. 2013, 55, 557–563. [Google Scholar] [CrossRef] [PubMed]
- Redon, P.; Maloberti, A.; Facchetti, R.; Redon, J.; Lurbe, E.; Bombelli, M.; Mancia, G.; Grassi, G. Gender-related differences in serum uric acid in treated hypertensive patients from central and east European countries: Findings from the Blood Pressure control rate and CArdiovascular Risk profilE study. J. Hypertens. 2019, 37, 380–388. [Google Scholar] [CrossRef]
- Cicero, A.F.G.; Fogacci, F.; Giovannini, M.; Grandi, E.; D’Addato, S.; Borghi, C.; Brisighella Heart Study Group. Interaction between low-density lipoprotein-cholesterolaemia, serum uric level and incident hypertension: Data from the Brisighella Heart Study. J. Hypertens. 2019, 37, 728–731. [Google Scholar] [CrossRef]
- Matsuura, F.; Yamashita, S.; Nakamura, T.; Nishida, M.; Nozaki, S.; Funahashi, T.; Matsuzawa, Y. Effect of visceral fat accumulation on uric acid metabolism in male obese subjects: Visceral fat obesity is linked more closely to overproduction of uric acid than subcutaneous fat obesity. Metabolism 1998, 47, 929–933. [Google Scholar] [CrossRef]
- Dong, B.; Arnold, L.W.; Peng, Y.; Wang, Z. Ethnic differences in cardiometabolic risk among adolescents across the waist–height ratio spectrum: National Health and Nutrition Examination Surveys (NHANES). Int. J. Cardiol. 2016, 222, 622–628. [Google Scholar] [CrossRef]
- Dong, H.; Xu, Y.; Zhang, X.; Tian, S. Visceral adiposity index is strongly associated with hyperuricemia independently of metabolic health and obesity phenotypes. Sci. Rep. 2017, 7, 8822. [Google Scholar] [CrossRef] [PubMed]
- Kim, Y.; Kang, J.; Kim, G.T. Prevalence of hyperuricemia and its associated factors in the general Korean population: An analysis of a population-based nationally representative sample. Clin. Rheumatol. 2018, 37, 2529–2538. [Google Scholar] [CrossRef] [PubMed]
- Perez, E.S.; Medina, M.A.G.; Lomeli, M.L.; González, V.T.; Pérez, J.Z.V.; Lavalle-González, F.J.; Imrhan, V.; Juma, S.; Vijayagopal, P.; Boonme, K.; et al. Association between serum uric acid and metabolic syndrome components in prepubertal obese children (Tanner Stage I) from Nuevo León, Mexico—A preliminary study. BMC Obes. 2017, 4, 25. [Google Scholar] [CrossRef] [PubMed]
- Rubio-Guerra, A.F.; Morales-López, H.; Garro-Almendaro, A.K.; Vargas-Ayala, G.; Durán-Salgado, M.B.; Huerta-Ramírez, S.; Lozano-Nuevo, J.J. Circulating Levels of Uric Acid and Risk for Metabolic Syndrome. Curr. Diabetes Rev. 2017, 13, 87–90. [Google Scholar] [CrossRef] [PubMed]
- Cicero, A.F.G.; Fogacci, F.; Giovannini, M.; Grandi, E.; Rosticci, M.; D’Addato, S.; Borghi, C. Serum uric acid predicts incident metabolic syndrome in the elderly in an analysis of the Brisighella Heart Study. Sci. Rep. 2018, 8, 11529. [Google Scholar] [CrossRef]
- He, S.J.; Chan, C.; Xie, Z.D.; Shi, D.; Hu, X.B.; Li, H.Y.; Wang, D.; Wang, M.Z.; Bai, Y.N. The relationship between serum uric acid and metabolic syndrome in premenopausal and postmenopausal women in the Jinchang Cohort. Gynecol. Endocrinol. 2017, 33, 141–144. [Google Scholar] [CrossRef] [PubMed]
- Lee, H.J.; Park, H.T.; Cho, G.J.; Yi, K.W.; Ahn, K.H.; Shin, J.H.; Kim, T.; Kim, Y.T.; Hur, J.Y.; Kim, S.H. Relationship between uric acid and metabolic syndrome according to menopausal status. Gynecol. Endocrinol. 2011, 27, 406–411. [Google Scholar] [CrossRef]
- Li, Y.; Chen, S.; Shao, X.; Guo, J.; Liu, X.; Liu, A.; Zhang, Y.; Wang, H.; Li, B.; Deng, K.; et al. Association of Uric Acid with Metabolic Syndrome in Men, Premenopausal Women and Postmenopausal Women. Int. J. Environ. Res. Public Health 2014, 11, 2899–2910. [Google Scholar] [CrossRef]
- Lanaspa, M.A.; Tapia, E.; Soto, V.; Sautin, Y.; Sánchez-Lozada, L.G. Uric Acid and Fructose: Potential Biological Mechanisms. Semin. Nephrol. 2011, 31, 426–432. [Google Scholar] [CrossRef]
- Kolz, M.; Johnson, T.; Sanna, S.; Teumer, A.; Vitart, V.; Perola, M.; Mangino, M.; Albrecht, E.; Wallace, C.; Farrall, M.; et al. Meta-Analysis of 28,141 Individuals Identifies Common Variants within Five New Loci That Influence Uric Acid Concentrations. PLoS Genet. 2009, 5, e1000504. [Google Scholar] [CrossRef]
- Wei, W.H.; Guo, Y.; Kindt, A.S.; Merriman, T.R.; Semple, C.A.; Wang, K.; Haley, C.S. Abundant local interactions in the 4p16.1 region suggest functional mechanisms underlying SLC2A9 associations with human serum uric acid. Hum. Mol. Genet. 2014, 23, 5061–5068. [Google Scholar] [CrossRef] [PubMed]
- Voruganti, V.S.; Laston, S.; Haack, K.; Mehta, N.R.; Cole, S.A.; Butte, N.F.; Comuzzie, A.G. Serum uric acid concentrations and SLC2A9 genetic variation in Hispanic children: The Viva La Familia Study. Am. J. Clin. Nutr. 2015, 101, 725–732. [Google Scholar] [CrossRef] [PubMed]
- Brandstätter, A.; Kiechl, S.; Kollerits, B.; Hunt, S.C.; Heid, I.M.; Coassin, S.; Willeit, J.; Adams, T.D.; Illig, T.; Hopkins, P.N.; et al. Sex-specific association of the putative fructose transporter SLC2A9 variants with uric acid levels is modified by BMI. Diabetes Care 2008, 31, 1662–1667. [Google Scholar] [CrossRef] [PubMed]
- Dalbeth, N.; House, M.E.; Gamble, G.D.; Horne, A.; Pool, B.; Purvis, L.; Stewart, A.; Merriman, M.; Cadzow, M.; Phipps-Green, A.; et al. Population-specific influence of SLC2A9 genotype on the acute hyperuricaemic response to a fructose load. Ann. Rheum. Dis. 2013, 72, 1868–1873. [Google Scholar] [CrossRef] [PubMed]
- Jeroncić, I.; Mulić, R.; Klišmanić, Z.; Rudan, D.; Boban, M.; Zgaga, L. Interactions between Genetic Variants in Glucose Transporter Type 9 (SLC2A9) and Dietary Habits in Serum Uric Acid Regulation. Croat. Med. J. 2010, 5, 40–47. [Google Scholar] [CrossRef] [PubMed]
- Beydoun, M.A.; Canas, J.A.; Fanelli-Kuczmarski, M.T.; Tajuddin, S.M.; Evans, M.K.; Zonderman, A.B. Genetic risk scores, sex and dietary factors interact to alter serum uric acid trajectory among African-American urban adults. Br. J. Nutr. 2017, 117, 686–697. [Google Scholar] [CrossRef] [PubMed]
- Batt, C.; Phipps-Green, A.J.; Black, M.A.; Cadzow, M.; Merriman, M.E.; Topless, R.; Gow, P.; Harrison, A.; Highton, J.; Jones, P.; et al. Sugar-sweetened beverage consumption: A risk factor for prevalent gout with SLC2A9 genotype-specific effects on serum urate and risk of gout. Ann. Rheum. Dis. 2014, 73, 2101–2106. [Google Scholar] [CrossRef] [PubMed]
- Zhang, L.; Spencer, K.L.; Voruganti, V.S.; Jorgensen, N.W.; Fornage, M.; Best, L.G.; Brown-Gentry, K.D.; Cole, S.A.; Crawford, D.C.; Deelman, E.; et al. Association of functional polymorphism rs2231142 (Q141K) in the ABCG2 gene with serum uric acid and gout in 4 US populations: The PAGE Study. Am. J. Epidemiol. 2013, 177, 923–932. [Google Scholar] [CrossRef]
- Yang, B.; Mo, Z.; Wu, C.; Yang, H.; Yang, X.; He, Y.; Gui, L.; Zhou, L.; Guo, H.; Zhang, X.; et al. A genome-wide association study identifies common variants influencing serum uric acid concentrations in a Chinese population. BMC Med. Genom. 2014, 7, 10. [Google Scholar] [CrossRef]
- Kamatani, Y.; Matsuda, K.; Okada, Y.; Kubo, M.; Hosono, N.; Daigo, Y.; Nakamura, Y.; Kamatani, N. Genome-wide association study of hematological and biochemical traits in a Japanese population. Nat. Genet. 2010, 42, 210–215. [Google Scholar] [CrossRef]
- Sun, D.; Li, S.; Zhang, X.; Fernandez, C.; Chen, W.; Srinivasan, S.R.; Berenson, G.S. Uric Acid Is Associated with Metabolic Syndrome in Children and Adults in a Community: The Bogalusa Heart Study. PLoS ONE 2014, 9, e89696. [Google Scholar] [CrossRef] [PubMed]
- Dupuis, J.; Langenberg, C.; Prokopenko, I.; Saxena, R.; Soranzo, N.; Jackson, A.U.; Wheeler, E.; Glazer, N.L.; Bouatia-Naji, N.; Gloyn, A.L.; et al. New genetic loci implicated in fasting glucose homeostasis and their impact on type 2 diabetes risk. Nat. Genet. 2010, 42, 105–116. [Google Scholar] [CrossRef]
- SIGMA Type 2 Diabetes Consortium; Williams, A.L.; Jacobs, S.B.; Moreno-Macías, H.; Huerta-Chagoya, A.; Churchhouse, C.; Márquez-Luna, C.; García-Ortíz, H.; Gómez-Vázquez, M.J.; Burtt, N.P.; et al. Sequence variants in SLC16A11 are a common risk factor for type 2 diabetes in Mexico. Nature 2014, 506, 97–101. [Google Scholar] [CrossRef] [PubMed]
- Braga, F.; Pasqualetti, S.; Ferraro, S.; Panteghini, M. Hyperuricemia as risk factor for coronary heart disease incidence and mortality in the general population: A systematic review and meta-analysis. Clin. Chem. Lab. Med. 2016, 54, 7–15. [Google Scholar] [CrossRef]
- Han, X.; Gui, L.; Liu, B.; Wang, J.; Li, Y.; Dai, X.; Li, J.; Yang, B.; Qiu, G.; Feng, J.; et al. Associations of the uric acid related genetic variants in SLC2A9 and ABCG2 loci with coronary heart disease risk. BMC Genet. 2015, 16, 4. [Google Scholar] [CrossRef] [PubMed]


© 2019 by the authors. Licensee MDPI, Basel, Switzerland. This article is an open access article distributed under the terms and conditions of the Creative Commons Attribution (CC BY) license (http://creativecommons.org/licenses/by/4.0/).